Article

Predictive Validity, Diagnostic Accuracy and Test-Retest Reliability of the Strength of Urges to Drink (SUTD) Scale

1
Department of Behavioural Science and Health, University College London, London WC1E 7HB, UK
2
Department of Clinical, Educational and Health Psychology, University College London, London WC1E 7HB, UK
3
National Addiction Centre, Institute of Psychiatry, Psychology & Neuroscience, King’s College London, London SE5 8BB, UK
4
Institute of Health & Society, Newcastle University, Newcastle upon Tyne NE2 4AX, UK
*
Author to whom correspondence should be addressed.
Int. J. Environ. Res. Public Health 2019, 16(19), 3714; https://doi.org/10.3390/ijerph16193714
Submission received: 19 August 2019 / Revised: 22 September 2019 / Accepted: 27 September 2019 / Published: 2 October 2019
(This article belongs to the Section Health Behavior, Chronic Disease and Health Promotion)

Abstract

:
This study compared the 1-item Strength of Urges to Drink (SUTD) scale with the 10-item Alcohol Use Disorders Identification Test (AUDIT) on (i) test-retest reliability, (ii) predictive validity, and (iii) diagnostic accuracy. Data come from 2960 participants taking part in the Alcohol Toolkit Study (ATS), a monthly population survey of adults in England. The long-term test-retest reliability of the SUTD was ‘fair’, but lower than that for the AUDIT (Kappaweighted 0.24 versus 0.49). Individuals with “slight/moderate” urges to drink had higher odds of reporting an attempt to cut down relative to those not experiencing urges (adjusted odds ratios (AdjORs) 1.78 95% confidence interval (CI) 1.43–2.22 and 1.54 95% CI 1.20–1.96). Drinkers reporting “moderate/slight/strong” urges to drink had mean change in consumption scores which were 0.16 (95% CI −0.31 to −0.02), 0.40 (95% CI −0.56 to −0.24) and 0.37 (95% CI −0.69 to −0.05) units lower than those reporting no urges. For all outcomes, strong associations were found with AUDIT scores. The accuracy of the SUTD for discriminating between drinkers who did and did not reduce their consumption was ‘acceptable’, and similar to that for the AUDIT (ROCAUC 0.6). The AUDIT had better diagnostic accuracy in predicting change in alcohol consumption. The SUTD may be an efficient dynamic measure of urges to drink for population surveys and studies assessing the impact of alcohol-reduction interventions.

1. Introduction

Worldwide each year around 6 L on average of pure alcohol are consumed by every person aged 15 years or older [1]. A large variation exists in adult per capita consumption with the highest consumption levels found in the developed world. In England, around 17% (~9 million) of adults drink alcohol above recommended limits [2] and 6% (~1 million) of the population are classified as dependent i.e., they have a physical and/or mental dependency on alcohol which is associated with high levels of tolerance to its effects and withdrawal symptoms when absent [3]. Such consumption levels are associated with a number of non-communicable diseases, injury and alcohol attributable death each year [1].
The reliable measurement of the severity of alcohol dependence is important for several reasons. First, it can be helpful when deciding how much and what kind of support should be offered. Currently, less than 14% of dependent drinkers receive mental or emotional support [3,4]. Secondly, it is useful in epidemiological studies to be able to characterise the dependency of the population of drinkers. This may be for descriptive purposes or to allow comparisons between those who do and do not drink excessively.
The diagnosis of an alcohol use disorder has traditionally been based primarily on the findings of an interview using either the International Statistical Classification of Diseases and Related Health Problems (ICD-10) [5] or the Diagnostic and Statistical Manual of Mental Disorders (DSM-V) [6] as diagnostic instruments. Questionnaires have also been devised, with the most widely used screening tool known as the Alcohol Use Disorders Identification Test (AUDIT). The AUDIT measures harmful and hazardous drinking, and possible dependency. Whereas hazardous drinking is often defined as a quantity or pattern of alcohol use that places individuals at risk of adverse health events, harmful consumption is defined as alcohol intake which results in actual physical or psychological harm [7]. Since alcohol dependence is a construct which is hard to define in terms of any single measure, the AUDIT consists of 10 questions assessing frequency of drinking, average amount consumed, concerns from others, harm to self and others, inability to function without alcohol and alcohol-induced amnesia [8]. Although numerous studies have demonstrated this questionnaire’s reliability and validity across socio-economic groups and cultures [9,10,11,12,13], its use is somewhat limited by its length and complexity.
How best to characterise alcohol dependence is a continuing debate. Key features adopted by the ICD-10 include an inner drive or compulsion to consume alcohol, continued drinking despite harm and commonly a withdrawal state upon stopping drinking [14,15,16,17]. This conceptualisation of dependence raises the possibility of a simpler measure in terms of urges to drink, where urges can be seen as an emotional state that is characterised by the motivation to seek and use alcohol [18]. PRIME theory (which represents the motivation system consisting of plans, responses, impulses, motives and evaluations) provides a relevant framework [19]. According to PRIME theory, we act every moment in pursuit of what we most want or need. These wants and needs influence behaviour through momentary impulses and inhibitions, and can be felt as urges to perform the behaviour e.g., to drink. Strength of urges appear to be a useful measure of cigarette addiction, as are the related measures of craving and motivation to smoke [20,21]. Given evidence of a similar underlying biological pathway for the two behaviours, it is hypothesised that urges to drink could also be a valid measure of alcohol dependence [22]. Indeed, drugs which attenuate urges to drink have been associated with reduced consumption [23], while findings suggest that experiencing strong urges is related to consuming more alcohol and associated with use that is harmful and hazardous [24].
Several questionnaires are available that assess urges and cravings to drink. For example, the Alcohol Urges Questionnaire measures acute urges and comprises eight items pertaining to desire to drink, expectations of positive effects from drinking and inability to avoid alcohol [25]. The Alcohol Craving Questionnaire contains 47 items covering five domains: desire to drink, intention to drink, lack of control, anticipation of positive effects and expectancy of relief from withdrawal [26], while the Yale-Brown Obsessive Compulsive Scale for Heavy Drinking consists of 10 items with obsessionality and compulsive subscales [27]. A popular questionnaire known as the Severity of Alcohol Dependence Questionnaire (SADQ) [28] is a self-administered 20 item questionnaire with five subscales measuring dependency: Physical Withdrawal, Affective Withdrawal, Withdrawal Relief Drinking, Alcohol Consumption, and Rapidity of Reinstatement. Whilst these have been validated, many are not widely used in the alcohol arena, and some, including the AUDIT and SADQ, measure recent or past alcohol use and related feelings which may limit their use when looking at more chronic aspects of dependence which are transient [29]. There is a need for a simpler measure which captures the dynamic nature of urges to drink and is applicable to both dependent drinkers and those consuming alcohol at harmful levels. Drinking occurs on a continuum, and hence it is useful to be able to identify harmful drinkers who may be around the threshold for dependence and, therefore, tertiary preventive work can be used to help stop further escalation of problems.
Thus, this study aimed to evaluate psychometric properties of the strength of urges to drink on a single day, known as the Strength of Urges to Drink (SUTD) measure, among a population sample of high-risk drinkers. Such epidemiological data has several advantages over patient populations, including the fact that many individuals who are alcohol-dependent remain undiagnosed. Population-based studies may be able to pick some of these individuals up [30,31]. Comparisons will be made with the AUDIT, as it is the most widely used screening tool and can be self-completed.
More specifically, it aimed to assess the:
  • Test-retest reliability of the SUTD compared to the AUDIT.
  • Predictive validity of the SUTD compared to the AUDIT in relation to (a) reported attempts to reduce alcohol consumption between baseline and follow-up; (b) reported alcohol consumption at follow-up and (c) change in alcohol consumption between baseline and follow-up.
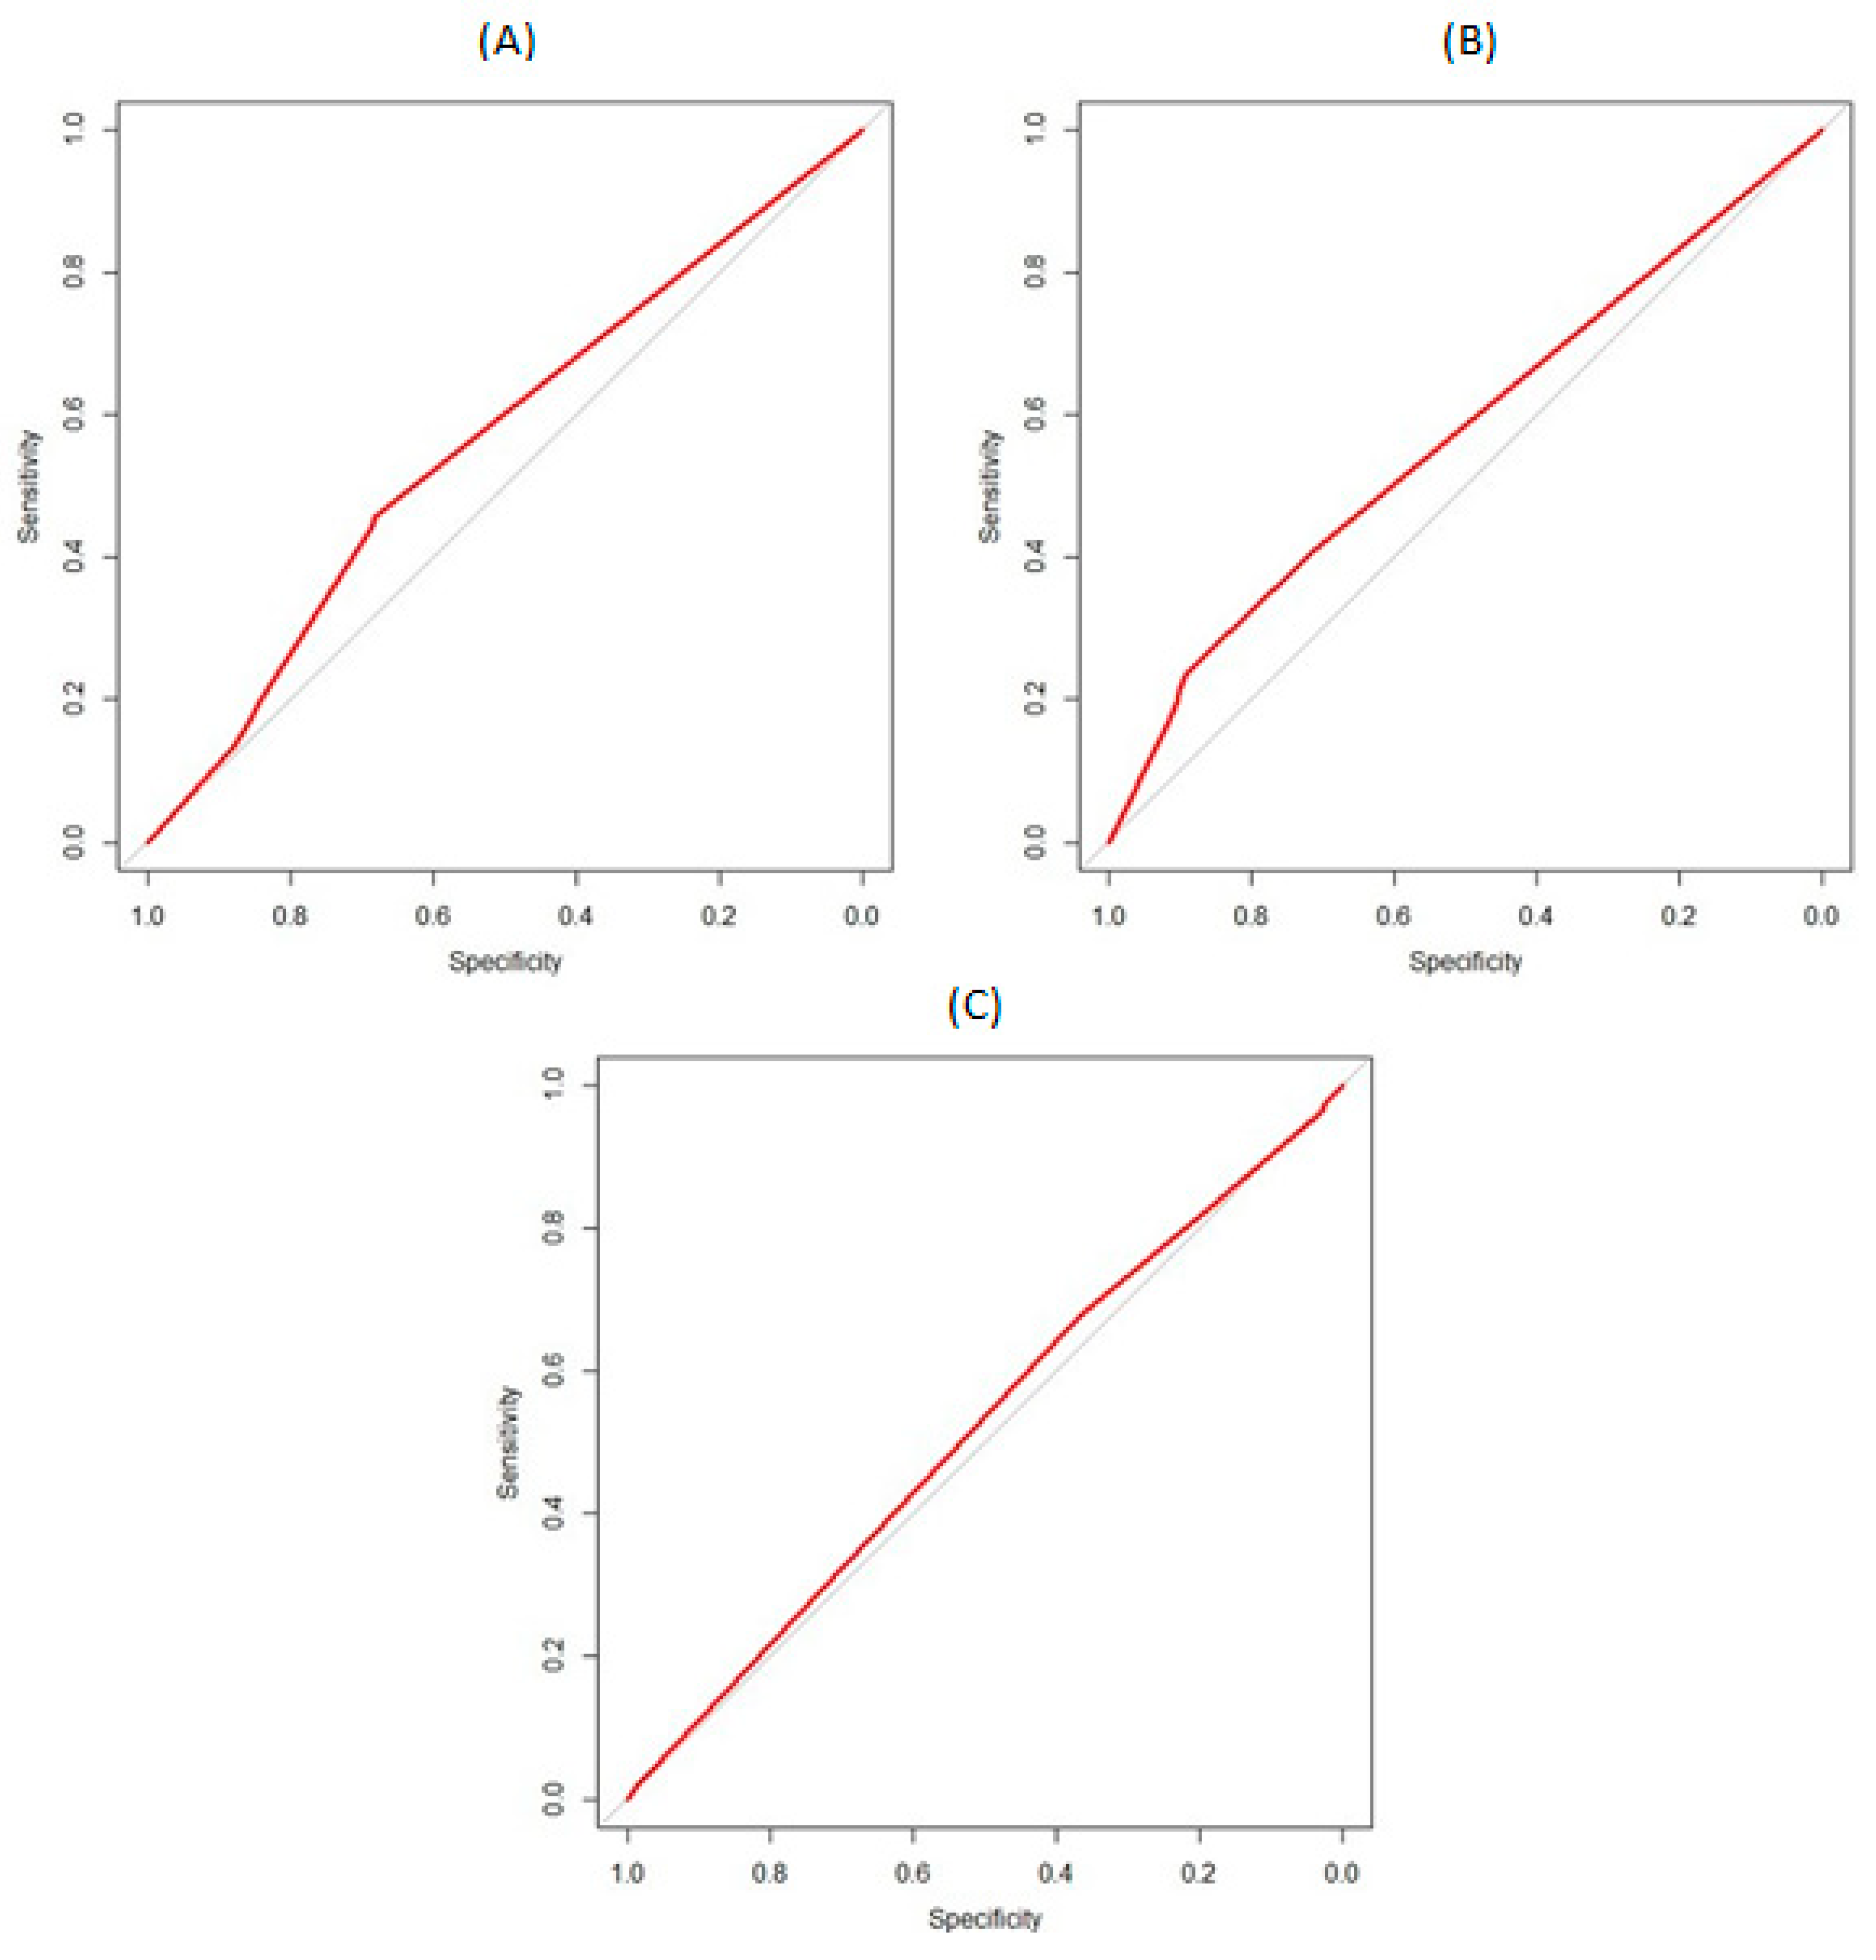
  • Diagnostic accuracy of the SUTD compared to the AUDIT in relation to (a) attempts to reduce alcohol consumption between baseline and follow-up; (b) alcohol consumption at follow-up and (c) change in alcohol consumption between baseline and follow-up.

2. Methods

2.1. Design and Setting

Data were used from repeated cross-sectional household surveys of a representative sample of the population of adults in England conducted in consecutive monthly waves between March 2014 and December 2016. The surveys are part of the ongoing Alcohol Toolkit Study which is designed to provide tracking information about alcohol consumption and related behaviours in England. Each month a new sample of approximately 1700 adults aged 16+ complete face-to-face computer assisted interviews. All respondents are asked if they are happy to be re-contacted 6 months after baseline [32]. The baseline survey uses a type of random location sampling, which is a hybrid between random probability and simple quota sampling. England is first split into 171,356 ‘Output Areas’, comprising approximately 300 households. These areas are then stratified based on ACORN characteristics and geographic region. ACORN (A Classification Of Residential Neighbourhoods) is a socio-economic profiling tool developed by Acorn Consumer Classification (CACI) [33]. The areas are then randomly allocated to interviewers, who travel to their selected areas and conduct the electronic interviews with one member of the household. Interviews are conducted until quotas based upon factors influencing the probability of being at home and tailored to local area census data are fulfilled. Morning interviews are avoided to maximise participant availability.

2.2. Participants

Data were collected on 57,341 participants over the study period. Of these, 27.02% (95% confidence interval (CI) 26.32 to 27.71, n = 15,492; unweighted: 25.53%; 95% CI 24.82 to 26.24, n = 14,639) were high-risk drinkers and form the sample for this study.

2.3. Ethical Approval

Ethical approval for the Smoking Toolkit Study (STS), a sister survey to the Alcohol Toolkit Study (ATS), was originally granted by the UCL Ethics Committee (ID 0498/001). Approval for the ATS was granted by the same committee as an extension of the STS.

2.4. Measures

At baseline, participants were asked questions that assessed: age; sex; an occupationally-based classification of socio-economic status called ‘social grade’ (dichotomised to ABC1  =  higher and intermediate professional/managerial and supervisory, clerical, junior managerial/administrative/professional or C2DE  =  skilled, semi-skilled, unskilled manual and lowest grade workers or unemployed); government office region in England (dichotomised to North  =  North East, North West, and Yorkshire and the Humber, East Midlands, West Midlands, or South  =  East of England, London, South East, and South West, classified according to an established North–South divide); receipt of a voluntary educational qualification (obtained after compulsory education ceases at 16 years old); ethnicity (dichotomised as white versus other); and disability. They were also asked if they were currently attempting to cut down on their alcohol consumption.
Participants were also asked to complete the AUDIT questionnaire [10,34,35] and the SUTD measure which consists of one item: “How strongly have you felt the urge to drink in the past 24 h?” Responses include: not at all, slight, moderate, strong, very strong and extremely strong.
The AUDIT-Quantity/Frequency scale (AUDIT-QF) [36] comprises the first two questions of the AUDIT:
  • “How often do you have a drink containing alcohol?” Responses include: never, monthly or less, 2–4 times a month, 2–3 times a week and 4+ times a week.
  • “How many units of alcohol do you drink on a typical day when you are drinking?” Responses include: 1–2 drinks, 3–4 drinks, 5–6 drinks, 7–9 drinks and 10+ drinkers.
Scores on these two questions are combined to give a measure of alcohol consumption, with a range of 0 to 8.
Those who scored 8 or more (i.e., indicating hazardous and or harmful alcohol consumption and possible dependence) on the AUDIT or 5 or more on the AUDIT-C, which comprises the first three questions of the AUDIT, (i.e., indicating high-risk consumption) at baseline were then re-contacted at 6-months follow-up and asked to complete the SUTD, AUDIT and AUDIT-QF questionnaires and: “How many attempts to restrict your alcohol consumption have you made in the last 6 months (e.g., by drinking less, choosing lower strength alcohol or using smaller glasses)?

2.5. Analyses

The protocol for this study was published on the Open Science Framework prior to data analysis (https://osf.io/wuuqr/). An amendment was made to the analysis plan in February 2017: we added a plan to assess the predictive validity of the SUTD in relation to the change in consumption between baseline and follow-up.
All analyses were conducted in R version 3.3.2. Data were weighted for key prevalence statistics (for more details see [32]). Those who were and were not followed up were compared on key baseline variables to establish representativeness of the follow-up sample using Mann–Whitney U, t-tests and chi-square tests as appropriate.
Test-retest reliability was assessed by calculating: (a) a reliability coefficient (r), which is simply the Spearman’s correlation between the scores on the first and the second testing. The value for the r coefficient can fall between 0.00 (no correlation) and 1.00 (perfect correlation); and (b) a weighted kappa coefficient which is suitable for ordinal data. Values can range from −1 to 1, where 1 indicates perfect agreement, 0 indicates no agreement beyond chance and negative values indicate inverse agreement. Cohen suggested the Kappa result be interpreted as follows: values ≤0 as indicating no agreement and 0.01–0.20 as none to slight, 0.21–0.40 as fair, 0.41–0.60 as moderate, 0.61–0.80 as substantial, and 0.81–1.00 as almost perfect agreement [37].
The predictive validity of the SUTD was evaluated by examining the association between the SUTD scale and (a) attempts to reduce alcohol intake; (b) levels of alcohol consumption at follow-up and (c) change in alcohol consumption between baseline and follow-up using a Mann–Whitney U test and linear-by-linear association chi-square test. Next attempts to reduce alcohol intake, levels of alcohol consumption at follow-up and change in alcohol consumption between baseline and follow-up were regressed on to the baseline scores using simple logistic and linear regression and multiple logistic and linear regression, adjusting for the following covariates measured at baseline: age, sex, social grade, region, receipt of a voluntary educational qualification, ethnicity, disability, AUDIT and wave of the survey.
To assess predictive accuracy, Received Operating Characteristic (ROC) curves were then calculated [38]. The ROC curve is a graphical presentation of the accuracy of a measure in which the sensitivity of the measure (i.e., the true positive rate) is plotted against the specificity (i.e., the false positive rate). The area under the ROC curve (ROCAUC) has a value from 0.5 (chance level only) to 1 (perfect discrimination). Alcohol consumption and change in alcohol consumption were first dichotomised according to their mean value into lower and higher scores [39]. Our a priori hypothesis was that the SUTD would be as accurate in discriminating whether drinkers attempt to cut down at follow-up and whether drinkers have a lower or higher alcohol consumption than the mean.
After viewing the distributions and associations for the SUTD additional unplanned sensitivity analyses were run collapsing the “moderate”, “strong”, “very strong” and “extremely strong” categorises into a three item SUTD scale (SUTD-3) comprising of “not at all”, “slight” and “moderate > 3”. Unplanned analyses were also run to assess the predictive and diagnostic accuracy of the SUTD, SUTD-3 and AUDIT in relation to consumption at follow-up and a change in consumption between baseline and follow-up restricted to those making an attempt to cut down at baseline. This analysis more accurately mirrors the previous association established between the Strength of Urges to Smoke (SUTS) scale and the success of attempts to quit smoking [20].
Strengthening The Reporting of OBservational studies in Epidemiology (STROBE) guidelines for the reporting of observational epidemiological studies were followed throughout [40].

3. Results

The sample followed up 6 months after baseline (n = 2960) differed from those not followed up (n = 11,679). They were more likely to be older, to report currently attempting to cut down their alcohol consumption, to be from high socio-economic status, to have a disability, to reside in the South of England, to have stronger urges to drink and to have higher AUDIT scores (Table 1).
Figure 1 shows the distribution of scores on the SUTD measure at baseline and follow-up. At baseline the two most frequently reported categories were “not at all” and “slight”. Nineteen per cent (n = 2730) and 11.9% (n = 352) scored in the highest four categories (i.e., greater than moderate at baseline and follow-up, respectively.

3.1. Test-Retest Reliability

In terms of test-retest reliability of the SUTD, scores at baseline and 6-month follow-up correlated weakly, r = 0.30 (95% CI 0.28 to 0.34) and weighted kappa suggested ‘fair’ reliability (wk = 0.24, 95% CI 0.28 to 0.32). The full AUDIT had slightly better test re-test reliability (r = 0.50, 95% CI 0.47 to 0.53; wk = 0.49; 95% CI 0.53 to 0.57). Test re-test reliability for the SUTD-3 was similar (r = 0.30, 95% CI 0.27 to 0.33; wk = 0.26, 95% CI 0.30 to 0.34).

3.2. Predictive Validity

3.2.1. Attempts to Cut Down between Baseline and 6-Month Follow-Up

A total of 767 higher risk drinkers (25.9%; 95% CI 24.3 to 27.5) reported that they had attempted to reduce their alcohol consumption between baseline and follow-up.
Table 2 presents the percentage of high-risk drinkers reporting an attempt to cut down stratified by their baseline SUTD score. For the full SUTD measure there is a clear monotonic relationship between the percentage attempting to cut down and increasing urges to drink (U = 974,080, p < 0.001). Of the 23 drinkers who scored the two highest levels of urges to drink, 37.1% had attempted to cut down. The relationship is also monotonic for the SUTD-3 (U = 973,570, p < 0.001).
The odds of attempting to cut down between baseline and the 6-month follow-up according to the SUTD and SUTD-3 scales are also presented in Table 2. For the SUTD, drinkers reporting “slight” to “very strong” urges to drink had 1.57 to 1.09 times higher odds of making an attempt to cut down than drinkers who reported “not at all”. After adjusting for age, sex, social grade, region, receipt of a voluntary educational qualification, ethnicity, disability, AUDIT scores and wave of the survey, those reporting “slight” and “moderate” urges had 1.78 and 1.58 higher odds of an attempt to cut down. For the SUTD-3 scale, those reporting “slight” and “moderate >” urges to drink had a 1.78 and 1.51 higher odds of reporting an attempt to cut down at follow-up in adjusted analyses.
In comparison, a positive association was also found between AUDIT scores and attempts to cut down in unadjusted analyses (odds ratio (OR) 1.09, 95% CI 1.07 to 1.12, p < 0.001). This significant association remained after adjustment for all other variables in Table 2 (OR 1.10; 95% CI 1.07 to 1.12, p < 0.001).

3.2.2. Reported Alcohol Consumption at 6-Month Follow-Up

All Participants

The mean consumption score at follow-up was 4.7 (95% CI 4.6 to 4.7). Table 2 presents the mean consumption scores of high-risk drinkers stratified by their baseline SUTD and SUTD-3 scores. There appears to be an almost linear increase in mean consumption scores with increasing urges to drink on SUTD score (z = 9.821, p < 0.001) and SUTD-3 scale (z = 10.533, p < 0.001). Of the 26 drinkers who scored the two highest levels of urges to drink on the SUTD, the mean consumption score was 5.14.
Drinkers reporting “moderate”, “strong”, “very strong”, and “extremely strong” urges to drink on the SUTD had mean consumption scores which were 0.30, 0.77, 0.80 and 0.56 units higher than those reporting “not at all” (Table 2). The beta values were smaller after adjusting for age, sex, social grade, region, receipt of a voluntary educational qualification, ethnicity, disability, AUDIT scores and wave of the survey. On the SUTD-3 those reporting “slight” and “>moderate” urges had consumption scores which were 0.22 and 0.46 units higher than those not experiencing urges to drink in adjusted analyses.
By comparison, in unadjusted analyses, a positive association was found between AUDIT scores and consumption levels (β 0.13, 95% CI 0.11 to 0.14, p < 0.001). This significant association remained after adjustment for all other variables in Table 2 (β 0.13; 95% CI 0.08 to 0.35, p < 0.001).

Participants Cutting Down at Baseline

Table 3 presents the mean consumption scores of high-risk drinkers who reported cutting down at baseline stratified by their baseline SUTD and SUTD-3 scores. The mean consumption score at follow-up among those cutting down at baseline (n = 692) was 4.9 (95% CI 4.8 to 4.9). There appeared to be an almost linear increase in mean consumption scores with increasing urges to drink on the SUTD (z = 2.5733, p = 0.010) and SUTD-3 (z = 3.3679, p < 0.001).
In unadjusted analyses, the data were inconclusive as to whether those reporting “slight”, “strong”, “very strong” and “extremely strong” urges to drink on the SUTD had different consumption levels at follow-up relative to those reporting “not at all”. In contrast, those with “moderate” urges to drink had significantly higher consumption levels (Table 3). For the SUTD-3, the data were inconclusive as to whether those reporting “slight” urges to drink had different consumption levels at follow-up relative to those reporting “not at all”. In contrast, those reporting “>moderate” urges had significantly higher consumption levels in unadjusted but not adjusted analyses.
A positive association was found for the AUDIT scores and consumption levels in both adjusted and unadjusted analyses (β 0.08; 95% CI 0.05 to 0.10, p < 0.001 versus βadj 0.09; 95% CI −0.07 to 0.12, p < 0.001).

3.2.3. Change in Alcohol Consumption between Baseline and 6-Month Follow-Up

All Participants

The mean change in consumption scores between baseline and follow-up was 0.32 (95% CI 0.30 to 0.36). Table 2 presents the change scores stratified by their baseline SUTD score and shows a non-linear association for the full SUTD scale (z = −1.7804, p = 0.075) and SUTD-3 scale (z = −3.3012, p < 0.001). Of the 26 drinkers who scored the two highest levels of urges to drink on the SUTD scale, the mean change in consumption score was 0.86.
Drinkers reporting “moderate” and “extremely strong” urges to drink on the SUTD had mean change in consumption scores which were 0.3 units lower and 1.05 units higher than those reporting “not at all” (Table 2). The differences were smaller after adjusting for age, sex, social grade, region, receipt of a voluntary educational qualification, ethnicity, disability, AUDIT scores and wave of the survey. For the SUTD-3 changes in consumption were smaller for those in the “slight” and “moderate >” relative to those not reporting urges to drink after adjustment.
By comparison, in unadjusted analyses, a positive association was found between AUDIT scores and the change in consumption levels (β 0.05, 95% CI 0.04 to 0.07, p < 0.001). This significant association remained after adjustment for all other variables in Table 2 (β 0.03; 95% CI 0.05 to 0.08, p < 0.001).

Participants Cutting Down at Baseline

The mean change in consumption among those currently cutting down at baseline (n = 692) was 0.20 (95% CI 0.08 to 0.32). Table 3 presents the mean change in consumption scores of high-risk drinkers who reported cutting down at baseline stratified by their baseline SUTD and SUTD-3 scores. There was no linear association between mean consumption scores and urges to drink on the SUTD (z = 1.4292, p = 0.153) or SUTD-3 (z = 0.065, p = −0.9481).
In unadjusted analyses, the data were inconclusive as to whether those reporting “slight”, “moderate”, “strong” and “very strong” urges to drink on the SUTD had different consumption change scores relative to those reporting “not at all” (Table 3). In contrast, those with “extremely strong” urges to drink had significantly larger change scores, suggesting a significantly larger increase in consumption between baseline and follow-up. For the SUTD-3, the data were inconclusive as to whether those reporting “slight” and “>moderate” urges to drink had different consumption change scores to those reporting “not at all”.
In contrast, a positive association was found for the AUDIT scores and the change in consumption levels in both adjusted and unadjusted analyses (β 0.07; 95% CI 0.05 to 0.10, p < 0.001 versus βadj −0.06; 95% CI −0.03 to 0.09, p < 0.001).

3.3. Diagnostic Accuracy

Figure 2a shows the ROC curve for the six-item SUTD measure predicting attempts to cut down. The ROCAUC was 0.6 (95% CI 0.5 to 0.6). The ROCAUC for the AUDIT (0.6; 95% CI 0.6 to 0.7) and SUTD-3 (0.6; 95% CI 0.5 to 0.6) were similar. This would suggest that scores on the SUTD, AUDIT and SUTD-3 would lead to correct categorisation of whether one will make an attempt to cut down around 60% of the time.
Figure 2b shows the ROC curve for the six-item SUTD measure predicting consumption levels at follow-up. The ROCAUC was 0.6 (95% CI 0.5 to 0.6). The ROCAUC for the AUDIT (0.7; 95% CI 0.6 to 0.7) but for the SUTD-3 (0.6; 95% CI 0.5 to 0.6) was similar. This would suggest that scores on the SUTD and SUTD-3 would lead to correct categorisation of consumption around 60% and on the AUDIT around 70% of the time. When restricting the analysis to those cutting down at baseline, the ROCAUC’s were as follows: SUTD (0.5; 95% CI 0.5 to 0.6), SUTD-3 (0.5; 95% CI 0.4 to 0.6) and AUDIT (0.7; 95% CI 0.6 to 0.7).
Figure 2c shows the ROC curve for the six-item SUTD measure predicting change in consumption levels between baseline and follow-up. The ROCAUC was 0.5 (95% CI 0.5 to 0.6). The ROCAUC for the AUDIT was slightly higher (0.6; 95% CI 0.5 to 0.6) but for the SUTD-3 (0.5; 95% CI 0.5 to 0.6) was similar. This would suggest that scores on the SUTD, SUTD-3 and AUDIT would lead to correct categorisation of consumption around 50% and 60% of the time. When restricting the analysis to those cutting down at baseline, the ROCAUC’s were as follows: SUTD (0.6; 95% CI 0.5 to 0.6), SUTD-3 (0.6; 95% CI 0.5 to 0.7) and AUDIT (0.6; 95% CI 0.5 to 0.7).

4. Discussion

Although the long-term test re-test reliability was better for the AUDIT it was still fair for the SUTD [37]. The SUTD was associated with heavier alcohol consumption at follow-up, a reduction in alcohol consumption between baseline and follow-up and greater likelihood of attempting to cut down between baseline and 6-months follow-up. The accuracy of the SUTD in discriminating between drinkers who attempted to reduce and did not attempt to reduce their alcohol intake, and drinkers with a consumption level lower than the mean and higher than the mean consumption level at follow-up, was around 0.6 which would be broadly considered as acceptable [41]. However, the SUTD was poor at discriminating between those with a change in consumption level between baseline and follow-up which was lower than the mean and higher than the mean. The AUDIT had acceptable to good discriminatory accuracy for all outcomes, performing better than the SUTD on predicting consumption levels and change in consumption levels.
This study has several advantages including the use of data from a large household survey of adults in England which enabled the assessment of the validity and reliability of the SUTD scale compared to the widely-validated AUDIT questionnaire. However, this study also has several limitations which must be considered. First, is the low response rate at 6-months follow-up which may have introduced bias. However, differences between those followed and those not followed up were small. Secondly, participants were asked to retrospectively recall attempts to cut down on their alcohol intake and thus it is possible attempts were forgotten. This may have led to an underestimation of the association with urges to drink. Thirdly, this paper assessed the association between SUTD measures and changes in alcohol consumption at one time point. Given the transient nature of urges to drink it will be important to assess in further studies associations using repeated longitudinal measures (e.g., ecological momentary assessment) and also the relationship with other outcomes including relapse. Finally, interviews could happen at any time of the day but morning interviews were avoided to maximise availability. It is possible that urges to drink are different in the morning and evening and that any differences are moderated by dependence levels. Dependent drinkers may have a greater urge for ‘relief drinking’ in the morning, while heavy non-dependent drinkers could be more affected by cues for early evening drinking.
Test-retest reliability of AUDIT scores has been shown to be high at least in the short term (e.g., r > 0.6) [42]. The poorer reliability of the SUTD identified in this study may reflect the gap of 6 months between measurement periods, with the AUDIT questionnaire assessing dependency over the past few weeks, while the SUTD measures urges over the past 24 h. Lack of long-term stability in urges to drink is consistent with the assumptions of psychological theories e.g., PRIME theory, which view urges at momentary states [19].
Previous studies have found that the accuracy of the AUDIT questionnaire in discriminating whether one has an alcohol use disorder according to DSM-IV and ICD-10 criteria is as high as 0.9 [43,44]. Literature is however lacking on ROCAUCs for predictors of attempts to cut down and alcohol consumption i.e., actual behaviour change. Studies on cigarette dependence have found that ROCAUCs for attempts to quit smoking are in a similar range to those identified in the current study [21]. This likely reflects greater difficulties in predicting behaviour change due to instability over time. For example, the number of drinks consumed on any one occasion is strongly associated with pre-drinking mood [45].
An additional point of interest is that a significant number of high-risk drinkers attempted to cut down after reporting that they did not have any urges to drink. This provides further evidence that behaviour is a relatively complex and unstable phenomenon and results from the interplay between multiple motivational influences on a moment-to-moment basis e.g., plans, beliefs, views, evaluations, and desires [19]. It also suggests that health-care professionals should not stop encouraging patients to cut down on their alcohol consumption even if they do not report strong desires to drink [46].

5. Conclusions

In conclusion, this single item measure of urges to drink may be an efficient quantitative tool for population level surveys and studies assessing the impact of interventions aimed at helping high-risk drinkers reduce their alcohol consumption. The fact that it involves reported experience in the previous 24 h means that it might form a helpful dynamic measure, which is a limitation of the AUDIT questionnaire. Further research should assess the external validity of this measure in different populations and examine short-term test-retest reliability.

Author Contributions

E.B., J.B., S.M. and R.W. designed the study. EB wrote the first draft and conducted the analysis. E.B., J.B., S.M., R.W., C.D. and E.K. commented on and contributed to the final draft.

Funding

The ATS receives funding from the NIHR School for Public Health Research (SPHR1 and 2). SPHR is a partnership between the Universities of Sheffield; Bristol; Cambridge; Imperial College London; UCL; The London School for Hygiene and Tropical Medicine; the LiLaC collaboration between the Universities of Liverpool and Lancaster and Fuse; The Centre for Translational Research in Public Health, a collaboration between Newcastle, Durham, Northumbria, Sunderland and Teesside Universities. The views expressed are those of the authors(s) and not necessarily those of the NHS, NIHR, or Department of Health. No funders had any involvement in the design of the study, the analysis or interpretation of the data, the writing of the report, or the decision to submit the paper for publication. Salaries of E.B., J.B. and R.W. are funded by a programme grant from Cancer Research UK (CRUK; C1417/A22962). E.B. also receives support from SPHR2. EK is funded by the NIHR SPHR and the NIHR School for Primary Care Research (SPCR). CD is part funded by the NIHR Biomedical Research Centre at South London and Maudsley NHS Foundation Trust and King’s College London, and part funded by the NIHR Collaboration for Leadership in Applied Health Research and Care South London and CD receives funding from an NIHR Senior Investigator award.

Conflicts of Interest

The authors declare no conflict of interest.

Abbreviations

ATSAlcohol Toolkit Study
AUDITAlcohol Use Disorders Identification Test
SUTDStrength of Urges to Drink

References

  1. World Health Organization. Global Status Report on Alcohol and Health-2014; World Health Organization: Geneva, Switzerland, 2014. [Google Scholar]
  2. Health and Social Care Information Centre. Statistics on Alcohol. 2016. Available online: https://www.gov.uk/government/statistics/statistics-on-alcohol-england-2016 (accessed on 19 August 2019).
  3. HSCIC. Statistics on Alcohol. 2015. Available online: http://www.hscic.gov.uk/catalogue/PUB17712/alc-eng-2015-rep.pdf (accessed on 19 August 2019).
  4. Beard, E.; Brown, J.; Michie, S.; Kaner, E.; Meier, P.; West, R. Use of aids for smoking cessation and alcohol reduction: A population survey of adults in England. BMC Public Health 2016, 16, 1237. [Google Scholar] [CrossRef] [PubMed]
  5. Lago, L.; Bruno, R.; Degenhardt, L. Concordance of ICD-11 and DSM-5 definitions of alcohol and cannabis use disorders: A population survey. Lancet Psychiatry 2016, 3, 673–684. [Google Scholar] [CrossRef]
  6. American Psychiatric Association. Diagnostic and Statistical Manual of Mental Disorders (DSM-5®); American Psychiatric Pub.: Washington, DC, USA, 2013. [Google Scholar]
  7. Reid, M.C.; Fiellin, D.A.; O’Connor, P.G. Hazardous and harmful alcohol consumption in primary care. Arch. Intern. Med. 1999, 159, 1681–1689. [Google Scholar] [CrossRef] [PubMed]
  8. Saunders, J.B.; Aasland, O.G.; Babor, T.F.; de la Fuente, J.R.; Grant, M. Development of the Alcohol Use Disorders Identification Test (AUDIT): WHO Collaborative Project on Early Detection of Persons with Harmful Alcohol Consumption--II. Addiction 1993, 88, 791–804. [Google Scholar] [CrossRef] [PubMed]
  9. Babor, T.F.; Higgins-Biddle, J.C.; Saunders, J.B.; Monteiro, M.G. AUDIT: The Alcohol Use Disorders Identification Test: Guidelines for Use in Primary Care, 2nd ed.; WHO: Geneva, Switzerland, 2001. [Google Scholar]
  10. Bohn, M.J.; Babor, T.F.; Kranzler, H.R. The Alcohol Use Disorders Identification Test (AUDIT): Validation of a screening instrument for use in medical settings. J. Stud. Alcohol 1995, 56, 423–432. [Google Scholar] [CrossRef] [PubMed]
  11. Allen, J.P.; Litten, R.Z.; Fertig, J.B.; Babor, T. A Review of Research on the Alcohol Use Disorders Identification Test (AUDIT). Alcohol. Clin. Exp. Res. 1997, 21, 613–619. [Google Scholar] [CrossRef] [PubMed]
  12. Reinert, D.F.; Allen, J.P. The alcohol use disorders identification test (AUDIT): A review of recent research. Alcohol. Clin. Exp. Res. 2002, 26, 272–279. [Google Scholar] [CrossRef]
  13. Frank, D.; DeBenedetti, A.F.; Volk, R.J.; Williams, E.C.; Kivlahan, D.R.; Bradley, K.A. Effectiveness of the AUDIT-C as a Screening Test for Alcohol Misuse in Three Race/Ethnic Groups. J. Gen. Intern. Med. 2008, 23, 781–787. [Google Scholar] [CrossRef] [Green Version]
  14. Li, T.K.; Hewitt, B.G.; Grant, B.F. The Alcohol Dependence Syndrome, 30 years later: A commentary. Addiction 2007, 102, 1522–1530. [Google Scholar] [CrossRef]
  15. Hasin, D.S.; Liu, X.; Alderson, D.; Grant, B.F. DSM-IV alcohol dependence: A categorical or dimensional phenotype? Psychol. Med. 2006, 36, 1695–1705. [Google Scholar] [CrossRef]
  16. Saunders, J.B.; Lee, N.K. Hazardous alcohol use: Its delineation as a subthreshold disorder, and approaches to its diagnosis and management. Compr. Psychiatry 2000, 41, 95–103. [Google Scholar] [CrossRef]
  17. Edwards, G.; Gross, M.M. Alcohol dependence: Provisional description of a clinical syndrome. Br. Med. J. 1976, 1, 1058. [Google Scholar] [CrossRef] [PubMed]
  18. Baker, T.B.; Morse, E.; Sherman, J.E. The Motivation to Use Drugs: A Psychobiological Analysis of Urges; Nebraska Symposium on Motivation; University of Nebraska Press: Lincoln, NE, USA, 1986. [Google Scholar]
  19. West, R.; Brown, J. Theory of Addiction; John Wiley & Sons: Hoboken, NJ, USA, 2013. [Google Scholar]
  20. Fidler, J.A.; Shahab, L.; West, R. Strength of urges to smoke as a measure of severity of cigarette dependence: Comparison with the Fagerström Test for Nicotine Dependence and its components. Addiction 2011, 106, 631–638. [Google Scholar] [CrossRef] [PubMed]
  21. Kotz, D.; Brown, J.; West, R. Predictive validity of the Motivation to Stop Scale (MTSS): A single-item measure of motivation to stop smoking. Drug Alcohol Depend. 2013, 128, 15–19. [Google Scholar] [CrossRef] [PubMed]
  22. Koob, G.F.; Volkow, N.D. Neurocircuitry of addiction. Neuropsychopharmacology 2010, 35, 217–238. [Google Scholar] [CrossRef] [PubMed]
  23. Garbutt, J.C.; West, S.L.; Carey, T.S.; Lohr, K.N.; Crews, F.T. Pharmacological treatment of alcohol dependence: A review of the evidence. JAMA 1999, 281, 1318–1325. [Google Scholar] [CrossRef] [PubMed]
  24. Murphy, C.M.; Stojek, M.K.; Few, L.R.; Rothbaum, A.O.; MacKillop, J. Craving as an alcohol use disorder symptom in DSM-5: An empirical examination in a treatment-seeking sample. Exp. Clin. Psychopharmacol. 2014, 22, 43. [Google Scholar] [CrossRef] [PubMed]
  25. Bohn, M.J.; Krahn, D.D.; Staehler, B.A. Development and initial validation of a measure of drinking urges in abstinent alcoholics. Alcohol. Clin. Exp. Res. 1995, 19, 600–606. [Google Scholar] [CrossRef]
  26. Singleton, E.; Tiffany, S.; Henningfield, J. Development and validation of a new questionnaire to assess craving for alcohol: Problems of drug dependence. In Proceedings of the 56th Annual Meeting, The College on Problems of Drug Dependence, National Institute on Drug Abuse, Rockville, MD, USA, 18–23 June 1994; p. 289. [Google Scholar]
  27. Goodman, W.K.; Price, L.H.; Rasmussen, S.A.; Mazure, C.; Delgado, P.; Heninger, G.R.; Charney, D.S. The yale-brown obsessive compulsive scale: II. Validity. Arch. Gen. Psychiatry 1989, 46, 1012–1016. [Google Scholar] [CrossRef] [PubMed]
  28. Stockwell, T.; Murphy, D.; Hodgson, R. The severity of alcohol dependence questionnaire: Its use, reliability and validity. Addiction 1983, 78, 145–155. [Google Scholar] [CrossRef]
  29. Drobes, D.J.; Thomas, S.E. Assessing craving for alcohol. Alcohol Res. Health 1999, 23, 179–186. [Google Scholar] [PubMed]
  30. Dev, R.; Parsons, H.A.; Palla, S.; Palmer, J.L.; Del Fabbro, E.; Bruera, E. Undocumented alcoholism and its correlation with tobacco and illegal drug use in advanced cancer patients. Cancer 2011, 117, 4551–4556. [Google Scholar] [CrossRef] [Green Version]
  31. Scott, C.M.; Popovich, D.J. Undiagnosed alcoholism & prescription drug misuse among the elderly. Special considerations for home assessment. Caring 2001, 20, 20–23. [Google Scholar] [PubMed]
  32. Beard, E.; Brown, J.; West, R.; Acton, C.; Brennan, A.; Drummond, C.; Hickman, M.; Holmes, J.; Kaner, E.; Lock, K. Protocol for a national monthly survey of alcohol use in England with 6-month follow-up: ‘The Alcohol Toolkit Study’. BMC Public Health 2015, 15, 230. [Google Scholar] [CrossRef] [PubMed]
  33. What Is ACORN? Available online: http://www.caci.co.uk/acorn/ (accessed on 19 August 2019).
  34. Conigrave, K.M.; Saunders, J.B.; Reznik, R.B. Predictive capacity of the AUDIT questionnaire for alcohol-related harm. Addiction 1995, 90, 1479–1485. [Google Scholar] [CrossRef] [PubMed]
  35. Kaarne, T.; Aalto, M.; Kuokkanen, M.; Seppa, K. AUDIT-C, AUDIT-3 and AUDIT-QF in screening risky drinking among Finnish occupational health-care patients. Drug Alcohol Rev. 2010, 29, 563–567. [Google Scholar] [CrossRef] [PubMed]
  36. Meneses-Gaya, C.; Zuardi, A.W.; Loureiro, S.R.; Hallak, J.E.; Trzesniak, C.; de Azevedo Marques, J.M.; Machado-de-Sousa, J.P.; Chagas, M.H.; Souza, R.M.; Crippa, J.A. Is the full version of the AUDIT really necessary? Study of the validity and internal construct of its abbreviated versions. Alcohol. Clin. Exp. Res. 2010, 34, 1417–1424. [Google Scholar] [CrossRef] [PubMed]
  37. Cohen, J. A coefficient of agreement for nominal scales. Educ. Psychol. Meas. 1960, 20, 37–46. [Google Scholar] [CrossRef]
  38. Mandrekar, J.N. Receiver operating characteristic curve in diagnostic test assessment. J. Thorac. Oncol. 2010, 5, 1315–1316. [Google Scholar] [CrossRef]
  39. Peacock, J.L.; Sauzet, O.; Ewings, S.M.; Kerry, S.M. Dichotomising continuous data while retaining statistical power using a distributional approach. Stat. Med. 2012, 31, 3089–3103. [Google Scholar] [CrossRef]
  40. Von Elm, E.; Altman, D.G.; Egger, M.; Pocock, S.J.; Gøtzsche, P.C.; Vandenbroucke, J.P.; Initiative, S. The Strengthening the Reporting of Observational Studies in Epidemiology (STROBE) Statement: Guidelines for reporting observational studies. Int. J. Surg. 2014, 12, 1495–1499. [Google Scholar] [CrossRef] [PubMed] [Green Version]
  41. Selin, K.H. Test-retest reliability of the alcohol use disorder identification test in a general population sample. Alcohol. Clin. Exp. Res. 2003, 27, 1428–1435. [Google Scholar] [CrossRef] [PubMed]
  42. Chen, C.H.; Chen, W.J.; Cheng, A.T. New approach to the validity of the alcohol use disorders identification test: Stratum-specific likelihood ratios analysis. Alcohol. Clin. Exp. Res. 2005, 29, 602–608. [Google Scholar] [CrossRef] [PubMed]
  43. Piccinelli, M.; Tessari, E.; Bortolomasi, M.; Piasere, O.; Semenzin, M.; Garzotto, N.; Tansella, M. Efficacy of the alcohol use disorders identification test as a screening tool for hazardous alcohol intake and related disorders in primary care: A validity study. BMJ 1997, 314, 420. [Google Scholar] [CrossRef] [PubMed]
  44. De Silva, P.; Jayawardana, P.; Pathmeswaran, A. Concurrent validity of the alcohol use disorders identification test (AUDIT). Alcohol Alcohol. 2008, 43, 49–50. [Google Scholar] [CrossRef] [PubMed]
  45. Dvorak, R.D.; Pearson, M.R.; Sargent, E.M.; Stevenson, B.L.; Mfon, A.M. Daily associations between emotional functioning and alcohol involvement: Moderating effects of response inhibition and gender. Drug Alcohol Depend. 2016, 163 (Suppl. 1), S46–S53. [Google Scholar] [CrossRef] [PubMed] [Green Version]
  46. Brown, J.; West, R.; Angus, C.; Beard, E.; Brennan, A.; Drummond, C.; Hickman, M.; Holmes, J.; Kaner, E.; Michie, S. Comparison of brief interventions in primary care on smoking and excessive alcohol consumption: A population survey in England. Br. J. Gen. Pract. 2016, 66, e1–e9. [Google Scholar] [CrossRef] [PubMed]
Figure 1. Distribution of scores on SUTD scale at (A) baseline and (B) follow-up among those completing the 6 month follow-up (n = 2960).
Ijerph 16 03714 g001aIjerph 16 03714 g001b
Figure 2. Receiver operating characteristic (ROC) curves showing the accuracy of the SUTD in predicting (A) attempts to cut down between baseline and 6-month follow-up [Area under the ROC curve = 0.6]; (B) alcohol consumption at 6-month follow-up [Area under the ROC curve = 0.6]; and (C) change in alcohol consumption between baseline and 6 months follow-up [Area under the ROC curve = 0.5].
Ijerph 16 03714 g002
Table 1. Participants characteristics overall and as a function of whether they were followed up.
All High-Risk Drinkers (n = 14,639)Followed-Up (n = 2960)Not Followed-Up (n = 11,679)p
%95% CI%95% CI%95% CI
Gender
Female35.134.4 to 35.935.133.4 to 36.935.134.3 to 36.0>0.990
Male64.964.1 to 65.664.962.1 to 66.664.964.0 to 65.7
Age
16–2420.519.9 to 21.211.910.8 to 13.222.721.9 to 23.5<0.001
25–3414.513.9 to 15.19.48.4 to 10.515.815.1 to 16.4
35–4414.513.9 to 15.013.912.6 to 15.214.614.0 to 15.3
45–5417.917.3 to 18.620.519.1 to 22.117.316.6 to 18.0
55–6416.716.1 to 17.321.920.5 to 23.515.314.7 to 16.0
65+16.015.4 to 16.622.320.9 to 23.914.313.7 to 15.0
Social grade
ABC162.061.2 to 62.870.168.4 to 71.759.959.0 to 60.8<0.001
C2DE38.037.2 to 38.829.928.3 to 31.640.139.2 to 41.0
Educational qualification
Voluntary71.971.2 to 72.774.773.1 to 76.271.270.4 to 72.0<0.001
Non-voluntary28.127.3 to 28.871.270.4 to 72.028.829.6 to 28.0
Disability
Yes8.68.1 to 9.011.110.0 to 12.37.97.4 to 8.4<0.001
No91.491.0 to 91.988.987.7 to 90.092.191.6 to 92.6
Ethnicity
White95.495.1 to 95.896.395.6 to 97.095.294.8 to 95.60.011
Other4.64.9 to 4.23.73.0 to 4.44.84.4 to 5.2
Government Office Region
North58.657.8 to 59.457.555.7 to 59.358.958.0 to 59.80.153
South41.440.6 to 42.242.540.7 to 44.341.440.2 to 40.2
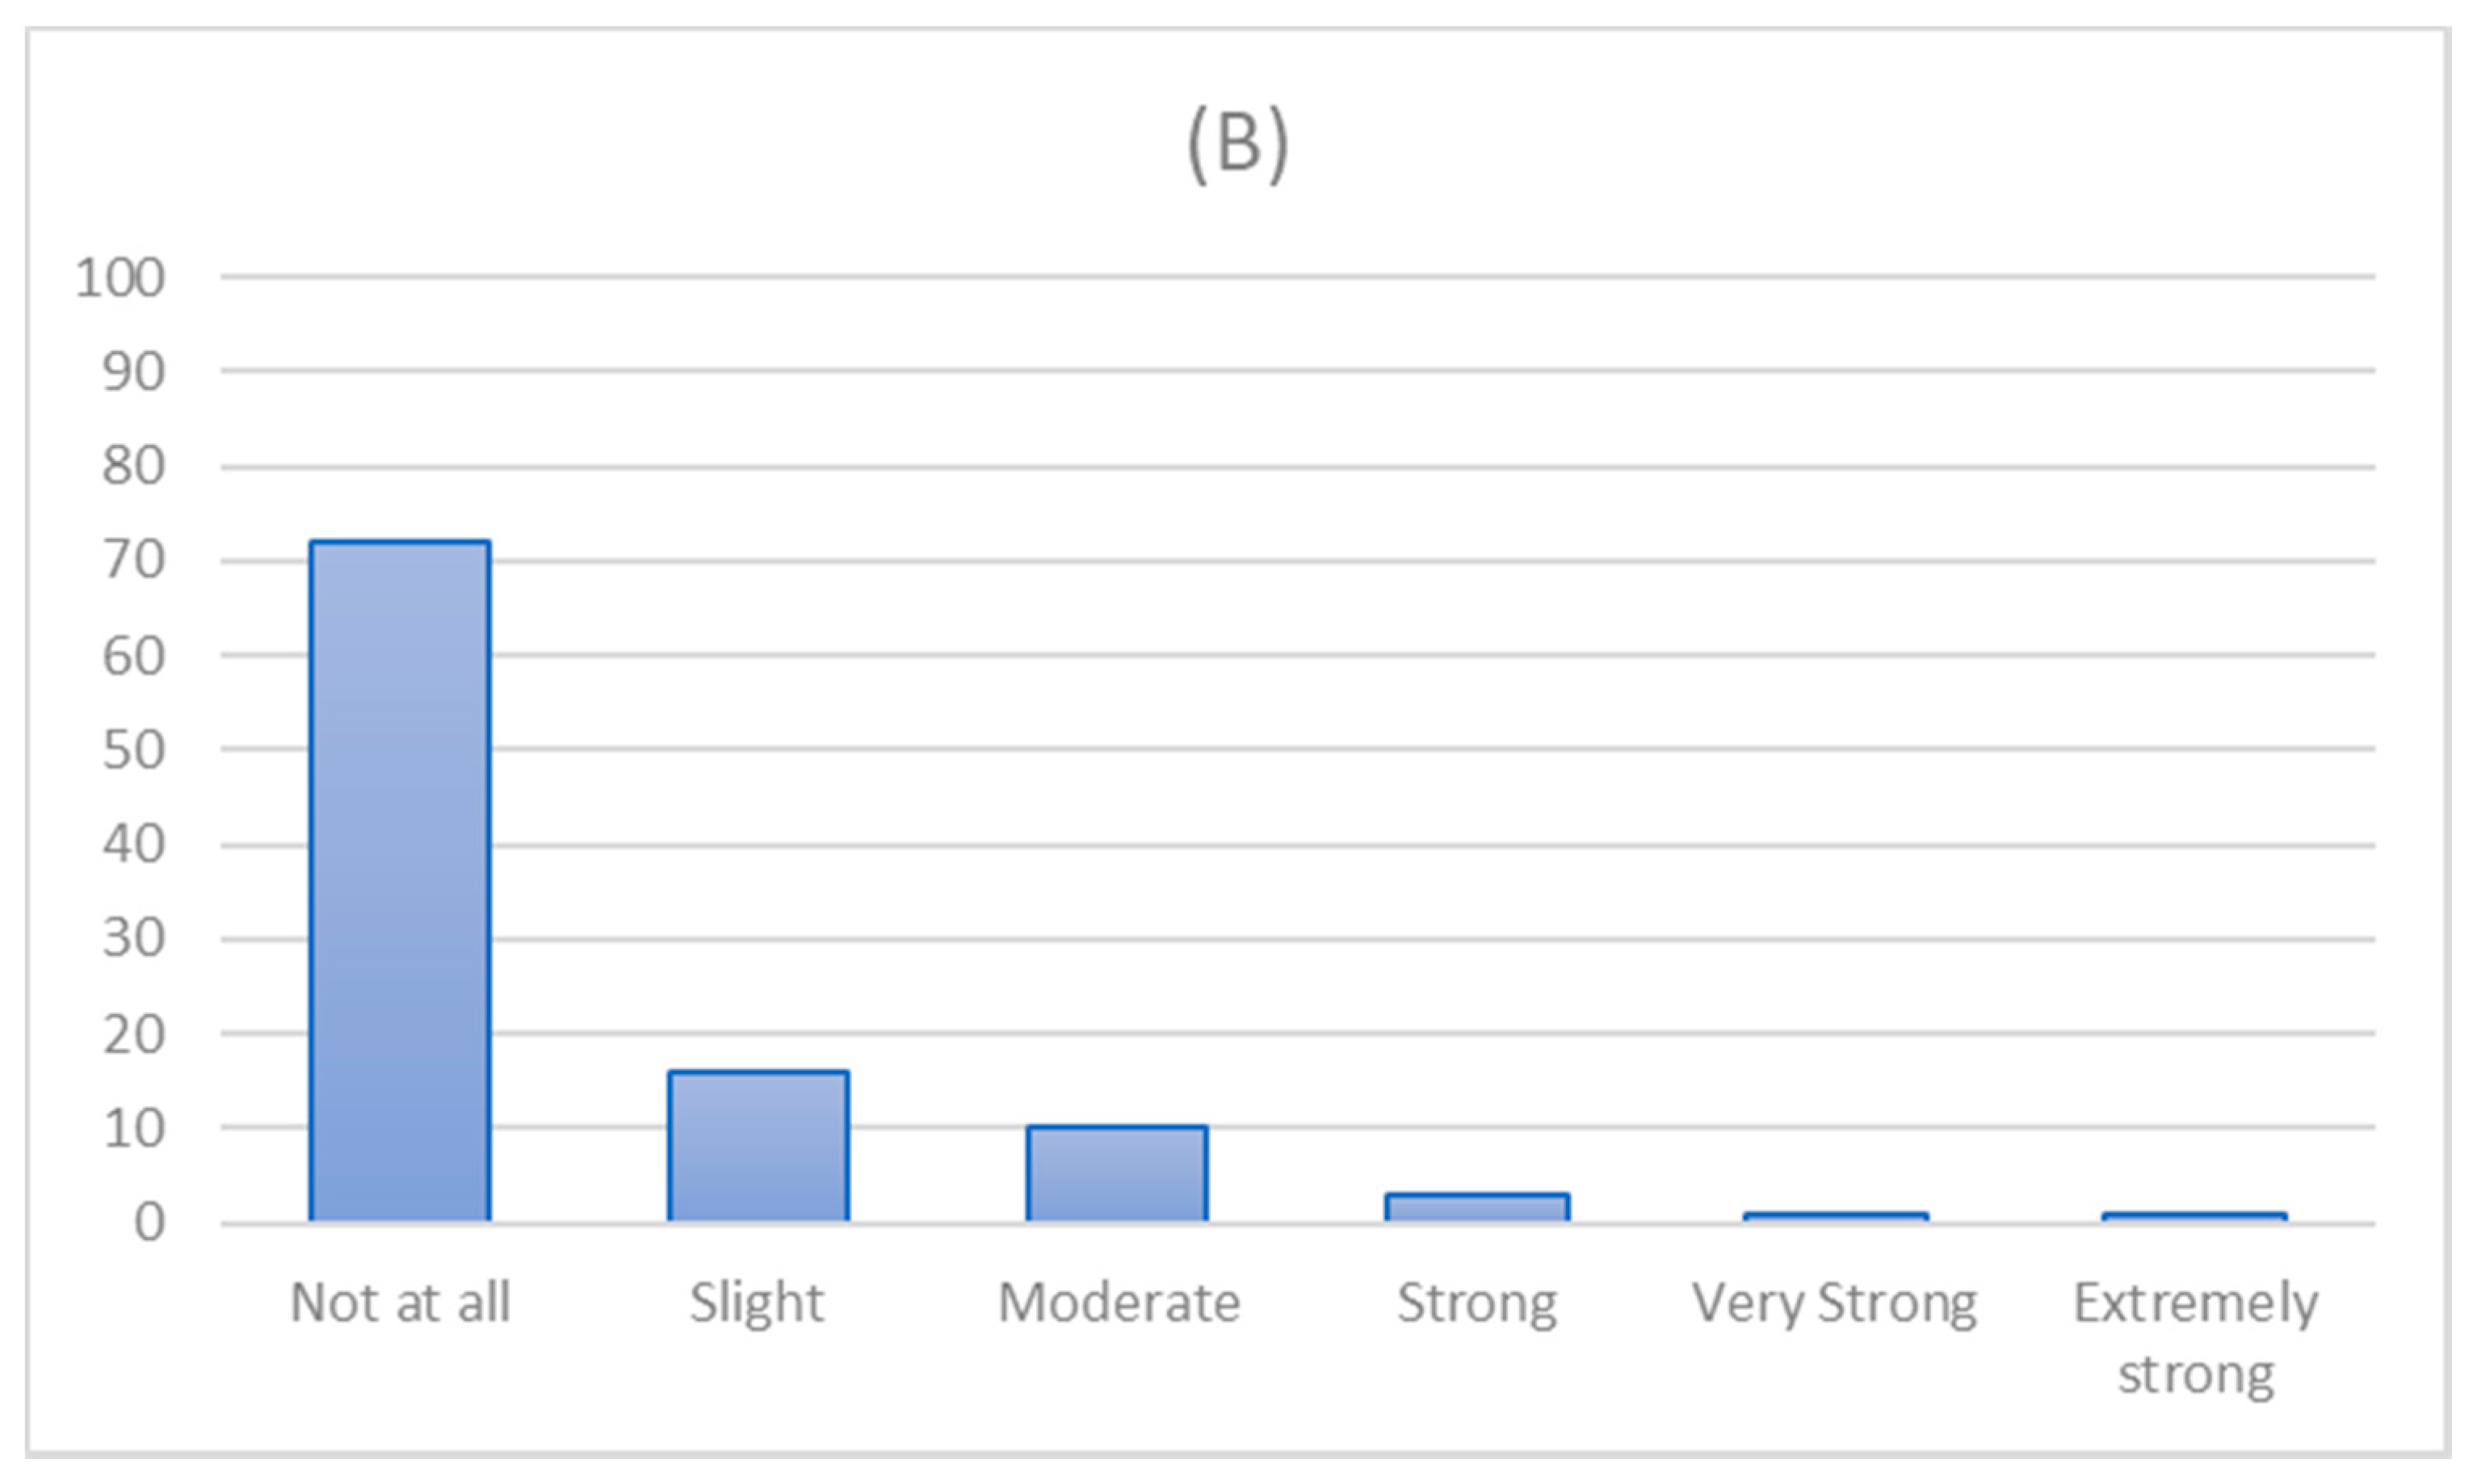
Urges to drink (baseline)
Not at all64.163.4 to 64.964.763.0 to 66.464.063.1 to 64.90.382
Slight17.116.5 to 17.717.015.7 to 18.417.116.4 to 17.8
Moderate12.912.3 to 13.413.212 to 14.512.812.2 to 13.4
Strong3.53.2 to 3.82.92.3 to 2.63.63.3 to 4.0
Very strong1.41.3 to 1.61.30.9 to 1.81.51.3 to 1.7
Extremely strong0.90.7 to 1.00.80.5 to 1.20.90.7 to 1.1
Cutting down (baseline)
Yes19.819.1 to 20.423.421.9 to 25.018.918.2 to 19.6
No80.279.6 to 80.976.675.0 to 78.181.180.4 to 81.8<0.001
Mean95% CIMean95% CIMean95% CI
AUDIT-score (baseline)8.58.4 to 8.68.3 8.2 to 8.58.58.5 to 8.60.218
Note: p-value derived from chi-square test for categorical data, Mann–Whitney U for ordinal data and t-test for continuous data; AUDIT = Alcohol Use Disorders Identification Test.
Table 2. Results of the regression analysis assessing the association between attempts to cut down drinking between baseline and 6-month follow-up (any versus none), mean consumption at follow-up and mean change in consumption between baseline and 6-month follow-up with the SUTD scale (N = 2960).
Levels of Urges to Drink at BaselineAttempt to Cut Down at Follow-Up % (n)OR95% CIAdjusted OR95% CI
SUTDNoYes LowerUpper LowerUpper
Not at all78.8 (1510)21.2 (406)
Slight65.7 (331)34.3 (173)1.941.57 ***2.411.78 ***1.432.22
Moderate65.7 (257)34.3 (134)1.941.53 ***2.451.54 ***1.201.96
Strong65.1 (56)34.9 (30)1.991.25 **3.121.430.872.30
Very strong63.2 (24)36.8 (14)2.171.09 *4.181.620.793.22
Extremely strong62.5 (15)37.5 (9)2.230.935.051.160.452.78
SUTD-3
Not all78.8 (1510)21.2 (406)
Slight65.7 (331)34.3 (173)1.94 ***1.572.411.78 ***1.432.22
>Moderate 65.3 (352)34.7 (187)1.98 ***1.602.431.51 ***1.211.88
Levels of Urges to Drink at BaselineMean (SD) Consumption at Follow-UpΒ95% CIAdjusted β95% CI
LowerUpper LowerUpper
Not at all4.46 (1.48)
Slight4.77 (1.39)0.30 ***0.160.450.22 **0.080.35
Moderate5.23 (1.39)0.77 ***0.610.930.53 ***0.380.69
Strong5.27 (1.45)0.80 ***0.491.120.40 *0.090.70
Very strong5.03 (1.73)0.56 *0.091.030.19−0.260.64
Extremely strong5.26 (2.40)0.80 **0.201.40−0.22−0.810.36
SUTD-3
Not all4.46 (1.48)
Slight4.77 (1.39)0.30 ***0.160.450.22 **0.080.35
>Moderate 5.22 (1.48)0.78 ***0.620.900.46 ***0.320.60
Levels of Urges to Drink at BaselineChange Consumption (Follow-Up—Baseline) aΒ95% CIAdjusted β95% CI
LowerUpper LowerUpper
Not at all0.39 (1.51)
Slight0.24 (1.43)−0.14−0.290.00−0.16 *−0.31−0.02
Moderate0.06 (1.43)−0.33 ***−0.49−0.16−0.40 ***−0.56−0.24
Strong0.22 (1.25)−0.17−0.490.16−0.37 *−0.69−0.05
Very strong0.29 (1.80)−0.10−0.580.38−0.36−0.840.12
Extremely strong1.43 (2.43)1.05 ***0.441.660.47−0.151.09
SUTD-3
Not all0.39 (1.51)
Slight0.24 (1.43)−0.14−0.29 0.00−0.16 *−0.31−0.02
>Moderate 0.16 (1.51)−0.23 **−0.37−0.08−0.36 ***−0.51−0.22
Note: OR = odds ratio; OR and β adjusted for age, sex, social grade, region, receipt of a voluntary educational qualification, ethnicity, disability, AUDIT and wave of the survey; * significant at p < 0.05; ** significant at p < 0.01; *** significant at p < 0.001; a Positive score = higher consumption at follow-up than baseline, negative score = lower consumption at follow-up than baseline; SUTD = Strength of Urges to Drink Scale
Table 3. Results of the regression analysis assessing the association between mean consumption at follow-up and mean change in consumption between baseline and 6-month follow-up with the SUTD scale restricted to participants cutting down at baseline (N = 692).
Levels of Urges to Drink at BaselineMean (SD) Consumption at Follow-UpΒ95% CIAdjusted β95% CI
LowerUpperLowerUpper
Not at all4.74 (1.49)
Slight4.91 (1.29)0.15−0.140.450.08−0.20 0.37
Moderate5.30 (1.51)0.26−0.310.83 *0.320.020.61
Strong5.00 (1.33)0.55 ***0.250.85−0.12−0.680.45
Very strong5.00 (2.16)0.26−0.561.09−0.14−0.950.67
Extremely strong4.62 (3.11)−0.11−1.160.93−1.21 *−2.27−0.15
SUTD−3
Not all4.74 (1.49)
Slight4.91 (1.29)0.15−0.140.450.08−0.210.37
>Moderate 5.20 (1.63)0.45 ***0.190.720.18−0.090.45
Levels of Urges to Drink at BaselineChange Consumption (Follow-Up—Baseline) aΒ95% CIAdjusted β95% CI
LowerUpperLowerUpper
Not at all0.22 (1.60)
Slight−0.01 (1.32)−0.23−0.550.08−0.20−0.510.12
Moderate0.09 (1.60)−0.13−0.450.19−0.20−0.520.12
Strong0.43 (1.20)0.20−0.400.81−0.13−0.750.48
Very strong0.46 (2.11)0.24−0.641.11−0.12−1.000.76
Extremely strong2.75 (3.58)2.53 ***1.423.631.66 **0.512.80
SUTD-3
Not all0.22 (1.60)
Slight−0.01 (1.32)−0.23−0.550.08−0.19−0.510.12
>Moderate 0.30 (1.79)0.07−0.220.36−0.13−0.43 0.16
Note: OR = odds ratio; OR and β adjusted for age, sex, social grade, region, receipt of a voluntary educational qualification, ethnicity, disability, AUDIT and wave of the survey; * significant at p < 0.05; ** significant at p < 0.01; *** significant at p < 0.001; a Positive score = higher consumption at follow-up than baseline, negative score = lower consumption at follow-up than baseline.

