Differences in Cardiorespiratory Fitness between Chinese and Japanese Children and Adolescents

 ,
,
Abstract
:1. Introduction
2. Materials and Methods
2.1. Participants and Sampling
2.2. Anthropometric Measurements
2.3. Evaluation Criteria for Nutrition
2.4. Cardiorespiratory Fitness Test
2.5. Ethical Consideration
2.6. Statistical Analysis
3. Results
4. Discussion
5. Conclusions
Author Contributions
Funding
Acknowledgments
Conflicts of Interest
References
- Yang, H. Deepening sunshine sports project and promoting adolescent’s fitness. J. Beijing Sport Univ. 2011, 34, 1–4. [Google Scholar]
- Lee, D.C.; Artero, E.G.; Sui, X.M.; Blair, S.N. Mortality trends in the general population: The importance of cardiorespiratory fitness. J. Psychopharmacol. 2010, 24, 27–35. [Google Scholar] [CrossRef] [PubMed]
- Ferreira, I.; Twisk, J.W.; Mechelen, W.; Kemper, H.C.; Stehouwer, C.D. Development of fatness, fitness, and lifestyle from adolescence to the age of 36 years: Determinants of the metabolic syndrome in young adults: The Amsterdam growth and health longitudinal study. Arch. Int. Med. 2005, 165, 42–48. [Google Scholar] [CrossRef] [PubMed]
- Pontifex, M.B.; Hillman, C.; Kramer, A.F.; Chaddock, L.; Voss, M.W.; Cohen, N.J.; Kramer, A.F.; Hillman, C.H. Cardiorespiratory fitness and the flexible modulation of cognitive control in preadolescent children. J. Cogn. Neurosci 2011, 23, 1332–1345. [Google Scholar] [CrossRef] [PubMed]
- Shah, R.V.; Murthy, V.L.; Colangelo, L.A.; Reis, J.; Venkatesh, B.A.; Sharma, R.; Abbasi, S.A.; Goff, D.C.Jr.; Carr, J.J.; Rana, J.S.; et al. Association of fitness in young adulthood with survival and cardiovascular risk: The coronary artery risk development in young adults (CARDIA) study. JAMA Int. Med. 2016, 176, 87–95. [Google Scholar] [CrossRef] [PubMed]
- Dos Santos, F.K.; Prista, A.; Gomes, T.N.Q.F.; Santos, D.; Damasceno, A.; Madeira, A.; Katzmarzyk, P.T.; Maia, J.A.R. Body mass index, cardiorespiratory fitness and cardiometabolic risk factors in youth from Portugal and Mozambique. Int. J. Obes. 2015, 39, 1467–1474. [Google Scholar] [CrossRef]
- Steele, R.M.; Brage, S.; Corder, K.; Wareham, N.J.; Ekelund, U. Physical activity, cardiorespiratory fitness, and the metabolic syndrome in youth. J. Appl. Physiol. 2008, 105, 342–351. [Google Scholar] [CrossRef] [Green Version]
- Mintjens, S.; Menting, M.D.; Daams, J.G.; Van Poppel, M.N.M.; Roseboom, T.J.; Gemke, R.J.B.J. Cardiorespiratory Fitness in Childhood and Adolescence Affects Future Cardiovascular Risk Factors: A Systematic Review of Longitudinal Studies. Sports Med. 2018, 48, 2577–2605. [Google Scholar] [CrossRef] [Green Version]
- Högström, G.; Nordström, A.; Nordström, P. Aerobic fitness in late adolescence and the risk of early death: A prospective cohort study of 1.3 million Swedish men. Int. J. Epidemiol. 2016. [Google Scholar] [CrossRef]
- Tomkinson, G.R.; Lang, J.J.; Tremblay, M.S.; Dale, M.; LeBlanc, A.G.; Belanger, K.; Ortega, F.B.; Léger, L. International normative 20 m shuttle run values from 1,142,026 children and youth representing 50 countries. Br. J. Sports Med. 2017, 51, 1545–1554. [Google Scholar] [CrossRef]
- Lang, J.J.; Tremblay, M.S.; Léger, L.; Olds, T.; Tomkinson, G.R. International variability in 20 m shuttle run performance in children and youth: Who are the fittest from a 50-country comparison? A systematic literature review with pooling of aggregate results. Br. J. Sports Med. 2018. [Google Scholar] [CrossRef] [PubMed]
- Ortega, F.B.; Ruiz, J.R.; Labayen, I.; Martínez-Gómez, D.; Vicente-Rodriguez, G.; Cuenca-García, M.; Gracia-Marco, L.; Manios, Y.; Beghin, L.; Molnar, D.; et al. Health Inequalities in Urban Adolescents: Role of Physical Activity, Diet, and Genetics. Pediatrics 2014, 133, e884–e895. [Google Scholar] [CrossRef] [PubMed]
- United Nations Development Programme. Human Development Reports. 2011. Available online: http://www.undp.org/content/dam/undp/library/corporate/HDR/2011%20Global%20HDR/English/HDR_2011_EN_Complete.pdf (accessed on 28 June 2019).
- The World Bank. Gini index (World Bank estimate). Available online: http://data.worldbank.org/indicator/SI.POV.GINI/countries?display=default (accessed on 28 June 2019).
- Wang, Q. Effects of urbanisation on energy consumption in China. Energy Policy 2014, 65, 332–339. [Google Scholar] [CrossRef]
- The World Bank. Urban population (% of total). Available online: http://data.worldbank.org/indicator/SP.URB.TOTL.INZS?display=default (accessed on 28 June 2019).
- Li, H.; Zhang, Y.; Ji, C. Secular change of cardiorespiratory fitness in Chinese children and adolescents: 1985-2010. J. Sci. Med. Sport 2012, 15, S56. [Google Scholar] [CrossRef]
- Sun, H.; Ma, Y.; Han, D.; Pan, C.W.; Xu, Y. Prevalence and trends in obesity among China’s children and adolescents, 1985–2010. PLoS ONE 2014, 9, 1–8. [Google Scholar] [CrossRef] [PubMed]
- Ren, H.; Zhou, Z.; Liu, W.K.; Wang, X.; Yin, Z. Excessive homework, inadequate sleep, physical inactivity and screen viewing time are major contributors to high paediatric obesity. Acta Paediatr. 2017, 106, 120–127. [Google Scholar] [CrossRef] [PubMed]
- Mak, K.K.; Ho, S.Y.; Lo, W.S.; McManus, A.M.; Lam, T.H. Prevalence of exercise and non-exercise physical activity in Chinese adolescents. Int. J. Behav. Nutr. Phys. Act. 2011, 8, 176–180. [Google Scholar] [CrossRef]
- Ministry of Education. Culture, Sports, Science and Technology. The Report of Survey on Physical Strength and Athletic Performance. Available online: http://www.mext.go.jp/a_menu/sports/kodomo /zencyo/1342657.htm (accessed on 18 October 2016).
- Kong, X.L. Evolution and enlightenment of Japanese urban and rural integration after the war. Expand. Horiz. 2008, 6, 94–96. [Google Scholar]
- Liu, Z.Y. Study on the Status, Venture and measure of the gap between the urban and the rural in China. J. Huazhong Univ. Sci. Technol. (Soc. Sci. Ed.) 2006, 20, 117–120. [Google Scholar]
- Ji, C.Y.; Chen, T.J.; Sun, X. Secular changes on the distribution of body mass index among Chinese children and adolescents, 1985–2010. Biomed. Env. Sci. 2013, 26, 520–530. [Google Scholar]
- WHO Child Growth Standards, Genava. World Health Organisation. Available online: http://www. who.int /growthref /en/ (accessed on 10 November 2010).
- Cooper Institute for Aerobics Research. The Prudential FITNESSGRAM Test Administration Manual; Cooper Institute for Aerobics Research: Dallas, TX, USA, 1992. [Google Scholar]
- Matsuzaka, A.; Takahashi, Y.; Yamazoe, M.; Kumakura, N.; Ikeda, A.; Wilk, B.; Bar-Or, O. Validity of the multistage 20-m shuttle run test for Japanese children adolescents and adults. Pediatr. Exerc. Sci. 2004, 23, 113–125. [Google Scholar] [CrossRef]
- Cole, T.J.; Green, P.J. Smoothing reference centile curves: the LMS method and penalized likelihood. Stat. Med. 1992, 11, 1305–1319. [Google Scholar] [CrossRef] [PubMed]
- Pan, H.; Cole, T. User’s Guide to LMS Chartmaker; Medical Research Council: London, UK, 2010; pp. 1–42. [Google Scholar]
- Bakkeli, N.Z. Income inequality and health in China: A panel data analysis. Soc. Sci. Med. 2016, 157, 39–47. [Google Scholar] [CrossRef] [PubMed]
- Murphy, R.; Stewart, A.W.; Hancox, R.J.; Wall, C.R.; Braithwaite, I.; Beasley, R.; Mitchell, E.A.; ISAAC Phase Three Study Group. Obesity, underweight and BMI distribution characteristics of children by gross national income and income inequality: Results from an international survey. Obes. Sci. Pr. 2018, 4, 216–228. [Google Scholar] [CrossRef]
- Li, M.; Yin, X.J.; Li, Y.Q.; Chai, X.J.; Ren, S.E.; Liu, Y.; Ling, M.M. Correlation between BMI and 20mSRT in Children and Adolescents. Chin. J. Sch. Health 2017, 38, 1773–1776. [Google Scholar]
- Al-Asiri, Z.A.; Shaheen, A.A.M. Body mass index and health related physical fitness in Saudi girls and adolescents aged 8-15 years. Open J. Reha 2015, 3, 116–125. [Google Scholar] [CrossRef]
- Shang, X.W.; Liu, A.L.; Li, Y.P.; Hu, X.Q.; Du, L.; Ma, J.; Xu, G.F.; Li, Y.; Guo, H.W.; Ma, G.S. The association of weight status with physical fitness among Chinese children. Int. J. Pediatr. 2010, 10, 1–6. [Google Scholar] [CrossRef] [PubMed]
- Cruz, A.G.; Suárez, J.F.; Ciro, J.O.; Rodríguez, C.N.; Gallo, V.J. Association between nutritional status and physical abilities in children aged 6-18 years in Medellin (Colombia). Pediatr. (Barc) 2014, 81, 343–351. [Google Scholar]
- Sun, Y.; Liu, Y.; Tao, F.B. Associations Between Active Commuting to School, Body Fat, and Mental Well-being: Population-Based, Cross-Sectional Study in China. J. Adolesc Health 2015, 57, 679–685. [Google Scholar] [CrossRef]
- Tanaka, C.; Tanaka, S.; Inoue, S.; Miyachi, M.; Suzuki, K.; Reilly, J.J. Results from Japan’s 2016 Report Card on Physical Activity for Children and Youth. J. Phys. Act. Health 2016, 13 (Suppl. 2), S189–S194. [Google Scholar] [CrossRef]
- Ramírez-Vélez, R.; García-Hermoso, A.; Agostinis-Sobrinho, C.; Mota, J.; Santos, R.; Correa-Bautista, J.E.; Amaya-Tambo, D.C.; Villa-González, E. Cycling to school and body composition, physical fitness, and metabolic syndrome in children and adolescents. J. Pediatr. 2017, 188, 57–63. [Google Scholar] [CrossRef] [PubMed]
- Voss, C.; Sandercock, G. Aerobic fitness and mode of travel to school in English schoolchildren. Med. Sci. Sports Exerc. 2010, 42, 281–287. [Google Scholar] [CrossRef] [PubMed]
- Yang, X.F.; Yin, X.J.; Li, Y.Q.; Chai, X.J.; Ren, S.E.; Liu, Y.; Ling, M.M. Associations between physical activity, screen time and 20-meter shuttle run test performances among Chinese Han children and adolescents. Chin. J. Sch. Health 2017, 38, 1769–1772. [Google Scholar]
- Cui, Z.; Dibley, M.J. Trends in dietary energy, fat, carbohydrate and protein intake in Chinese children and adolescents from 1991 to 2009. Br. J. Nutr. 2012, 7, 1292–1299. [Google Scholar] [CrossRef] [PubMed]
- Yu, A.Y.L.; López-Olmedo, N.; Popkin, B.M. Analysis of dietary trends in Chinese adolescents from 1991 to 2011. Asia Pac. J. Clin. Nutr. 2018, 27, 1106–1119. [Google Scholar] [PubMed]
- Cai, J.Y.; Wang, F.; Liu, X.X.; Dai, T. International experience and revelation of the child nutrition improvement measures. Chin. J. Health Educ. 2013, 29, 255–258. [Google Scholar]
- Sandercock, G.R.H.; Voss, C.; Dye, L. Associations between habitual school-day breakfast consumption, body mass index, physical activity and cardiorespiratory fitness in English schoolchildren. Eur. J. Clin. Nutr. 2010, 64, 1086–1092. [Google Scholar] [CrossRef] [Green Version]
- Thivel, D.; Aucouturier, J.; Isacco, L.; Lazaar, N.; Ratel, S.; Doré, E.; Meyer, M.; Duché, P. Are eating habits associated with physical fitness in primary school children? Eat. Behav. 2013, 14, 83–86. [Google Scholar] [CrossRef] [PubMed]
- Kohri, T.; Kaba, N.; Itoh, T.; Sasaki, S. Effects of the national school lunch program on bone growth in Japanese elementary school children. J. Nutr. Sci. Vitam. 2016, 62, 303–309. [Google Scholar] [CrossRef]
- Liu, A.L.; Duan, Y.F.; Hu, X.Q.; Zou, S.R.; Qin, A.P.; Ma, G.S. Change in snacking behaviors of children in four cities of China over 10 years. Chin. J. Sch. Health 2011, 32, 1415–1417. [Google Scholar]
- Hu, X.Q.; Fan, Y.O.; Hao, L.N.; Fan, J.W.; Pan, S.X.; Ma, S.G. Survey of breakfast behaviors among primary and secondary students in seven cities of China. Acta Nutr. Sin. 2010, 32, 39–42+46. [Google Scholar]
- Tambalis, K.D.; Panagiotakos, D.B.; Psarra, G.; Sidossis, L.S. Association of cardiorespiratory fitness levels with dietary habits and lifestyle factors in schoolchildren. Appl. Physiol. Nutr. Metab. 2019, 44, 539–545. [Google Scholar] [CrossRef] [PubMed]
- Luo, D.M.; Xu, R.B.; Hu, P.J.; Dong, B.; Zhang, B.; Song, Y.; Ma, J. Analysis on the current situation of insumcient sleep and its association with physical exercise among Chinese Han students aged 9–18 years, in 2014. Chin. J. Epidemiol. 2018, 39, 1298–1302. [Google Scholar]
- Ochiai, H.; Shirasawa, T.; Shimada, N.; Ohtsu, T.; Nishimura, R.; Morimoto, A.; Hoshino, H.; Tajima, N.; Kokaze, A. Sleep duration and overweight among elementary schoolchildren: A population-based study in Japan. Acta Med. Okayama 2012, 66, 93–99. [Google Scholar] [PubMed]


| Year | Country | Human Development Index (HDI) a | Gini Index b | Urban Population c | Urban Population d (% of total) d | Urban Population Growth (annual %) e |
|---|---|---|---|---|---|---|
| 2000 | China | 0.588 | - | 452,999.15 | 36 | 3.6 |
| Japan | 0.868 | - | 99,760.75 | 79 | 0.3 | |
| 2008 | China | - | 42.9 | 616,481.19 | 47 | 3.4 |
| Japan | - | 32.1 | 114,107.98 | 89 | 1.1 | |
| 2010 | China | 0.682 | - | 658,498.66 | 49 | 3.3 |
| Japan | 0.899 | - | 116,302.93 | 91 | 0.9 | |
| 2014 | China | - | - | 740,239.26 | 54 | 2.8 |
| Japan | - | - | 116,208.08 | 91 | 0.0 |
| Age (Year) | N1, N2 | Boy | N1, N2 | Girl | ||
|---|---|---|---|---|---|---|
| China | Japan | China | Japan | |||
| 7 | 192, 191 | 14.73 ± 5.51* | 29.08 ± 12.45 | 190, 192 | 14.66 ± 5.39 * | 21.96 ± 7.50 |
| 8 | 190, 190 | 17.68 ± 8.26 * | 33.39 ± 13.34 | 189, 191 | 17.03 ± 6.69 * | 25.95 ± 11.49 |
| 9 | 189, 188 | 19.52 ± 9.27 * | 43.77 ± 16.47 | 188, 192 | 19.68 ± 7.78 * | 32.89 ± 13.01 |
| 10 | 194, 192 | 22.41 ± 10.53 * | 50.93 ± 17.34 | 191, 190 | 19.34 ± 7.70 * | 38.35 ± 13.68 |
| 11 | 189, 178 | 26.08 ± 11.14 * | 62.44 ± 19.40 | 189, 192 | 23.90 ± 9.26 * | 46.02 ± 16.84 |
| 12 | 191, 170 | 32.61 ± 14.54 * | 87.10 ± 24.00 | 190, 191 | 26.32 ± 10.11 * | 54.25 ± 13.72 |
| 13 | 191, 191 | 38.81 ± 15.85 * | 70.86 ± 19.22 | 192, 194 | 32.55 ± 11.10 * | 41.24 ± 14.34 |
| 14 | 187, 193 | 46.34 ± 19.03 * | 76.70 ± 22.14 | 188, 193 | 32.06 ± 11.03 * | 36.09 ± 20.30 |
| 15 | 187, 166 | 52.58 ± 19.29 * | 83.91 ± 25.89 | 194, 171 | 30.90 ± 11.49 * | 52.88 ± 20.85 |
| 16 | 193, 179 | 56.43 ± 20.31 * | 77.57 ± 25.90 | 188, 188 | 33.55 ± 10.87 * | 44.05 ± 13.13 |
| 17 | 188, 180 | 57.63 ± 17.72 * | 80.91 ± 25.63 | 190, 187 | 34.45 ± 10.73 * | 46.23 ± 13.46 |
| 18 | 186, 185 | 59.20 ± 17.55 * | 91.71 ± 21.72 | 192, 183 | 36.69 ± 9.38* | 70.13 ± 22.40 |
| Total | 2277, 2203 | 36.91 ± 21.95 * | 65.14 ± 29.18 | 2281, 2264 | 26.78 ± 11.95 * | 42.29 ± 19.90 |
| Age (Year) | N1, N2 | Boy | N1, N2 | Girl | ||
|---|---|---|---|---|---|---|
| China | Japan | China | Japan | |||
| 7 | 192, 191 | 46.26 ± 3.36 * | 49.74 ± 3.39 | 190, 192 | 44.56 ± 2.41 * | 46.36 ± 2.16 |
| 8 | 190, 190 | 45.39 ± 4.03 * | 49.77 ± 3.71 | 189, 191 | 43.82 ± 3.31 * | 46.34 ± 2.97 |
| 9 | 189, 188 | 45.25 ± 3.75 * | 51.09 ± 4.26 | 188, 192 | 43.83 ± 3.19 * | 46.81 ± 3.66 |
| 10 | 194, 192 | 44.41 ± 4.41 * | 51.46 ± 4.99 | 191, 190 | 42.95 ± 3.71 * | 47.21 ± 3.76 |
| 11 | 189, 178 | 44.41 ± 4.42 * | 52.74 ± 5.04 | 189, 192 | 42.59 ± 3.31 * | 47.62 ± 4.72 |
| 12 | 191, 170 | 44.87 ± 5.25 * | 55.12 ± 4.41 | 190, 191 | 41.75 ± 4.28 * | 48.08 ± 3.42 |
| 13 | 191, 191 | 45.27 ± 5.29 * | 51.72 ± 4.77 | 192, 194 | 42.04 ± 3.96 * | 45.06 ± 3.20 |
| 14 | 187, 193 | 45.78 ± 6.32 * | 52.84 ± 5.15 | 188, 193 | 41.24 ± 3.82 * | 43.48 ± 4.11 |
| 15 | 187, 166 | 45.73 ± 5.93 * | 53.02 ± 5.87 | 194, 171 | 39.59 ± 4.28 * | 44.19 ± 5.04 |
| 16 | 193, 179 | 45.45 ± 6.23 * | 50.76 ± 5.57 | 188, 188 | 39.87 ± 3.84 * | 42.19 ± 3.06 |
| 17 | 188, 180 | 44.94 ± 5.19 * | 50.69 ± 5.53 | 190, 187 | 39.43 ± 3.64 * | 41.69 ± 3.27 |
| 18 | 186, 185 | 45.07 ± 5.14 * | 51.80 ± 5.60 | 192, 183 | 39.82 ± 3.41 * | 46.50 ± 5.08 |
| Total | 2277, 2203 | 45.23 ± 5.04 * | 51.69 ± 5.09 | 2281, 2264 | 41.78 ± 4.02 * | 45.48 ± 4.29 |
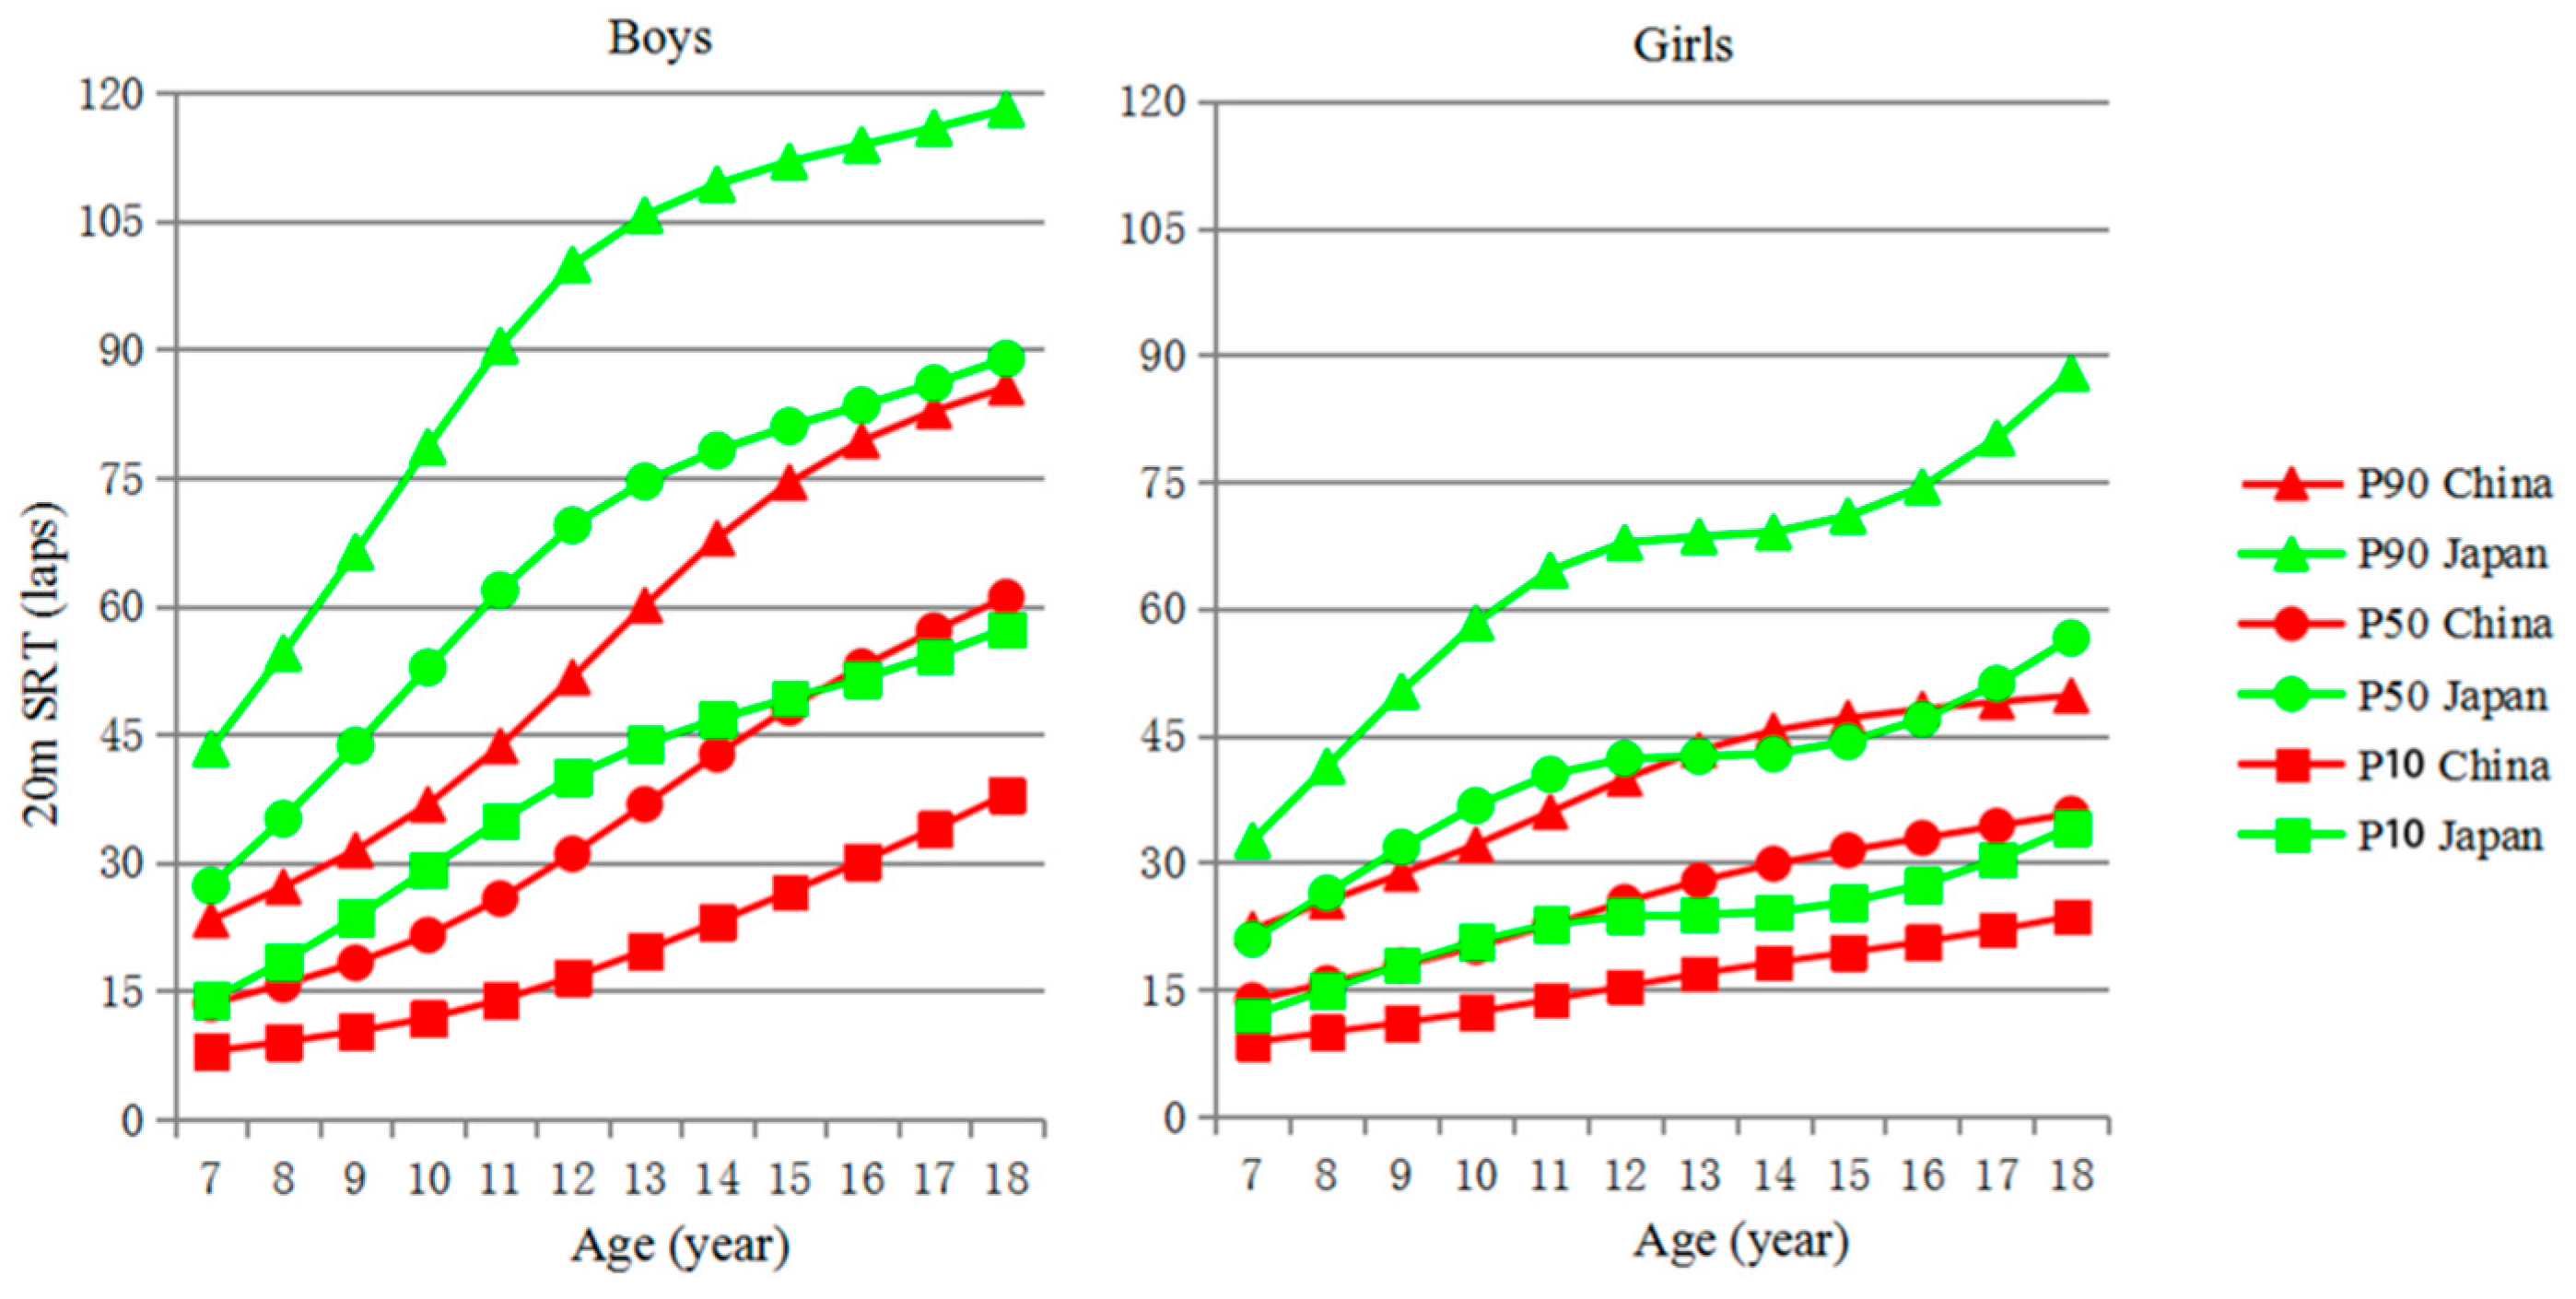
| Sex | Age (Year) | L | M | S | China | L | M | S | Japan | ||||
|---|---|---|---|---|---|---|---|---|---|---|---|---|---|
| P10 | P50 | P90 | P10 | P50 | P90 | ||||||||
| Boy | 7 | −0.05 | 13.51 | 0.42 | 7.95 | 13.51 | 23.29 | 0.67 | 27.28 | 0.42 | 13.93 | 27.28 | 43.32 |
| 8 | 0.03 | 15.76 | 0.43 | 9.06 | 15.76 | 27.17 | 0.72 | 35.12 | 0.40 | 18.43 | 35.12 | 54.50 | |
| 9 | 0.11 | 18.28 | 0.44 | 10.26 | 18.28 | 31.44 | 0.77 | 43.69 | 0.38 | 23.55 | 43.69 | 66.32 | |
| 10 | 0.19 | 21.52 | 0.44 | 11.82 | 21.52 | 36.80 | 0.82 | 52.83 | 0.37 | 29.20 | 52.83 | 78.61 | |
| 11 | 0.28 | 25.79 | 0.44 | 13.94 | 25.79 | 43.63 | 0.87 | 61.85 | 0.35 | 34.95 | 61.85 | 90.42 | |
| 12 | 0.36 | 31.02 | 0.44 | 16.61 | 31.02 | 51.67 | 0.92 | 69.45 | 0.34 | 40.03 | 69.45 | 99.92 | |
| 13 | 0.44 | 36.82 | 0.43 | 19.71 | 36.82 | 60.08 | 0.97 | 74.58 | 0.32 | 43.86 | 74.58 | 105.67 | |
| 14 | 0.52 | 42.67 | 0.41 | 23.07 | 42.67 | 67.94 | 1.02 | 78.20 | 0.31 | 46.79 | 78.20 | 109.32 | |
| 15 | 0.60 | 48.12 | 0.39 | 26.57 | 48.12 | 74.46 | 1.07 | 81.04 | 0.30 | 49.22 | 81.04 | 111.95 | |
| 16 | 0.68 | 52.92 | 0.36 | 30.17 | 52.92 | 79.34 | 1.12 | 83.46 | 0.29 | 51.53 | 83.46 | 113.91 | |
| 17 | 0.77 | 57.13 | 0.34 | 33.93 | 57.13 | 82.83 | 1.18 | 86.04 | 0.28 | 54.20 | 86.04 | 115.88 | |
| 18 | 0.85 | 61.05 | 0.31 | 37.97 | 61.05 | 85.57 | 1.23 | 88.92 | 0.26 | 57.36 | 88.92 | 118.08 | |
| Girl | 7 | −0.14 | 13.67 | 0.36 | 8.73 | 13.67 | 22.10 | 0.47 | 20.91 | 0.38 | 11.95 | 20.91 | 32.56 |
| 8 | −0.08 | 15.71 | 0.37 | 9.89 | 15.71 | 25.36 | 0.45 | 26.34 | 0.39 | 14.94 | 26.34 | 41.35 | |
| 9 | −0.01 | 17.77 | 0.37 | 11.04 | 17.77 | 28.64 | 0.44 | 31.78 | 0.40 | 17.94 | 31.78 | 50.21 | |
| 10 | 0.06 | 20.00 | 0.37 | 12.28 | 20.00 | 32.08 | 0.42 | 36.69 | 0.40 | 20.65 | 36.69 | 58.31 | |
| 11 | 0.13 | 22.58 | 0.37 | 13.75 | 22.58 | 35.96 | 0.40 | 40.39 | 0.40 | 22.67 | 40.39 | 64.52 | |
| 12 | 0.20 | 25.30 | 0.37 | 15.33 | 25.30 | 39.87 | 0.39 | 42.25 | 0.41 | 23.67 | 42.25 | 67.81 | |
| 13 | 0.27 | 27.81 | 0.37 | 16.84 | 27.81 | 43.24 | 0.37 | 42.53 | 0.41 | 23.83 | 42.53 | 68.53 | |
| 14 | 0.34 | 29.82 | 0.36 | 18.15 | 29.82 | 45.58 | 0.35 | 42.83 | 0.41 | 24.11 | 42.83 | 69.05 | |
| 15 | 0.41 | 31.42 | 0.34 | 19.34 | 31.42 | 47.07 | 0.34 | 44.28 | 0.40 | 25.29 | 44.28 | 70.94 | |
| 16 | 0.48 | 32.87 | 0.33 | 20.60 | 32.87 | 48.12 | 0.32 | 46.94 | 0.39 | 27.35 | 46.94 | 74.39 | |
| 17 | 0.55 | 34.30 | 0.31 | 22.02 | 34.30 | 48.95 | 0.30 | 51.12 | 0.38 | 30.36 | 51.12 | 80.16 | |
| 18 | 0.62 | 35.74 | 0.29 | 23.60 | 35.74 | 49.70 | 0.29 | 56.52 | 0.37 | 34.12 | 56.52 | 87.82 | |
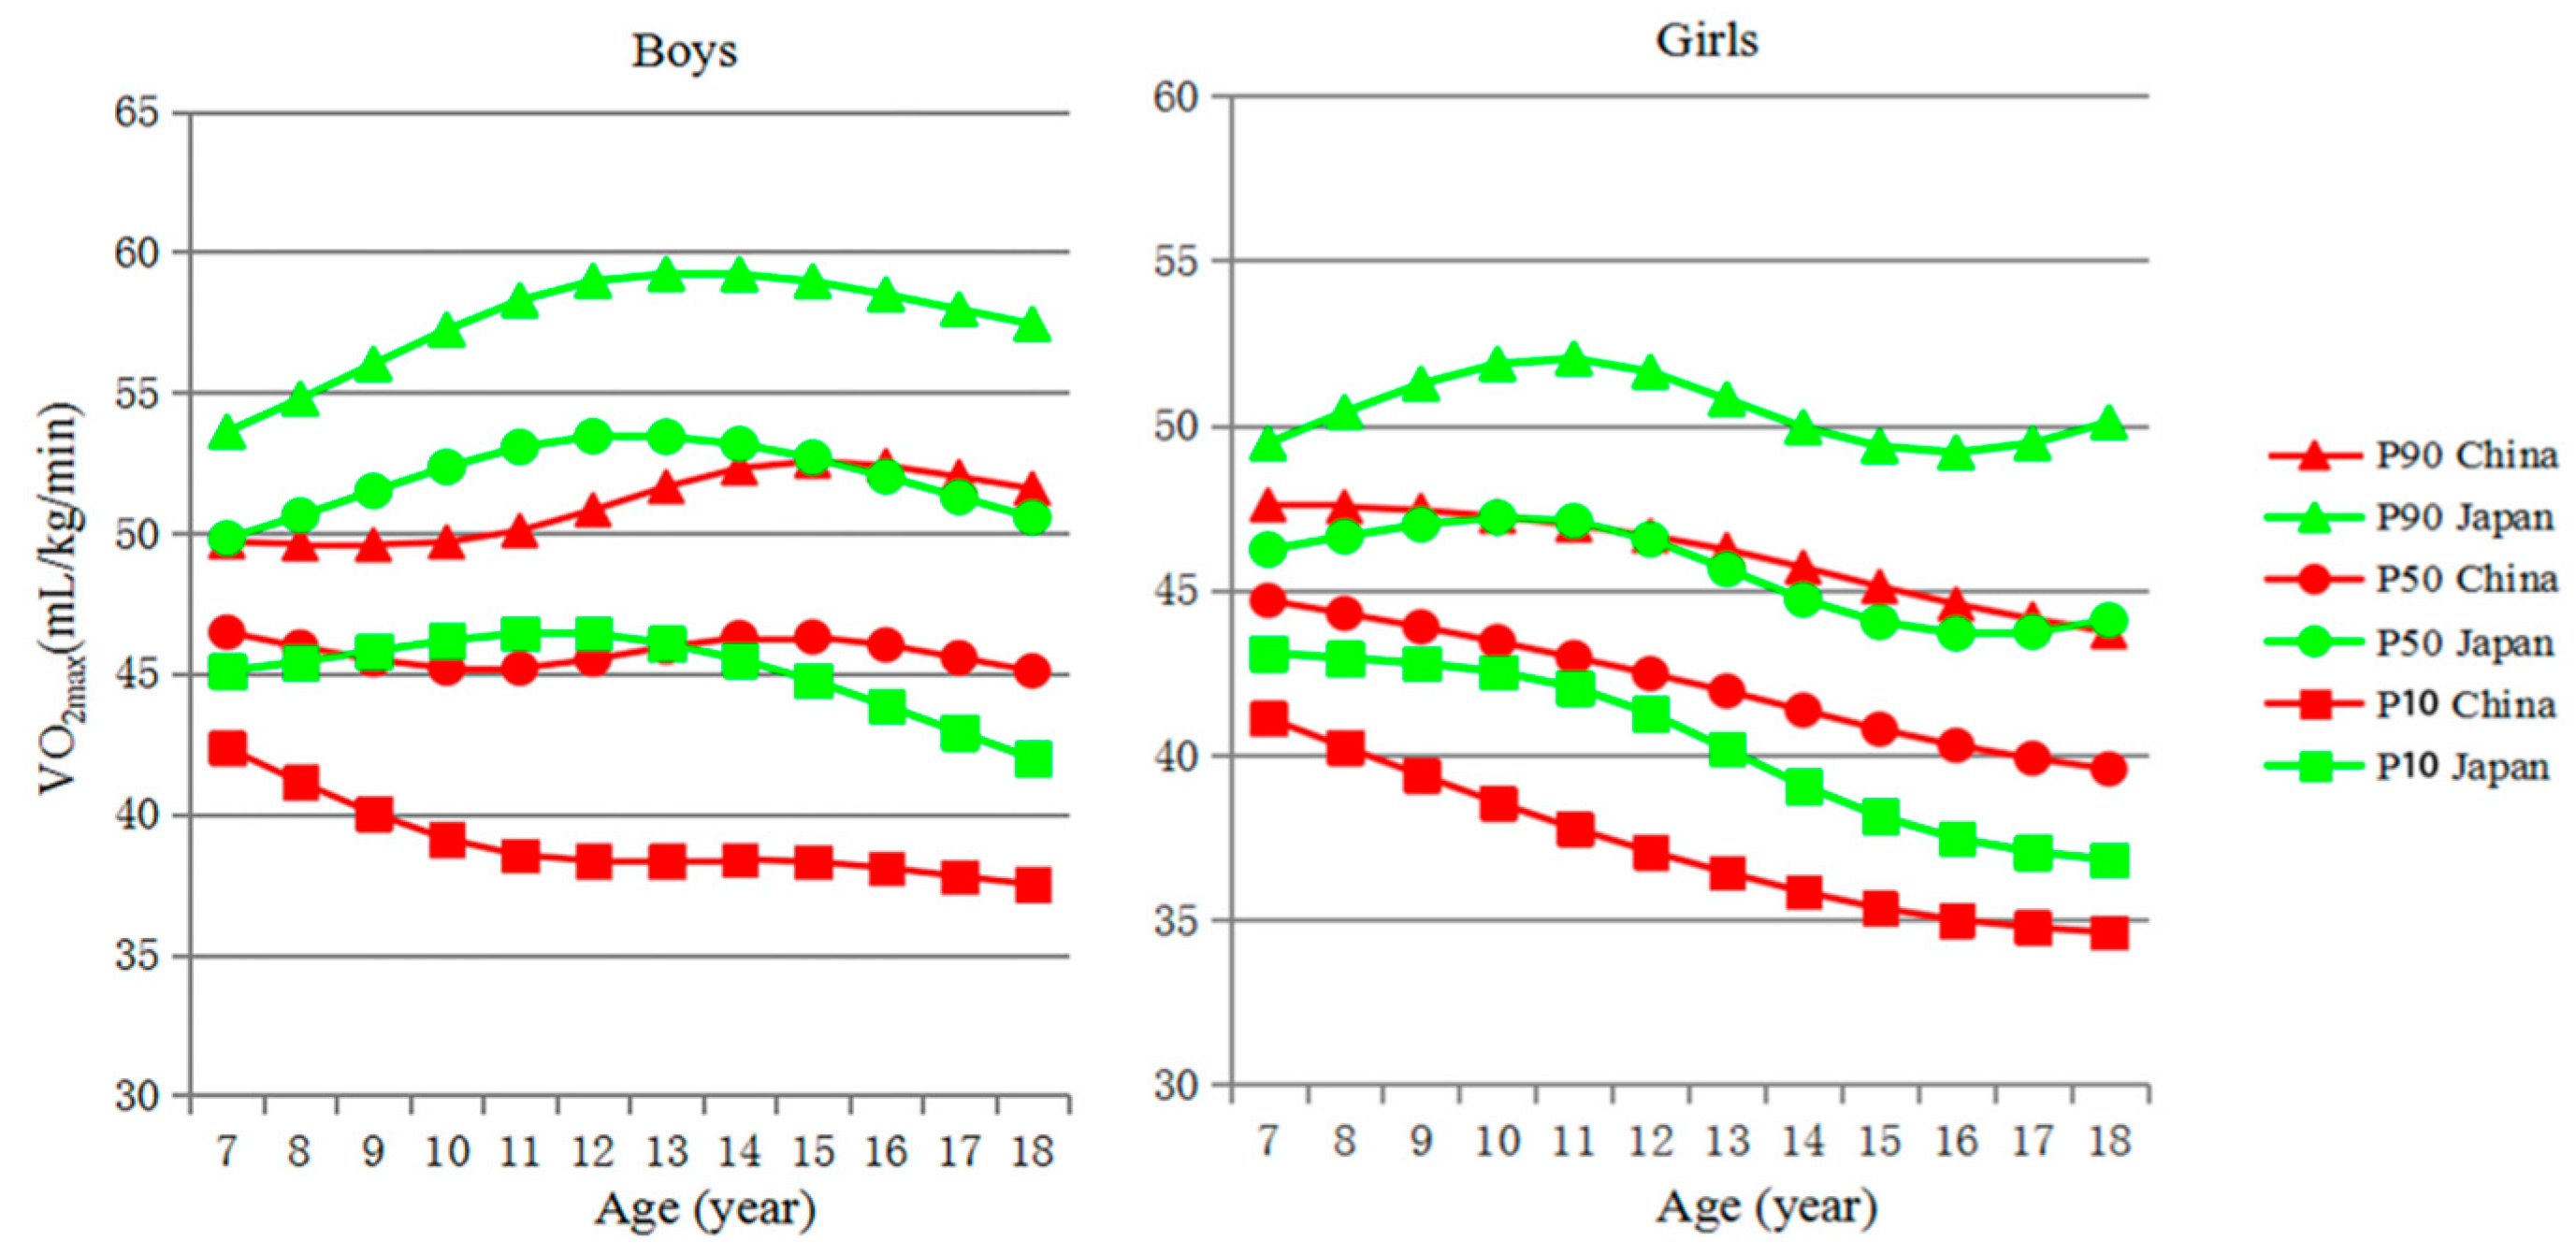
| Sex | Age (Year) | L | M | S | China | L | M | S | Japan | ||||
|---|---|---|---|---|---|---|---|---|---|---|---|---|---|
| P10 | P50 | P90 | P10 | P50 | P90 | ||||||||
| Boy | 7 | 4.15 | 46.47 | 0.06 | 42.35 | 46.47 | 49.68 | 3.52 | 49.80 | 0.07 | 45.09 | 49.80 | 53.60 |
| 8 | 3.95 | 45.94 | 0.07 | 41.14 | 45.94 | 49.60 | 3.42 | 50.62 | 0.07 | 45.42 | 50.62 | 54.77 | |
| 9 | 3.76 | 45.49 | 0.08 | 40.03 | 45.49 | 49.58 | 3.32 | 51.49 | 0.08 | 45.80 | 51.49 | 56.01 | |
| 10 | 3.56 | 45.18 | 0.09 | 39.11 | 45.18 | 49.67 | 3.22 | 52.35 | 0.08 | 46.17 | 52.35 | 57.23 | |
| 11 | 3.37 | 45.18 | 0.10 | 38.54 | 45.18 | 50.08 | 3.12 | 53.05 | 0.09 | 46.43 | 53.05 | 58.27 | |
| 12 | 3.17 | 45.50 | 0.10 | 38.34 | 45.50 | 50.82 | 3.02 | 53.44 | 0.09 | 46.42 | 53.44 | 58.96 | |
| 13 | 2.98 | 45.94 | 0.11 | 38.34 | 45.94 | 51.64 | 2.92 | 53.42 | 0.09 | 46.07 | 53.42 | 59.21 | |
| 14 | 2.78 | 46.28 | 0.11 | 38.38 | 46.28 | 52.30 | 2.83 | 53.16 | 0.10 | 45.50 | 53.16 | 59.20 | |
| 15 | 2.59 | 46.30 | 0.12 | 38.30 | 46.30 | 52.55 | 2.73 | 52.68 | 0.10 | 44.75 | 52.68 | 58.95 | |
| 16 | 2.39 | 46.02 | 0.12 | 38.08 | 46.02 | 52.39 | 2.63 | 52.01 | 0.11 | 43.86 | 52.01 | 58.48 | |
| 17 | 2.20 | 45.56 | 0.12 | 37.79 | 45.56 | 52.00 | 2.53 | 51.28 | 0.11 | 42.92 | 51.28 | 57.95 | |
| 18 | 2.00 | 45.09 | 0.12 | 37.50 | 45.09 | 51.58 | 2.43 | 50.55 | 0.12 | 41.98 | 50.55 | 57.43 | |
| Girl | 7 | 3.86 | 44.68 | 0.06 | 41.12 | 44.68 | 47.58 | 0.58 | 46.22 | 0.05 | 43.09 | 46.22 | 49.45 |
| 8 | 3.74 | 44.29 | 0.06 | 40.24 | 44.29 | 47.52 | 0.73 | 46.63 | 0.06 | 42.94 | 46.63 | 50.40 | |
| 9 | 3.61 | 43.88 | 0.07 | 39.39 | 43.88 | 47.41 | 0.88 | 46.99 | 0.07 | 42.78 | 46.99 | 51.25 | |
| 10 | 3.49 | 43.43 | 0.08 | 38.56 | 43.43 | 47.23 | 1.03 | 47.20 | 0.08 | 42.53 | 47.20 | 51.86 | |
| 11 | 3.37 | 42.95 | 0.08 | 37.78 | 42.95 | 46.97 | 1.18 | 47.09 | 0.08 | 42.06 | 47.09 | 52.02 | |
| 12 | 3.25 | 42.46 | 0.09 | 37.07 | 42.46 | 46.64 | 1.33 | 46.54 | 0.09 | 41.26 | 46.54 | 51.62 | |
| 13 | 3.12 | 41.94 | 0.09 | 36.43 | 41.94 | 46.22 | 1.48 | 45.64 | 0.09 | 40.18 | 45.64 | 50.79 | |
| 14 | 3.00 | 41.35 | 0.09 | 35.85 | 41.35 | 45.69 | 1.63 | 44.71 | 0.09 | 39.07 | 44.71 | 49.94 | |
| 15 | 2.88 | 40.78 | 0.09 | 35.35 | 40.78 | 45.10 | 1.79 | 44.04 | 0.10 | 38.15 | 44.04 | 49.36 | |
| 16 | 2.76 | 40.29 | 0.09 | 35.00 | 40.29 | 44.57 | 1.94 | 43.69 | 0.10 | 37.47 | 43.69 | 49.17 | |
| 17 | 2.63 | 39.89 | 0.09 | 34.77 | 39.89 | 44.12 | 2.09 | 43.74 | 0.11 | 37.06 | 43.74 | 49.45 | |
| 18 | 2.51 | 39.57 | 0.09 | 34.62 | 39.57 | 43.73 | 2.24 | 44.08 | 0.12 | 36.83 | 44.08 | 50.09 | |
| Age (Year) | Country | Boy | Girl | ||||||||||
|---|---|---|---|---|---|---|---|---|---|---|---|---|---|
| N | Underweight | Normal Weight | Overweight | Obese | p value | N | Underweight | Normal Weight | Overweight | Obese | p value | ||
| 7 | China | 192 | 6 (3.1) | 129 (67.2) | 27 (14.1) | 30 (15.6) | 0.002 | 190 | 3 (1.6) | 146 (76.8) | 26 (13.7) | 15 (7.9) | 0.001 |
| Japan | 191 | 5 (2.6) | 158 (82.7) | 18 (9.4) | 10 (5.2) | 192 | 0 (0.0) | 170 (88.5) | 20 (10.4) | 2 (1.0) | |||
| 8 | China | 190 | 3 (1.6) | 107 (56.3) | 40 (21.1) | 40 (21.1) | <0.001 | 189 | 9 (4.8) | 123 (65.1) | 35 (18.5) | 22 (11.6) | <0.001 |
| Japan | 190 | 3 (1.6) | 153 (80.5) | 21 (11.1) | 13 (6.8) | 191 | 3 (1.6) | 160 (83.8) | 24 (12.6) | 4 (2.1) | |||
| 9 | China | 189 | 9 (4.8) | 104 (55.0) | 38 (20.1) | 38 (20.1) | <0.001 | 188 | 12 (6.4) | 130 (69.1) | 34 (18.1) | 12 (6.4) | 0.015 |
| Japan | 188 | 0 (0.0) | 159 (84.6) | 17 (9.0) | 12 (6.4) | 192 | 4 (2.1) | 158 (82.3) | 24 (12.5) | 6 (3.1) | |||
| 10 | China | 194 | 4 (2.1) | 106 (54.6) | 49 (25.3) | 35 (18.0) | <0.001 | 191 | 18 (9.4) | 132 (69.1) | 29 (15.2) | 12 (6.3) | <0.001 |
| Japan | 192 | 4 (2.1) | 156 (81.3) | 20 (10.4) | 12 (6.3) | 190 | 2 (1.1) | 167 (87.9) | 15 (7.9) | 6 (3.2) | |||
| 11 | China | 189 | 5 (2.6) | 107 (56.6) | 47 (24.9) | 30 (15.9) | <0.001 | 189 | 2 (1.1) | 143 (75.7) | 33 (17.5) | 11 (5.8) | 0.032 |
| Japan | 178 | 2 (1.1) | 145 (81.5) | 22 (12.4) | 9 (5.1) | 192 | 8 (4.2) | 156 (81.3) | 24 (12.5) | 4 (2.1) | |||
| 12 | China | 191 | 4 (2.1) | 127 (66.5) | 35 (18.3) | 25 (13.1) | <0.001 | 190 | 12(6.3) | 131 (68.9) | 32 (16.8) | 15 (7.9) | <0.001 |
| Japan | 170 | 3 (1.8) | 114 (67.1) | 38 (22.3) | 15 (8.8) | 191 | 8 (4.2) | 173 (90.6) | 10 (5.2) | 0 (0.0) | |||
| 13 | China | 191 | 7 (3.7) | 125 (65.4) | 36 (18.8) | 23 (12.0) | <0.001 | 192 | 5 (2.6) | 146 (76.0) | 30 (15.6) | 11 (5.7) | <0.001 |
| Japan | 191 | 5 (2.6) | 160 (83.8) | 21 (11.0) | 5 (2.6) | 194 | 6 (3.1) | 183 (94.3) | 4 (2.1) | 1 (0.5) | |||
| 14 | China | 187 | 8 (4.3) | 128 (68.4) | 33 (17.6) | 18(9.6) | <0.001 | 188 | 7 (3.7) | 157 (83.5) | 16 (8.5) | 8 (4.3) | 0.224 |
| Japan | 193 | 4 (2.1) | 173 (89.6) | 14 (7.3) | 2 (1.0) | 193 | 7 (3.6) | 173 (89.6) | 10 (5.2) | 3 (1.6) | |||
| 15 | China | 187 | 11 (5.9) | 119 (63.6) | 39 (20.9) | 18 (9.6) | 0.001 | 194 | 10 (5.2) | 146 (75.3) | 28 (14.4) | 10 (5.2) | 0.009 |
| Japan | 166 | 9 (5.4) | 135 (81.3) | 17 (10.2) | 5 (3.0) | 171 | 2 (1.2) | 143 (83.6) | 25 (14.6) | 1 (0.6) | |||
| 16 | China | 193 | 2 (1.0) | 143 (74.1) | 28 (14.5) | 20 (10.4) | 0.001 | 188 | 5 (2.7) | 161 (85.6) | 18 (9.6) | 4 (2.1) | 0.101 |
| Japan | 179 | 6 (3.4) | 150 (83.8) | 20 (11.2) | 3 (1.7) | 188 | 4 (2.1) | 173 (92.0) | 11 (5.9) | 0 (0.0) | |||
| 17 | China | 188 | 3 (1.6) | 136 (72.3) | 37 (19.7) | 12 (6.4) | <0.001 | 190 | 1 (0.5) | 167 (87.9) | 21 (11.1) | 1 (0.5) | 0.568 |
| Japan | 180 | 4 (2.2) | 160 (88.9) | 14 (7.8) | 2 (1.1) | 187 | 1 (0.5) | 171 (91.4) | 15 (8.0) | 0 (0.0) | |||
| 18 | China | 186 | 14 (7.5) | 139 (74.7) | 24 (12.9) | 9 (4.8) | 0.488 | 192 | 3 (1.6) | 174 (90.6) | 11 (5.7) | 4 (2.1) | 0.517 |
| Japan | 185 | 8 (4.3) | 149 (80.5) | 21 (11.4) | 7 (3.8) | 183 | 5 (2.7) | 167 (91.3) | 10 (5.5) | 1(0.5) | |||
| Total | China | 2277 | 76 (3.3) | 1470 (64.6) | 433 (19.0) | 298 (13.1) | <0.001 | 2281 | 87(3.8) | 1756 (77.0) | 313 (13.7) | 125 (5.5) | <0.001 |
| Japan | 2203 | 53 (2.4) | 1812 (82.3) | 243 (11.0) | 95 (4.3) | 2264 | 50 (2.2) | 1994 (88.1) | 192 (8.5) | 28 (1.2) | |||
© 2019 by the authors. Licensee MDPI, Basel, Switzerland. This article is an open access article distributed under the terms and conditions of the Creative Commons Attribution (CC BY) license (http://creativecommons.org/licenses/by/4.0/).
Share and Cite
Yang, X.; Yin, X.; Ji, L.; Song, G.; Wu, H.; Li, Y.; Wang, G.; Bi, C.; Sun, Y.; Li, M.; et al. Differences in Cardiorespiratory Fitness between Chinese and Japanese Children and Adolescents. Int. J. Environ. Res. Public Health 2019, 16, 2316. https://doi.org/10.3390/ijerph16132316
Yang X, Yin X, Ji L, Song G, Wu H, Li Y, Wang G, Bi C, Sun Y, Li M, et al. Differences in Cardiorespiratory Fitness between Chinese and Japanese Children and Adolescents. International Journal of Environmental Research and Public Health. 2019; 16(13):2316. https://doi.org/10.3390/ijerph16132316
Chicago/Turabian StyleYang, Xiaofang, Xiaojian Yin, Liu Ji, Ge Song, Huipan Wu, Yuqiang Li, Guodong Wang, Cunjian Bi, Yi Sun, Ming Li, and et al. 2019. "Differences in Cardiorespiratory Fitness between Chinese and Japanese Children and Adolescents" International Journal of Environmental Research and Public Health 16, no. 13: 2316. https://doi.org/10.3390/ijerph16132316