A Case Study Describing a Community-Engaged Approach for Evaluating Polycyclic Aromatic Hydrocarbon Exposure in a Native American Community

 ,
,
Abstract
:1. Introduction
2. Methods
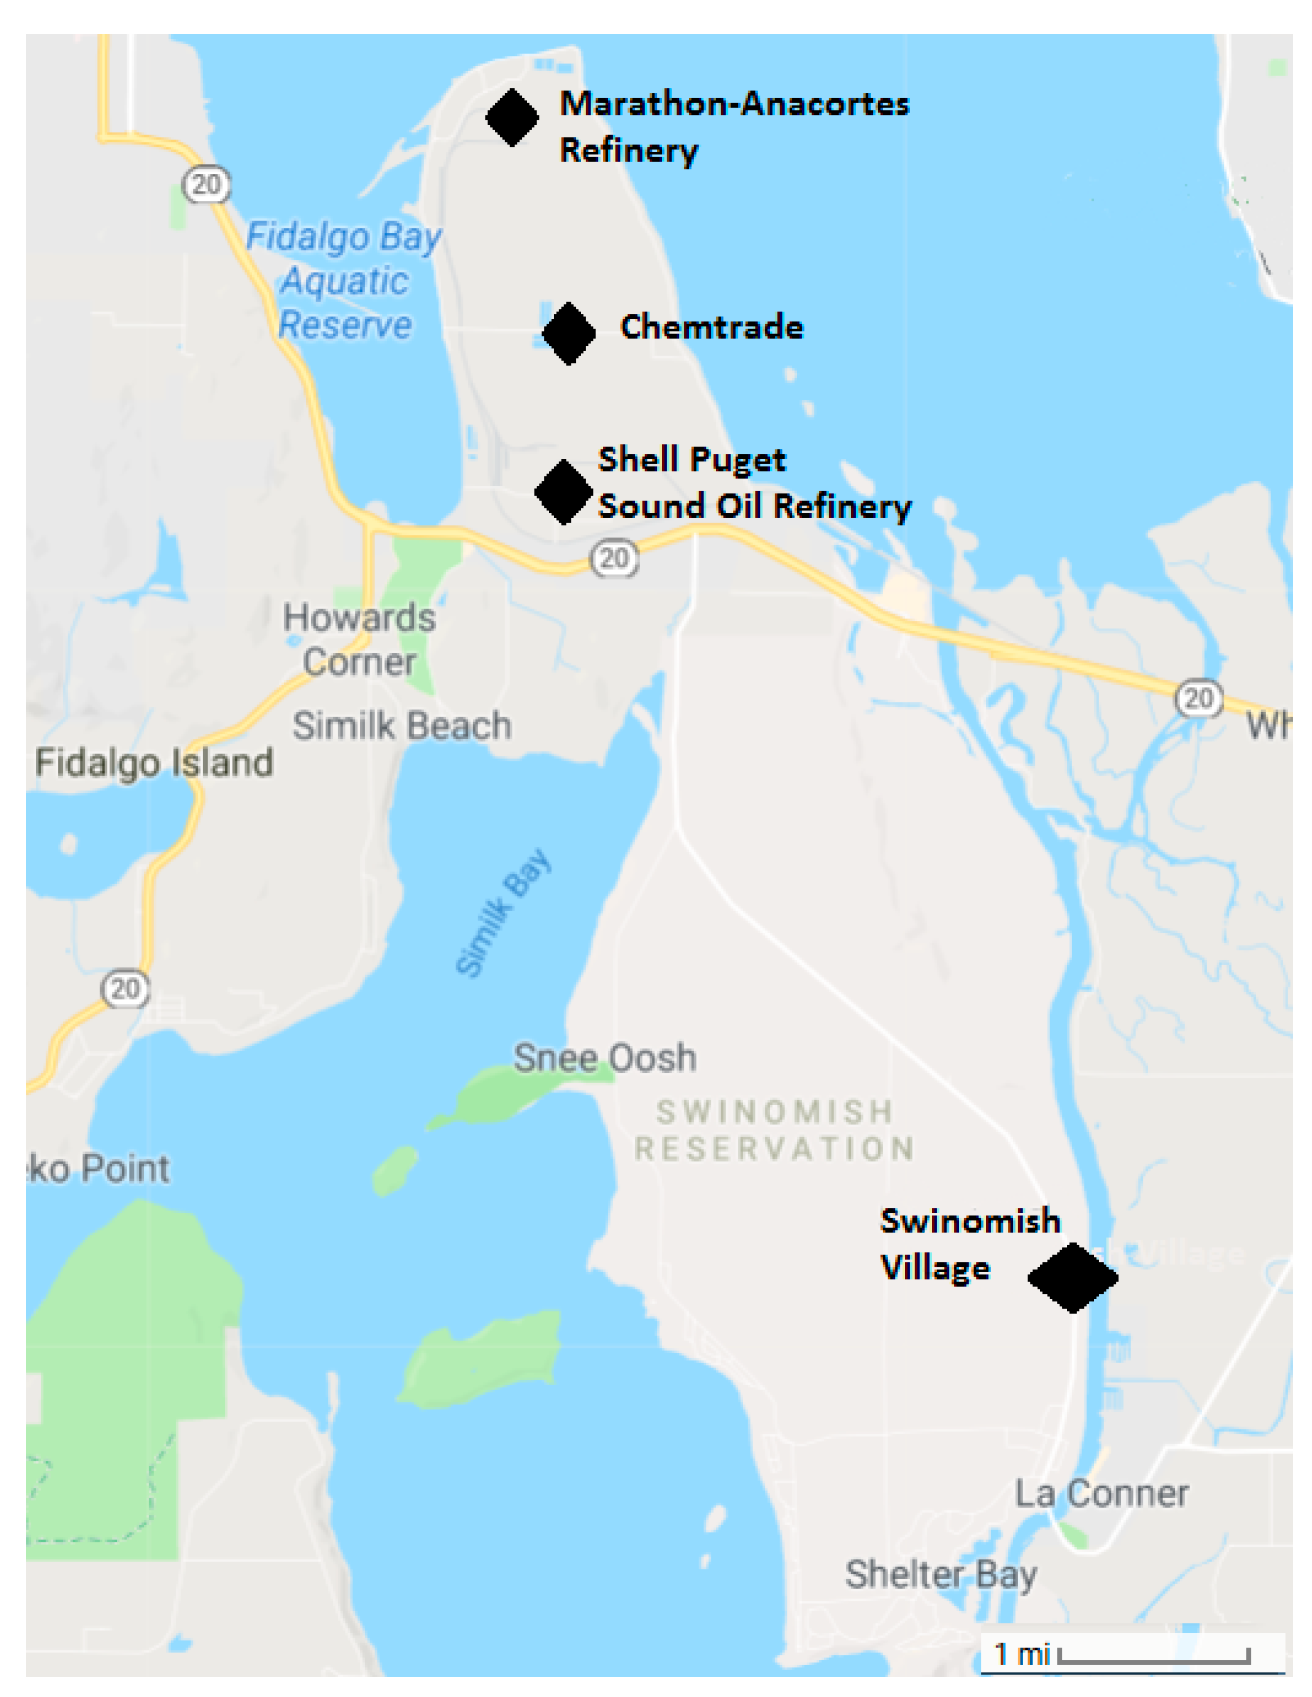
2.1. Study Location and Population
2.2. Ethical Statement
2.3. Ambient Temperature
2.4. Exposure Assessment
2.5. Covariates
2.6. Statistical Analysis
2.7. Procedures for Reporting Results
2.7.1. Individual Data Reports
2.7.2. Aggregate Data Report
3. Results
3.1. Compliance
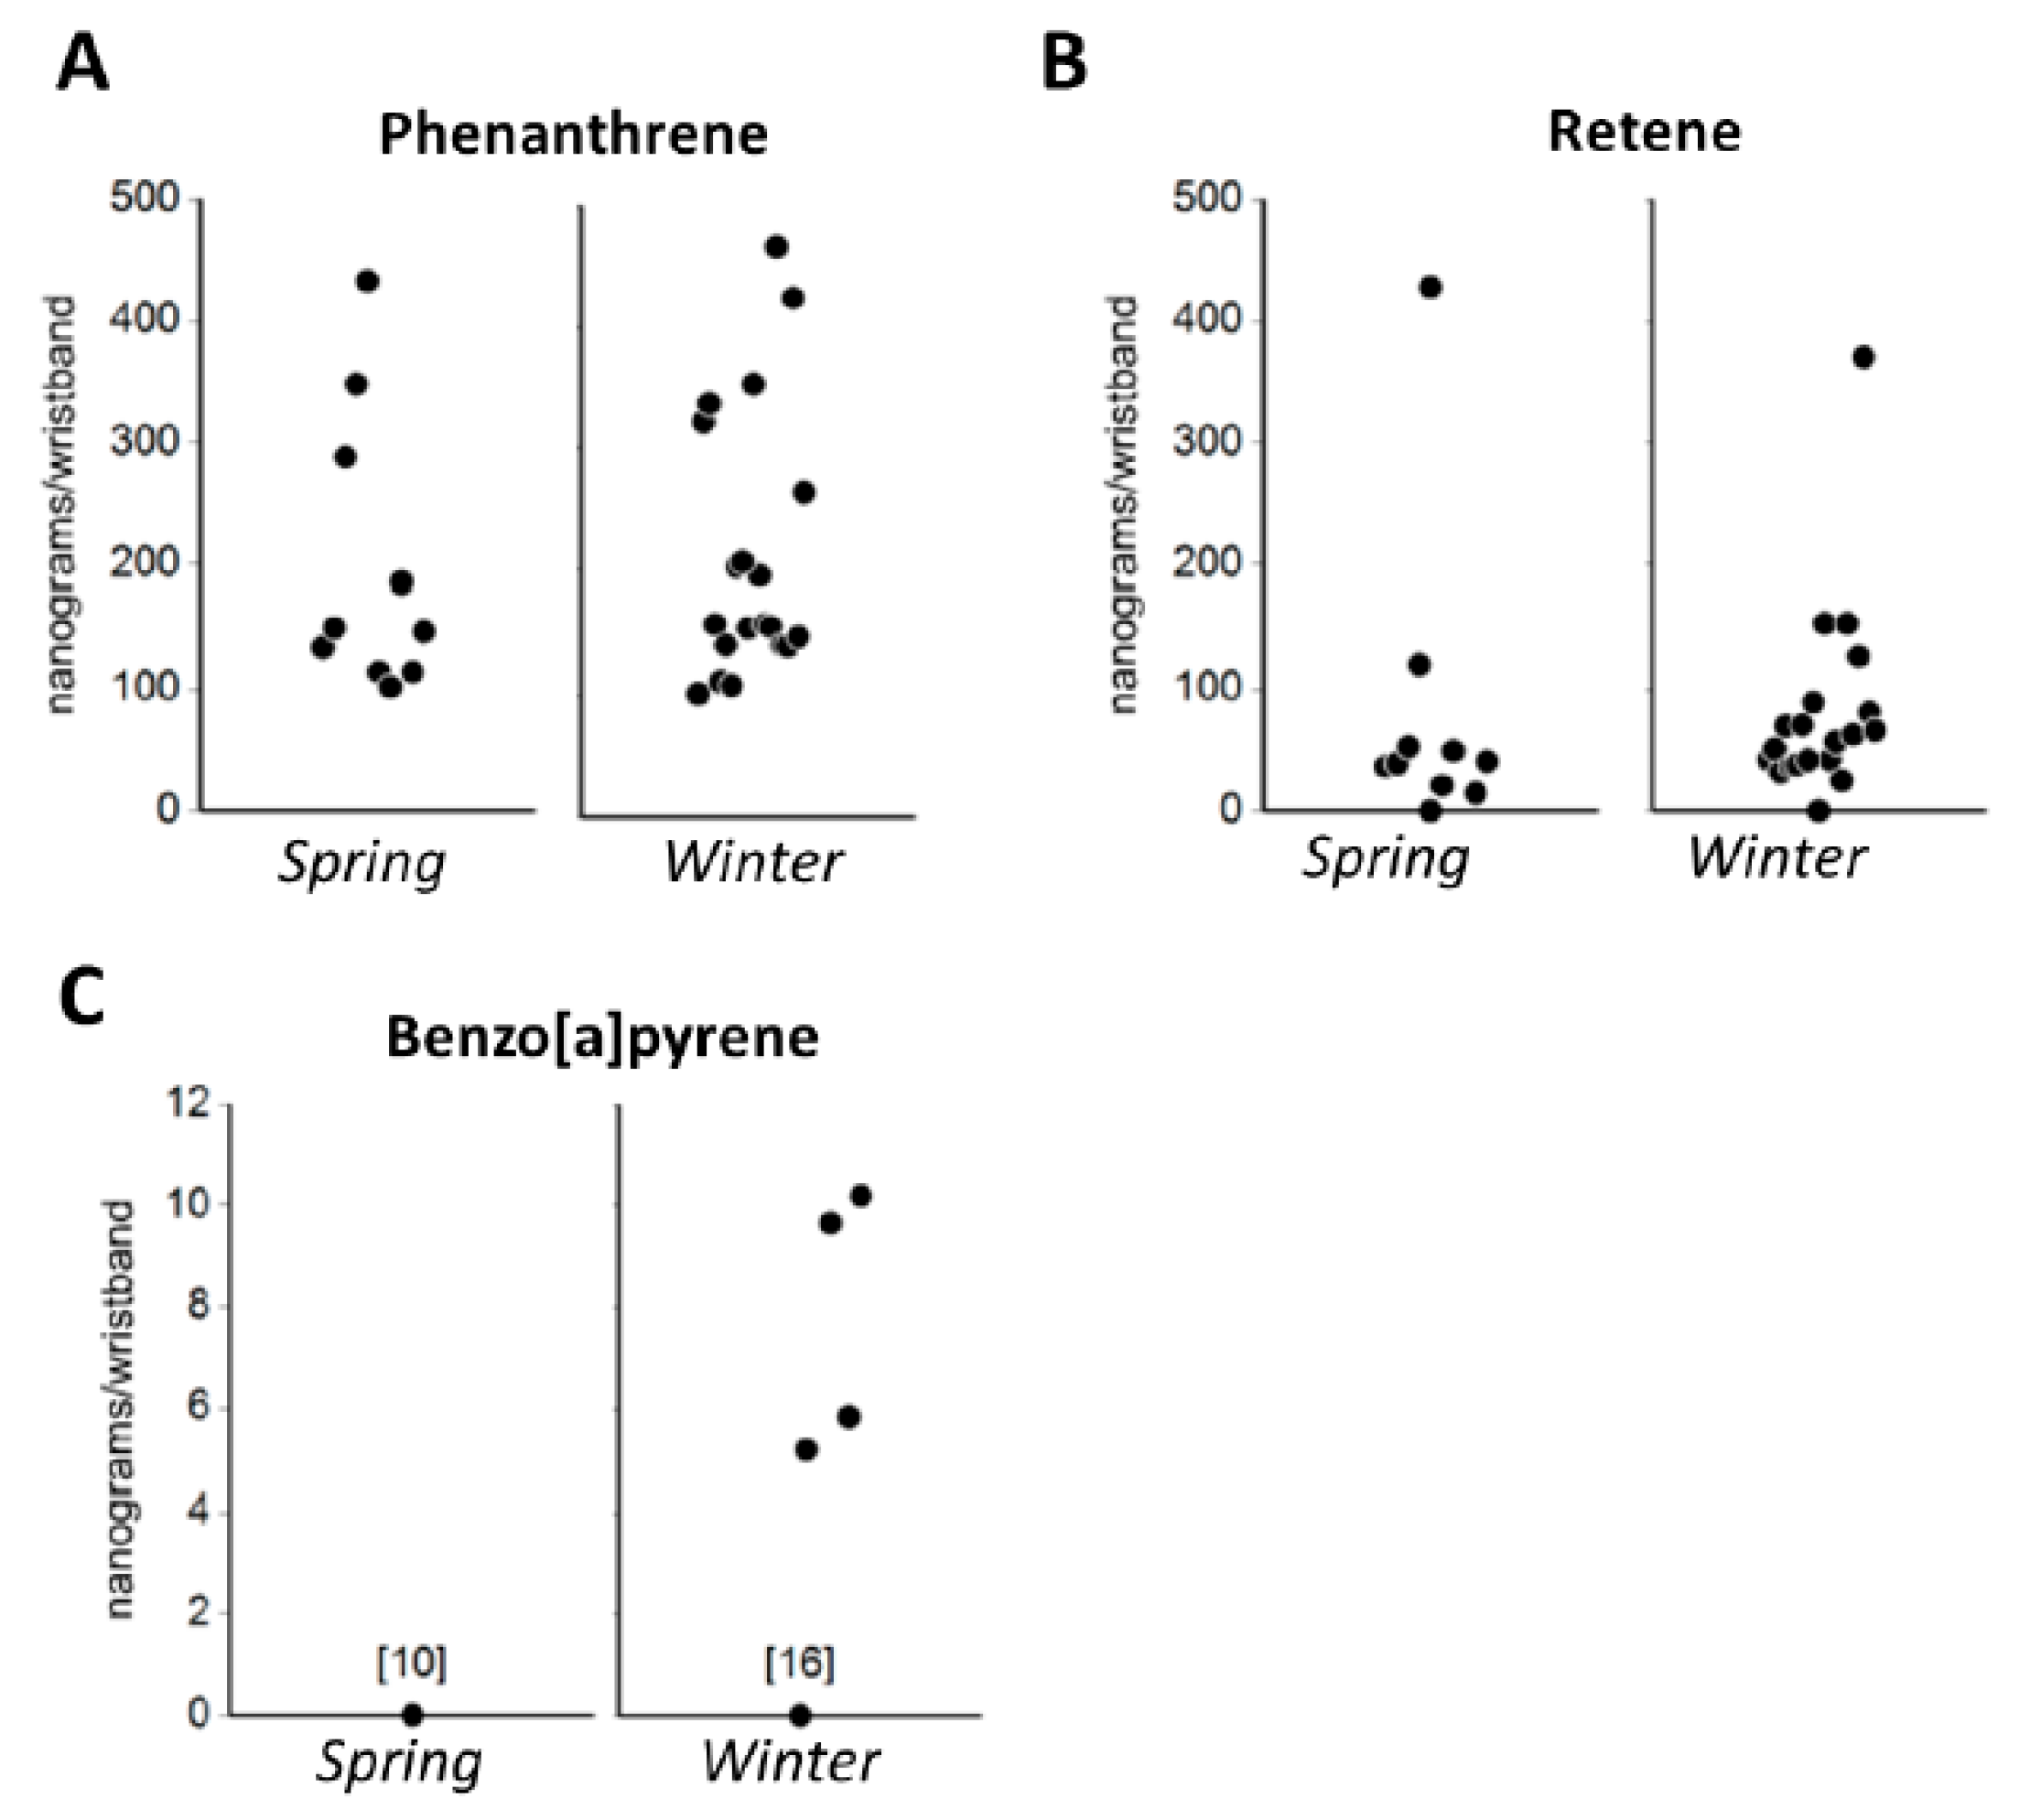
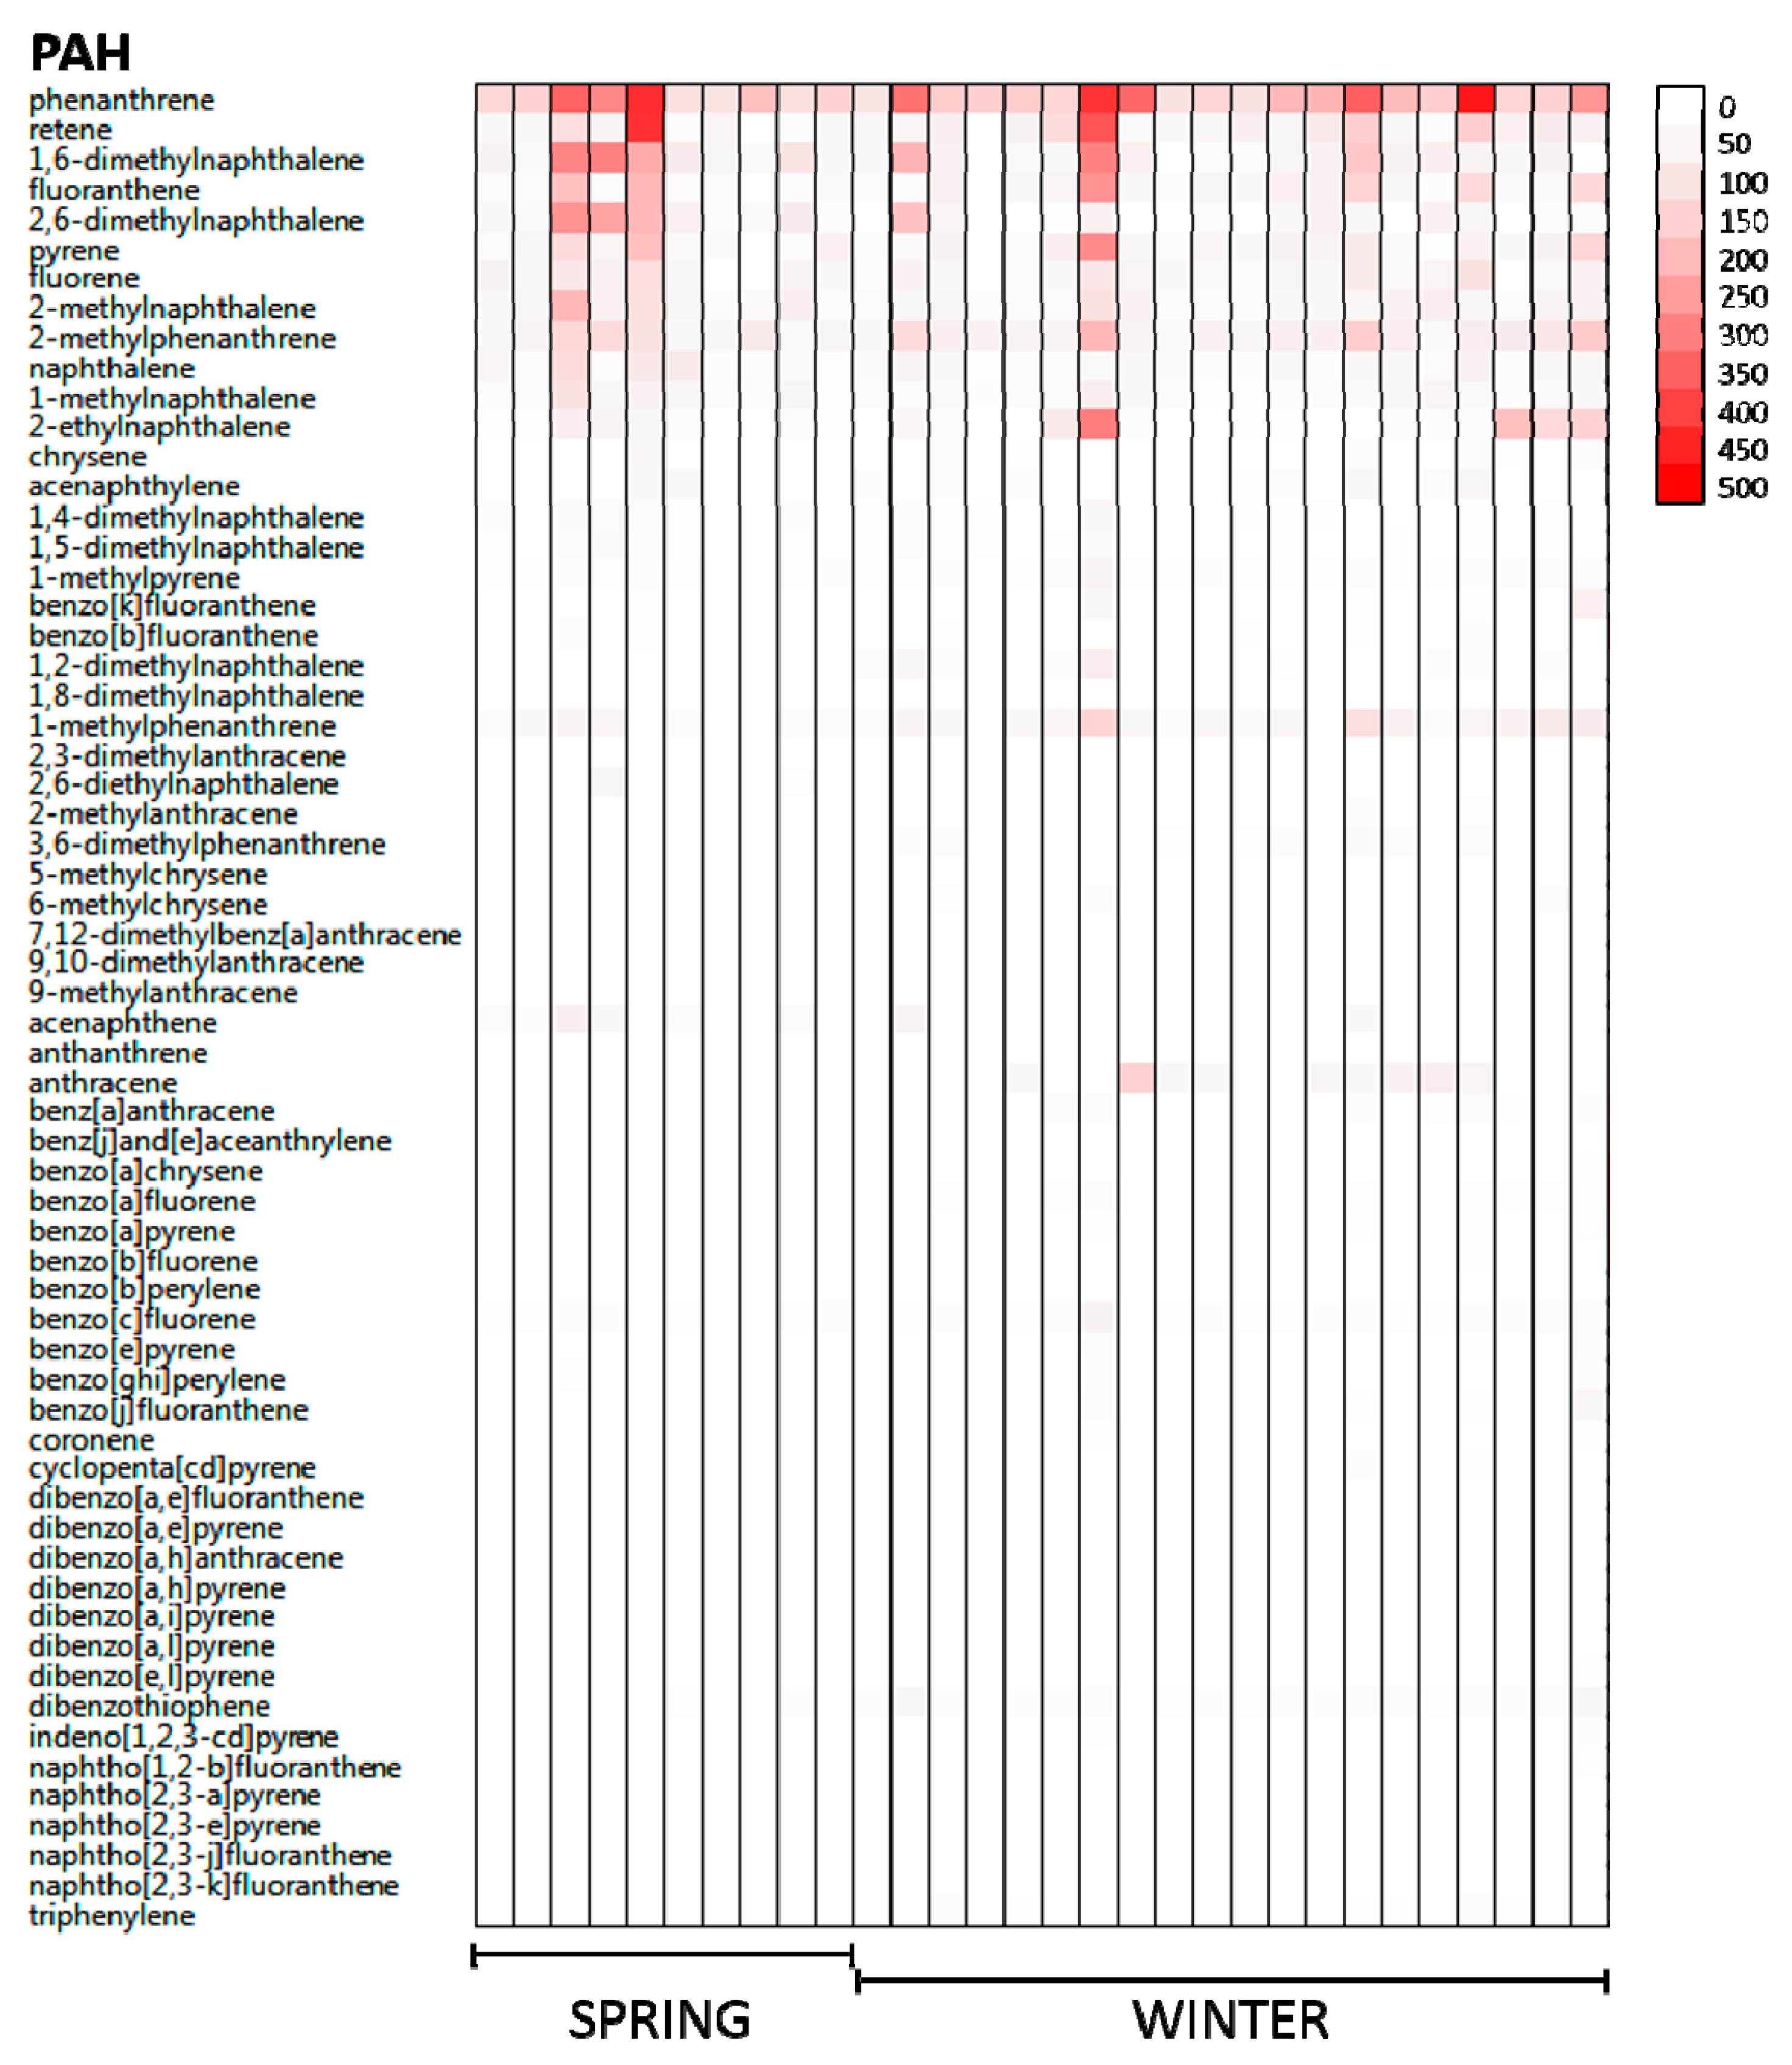
3.2. PAH Exposures
3.3. Reporting Data
3.4. Evaluating Impact of Reporting Data
4. Discussion
Supplementary Materials
Author Contributions
Funding
Acknowledgments
Conflicts of Interest
References
- Refinery’s Nasty Belch Draws More Fire from Regulators. Available online: https://laconnerweeklynews.com/ main.asp?SectionID=2&SubSectionID=27&ArticleID=872 (accessed on 23 January 2019).
- Air Agency: Shell Refinery Emissions Sicken Many. Available online: https://www.goskagit.com/news/air-agency-shell-refinery-emissions-sickened-many/article_d6b4109d-9346-59d1-85a3-054e50a07344.html (accessed on 23 January 2019).
- NWCAA Alleges Multiple Failures by Shell Puget Sound Refinery in February 2015 Chemical Release. Available online: https://sanjuanislander.com/news-articles/government-news/state/21576/nwcaa-alleges-multiple-failures-by-shell-puget-sound-refinery-in-february-2015-chemical-release (accessed on 23 January 2019).
- Shell Refinery Fined $77,000 for Releasing Toxins Near Swinomish Reservation. Available online: https://newsmaven.io/indiancountrytoday/archive/shell-refinery-fined-77-000-for-releasing-toxins-near-swinomish-reservation-Khts33_gnES1M7gSKLbRZA/ (accessed on 23 January 2019).
- NWCAA Alleges Multiple Failures by Shell Puget Sound Refinery in February 2015 Chemical Release. Available online: http://nwcleanairwa.gov/news-release/nwcaa-alleges-multiple-failures-by-shell-puget-sound-refinery-in-february-2015-chemical-release/ (accessed on 18 September 2018).
- Current Ambient Air Quality Projects. Available online: http://www.swinomish.org/resources/ environmental-protection/dep-programs/air-quality.aspx (accessed on 18 September 2018).
- Dixon, H.M.; Scott, R.P.; Holmes, D.; Calero, L.; Kincl, L.D.; Waters, K.M.; Camann, D.E.; Calafat, A.M.; Herbstman, J.B.; Anderson, K.A. Silicone wristbands compared with traditional polycyclic aromatic hydrocarbon exposure assessment methods. Anal. Bioanal. Chem. 2018, 410, 3059–3071. [Google Scholar] [CrossRef] [PubMed] [Green Version]
- Harley, K.G.; Parra, K.L.; Camacho, J.; Bradman, A.; Nolan, J.E.S.; Lessard, C.; Anderson, K.A.; Poutasse, C.M.; Scott, R.P.; Lazaro, G.; et al. Determinants of pesticide concentrations in silicone wristbands worn by Latina adolescent girls in a California farmworker community: The COSECHA youth participatory action study. Sci. Total Environ. 2018, 652, 1022–1029. [Google Scholar] [CrossRef]
- Vidi, P.A.; Anderson, K.A.; Chen, H.; Anderson, R.; Salvador-Moreno, N.; Mora, D.C.; Poutasse, C.; Laurienti, P.J.; Daniel, S.S.; Arcury, T.A. Personal samplers of bioavailable pesticides integrated with a hair follicle assay of DNA damage to assess environmental exposures and their associated risks in children. Mutat. Res. 2017, 822, 27–33. [Google Scholar] [CrossRef] [PubMed]
- O’Connell, S.G.; Kincl, L.D.; Anderson, K.A. Silicone wristbands as personal passive samplers. Environ. Sci. Technol. 2014, 48, 3327–3335. [Google Scholar] [CrossRef]
- Anderson, K.A.; Points, G.L., 3rd; Donald, C.E.; Dixon, H.M.; Scott, R.P.; Wilson, G.; Tidwell, L.G.; Hoffman, P.D.; Herbstman, J.B.; O’Connell, S.G. Preparation and performance features of wristband samplers and considerations for chemical exposure assessment. J. Expo. Sci. Environ. Epidemiol. 2017, 27, 551–559. [Google Scholar] [CrossRef]
- Donald, C.E.; Scott, R.P.; Blaustein, K.L.; Halbleib, M.L.; Sarr, M.; Jepson, P.C.; Anderson, K.A. Silicone wristbands detect individuals’ pesticide exposures in West Africa. R. Soc. Open Sci. 2016, 3, 160433. [Google Scholar] [CrossRef]
- Kile, M.L.; Scott, R.P.; O’Connell, S.G.; Lipscomb, S.; MacDonald, M.; McClelland, M.; Anderson, K.A. Using silicone wristbands to evaluate preschool children’s exposure to flame retardants. Environ. Res. 2016, 147, 365–372. [Google Scholar] [CrossRef]
- Paulik, L.B.; Hobbie, K.A.; Rohlman, D.; Smith, B.W.; Scott, R.P.; Kincl, L.; Haynes, E.N.; Anderson, K.A. Environmental and individual PAH exposures near rural natural gas extraction. Environ. Pollut. 2018, 241, 397–405. [Google Scholar] [CrossRef]
- Bergmann, A.J.; North, P.E.; Vasquez, L.; Bello, H.; Del Carmen Gastanaga Ruiz, M.; Anderson, K.A. Multi-class chemical exposure in rural Peru using silicone wristbands. J. Expo. Sci. Environ. Epidemiol. 2017, 27, 560–568. [Google Scholar] [CrossRef]
- N.R.C. Polycyclic Aromatic Hydrocarbons: Evaluation of Sources and Effects; The National Academies Press: Washington, DC, USA, 1983; p. 476. [Google Scholar]
- Albers, P.H. Petroleum and individual polycyclic aromatic hydrocarbons. In Handbook of Ecotoxicology; Hoffman, D.J., Rattner, B.A., Burton, G.A., Cairns, J., Eds.; CRC Press: Boca Raton, FL, USA, 2003; pp. 341–371. [Google Scholar]
- Rao, P.S.; Ansari, M.F.; Pipalatkar, P.; Kumar, A.; Nema, P.; Devotta, S. Measurement of particulate phase polycyclic aromatic hydrocarbon (PAHs) around a petroleum refinery. Environ. Monit. Assess. 2007, 137, 387. [Google Scholar] [CrossRef] [PubMed]
- Pampanin, D.M.; Sydnes, M.O. Polycyclic Aromatic Hydrocarbons a Constituent of Petroleum: Presence and Influence in the Aquatic Environment. In Hydrocarbon; Kutcherov, V., Kolesnikov, A., Eds.; IntechOpen: London, UK, 2013; pp. 83–118. [Google Scholar]
- Hansen, A.M.; Mathiesen, L.; Pedersen, M.; Knudsen, L.E. Urinary 1-hydroxypyrene (1-HP) in environmental and occupational studies—A review. Int. J. Hyg. Environ. Health 2008, 211, 471–503. [Google Scholar] [CrossRef] [PubMed]
- Sawant, A.A.; Nigam, A.; Miller, J.W.; Johnson, K.C.; Cocker, D.R. Regulated and Non-Regulated Emissions from In-Use Diesel-Electric Switching Locomotives. Environ. Sci. Technol. 2007, 41, 6074–6083. [Google Scholar] [CrossRef] [PubMed]
- Ding, Y.S.; Trommel, J.S.; Yan, X.J.; Ashley, D.; Watson, C.H. Determination of 14 polycyclic aromatic hydrocarbons in mainstream smoke from domestic cigarettes. Environ. Sci. Technol. 2005, 39, 471–478. [Google Scholar] [CrossRef] [PubMed]
- Ward, T.J.; Palmer, C.P.; Houck, J.E.; Navidi, W.C.; Geinitz, S.; Noonan, C.W. Community woodstove changeout and impact on ambient concentrations of polycyclic aromatic hydrocarbons and phenolics. Environ. Sci. Technol. 2009, 43, 5345–5350. [Google Scholar] [CrossRef] [PubMed]
- Derudi, M.; Gelosa, S.; Sliepcevich, A.; Cattaneo, A.; Cavallo, D.; Rota, R.; Nano, G. Emission of Air Pollutants from Burning Candles with Different Composition in Indoor Environments. Environ. Sci. Pollut. Res. Int. 2014, 21, 4320–4330. [Google Scholar] [CrossRef] [PubMed]
- Westerholm, R.; Egeback, K.E. Exhaust emissions from light- and heavy-duty vehicles: Chemical composition, impact of exhaust after treatment, and fuel parameters. Environ. Health Perspect. 1994, 102, 13–23. [Google Scholar] [PubMed]
- Campo, J.; Lorenzo, M.; Cammeraat, E.L.H.; Pico, Y.; Andreu, V. Emerging contaminants related to the occurrence of forest fires in the Spanish Mediterranean. Sci. Total Environ. 2017, 603–604, 330–339. [Google Scholar] [CrossRef]
- Binet, S.; Pfohl-Leszkowicz, A.; Brandt, H.; Lafontaine, M.; Castegnaro, M. Bitumen fumes: Review of work on the potential risk to workers and the present knowledge on its origin. Sci. Total Environ. 2002, 300, 37–49. [Google Scholar] [CrossRef]
- Lioy, P.J.; Greenberg, A. Factors associated with human exposures to polycyclic aromatic hydrocarbons. Toxicol. Ind. Health 1990, 6, 209–223. [Google Scholar] [CrossRef]
- Barro, R.; Regueiro, J.; Llompart, M.; Garcia-Jares, C. Analysis of industrial contaminants in indoor air: Part 1. Volatile organic compounds, carbonyl compounds, polycyclic aromatic hydrocarbons and polychlorinated biphenyls. J. Chromatogr. A 2009, 1216, 540–566. [Google Scholar] [CrossRef]
- Samburova, V.; Zielinska, B.; Khlystov, A. Do 16 Polycyclic Aromatic Hydrocarbons Represent PAH Air Toxicity? Toxics 2017, 5, 17. [Google Scholar] [CrossRef] [PubMed]
- Andersson, J.T.; Achten, C. Time to Say Goodbye to the 16 EPA PAHs? Toward an Up-to-Date Use of PACs for Environmental Purposes. Polycycl. Aromat. Compd. 2015, 35, 330–354. [Google Scholar] [CrossRef] [PubMed]
- Keith, L.H. The Source of U.S. EPA’s Sixteen PAH Priority Pollutants. Polycycl. Aromat. Compd. 2015, 35, 147–160. [Google Scholar] [CrossRef]
- ATSDR. Public Health Statement: Polycyclic Aromatic Hydrocarbons (PAHs). Available online: https://www.atsdr.cdc.gov/phs/phs.asp?id=120&tid=25 (accessed on 18 September 2018).
- Baan, R.; Grosse, Y.; Straif, K.; Secretan, B.; El Ghissassi, F.; Bouvard, V.; Benbrahim-Tallaa, L.; Guha, N.; Freeman, C.; Galichet, L.; et al. A review of human carcinogens—Part F: Chemical agents and related occupations. Lancet Oncol. 2009, 10, 1143–1144. [Google Scholar] [CrossRef]
- Ostrowski, S.R.; Wilbur, S.; Chou, C.H.; Pohl, H.R.; Stevens, Y.W.; Allred, P.M.; Roney, N.; Fay, M.; Tylenda, C.A. Agency for Toxic Substances and Disease Registry’s 1997 priority list of hazardous substances. Latent effects—Carcinogenesis, neurotoxicology, and developmental deficits in humans and animals. Toxicol. Ind. Health 1999, 15, 602–644. [Google Scholar] [CrossRef] [PubMed]
- Mumtaz, M.M.; George, J.D.; Gold, K.W.; Cibulas, W.; DeRosa, C.T. ATSDR evaluation of health effects of chemicals. IV. Polycyclic aromatic hydrocarbons (PAHs): Understanding a complex problem. Toxicol. Ind. Health 1996, 12, 742–971. [Google Scholar] [CrossRef] [PubMed]
- Hayakawa, K. Environmental Behaviors and Toxicities of Polycyclic Aromatic Hydrocarbons and Nitropolycyclic Aromatic Hydrocarbons. Chem. Pharm. Bull. 2016, 64, 83–94. [Google Scholar] [CrossRef] [PubMed] [Green Version]
- Kim, K.H.; Jahan, S.A.; Kabir, E.; Brown, R.J. A review of airborne polycyclic aromatic hydrocarbons (PAHs) and their human health effects. Environ. Int. 2013, 60, 71–80. [Google Scholar] [CrossRef] [PubMed]
- Schober, W.; Lubitz, S.; Belloni, B.; Gebauer, G.; Lintelmann, J.; Matuschek, G.; Weichenmeier, I.; Eberlein-Konig, B.; Buters, J.; Behrendt, H. Environmental polycyclic aromatic hydrocarbons (PAHs) enhance allergic inflammation by acting on human basophils. Inhal. Toxicol. 2007, 19 (Suppl. 1), 151–156. [Google Scholar] [CrossRef]
- Karimi, P.; Peters, K.O.; Bidad, K.; Strickland, P.T. Polycyclic aromatic hydrocarbons and childhood asthma. Eur. J. Epidemiol. 2015, 30, 91–101. [Google Scholar] [CrossRef]
- Jung, K.H.; Perzanowski, M.; Rundle, A.; Moors, K.; Yan, B.; Chillrud, S.N.; Whyatt, R.; Camann, D.; Perera, F.P.; Miller, R.L. Polycyclic aromatic hydrocarbon exposure, obesity and childhood asthma in an urban cohort. Environ. Res. 2014, 128, 35–41. [Google Scholar] [CrossRef] [PubMed] [Green Version]
- Jung, K.H.; Yan, B.; Moors, K.; Chillrud, S.N.; Perzanowski, M.S.; Whyatt, R.M.; Hoepner, L.; Goldstein, I.; Zhang, B.; Camann, D.; et al. Repeated exposure to polycyclic aromatic hydrocarbons and asthma: Effect of seroatopy. Ann. Allergy Asthma Immunol. 2012, 109, 249–254. [Google Scholar] [CrossRef] [PubMed]
- Miller, R.L.; Garfinkel, R.; Lendor, C.; Hoepner, L.; Li, Z.; Romanoff, L.; Sjodin, A.; Needham, L.; Perera, F.P.; Whyatt, R.M. Polycyclic aromatic hydrocarbon metabolite levels and pediatric allergy and asthma in an inner-city cohort. Pediatr. Allergy Immunol. 2010, 21, 260–267. [Google Scholar] [CrossRef] [PubMed]
- Gale, S.L.; Noth, E.M.; Mann, J.; Balmes, J.; Hammond, S.K.; Tager, I.B. Polycyclic aromatic hydrocarbon exposure and wheeze in a cohort of children with asthma in Fresno, CA. J. Expo. Sci. Environ. Epidemiol. 2012, 22, 386–392. [Google Scholar] [CrossRef] [PubMed] [Green Version]
- Alshaarawy, O.; Elbaz, H.A.; Andrew, M.E. The association of urinary polycyclic aromatic hydrocarbon biomarkers and cardiovascular disease in the US population. Environ. Int. 2016, 89–90, 174–178. [Google Scholar] [CrossRef] [PubMed]
- Poursafa, P.; Moosazadeh, M.; Abedini, E.; Hajizadeh, Y.; Mansourian, M.; Pourzamani, H.; Amin, M.M. A Systematic Review on the Effects of Polycyclic Aromatic Hydrocarbons on Cardiometabolic Impairment. Int. J. Prev. Med. 2017, 8, 19. [Google Scholar] [PubMed]
- Perera, F.P.; Rauh, V.; Whyatt, R.M.; Tsai, W.Y.; Tang, D.; Diaz, D.; Hoepner, L.; Barr, D.; Tu, Y.H.; Camann, D.; et al. Effect of prenatal exposure to airborne polycyclic aromatic hydrocarbons on neurodevelopment in the first 3 years of life among inner-city children. Environ. Health Perspect. 2006, 114, 1287–1292. [Google Scholar] [CrossRef] [PubMed]
- Jedrychowski, W.A.; Perera, F.P.; Camann, D.; Spengler, J.; Butscher, M.; Mroz, E.; Majewska, R.; Flak, E.; Jacek, R.; Sowa, A. Prenatal exposure to polycyclic aromatic hydrocarbons and cognitive dysfunction in children. Environ. Sci. Pollut. Res. Int. 2015, 22, 3631–3639. [Google Scholar] [CrossRef] [PubMed]
- O’Fallon, L.R.; Dearry, A. Community-based participatory research as a tool to advance environmental health sciences. Environ. Health Perspect. 2002, 110 (Suppl. 2), 155–159. [Google Scholar] [CrossRef] [PubMed]
- O’Fallon, L. Citizen Science and Community-Engaged Research in Environmental Health. In Lab Matters; APHL: Silver Springs, MD, USA, 2015; p. 5. [Google Scholar]
- Ramirez-Andreotta, M.D.; Brody, J.G.; Lothrop, N.; Loh, M.; Beamer, P.I.; Brown, P. Reporting back environmental exposure data and free choice learning. Environ. Health 2016, 15, 2. [Google Scholar] [CrossRef] [PubMed]
- Brody, J.G.; Dunagan, S.C.; Morello-Frosch, R.; Brown, P.; Patton, S.; Rudel, R.A. Reporting individual results for biomonitoring and environmental exposures: Lessons learned from environmental communication case studies. Environ. Health 2014, 13, 40. [Google Scholar] [CrossRef] [PubMed]
- Claudio, L.; Gilmore, J.; Roy, M.; Brenner, B. Communicating environmental exposure results and health information in a community-based participatory research study. BMC Public Health 2018, 18, 784. [Google Scholar] [CrossRef] [PubMed]
- Morello-Frosch, R.; Brody, J.G.; Brown, P.; Altman, R.G.; Rudel, R.A.; Perez, C. Toxic ignorance and right-to-know in biomonitoring results communication: A survey of scientists and study participants. Environ. Health 2009, 8, 6. [Google Scholar] [CrossRef] [PubMed]
- Perovich, L.J.; Ohayon, J.L.; Cousins, E.M.; Morello-Frosch, R.; Brown, P.; Adamkiewicz, G.; Brody, J.G. Reporting to parents on children’s exposures to asthma triggers in low-income and public housing, an interview-based case study of ethics, environmental literacy, individual action, and public health benefits. Environ. Health 2018, 17, 48. [Google Scholar] [CrossRef] [PubMed]
- Ramirez-Andreotta, M.D.; Brody, J.G.; Lothrop, N.; Loh, M.; Beamer, P.I.; Brown, P. Improving Environmental Health Literacy and Justice through Environmental Exposure Results Communication. Int. J. Environ. Res. Public Health 2016, 13, 690. [Google Scholar] [CrossRef] [PubMed]
- Brown, P.; Brody, J.G.; Morello-Frosch, R.; Tovar, J.; Zota, A.R.; Rudel, R.A. Measuring the Success of Community Science: The Northern California Household Exposure Study. Environ. Health Perspect. 2012, 120, 326–331. [Google Scholar] [CrossRef] [PubMed] [Green Version]
- Brody, J.G.; Morello-Frosch, R.; Brown, P.; Rudel, R.A.; Altman, R.G.; Frye, M.; Osimo, C.A.; Perez, C.; Seryak, L.M. Improving disclosure and consent: “is it safe?”: New ethics for reporting personal exposures to environmental chemicals. Am. J. Public Health 2007, 97, 1547–1554. [Google Scholar] [CrossRef]
- Altman, R.G.; Morello-Frosch, R.; Brody, J.G.; Rudel, R.; Brown, P.; Averick, M. Pollution comes home and gets personal: women’s experience of household chemical exposure. J. Health Soc. Behav. 2008, 49, 417–435. [Google Scholar] [CrossRef]
- Harding, A.; Harper, B.; Stone, D.; O’Neill, C.; Berger, P.; Harris, S.; Donatuto, J. Conducting research with tribal communities: Sovereignty, ethics, and data-sharing issues. Environ. Health Perspect. 2012, 120, 6–10. [Google Scholar] [CrossRef]
- IARC Lyon. Monographs on the Evaluation of the Carcinogenic Risk of Chemicals to Humans Polynuclear Aromatic Compounds; IARC Lyon: Lyon, France, 1983. [Google Scholar]
- Ramdahl, T. Retene—A molecular marker of wood combustion in ambient air. Nature 1983, 306, 580. [Google Scholar] [CrossRef]
- Koistinen, J.; Lehtonen, M.; Tukia, K.; Soimasuo, M.; Lahtipera, M.; Oikari, A. Identification of lipophilic pollutants discharged from a Finnish pulp and paper mill. Chemosphere 1998, 37, 219–235. [Google Scholar] [CrossRef]
- Terzi, E.; Samara, C. Gas-particle partitioning of polycyclic aromatic hydrocarbons in urban, adjacent coastal, and continental background sites of western Greece. Environ. Sci. Technol. 2004, 38, 4973–4978. [Google Scholar] [CrossRef] [PubMed]
- Ahmed, S.M.; Palermo, A.G. Community engagement in research: Frameworks for education and peer review. Am. J. Public Health 2010, 100, 1380–1387. [Google Scholar] [PubMed]
- Haynes, E.N.; Beidler, C.; Wittberg, R.; Meloncon, L.; Parin, M.; Kopras, E.J.; Succop, P.; Dietrich, K.N. Developing a bidirectional academic-community partnership with an Appalachian-American community for environmental health research and risk communication. Environ. Health Perspect. 2011, 119, 1364–1372. [Google Scholar] [CrossRef] [PubMed]
- Brown, P. Qualitative methods in environmental health research. Environ. Health Perspect. 2003, 111, 1789–1798. [Google Scholar] [CrossRef] [PubMed]
- Reams, M.A.; Harding, A.K.; Lam, N.S.N.; O’Connell, S.G.; Tidwell, L.G.; Anderson, K.A. Response, Recovery, and Resilience to Oil Spills and Environmental Disasters: Exploration and Use of Novel Approaches to Enhance Community Resilience. J. Environ. Health 2017, 80, 8–16. [Google Scholar]
- Kelley, A.; Belcourt-Dittloff, A.; Belcourt, C.; Belcourt, G. Research ethics and indigenous communities. Am. J. Public Health 2013, 103, 2146–2152. [Google Scholar]
- James, R.; Tsosie, R.; Sahota, P.; Parker, M.; Dillard, D.; Sylvester, I.; Lewis, J.; Klejka, J.; Muzquiz, L.; Olsen, P.; et al. Exploring pathways to trust: A tribal perspective on data sharing. Genet. Med. 2014, 16, 820–826. [Google Scholar] [CrossRef]
- Medin, D.L.; Bang, M. The cultural side of science communication. Proc. Natl. Acad. Sci. USA 2014, 111 (Suppl. 4), 13621–13626. [Google Scholar] [CrossRef] [PubMed] [Green Version]
- Blue Bird Jernigan, V.; Peercy, M.; Branam, D.; Saunkeah, B.; Wharton, D.; Winkleby, M.; Lowe, J.; Salvatore, A.L.; Dickerson, D.; Belcourt, A.; et al. Beyond health equity: Achieving wellness within American Indian and Alaska Native communities. Am. J. Public Health 2015, 105 (Suppl. 3), S376–S379. [Google Scholar] [PubMed]
- Sahota, P. Sharing Data and Protecting Your Community. Available online: http://genetics.ncai.org/sharing-data-and-protecting-your-community.cfm (accessed on 2 October 2018).
- Michener, L.; Cook, J.; Ahmed, S.M.; Yonas, M.A.; Coyne-Beasley, T.; Aguilar-Gaxiola, S. Aligning the goals of community-engaged research: Why and how academic health centers can successfully engage with communities to improve health. Acad. Med. J. Assoc. Am. Med. Coll. 2012, 87, 285–291. [Google Scholar] [CrossRef] [PubMed]
- Knight, L.; Levin, A.; Mendenhall, C. Candles and Incense as Potential Sources of Indoor Air Pollution: Market Analysis and Literature Review; U.S. EPA: Washington, DC, USA, 2001.


| Characteristics | n (%) | n (%) | N |
|---|---|---|---|
| Gender | Male | Female | Total |
| Spring 2016 (March) | 5 (50%) | 5 (50%) | 10 |
| Winter 2017 (January) | 4 (18%) | 18 (82%) | 22 |
| Participated in both Spring and Winter | 3 (43%) | 4 (67%) | 7 |
| Live/work near point source | Yes | No | Total |
| Spring 2016 (March) | 8 (80%) | 2 (20% | 10 |
| Winter 2017 (January) | 17 (77%) | 5 (23%) | 22 |
| Participated in both Spring and Winter | 5 (71%) | 2 (29%) | 7 |
| SPRING—March 2016 | WINTER—January 2017 | |||||||||
|---|---|---|---|---|---|---|---|---|---|---|
| Variable | # WB detected | Mean | SD | Min. | Max. | # WB detected | Mean | SD | Min. | Max. |
| Naphthalene *,† | 10 | 46.1 | 40.7 | 10.5 | 125 | 20 | 31.3 | 13.9 | 5.8 | 61.7 |
| 2-methylnaphthalene † | 10 | 65.7 | 54.9 | 22.7 | 201 | 20 | 42.9 | 23.2 | 18.1 | 111 |
| 1-methylnaphthalene † | 10 | 39.0 | 29.4 | 11.9 | 111 | 20 | 28.4 | 15.0 | 10.9 | 77.1 |
| 2-ethylnaphthalene † | 10 | 25.1 | 24.1 | 6.76 | 73.6 | 13 | 76.5 | 91.3 | 6.11 | 303 |
| 2,6-dimethylnaphthalene † | 10 | 100.5 | 96.4 | 24 | 268 | 12 | 50.7 | 46.1 | 7.24 | 181 |
| 1,6-dimethylnaphthalene † | 10 | 120.3 | 107.8 | 31.9 | 295 | 18 | 80.6 | 73.5 | 20.1 | 296 |
| 1,4-dimethylnaphthalene † | 8 | 16.7 | 10.6 | 4.44 | 31.5 | 11 | 12.3 | 12.2 | 2.7 | 43.9 |
| 1,5-dimethylnaphthalene † | 10 | 12.3 | 9.8 | 3.03 | 29.4 | 11 | 10.9 | 8.6 | 4.74 | 32.5 |
| 1,2-dimethylnaphthalene | 0 | - | - | - | - | 10 | 26.5 | 20.0 | 10.7 | 76 |
| 1,8-dimethylnaphthalene | 0 | - | - | - | - | 0 | - | - | - | - |
| 2,6-diethylnaphthalene | 2 | 25.0 | 23.2 | 8.6 | 41.4 | 0 | - | - | - | - |
| Acenaphthylene *,† | 3 | 27.6 | 17.1 | 8.2 | 40.5 | 8 | 23.6 | 13.5 | 5.52 | 43.8 |
| Acenaphthene *,† | 6 | 33.1 | 19.0 | 15.5 | 69.3 | 1 | 52.8 | . | 52.8 | 52.8 |
| Fluorene *,† | 8 | 63.3 | 30.1 | 36.6 | 121.0 | 18 | 48.0 | 26.3 | 16.3 | 109 |
| Dibenzothiophene† | 2 | 11.8 | 1.6 | 10.7 | 12.9 | 18 | 19.2 | 9.9 | 7.42 | 44 |
| Phenanthrene *,† | 10 | 201.6 | 114.6 | 102.0 | 433.0 | 20 | 214.5 | 108.8 | 101 | 466 |
| Anthracene * | 0 | - | - | - | - | 9 | 58.8 | 37.1 | 33.4 | 150 |
| 2-methylphenanthrene † | 10 | 69.8 | 40.8 | 30.8 | 133.0 | 20 | 81.1 | 46.3 | 29.8 | 201 |
| 2-methylanthracene | 0 | - | - | - | - | 2 | 12.0 | 1.6 | 10.9 | 13.1 |
| 1-methylphenanthrene † | 7 | 31.7 | 13.4 | 19.3 | 53.7 | 18 | 56.2 | 32.6 | 22.6 | 143 |
| 9-methylanthracene | 0 | - | - | - | - | 0 | - | - | - | - |
| 3,6-dimethylphenanthrene | 0 | - | - | - | - | 8 | 19.7 | 8.1 | 7.95 | 32.7 |
| 2,3-dimethylanthracene | 0 | 0 | - | - | - | - | ||||
| Fluoranthene *,† | 10 | 59.7 | 71.6 | 19.0 | 204.0 | 19 | 66.1 | 61.9 | 12.2 | 267 |
| 9,10-dimethylanthracene | 0 | - | - | - | - | 0 | - | - | - | - |
| Pyrene *,† | 9 | 63.8 | 56.2 | 20.6 | 187.0 | 19 | 61.1 | 60.6 | 11.8 | 281 |
| Retene † | 9 | 89.1 | 130.6 | 14.5 | 428.0 | 19 | 84.8 | 79.2 | 25 | 371 |
| Benzo[a]fluorene | 0 | - | - | - | - | 8 | 11.2 | 6.4 | 6.34 | 26.3 |
| Benzo[b]fluorene | 0 | - | - | - | - | 1 | 8.6 | . | 8.59 | 8.59 |
| Benzo[c]fluorene † | 7 | 12.3 | 6.7 | 5.8 | 23.8 | 17 | 15.9 | 12.6 | 4.95 | 57.6 |
| 1-methylpyrene † | 8 | 10.0 | 4.7 | 4.3 | 16.2 | 19 | 13.8 | 11.5 | 3.35 | 54.8 |
| Benz[a]anthracene * | 0 | - | - | - | - | 7 | 17.5 | 7.9 | 6.05 | 26.4 |
| Cyclopenta[c,d]pyrene | 0 | - | - | - | - | 2 | 10.2 | 5.1 | 6.65 | 13.8 |
| Triphenylene | 0 | - | - | - | - | 6 | 9.1 | 3.7 | 4.59 | 13.4 |
| Chrysene *,† | 1 | 38.1 | . | 38.1 | 38.1 | 6 | 16.1 | 9.9 | 5.34 | 28.5 |
| 6-methylchrysene | 0 | - | - | - | - | 3 | 12.1 | 2.3 | 9.48 | 13.9 |
| 5-methylchrysene | 0 | - | - | - | - | 0 | - | - | - | - |
| Benzo[b]fluoranthene *,† | 2 | 13.7 | 4.5 | 10.5 | 16.9 | 4 | 6.5 | 4.2 | 2.49 | 12.3 |
| 7,12-dimethylbenz[a]anthracene | 0 | - | - | - | - | 0 | - | - | - | - |
| Benzo[k]fluoranthene *,† | 1 | 11.5 | . | 11.5 | 11.5 | 4 | 27.4 | 28.7 | 3.3 | 62.6 |
| Benzo[j]fluoranthene * | 0 | - | - | - | - | 4 | 18.9 | 17.7 | 4.56 | 42.5 |
| Benz[j]and[e]aceanthrylene | 0 | - | - | - | - | 0 | - | - | - | - |
| Benzo[e]pyrene * | 0 | - | - | - | - | 3 | 17.1 | 9.7 | 6.16 | 24.5 |
| Benzo[a]pyrene * | 0 | - | - | - | - | 4 | 7.7 | 2.6 | 5.19 | 10.2 |
| Indeno[1,2,3-c,d]pyrene * | 0 | - | - | - | - | 2 | 10.3 | 5.9 | 6.1 | 14.4 |
| Dibenzo[a,h]anthracene * | 0 | - | - | - | - | 0 | - | - | - | - |
| Benzo[a]chrysene | 0 | - | - | - | - | 1 | 3.2 | . | 3.19 | 3.19 |
| Benzo[3,4]perylene *,† | 1 | 9.2 | . | 9.2 | 9.2 | 5 | 5.7 | 5.8 | 1.14 | 12.2 |
| Anthanthrene | 0 | - | - | - | - | 0 | - | - | - | - |
| Naphtho[1,2-b]fluoranthene | 0 | - | - | - | - | 1 | 7.3 | - | 7.3 | 7.3 |
| Naphtho[2,3-j]fluoranthene | 0 | - | - | - | - | 1 | 8.6 | - | 8.55 | 8.55 |
| Dibenzo[a,e]fluoranthene | 0 | - | - | - | - | 0 | - | - | - | - |
| Dibenzo[a,l]pyrene | 0 | - | - | - | - | 0 | - | - | - | - |
| Naphtho[2,3-k]fluoranthene | 0 | - | - | - | - | 0 | - | - | - | - |
| Naphtho[2,3-e]pyrene | 0 | - | - | - | - | 0 | - | - | - | - |
| Dibenzo[a,e]pyrene | 0 | - | - | - | - | 0 | - | - | - | - |
| Coronene | 0 | - | - | - | - | 3 | 2.6 | 1.6 | 0.93 | 4.18 |
| Dibenzo[e,l]pyrene | 0 | - | - | - | - | 1 | 10.0 | . | 10 | 10 |
| Naphtho[2,3-a]pyrene | 0 | - | - | - | - | 0 | - | - | - | - |
| Benzo[b]perylene | 0 | - | - | - | - | 0 | - | - | - | - |
| Dibenzo[a,i]pyrene | 0 | - | - | - | - | 0 | - | - | - | - |
| Dibenzo[a,h]pyrene | 0 | - | - | - | - | 0 | - | - | - | - |
| Covariate | N | Mean | SD | p-Value |
|---|---|---|---|---|
| Sex | 0.5 | |||
| Male | 10 | 1311.5 | 982.8 | |
| Female | 20 | 860.5 | 424.6 | |
| Candles | 0.03 | |||
| No | 14 | 716.6 | 355.4 | |
| Yes | 16 | 1268.3 | 798.3 | |
| Grilled Food | 0.48 | |||
| 0–4 times per week | 16 | 1080.5 | 832.3 | |
| 5–7 times per week | 14 | 93.2 | 473.7 | |
| Heat Type | 0.05 | |||
| Electricity only | 13 | 782.3 | 449.1 | |
| Other (woodstove, wood boiler, natural gas) | 17 | 1185.6 | 784.5 | |
| Gasoline Contact | 0.03 | |||
| 0–1 times per week | 19 | 825.6 | 450.3 | |
| 2 or more times per week | 11 | 1330.8 | 897 | |
| Incense | 0.21 | |||
| No | 20 | 1092.3 | 741.5 | |
| Yes | 10 | 847.9 | 540.5 | |
| Burned Food | 0.49 | |||
| No | 22 | 1015.3 | 705.5 | |
| Yes | 8 | 998.6 | 656.9 | |
| Proximity to a source | 0.13 | |||
| No | 6 | 661.9 | ||
| Yes | 23 | 1070.3 | ||
| Season | 0.53 | |||
| Spring | 10 | 1024.6 | 764.5 | |
| Winter | 20 | 1004 | 657.4 |
© 2019 by the authors. Licensee MDPI, Basel, Switzerland. This article is an open access article distributed under the terms and conditions of the Creative Commons Attribution (CC BY) license (http://creativecommons.org/licenses/by/4.0/).
Share and Cite
Rohlman, D.; Donatuto, J.; Heidt, M.; Barton, M.; Campbell, L.; Anderson, K.A.; Kile, M.L. A Case Study Describing a Community-Engaged Approach for Evaluating Polycyclic Aromatic Hydrocarbon Exposure in a Native American Community. Int. J. Environ. Res. Public Health 2019, 16, 327. https://doi.org/10.3390/ijerph16030327
Rohlman D, Donatuto J, Heidt M, Barton M, Campbell L, Anderson KA, Kile ML. A Case Study Describing a Community-Engaged Approach for Evaluating Polycyclic Aromatic Hydrocarbon Exposure in a Native American Community. International Journal of Environmental Research and Public Health. 2019; 16(3):327. https://doi.org/10.3390/ijerph16030327
Chicago/Turabian StyleRohlman, Diana, Jamie Donatuto, Myk Heidt, Michael Barton, Larry Campbell, Kim A. Anderson, and Molly L. Kile. 2019. "A Case Study Describing a Community-Engaged Approach for Evaluating Polycyclic Aromatic Hydrocarbon Exposure in a Native American Community" International Journal of Environmental Research and Public Health 16, no. 3: 327. https://doi.org/10.3390/ijerph16030327