
Urban Park Development and Pediatric Obesity Rates: A Quasi-Experiment Using Electronic Health Record Data

 and
and
Abstract
:1. Introduction
2. Methods
2.1. Study Design and Population
2.2. Variables
2.3. Analyses
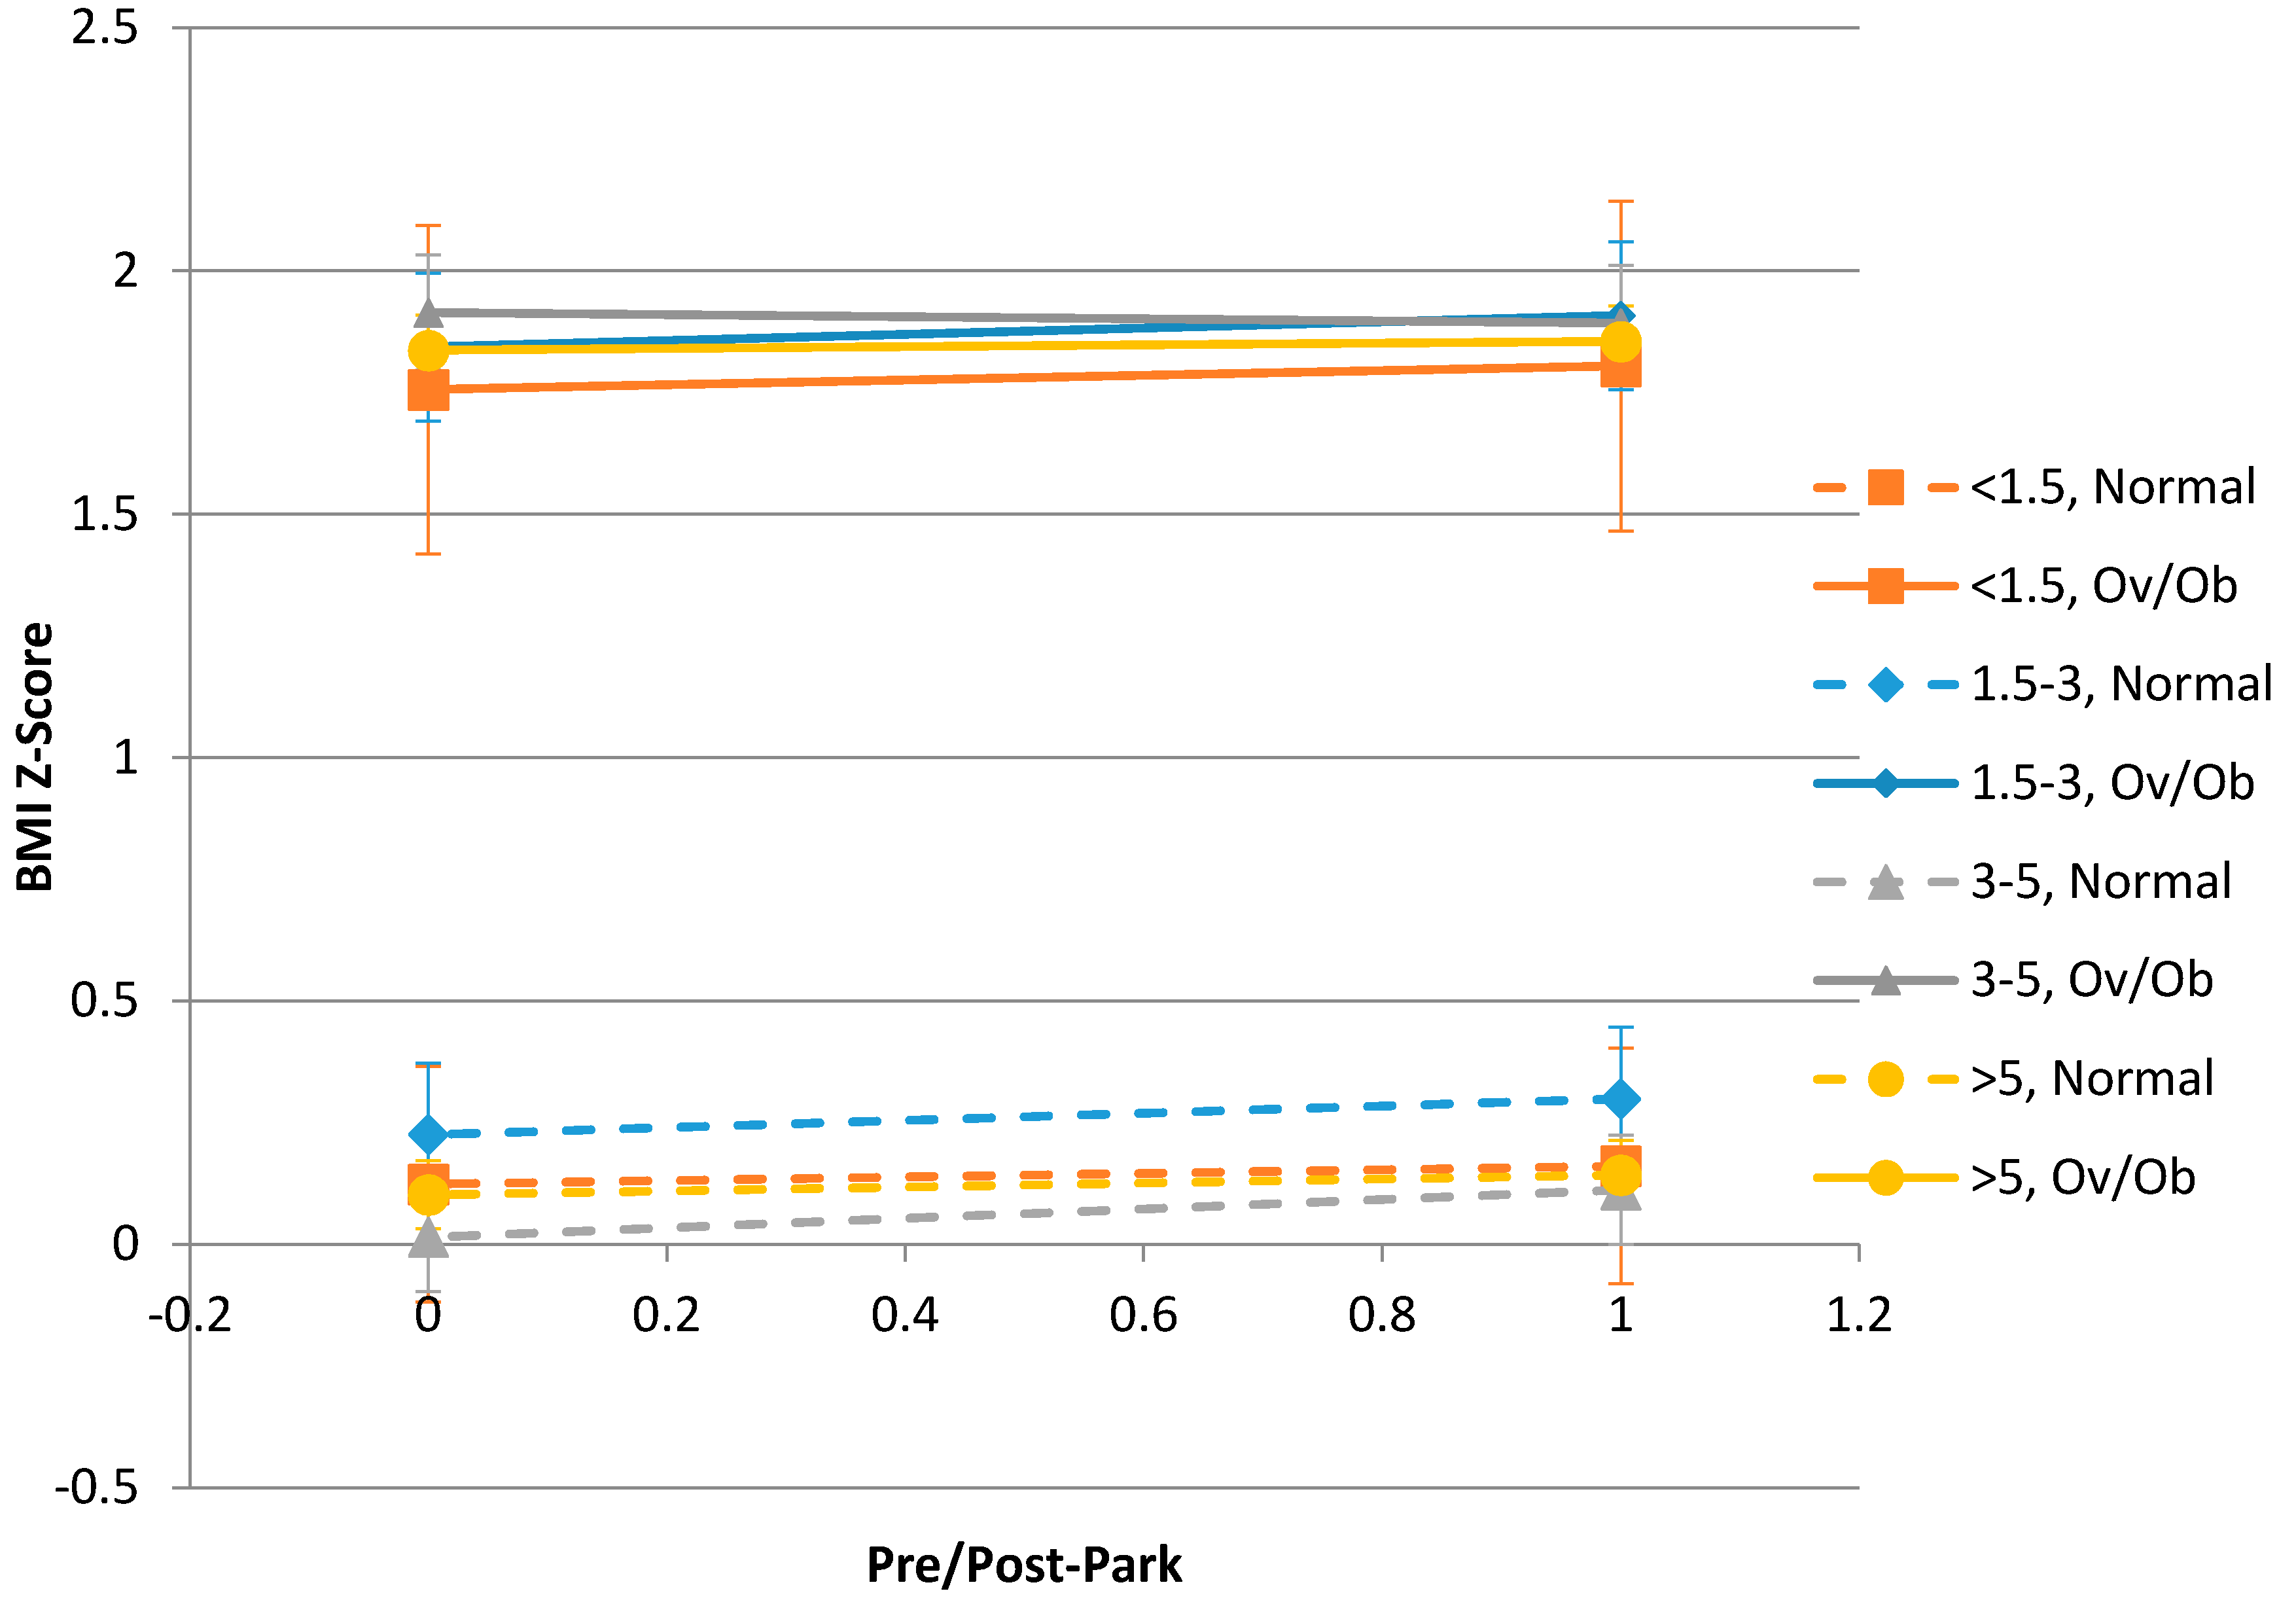
3. Results
4. Discussion
5. Conclusions
Acknowledgments
Author Contributions
Conflicts of Interest
References
- Centers for Disease Control and Prevention. Childhood Obesity Facts: Prevalence of Childhood Obesity in the United States, 2011–2012. Available online: http://www.cdc.gov/healthyschools/obesity/facts.htm (accessed on 28 January 2016).
- Goran, M.I.; Reynolds, K.D.; Lindquist, C.H. Role of physical activity in the prevention of obesity in children. Int. J. Obes. Relat. Metab. Disord. 1999, 23, S18–S33. [Google Scholar] [CrossRef] [PubMed]
- Grundy, S.M.; Blackburn, G.; Higgins, M.; Lauer, R.; Perri, M.G.; Ryan, D. Physical activity in the prevention and treatment of obesity and its comorbidities: Evidence report of independent panel to assess the role of physical activity in the treatment of obesity and its comorbidities. Med. Sci. Sports Exerc. 1999, 31, 1493–1500. [Google Scholar] [CrossRef] [PubMed]
- Dietz, W.H.; Gortmaker, S.L. Preventing obesity in children and adolescents. Annu. Rev. Public Health 2001, 22, 337–353. [Google Scholar] [CrossRef] [PubMed]
- Aytur, S.A.; Rodriguez, D.A.; Evenson, K.R.; Catellier, D.J.; Rosamond, W.D. The sociodemographics of land use planning: Relationships to physical activity, accessibility, and equity. Health Place 2008, 14, 367–385. [Google Scholar] [CrossRef] [PubMed]
- Craig, C.L.; Brownson, R.C.; Cragg, S.E.; Dunn, A.L. Exploring the effect of the environment on physical activity: A study examining walking to work. Am. J. Prev. Med. 2002, 23, 36–43. [Google Scholar] [CrossRef]
- Smith, K.R.; Brown, B.B.; Yamada, I.; Kowaleski-Jones, L.; Zick, C.D.; Fan, J.X. Walkability and body mass index density, design, and new diversity measures. Am. J. Prev. Med. 2008, 35, 237–244. [Google Scholar] [CrossRef] [PubMed]
- Davison, K.K.; Werder, J.L.; Lawson, C.T. Children’s active commuting to school: Current knowledge and future directions. Prev. Chronic Dis. 2008, 5, A100. [Google Scholar] [PubMed]
- De Bourdeaudhuij, I.; Sallis, J.F.; Saelens, B.E. Environmental correlates of physical activity in a sample of Belgian adults. Am. J. Health Promot. 2003, 18, 83–92. [Google Scholar] [CrossRef] [PubMed]
- Gustat, J.; Rice, J.; Parker, K.M.; Becker, A.B.; Farley, T.A. Effect of changes to the neighborhood built environment on physical activity in a low-income African American neighborhood. Prev. Chronic Dis. 2012, 9, E57. [Google Scholar] [CrossRef] [PubMed]
- Gordon-Larsen, P.; Nelson, M.C.; Page, P.; Popkin, B.M. Inequality in the built environment underlies key health disparities in physical activity and obesity. Pediatrics 2006, 117, 417–424. [Google Scholar] [CrossRef] [PubMed]
- Kim, J.; Liu, J.; Colabianchi, N.; Pate, R.R. The effect of perceived and structural neighborhood conditions on adolescents’ physical activity and sedentary behaviors. Arch. Pediatr. Adolesc. Med. 2010, 164, 935–942. [Google Scholar] [CrossRef] [PubMed]
- Sister, C.; Wolch, J.; Wilson, J. Got green? Addressing environmental justice in park provision. GeoJournal 2010, 75, 229–248. [Google Scholar] [CrossRef]
- Institue of Medicine. Accelerating Progress in Obesity Prevention: Solving the Weight of the Nation; National Academy of Sciences: Washington, DC, USA, 2012. [Google Scholar]
- Berke, E.M.; Koepsell, T.D.; Moudon, A.V.; Hoskins, R.E.; Larson, E.B. Association of the built environment with physical activity and obesity in older persons. Am. J. Public Health 2007, 97, 486–492. [Google Scholar] [CrossRef] [PubMed]
- Boone-Heinonen, J.; Casanova, K.; Richardson, A.S.; Gordon-Larsen, P. Where can they play? Outdoor spaces and physical activity among adolescents in U.S. urbanized areas. Prev. Med. 2010, 51, 295–298. [Google Scholar] [CrossRef] [PubMed]
- Carver, A.; Salmon, J.; Campbell, K.; Baur, L.; Garnett, S.; Crawford, D. How do perceptions of local neighborhood relate to adolescents’ walking and cycling? Am. J. Health Promot. 2005, 20, 139–147. [Google Scholar] [CrossRef] [PubMed]
- Cook, T.D. Quasi-Experimental Design, Wiley Encyclopedia of Management; John Wiley & Sons, Ltd.: San Francisco, CA, USA, 2015. [Google Scholar]
- Wooldridge, J.M. Introductory Econometrics: A Modern Approach; South-Western College Pub: Cincinnati, OH, USA, 2013. [Google Scholar]
- Currie, J.; Ray, S.H.; Neidell, M. Quasi-experimental studies suggest that lowering air pollution levels benefits infants’ and children’s health. Health Aff. 2011, 30, 2391–2399. [Google Scholar] [CrossRef] [PubMed]
- Rohrer, J.E. Quasi-experimental evaluation without regression analysis. J. Public Health Manag. Pract. 2009, 15, 109–111. [Google Scholar] [CrossRef] [PubMed]
- Linder, J.A.; Rigotti, N.A.; Brawarsky, P.; Kontos, E.Z.; Park, E.R.; Klinger, E.V.; Marinacci, L.; Hass, J.S. Use of practice-based research network data to measure neighborhood smoking prevalence. Prev. Chronic Dis. 2013, 10, E84. [Google Scholar] [CrossRef] [PubMed]
- Taylor, D.M.; Yeager, V.A.; Ouimet, C.; Menachemi, N. Using GIS for administrative decision-making in a local public health setting. Public Health Rep. 2012, 127, 347–353. [Google Scholar] [PubMed]
- Hall, K.D.; Sacks, G.; Chandramohan, D.; Chow, C.C.; Wang, Y.C.; Gortmaker, S.L.; Swinburn, B.A. Quantification of the effect of energy imbalance on bodyweight. Lancet 2011, 378, 826–837. [Google Scholar] [CrossRef]
- Freedman, D.S.; Lawman, H.G.; Skinner, A.C.; McGuire, L.C.; Allison, D.B.; Ogden, C.L. Validity of the WHO cutoffs for biologically implausible values of weight, height, and BMI in children and adolescents in NHANES from 1999 through 2012. Am. J. Clin. Nutr. 2015, 102, 1000–1006. [Google Scholar] [CrossRef] [PubMed]
- Must, A.; Anderson, S.E. Body mass index in children and adolescents: Considerations for population-based applications. Int. J. Obes. 2006, 30, 590–594. [Google Scholar] [CrossRef] [PubMed]
- Centers for Disease Control and Prevention. About Child & Teen BMI. Available online: http://www.cdc.gov/healthyweight/assessing/bmi/childrens_bmi/about_childrens_bmi.html (accessed on 28 January 2016).
- Bohn-Goldbaum, E.E.; Phongsavan, P.; Merom, D.; Rogers, K.; Kamalesh, V.; Bauman, A.E. Does playground improvement increase physical activity among children? A quasi-experimental study of a natural experiment. J. Environ. Public Health 2013, 2013, 109841. [Google Scholar] [CrossRef] [PubMed]
- Quigg, R.; Gray, A.; Reeder, A.I.; Holt, A.; Waters, D.L. Using accelerometers and GPS units to identify the proportion of daily physical activity located in parks with playgrounds in New Zealand children. Prev. Med. 2010, 50, 235–240. [Google Scholar] [CrossRef] [PubMed]
- Slater, S; Pugach, O.; Lin, W.; Bontu, A. If you build it will they come? Does involving community groups in playground renovations affect park utilization and physical activity? Environ. Behav. 2016, 48, 246–265. [Google Scholar]


| Characteristics | Total Sample N = 1443 | Near (<1.5 miles) N = 45 | Intermediate (1.5–3 miles) N = 164 | Intermediate (3–5 miles) N = 299 | Control (>5 miles) N = 935 |
|---|---|---|---|---|---|
| Median age (range) | 10.3 (2, 17.9) | 9 (2, 16.9) | 10.5 (2, 17.7) | 10.8 (2, 17.6) | 10.3 (2, 17.9) |
| Race | |||||
| Black | 1117 (77%) | 35 (78%) | 140 (85%) | 270 (90%) | 672 (72%) |
| White | 315 (22%) | 10 (22%) | 21 (13%) | 27 (9%) | 257 (27%) |
| Other | 11 (1%) | 0 (0%) | 3 (2%) | 2 (1%) | 6 (1%) |
| Ethnicity | |||||
| Hispanic | 196 (14%) | 8 (18%) | 22 (13%) | 29 (10%) | 137 (15%) |
| Non-Hispanic | (1247 (86%) | 37 (82%) | 142 (87%) | 270 (90%) | 798 (85%) |
| Gender | |||||
| Female | 809 (56%) | 26 (58%) | 91 (55%) | 160 (54%) | 532 (57%) |
| Male | 634 (44%) | 19 (42%) | 73 (45%) | 139 (46%) | 403 (43%) |
| Overweight or Obese | |||||
| Overweight (85%–95%) | 276 (19%) | 7 (16%) | 34 (21%) | 53 (18%) | 182 (19%) |
| Obese | 365 (25%) | 8 (18%) | 44 (27%) | 81 (27%) | 232 (25%) |
| Payer type | |||||
| Self-pay | 570 (40%) | 23 (51%) | 69 (42%) | 100 (33%) | 378 (40%) |
| Other | 873 (60%) | 22 (49%) | 95 (58%) | 199 (67%) | 557 (60%) |
| Distance from Park | N | Mean (SD) BMI z-Score | ||
|---|---|---|---|---|
| First Visit (Pre-Park) | Final Visit (Post-Park) | Change (Final-First) | ||
| All Children | 1443 | 0.84 (1.09) | 0.88 (1.10) | 0.04 (0.33) |
| Near (within 1.5 miles) | 45 | 0.61 (1.00) | 0.66 (1.09) | 0.05 (0.33) |
| Intermediate (Between 1.5 and 3 miles) | 164 | 0.96 (1.00) | 1.03 (1.04) | 0.07 (0.31) |
| Intermediate (Between 3 and 5 miles) | 299 | 0.83 (1.15) | 0.87 (1.12) | 0.04 (0.31) |
| Control Group (5 miles or more) | 935 | 0.83 (1.09) | 0.87 (1.11) | 0.03 (0.33) |
| Normal Weight Children at Baseline (BMI z-score < 85) | 802 | 0.05 (0.73) | 0.11 (0.78) | 0.06 (0.35) |
| Near (within 1.5 miles) | 30 | 0.06 (0.70) | 0.11 (0.86) | 0.05 (0.36) |
| Intermediate (Between 1.5 and 3 miles) | 86 | 0.18 (0.63) | 0.25 (0.71) | 0.07 (0.35) |
| Intermediate (Between 3 and 5 miles) | 165 | −0.03 (0.70) | 0.06 (0.73) | 0.09 (0.33) |
| Control Group (5 miles or more) | 521 | 0.06 (0.75) | 0.10 (0.80) | 0.04 (0.36) |
| Overweight/Obese Children at Baseline (BMI z-score ≥ 85) | 641 | 1.82 (0.52) | 1.84 (0.57) | 0.02 (0.29) |
| Near (within 1.5 miles) | 15 | 1.71 (0.41) | 1.77 (0.51) | 0.06 (0.27) |
| Intermediate (Between 1.5 and 3 miles) | 78 | 1.81 (0.49) | 1.88 (0.55) | 0.07 (0.27) |
| Intermediate (Between 3 and 5 miles) | 134 | 1.89 (0.56) | 1.86 (0.59) | −0.02 (0.26) |
| Control Group (5 miles or more) | 414 | 1.81 (0.51) | 1.83 (0.57) | 0.02 (0.30) |
| Variable | Regression Coefficient | SE | Type III p-Value |
|---|---|---|---|
| Near (within 1.5 miles) | −0.1895 | 0.1656 | 0.2519 |
| Intermediate (Between 1.5 and 3 miles) | 0.1243 | 0.0924 | |
| Intermediate (Between 3 and 5 miles) | 0.0079 | 0.0733 | |
| Post-park | 0.0302 | 0.0098 | 0.0007 |
| Near × Post-park | 0.0107 | 0.0460 | 0.4482 |
| (1.5–3 miles) × Post-park | 0.0401 | 0.0254 | |
| (3–5 miles) × Post-park | 0.0136 | 0.0199 | |
| Age at baseline | 0.0027 | 0.0005 | <0.0001 |
| Self-pay | −0.0115 | 0.0108 | 0.2895 |
| Male | −0.0366 | 0.0574 | 0.5233 |
| Black | 0.0502 | 0.0961 | 0.6019 |
| Hispanic | 0.4506 | 0.1168 | 0.0001 |
| Variable | Regression Coefficient | SE | Type III p-Value |
|---|---|---|---|
| Near (within 1.5 miles) | 0.0221 | 0.1252 | 0.4626 |
| Intermediate (Between 1.5 and 3 miles) | 0.1239 | 0.0776 | |
| Intermediate (Between 3 and 5 miles) | −0.0865 | 0.0600 | |
| Post-park | 0.0406 | 0.0132 | 0.0015 |
| Overweight/obese at baseline | 1.7354 | 0.0439 | <0.0001 |
| Near × Post-park | −0.0033 | 0.0572 | 0.4804 |
| (1.5–3 miles) × Post-park | 0.0330 | 0.0345 | |
| (3–5 miles) × Post-park | 0.0561 | 0.0266 | |
| Near × Ovw/ob at baseline | −0.1032 | 0.2145 | 0.3002 |
| (1.5–3 miles) × Ovw/ob at baseline | −0.1173 | 0.1127 | |
| (3–5 miles) × Ovw/ob at baseline | 0.1640 | 0.0887 | |
| Ovw/ob at baseline × Post-park | −0.0224 | 0.0196 | 0.2176 |
| Near × Post-park × Ovw/ob at baseline | 0.0335 | 0.0912 | 0.0845 |
| (1.5–3 miles) × Post-park × Ovw/ob at baseline | 0.0134 | 0.0508 | |
| (3–5 miles) × Post-park × Ovw/ob at baseline | −0.0961 | 0.0399 | |
| Age at baseline | 0.0010 | 0.0003 | 0.0016 |
| Self-pay | −0.0115 | 0.0107 | 0.2828 |
| Male | 0.0039 | 0.0348 | 0.9103 |
| Black | 0.0116 | 0.0581 | 0.8417 |
| Hispanic | 0.1098 | 0.0710 | 0.1221 |
© 2016 by the authors; licensee MDPI, Basel, Switzerland. This article is an open access article distributed under the terms and conditions of the Creative Commons Attribution (CC-BY) license (http://creativecommons.org/licenses/by/4.0/).
Share and Cite
Goldsby, T.U.; George, B.J.; Yeager, V.A.; Sen, B.P.; Ferdinand, A.; Sims, D.M.T.; Manzella, B.; Cockrell Skinner, A.; Allison, D.B.; Menachemi, N. Urban Park Development and Pediatric Obesity Rates: A Quasi-Experiment Using Electronic Health Record Data. Int. J. Environ. Res. Public Health 2016, 13, 411. https://doi.org/10.3390/ijerph13040411
Goldsby TU, George BJ, Yeager VA, Sen BP, Ferdinand A, Sims DMT, Manzella B, Cockrell Skinner A, Allison DB, Menachemi N. Urban Park Development and Pediatric Obesity Rates: A Quasi-Experiment Using Electronic Health Record Data. International Journal of Environmental Research and Public Health. 2016; 13(4):411. https://doi.org/10.3390/ijerph13040411
Chicago/Turabian StyleGoldsby, TaShauna U., Brandon J. George, Valerie A. Yeager, Bisakha P. Sen, Alva Ferdinand, Devon M. T. Sims, Bryn Manzella, Asheley Cockrell Skinner, David B. Allison, and Nir Menachemi. 2016. "Urban Park Development and Pediatric Obesity Rates: A Quasi-Experiment Using Electronic Health Record Data" International Journal of Environmental Research and Public Health 13, no. 4: 411. https://doi.org/10.3390/ijerph13040411