
Rainfall-Runoff Modeling Using the HEC-HMS Model for the Al-Adhaim River Catchment, Northern Iraq


1
Department of Civil Engineering, College of Engineering, The University of Basra, Al Basra 61004, Iraq
2
Department of Architectural Engineering, Faculty of Engineering, The University of Basra, Al Basra 61004, Iraq
3
Division of Water Resources Engineering, Faculty of Engineering, Lund University, P.O. Box 118, 221 00 Lund, Sweden
4
Department of Civil Engineering Science, School of Civil Engineering and the Built Environment, University of Johannesburg, Kingsway Campus, P.O. Box 524, Aukland Park, Johannesburg 2006, South Africa
5
Department of Town Planning, Engineering Networks and Systems, South Ural State University (National Research University), 76, Lenin Prospekt, 454080 Chelyabinsk, Russia
*
Author to whom correspondence should be addressed.
Hydrology 2021, 8(2), 58; https://doi.org/10.3390/hydrology8020058
Submission received: 26 February 2021
/
Revised: 24 March 2021
/
Accepted: 24 March 2021
/
Published: 26 March 2021
(This article belongs to the Special Issue Advances in Modelling of Rainfall Fields)
Abstract
:It has become necessary to estimate the quantities of runoff by knowing the amount of rainfall to calculate the required quantities of water storage in reservoirs and to determine the likelihood of flooding. The present study deals with the development of a hydrological model named Hydrologic Engineering Center (HEC-HMS), which uses Digital Elevation Models (DEM). This hydrological model was used by means of the Geospatial Hydrologic Modeling Extension (HEC-GeoHMS) and Geographical Information Systems (GIS) to identify the discharge of the Al-Adhaim River catchment and embankment dam in Iraq by simulated rainfall-runoff processes. The meteorological models were developed within the HEC-HMS from the recorded daily rainfall data for the hydrological years 2015 to 2018. The control specifications were defined for the specified period and one day time step. The Soil Conservation Service-Curve number (SCS-CN), SCS Unit Hydrograph and Muskingum methods were used for loss, transformation and routing calculations, respectively. The model was simulated for two years for calibration and one year for verification of the daily rainfall values. The results showed that both observed and simulated hydrographs were highly correlated. The model’s performance was evaluated by using a coefficient of determination of 90% for calibration and verification. The dam’s discharge for the considered period was successfully simulated but slightly overestimated. The results indicated that the model is suitable for hydrological simulations in the Al-Adhaim river catchment.
1. Introduction
Surface water from the Tigris, Euphrates and Shatt Al-Arab rivers is the main water resource in Iraq. The water flow of these rivers varied from year to year depending on the incoming water flows coming from outside of Iraq and the annual rainfall intensity during the studied period [1].
The main factors affecting water shortage challenges in Iraq are the dams located outside of Iraq, in the Tigris and the Euphrates Rivers and their tributaries, climate change, and the mismanagement of Iraq’s water resources [2]. It has been reported that the growing water consumption in Turkey and Syria could lead to the complete drying-up of the Tigris and Euphrates rivers by the year 2040 [1].
The rivers of Iraq are also affected by the annual and seasonal precipitations. A year with heavy precipitations may lead to major floods and disasters, while a year with low precipitation amounts can lead to droughts damaging soil and endangering crops [3]. Excessive precipitations may also lead to runoffs, which occur when water that is discharged exceeds river, lake or artificial reservoir capacity. Often rainfall-runoff models are used for modeling or predicting possible floods as well as rivers and lakes’ water levels during different boundary conditions [4].
Hydrologic Engineering Center (HEC-HMS) is a hydrologic modeling software developed by the US Army Corps of Engineers of the Hydrologic Engineering Center (HEC), which contains an integrated tool for modeling hydrologic processes of dendritic watershed systems. This model consists of several components for processing rainfall loss, direct runoffs and routing. The HEC-HMS model has been widely used, for example, in many hydrological studies because of its simplicity and capability to be used in common methods [5].
The Geospatial Hydrologic Modeling Extension (HEC-GeoHMS) is a public-domain software package for use with Geographical Information Systems (GIS), GeoHMS ArcView and Spatial Analysis to develop several hydrological modeling inputs. After analyzing the information of the Digital Elevation Model (DEM), HEC-GeoHMS transforms the drainage paths and watershed boundaries into a hydrologic data structure that represents the watershed response to rainfall [6]. An important feature of the HEC-GeoHMS model is the assignment of the curve numbers (CN), which are related to the land use/land cover and soil type of the Al-Adhaim catchment.
Several researchers have used the HEC-HMS hydrological model to represent flow by simulated rainfall-runoff processes. In this regard, a study conducted by Oleyiblo et al. [7] on the Misai and Wan’an catchments in China used the HEC-HMS model for flood forecasting. The results were calibrated and verified using historical observed precipitation data, which showed satisfactory results. Saeedrashed et al. [8] used computational hydrological and hydraulic modeling systems designed by using the interface method, which links GIS with the modeling systems (HEC-HMS and HEC-RAS). They conducted a floodplain analysis of the Greater Zab River. Their model calibration and verification processes showed satisfactory results. Martin et al. [9] used HEC-GeoHMS in the Arc-Map environment to predict floods by hydraulic modeling. They obtained flood hazard maps by exporting the HEC-RAS model output results to Arc- Map, where they were processed to identify the flood-expanded areas. The results from the flood hazard maps showed that the areas more prone to floods were located in the river middle reach.
HEC-HMS has also been used by Tassew et al. [10] to conduct a rainfall-runoff simulation of the Lake Tana Basin of the Gilgel Abay catchment in the upper Blue Nile basin in Ethiopia by using six extreme daily time-series events. The Nash Sutcliffe Efficiency (NSE) accounts for the comparison between the simulated and observed hydrographs. The coefficient of determination R2 was 0.93 indicating that the model was appropriate for hydrological simulations. HEC-HMS and GIS were successfully used to simulate the rainfall-runoff process in the Karun river basin in Iran [11], as well as the inflow designed floods and dam breach hydraulic analyses of four reservoirs in the Black Hills, South Dakota [6]. Other examples include the modeling of the watershed in Ahvaz, Iran [12,13], the simulation of the runoff process for the adjoining areas of the Lagos Island and Eti-Osa Local Government Areas and the assessment of the influence of different levels of watershed spatial discretization on the HEC-HMS model’s performance for the Uberaba River Basin region [14].
Generally, it is important to mention that in Iraq, and especially in the area under assessment, very few studies have used such a modeling approach. Large input data have been prepared for the model, including maps of DEM, land use/land cover, soil type and curve number, in addition to the rainfall data and observed discharge values. Furthermore, the Al-Adhaim catchment characteristics have been created and prepared using HEC-Geo HMS, which were subsequently exported to HEC-HMS. This study will provide good support for other researchers to continue with such studies for adjacent catchments as well as other catchments, providing water resources management control in Iraq.
The main objective of this study is to develop the HEC-HMS hydrological model using remotely sensed data such as DEM. The hydrological model was used in combination with HEC-GeoHMS and GIS to identify the flow by simulating the rainfall-runoff processes for the Al-Adhaim catchment. Model input parameters were calculated for the HEC-HMS model. The rapid increase of water demand in Iraq, as well as the predicted water storage problems due to various factors (mainly climate change), can be assessed by hydrological modeling, which can help decision-makers to take preemptive actions such as storing water in the dams, depending on rainfall-runoff predictions. Furthermore, the calibrated parameters of this model can be used for future hydrological studies in this and adjacent catchments.
2. Methodology
The Al Adhaim hydrologic model was created by means of HEC-GeoHMS and particularly by using DEM of the studied areas, obtained from the United States Geological Survey (USGS) website. HEC-GeoHMS creates an HMS input file, such as the catchment of the area under study, a stream network, sub-basin boundaries, and different hydrological parameters in an Arc map environment via a series of steps. An HEC-HMS model for the Al-Adhaim catchment was developed, and simulations were run with daily rainfall recorded data.
2.1. Description of Study Area
The studied area (Al-Adhaim catchment) is located in the northeast of Iraq and comprises a dam with a reservoir downstream of the river (Figure 1). There is also a discharge gauge downstream of the dam. The Al-Adhaim river is the main source of freshwater for the Kirkuk Province. The length of the river is close to 330 km. The river joins the Tigris River at about 15 km to the south of the Balad district. The river drains an area of 13,000 km2 and then runs almost dry from June to October. Floods take place from November to May each year, as they are mainly fed by rainfall. The total summation of the rainfall for the Al-Adhaim catchment for the recent years equals to 489, 915, 415 and 623 mm for the hydrological years 2014 to 2018 in that order. Note that it was not raining during the months of June, July, August and September [15], while the temperature ranged from 2 °C to 48 °C. Al-Adhaim can be classified as an arid catchment with 71% of its surface being covered by forests and 29% by agricultural lands [2].
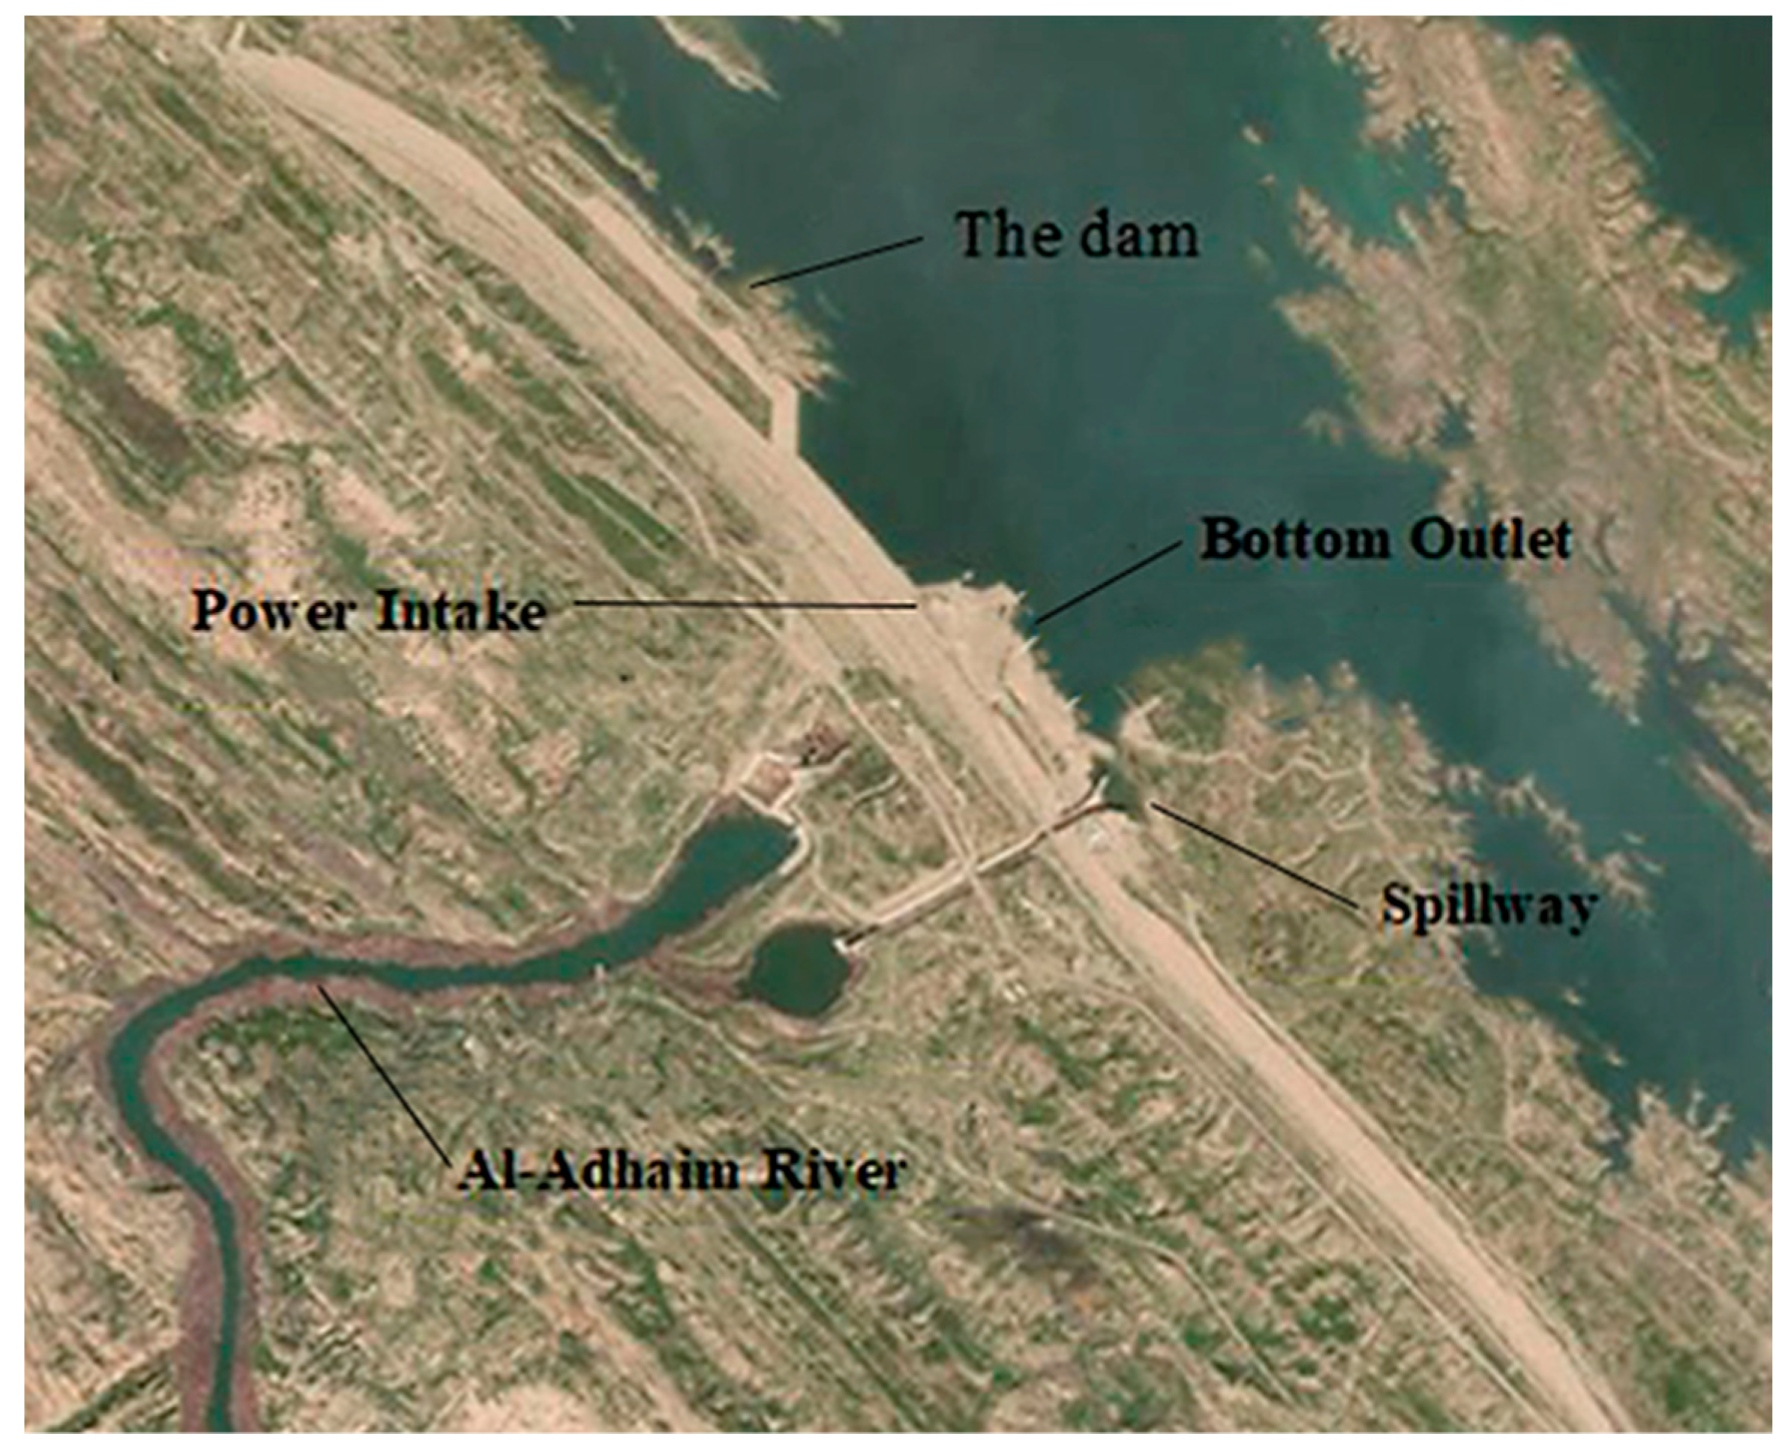
Al-Adhaim dam is located downstream of the river, within the administrative borders of the Diyala Province (34°32′ N and 44°30′ E, about 135 km northeast of the capital Baghdad, 65 km southeast of Kirkuk Province, and 70 km upstream from Al-Adhaim’s confluence with the Tigris River). The main purposes of this dam are flood control, irrigation and obtaining hydropower energy (Figure 1).
The Al-Adhaim dam is a 3.8 km long and 150 m high earth-filled embankment dam. Its width is about 10 m at its highest point. It was built in 1999, and consists of a spillway intake, a bottom outlet gate shaft, and a power intake (Figure 1). Its storage capacity, live storage and spillway discharge are about 1.5 × 10⁹ m3, 1 × 10⁹ m3 and 1150 m3, respectively. The crest of the dam, which is 15 m long, follows an ogee spillway shape profile according to the United States Bureau of Reclamation standard. It has an elevation of 131.54 m and is designed to pass a probable maximum flood discharge of 1150 m3/s [15].
The bottom outlet gate shaft is used for water release for irrigation purposes. The structure consists of an intake structure, which was used for releasing water through a closed conduit, which gradually transitions from a squared to a circular section. The intake is divided into two openings with the transition from a square section of 6 × 6 m2 to a 6 m diameter circular one, which starts the circular tunnel section. The gate shaft accommodates two gates: the upstream one (the guard gate) and the downstream one (the regulating gate).
The power intake was used for releasing water for irrigation and power generation purposes. This outlet includes a 50-m high reinforced concrete shaft at the beginning of the tunnel, which includes two emergency gates. The inlet is a 6.5 × 16 m2 streamlined rectangular opening with a shape gradually changing from a 4.5 × 4.5 m2 square section to 4.5 m diameter circular section.
The reservoir’s water surface area is 270 km2 at an elevation of 143 m, which is the maximum water elevation, and 122 km2 at an elevation of 130 m. The reservoir volume is 3750 million cubic meters (MCM). The highest operating elevation is 135 m, corresponding to an area of 170 km2 and a volume of 2150 MCM (Table 1), and the lowest operating elevation is 118 m, corresponding to 52 km2 and a capacity of 450 MCM. The water elevation and corresponding area and volume of the reservoir at the beginning of the hydrological year are shown in Table 2 [15,16]. The gates’ opening coefficients were used for calibration, because the discharge gate was downstream of the dam. The initial elevation of the water in the reservoir at the beginning of the hydrological year was also provided by the Central Statistical Organization of Iraq [17].
2.2. Daily Rainfall Data
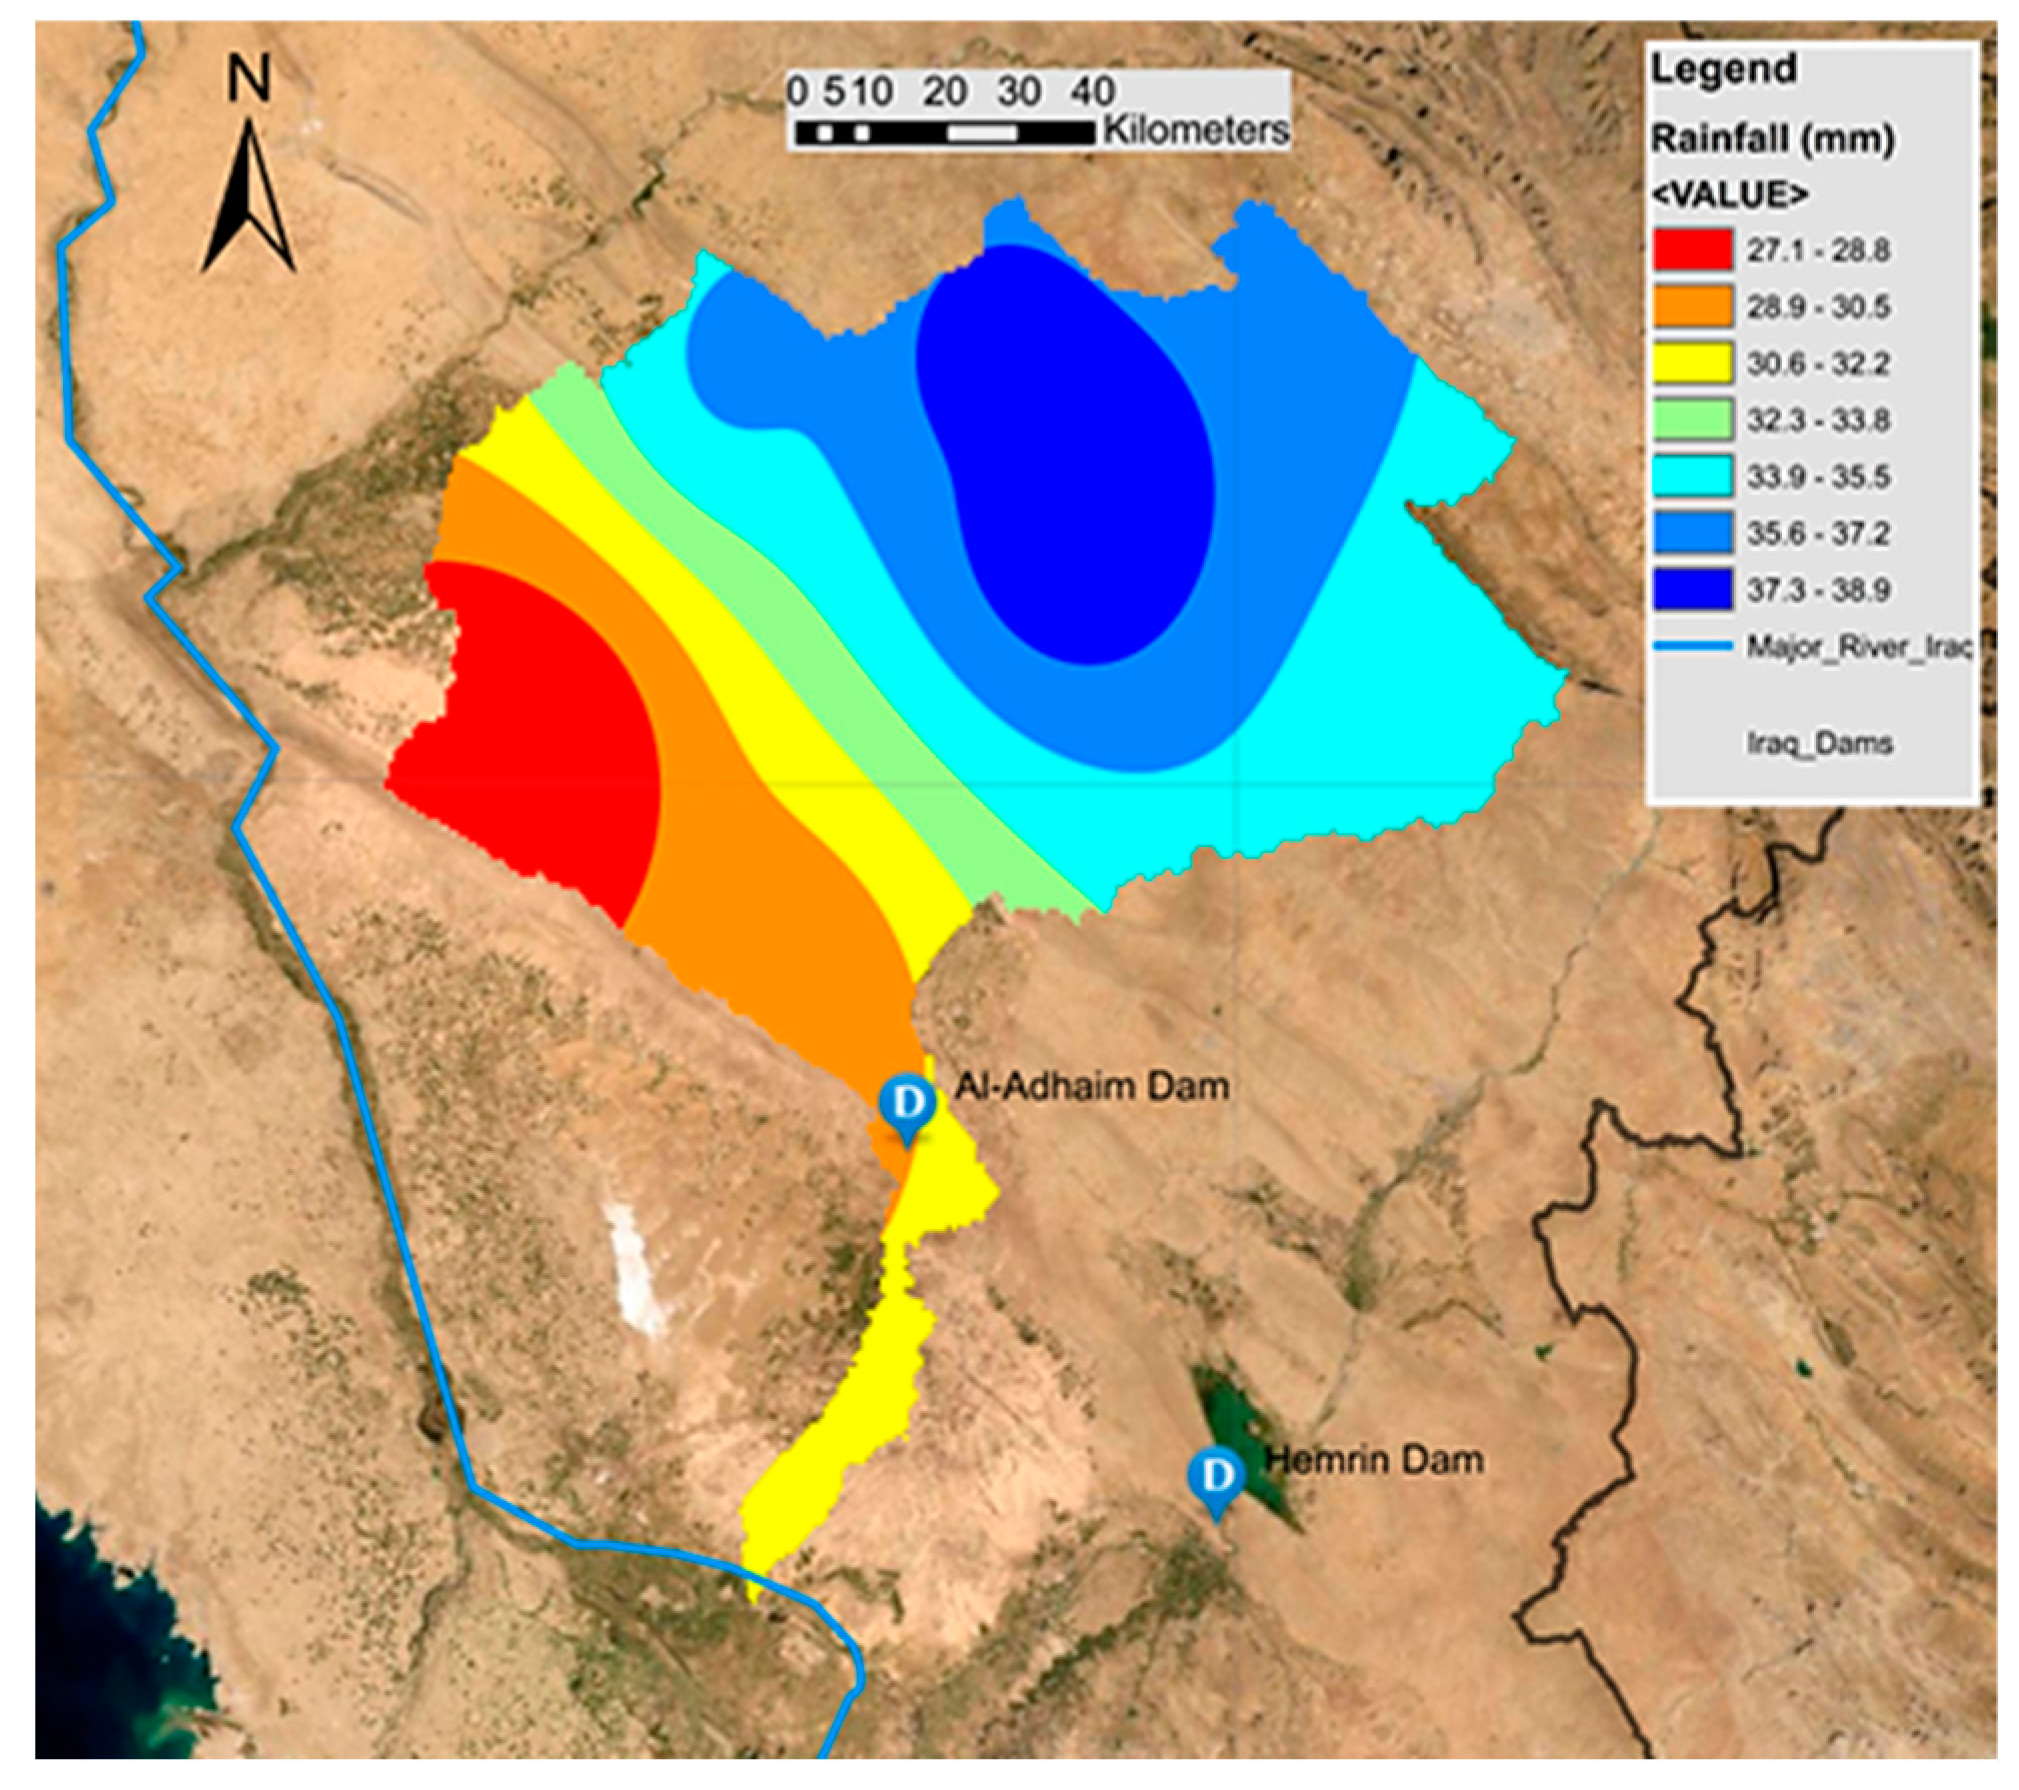
The rainfall season begins in October and ends in April for the majority of the Iraqi territory. The average rainfall increases from southwest to northeast due to topographical effects. The recorded daily rainfall data were downloaded from the Power Data Access Viewer website. Figure 2 shows the maximum rainfall amount for the last ten years for the studied area that occurred exactly on 17 November 2015, which approached 39 mm [18].
2.3. HEC-GeoHMS
HEC-GeoHMS is working under the GIS environment, which is a geospatial hydrology tool allowing users to determine sub-basin streams as an input for the HEC-HMS hydrological model [17]. In this study, Arc Map 10.5 and HEC-GeoHMS were used.
2.4. HEC-HMS Project Set-Up
The HEC-HMS software was applied to convert the rainfall data into direct flow taking into account the topography and the surface characteristics of the modelled location (e.g., length of the reach). The software also considers routing, loss, and flow transformation in the runoff computation. The data were checked, and the HEC-HMS model was developed, with the creation of several HEC-HMS parameters and the basin and meteorological model files.
Model Input Parameters
The parameters required for running the HEC-HMS model are listed in Table 3.
3. Results and Discussion
The temporal variation of the flow at the outlet of the catchment has been assessed by considering the model’s response for three years of separate precipitation. The basin was divided into nine sub-basins based on the river network. Runoff from the sub-basins was estimated by using the SCS-CN, SCS Unit Hydrograph and Muskingum methods for loss, transformation, and routing calculations, respectively. Some hydrological parameters were obtained by the calibration process that performed by comparing the simulated flow with the observed flow data measured by using a discharge gauge, which is located near to the outlet of the catchment.
3.1. Digital Elevation Model (DEM)
3.2. HEC-GeoHMS Development
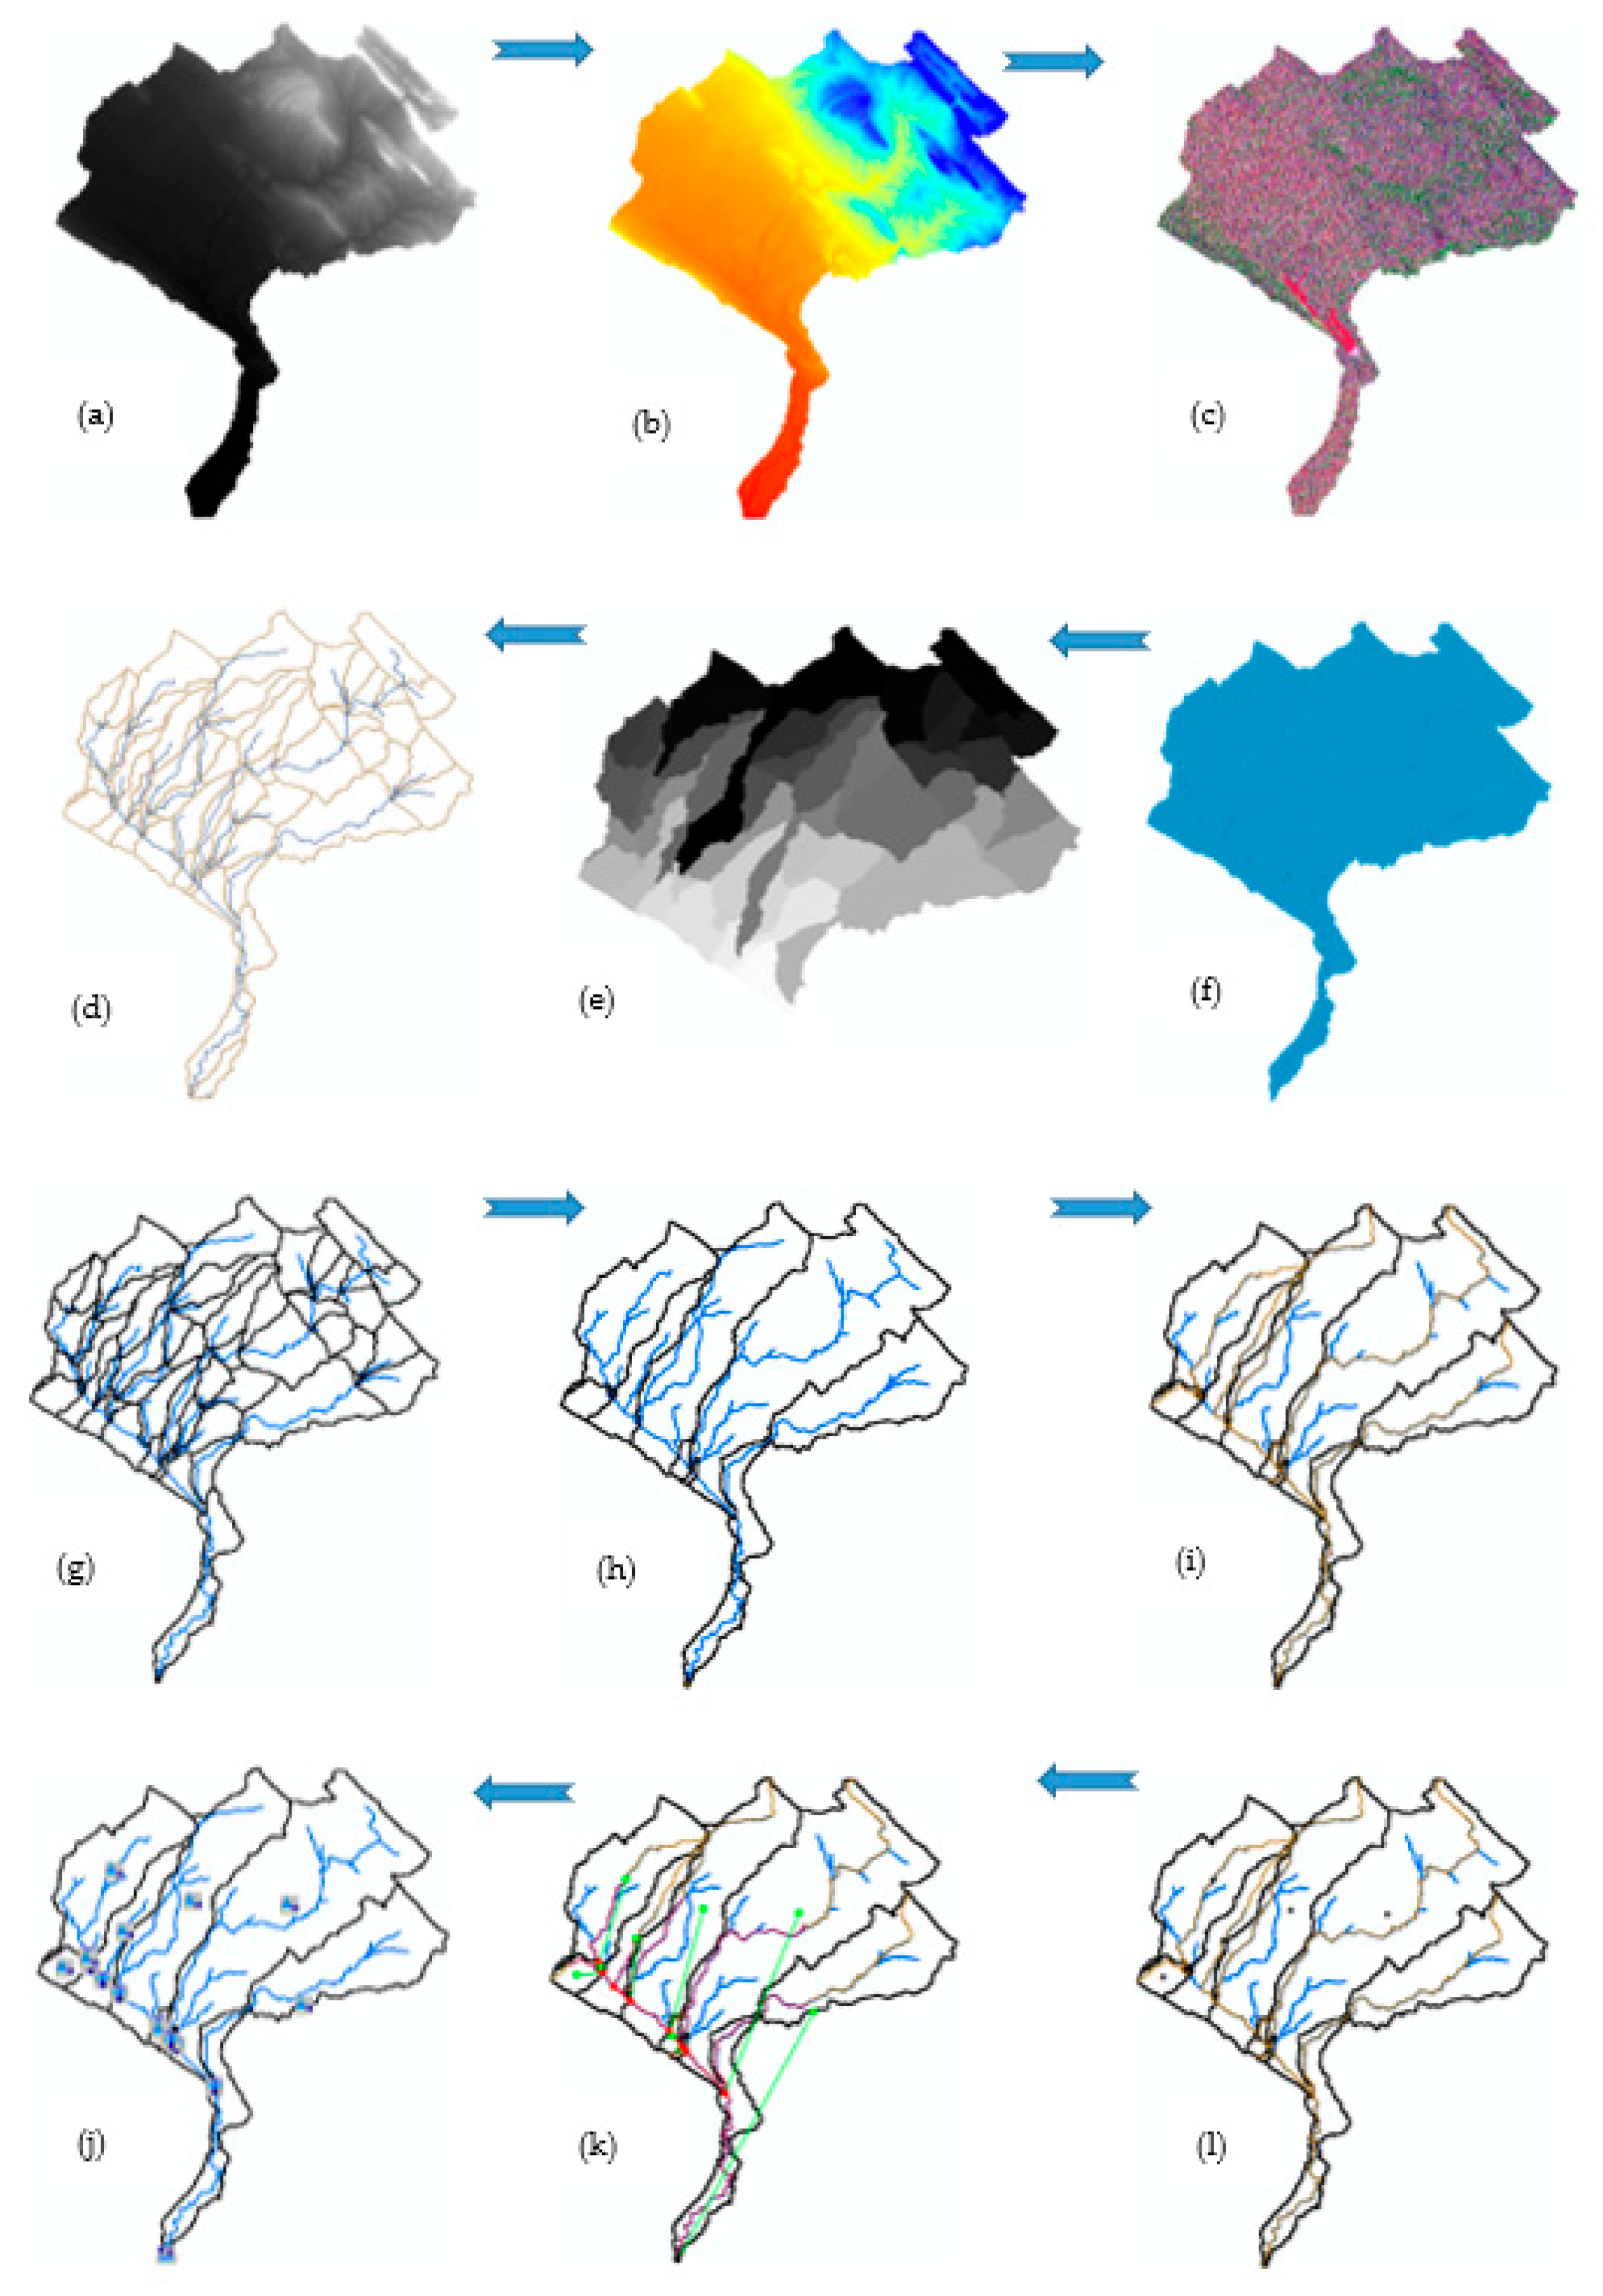
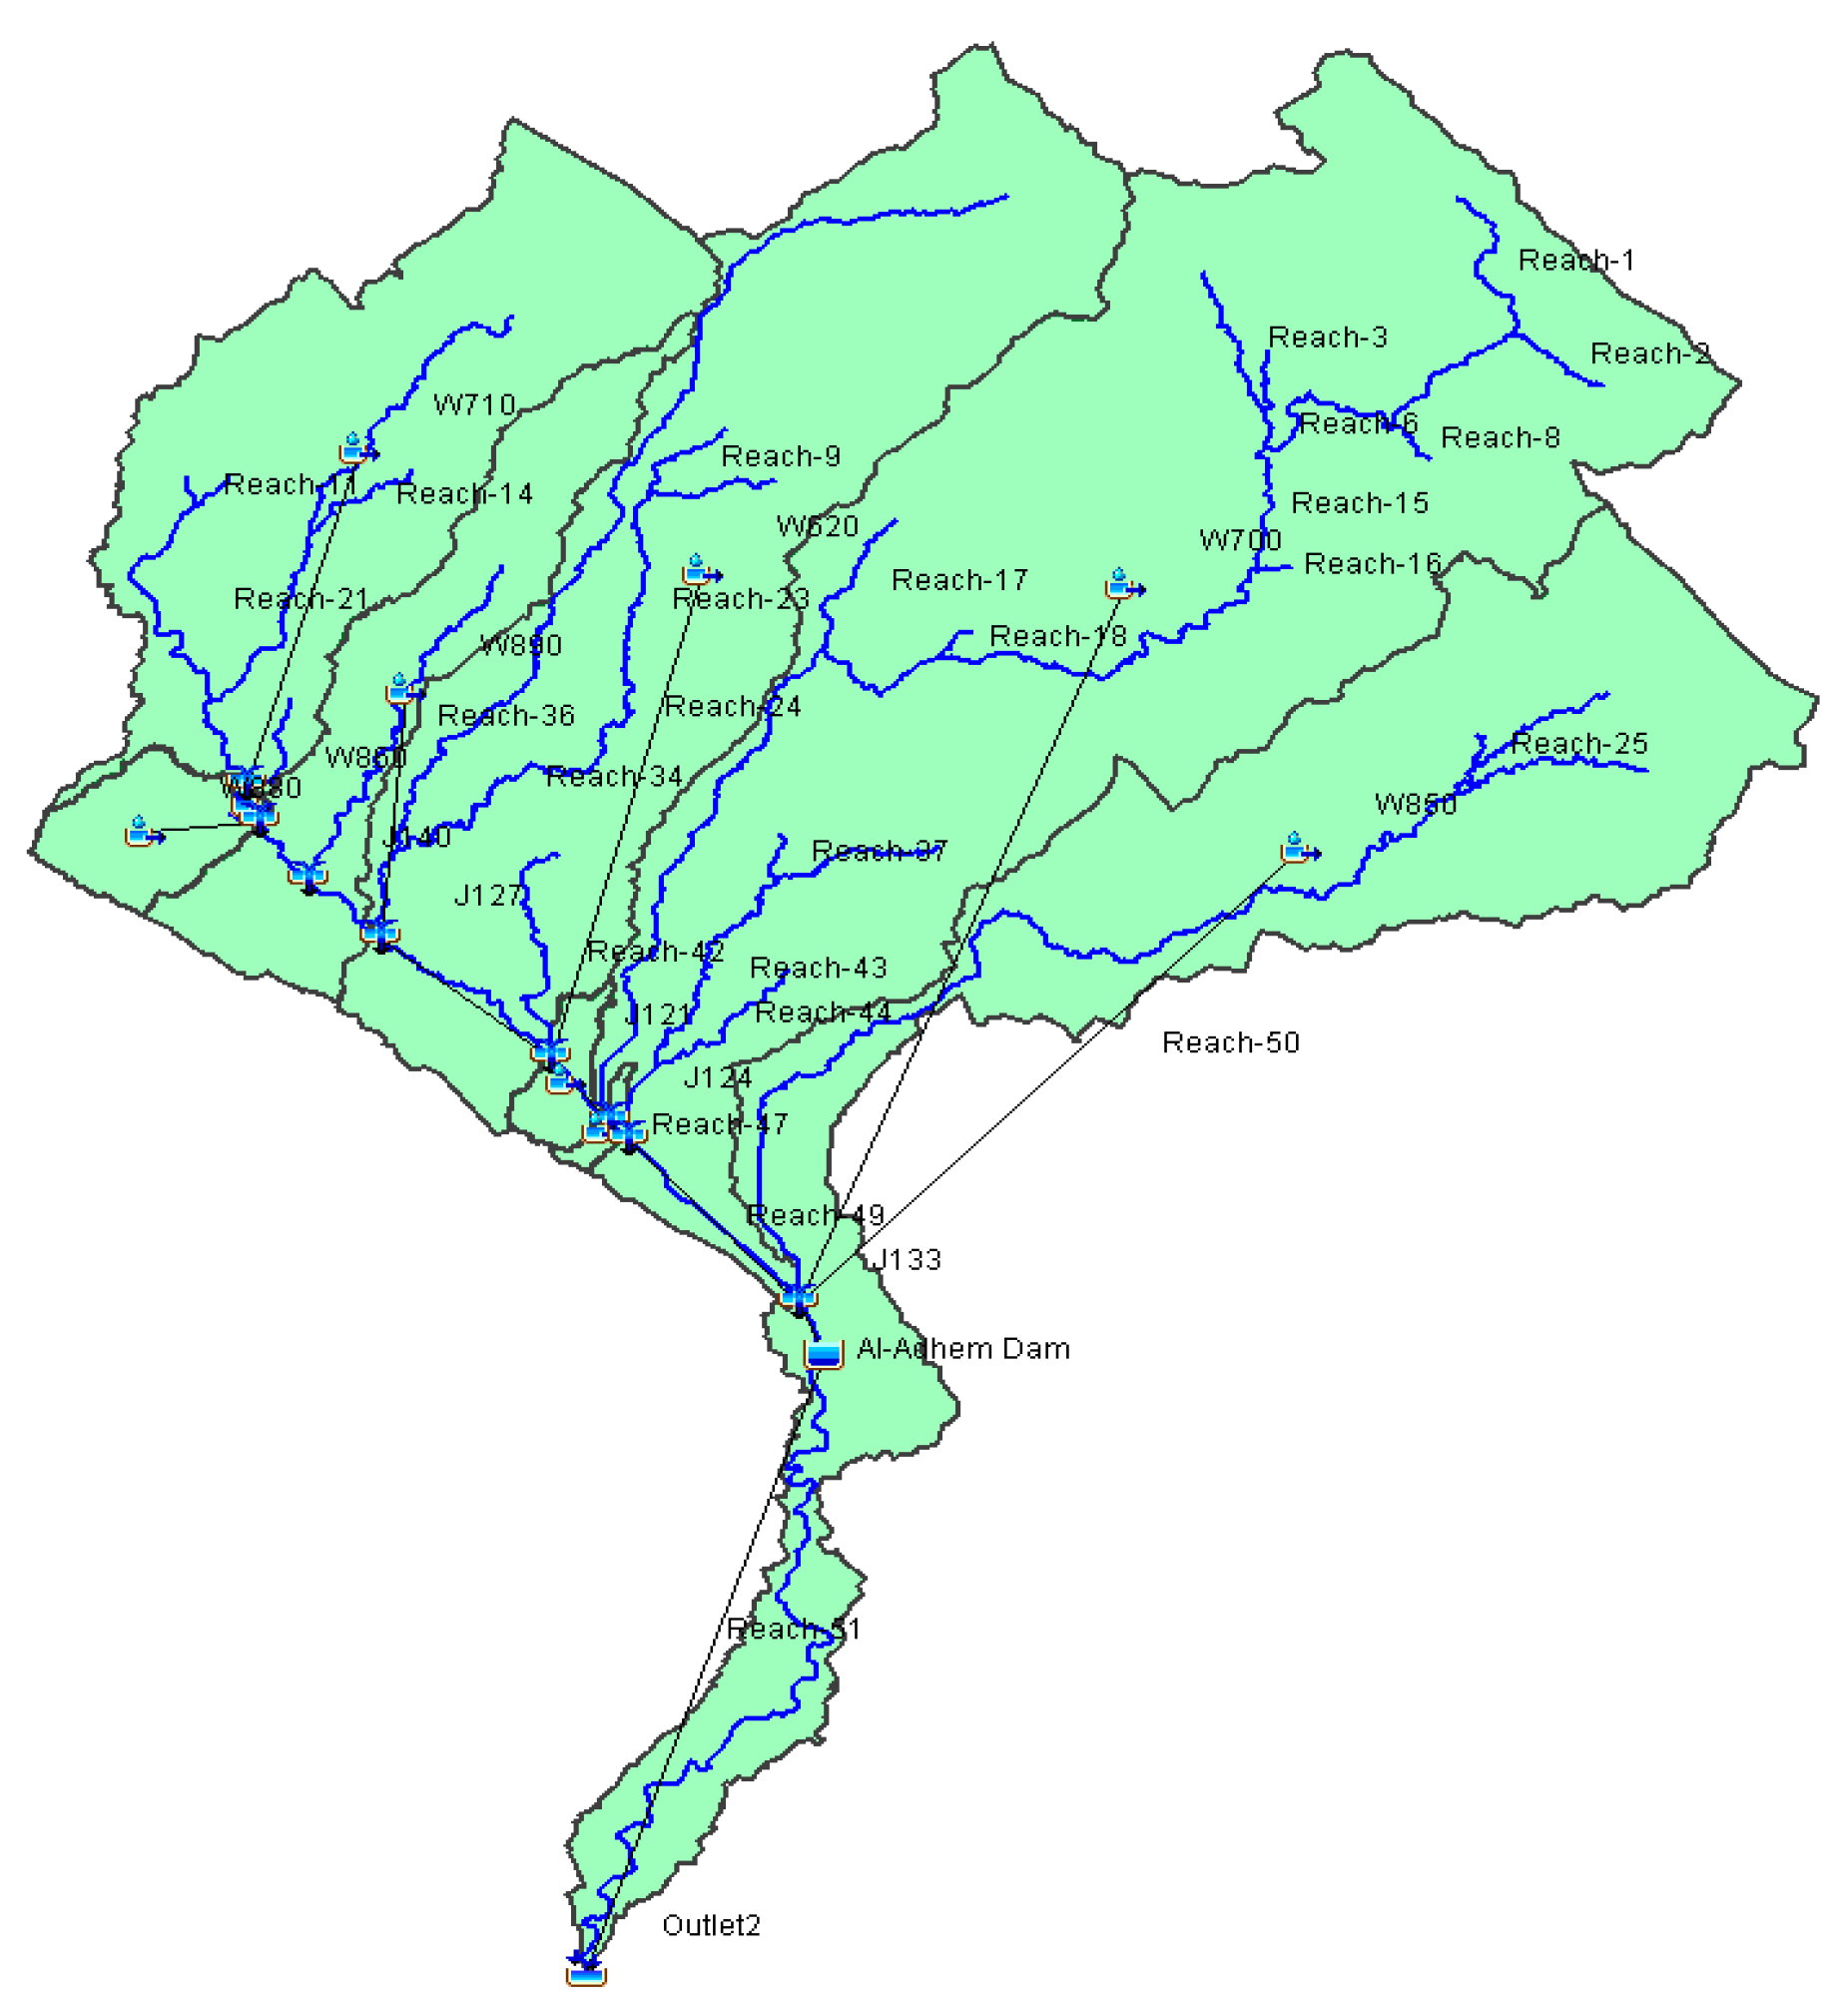
Terrain pre-processing and model development using HEC-GeoHMS is shown in Figure 4. In terrain pre-processing, the DEM sinks were filled, flow direction and flow accumulation were estimated, and catchments were separated. The catchment boundaries were drawn and stored as different shapefiles. Then, a suitable outlet point was selected at the outlet point located at 44°17′33.937″ E and 34°0′14.846″ N. After those basins were merged, the longest flow path and basin centroid were determined. After processing, the developed model became ready to export to HEC-HMS software. Extra processing was with HEC-GeoHMS and includes the estimation of hydrologic parameters, such as the curve numbers.
3.2.1. Soil Map and Land Use/Cover Shape Files
Procedures to get the soil types for the Al-Adhaim catchment include downloading of the raster file of the global soil type from the website http://www.fao.org/soils-portal/data-hub/soil-maps-and-databases/harmonized-world-soil-database-v12/en/, (accessed on 26 March 2021). Data were then exported to Arc map to clip the study area from the global map of soil types and convert it from the raster file to the shape file. A symbology has been performed afterwards. Finally, the created shape file has been merged with the land use/land cover type file to calculate the curve number.
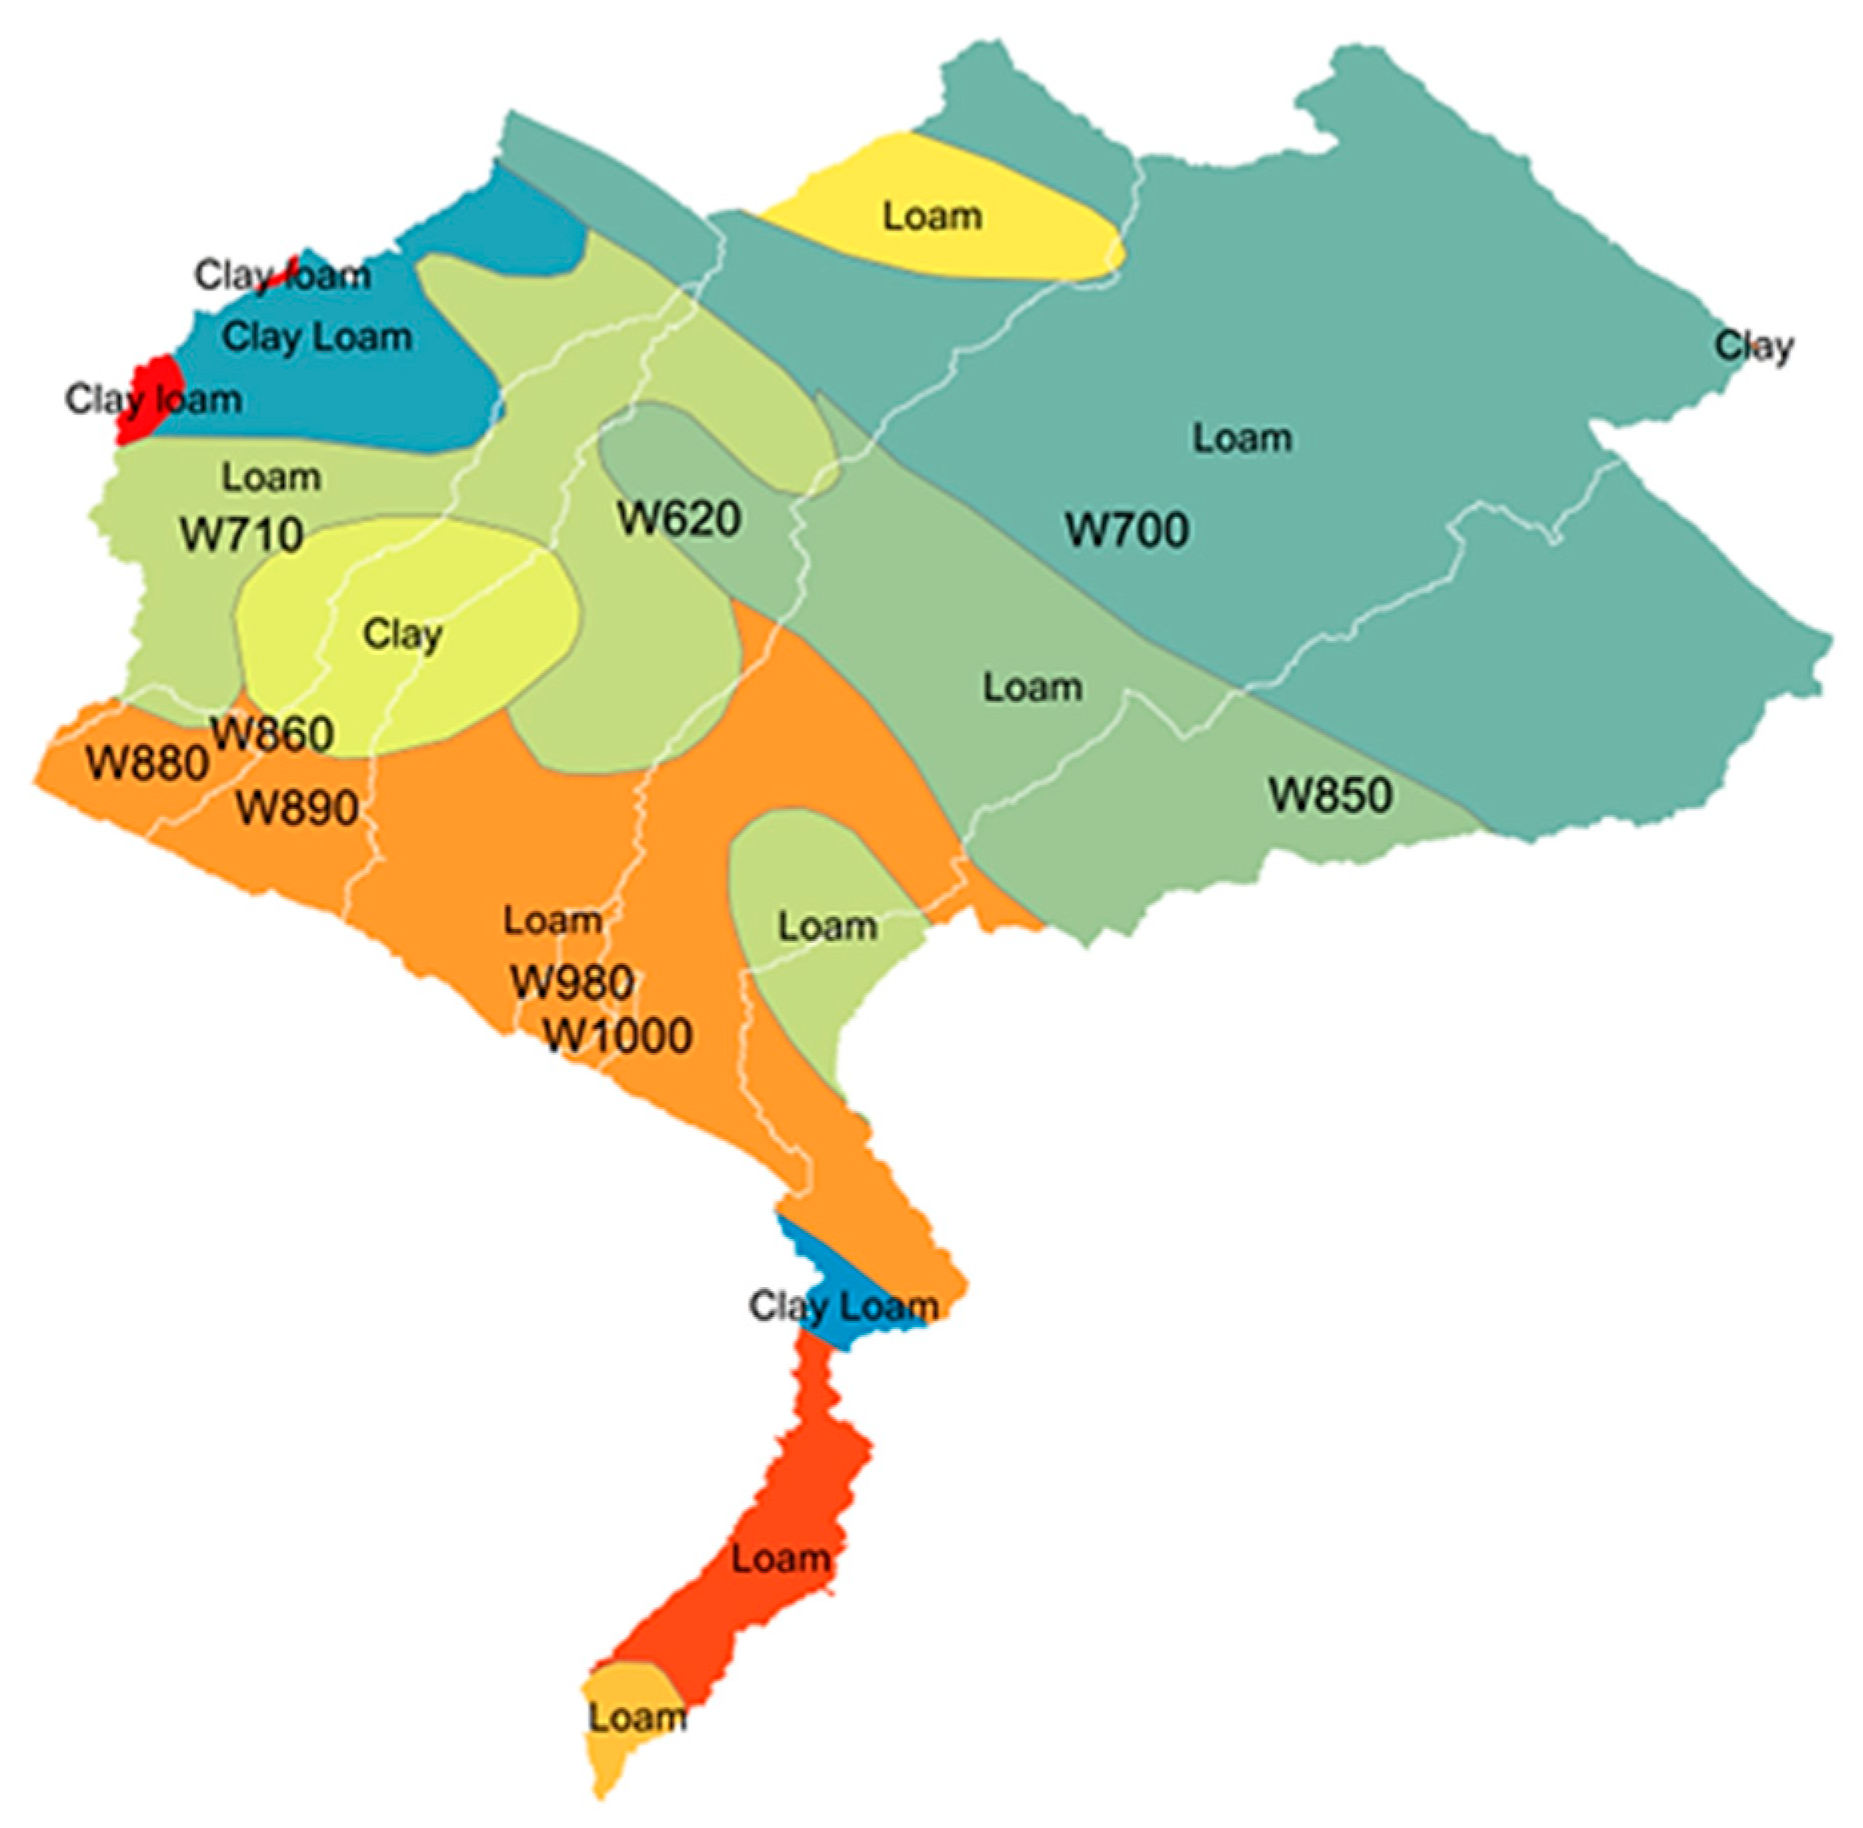
The soil upper layer in most of the areas of the Al-Adhaim catchment is considered as homogeneous, except in the middle region of the country, which is covered by mounds. The soil consists of mosaic clay or loam within a surface layer consisting mainly of silt, clay and silt loam. The sub-surface layer is mainly made of clay loam or clay (Figure 5). Land use (or land cover) is used as an input for a catchment model as it can affect surface erosion and water runoff [20].
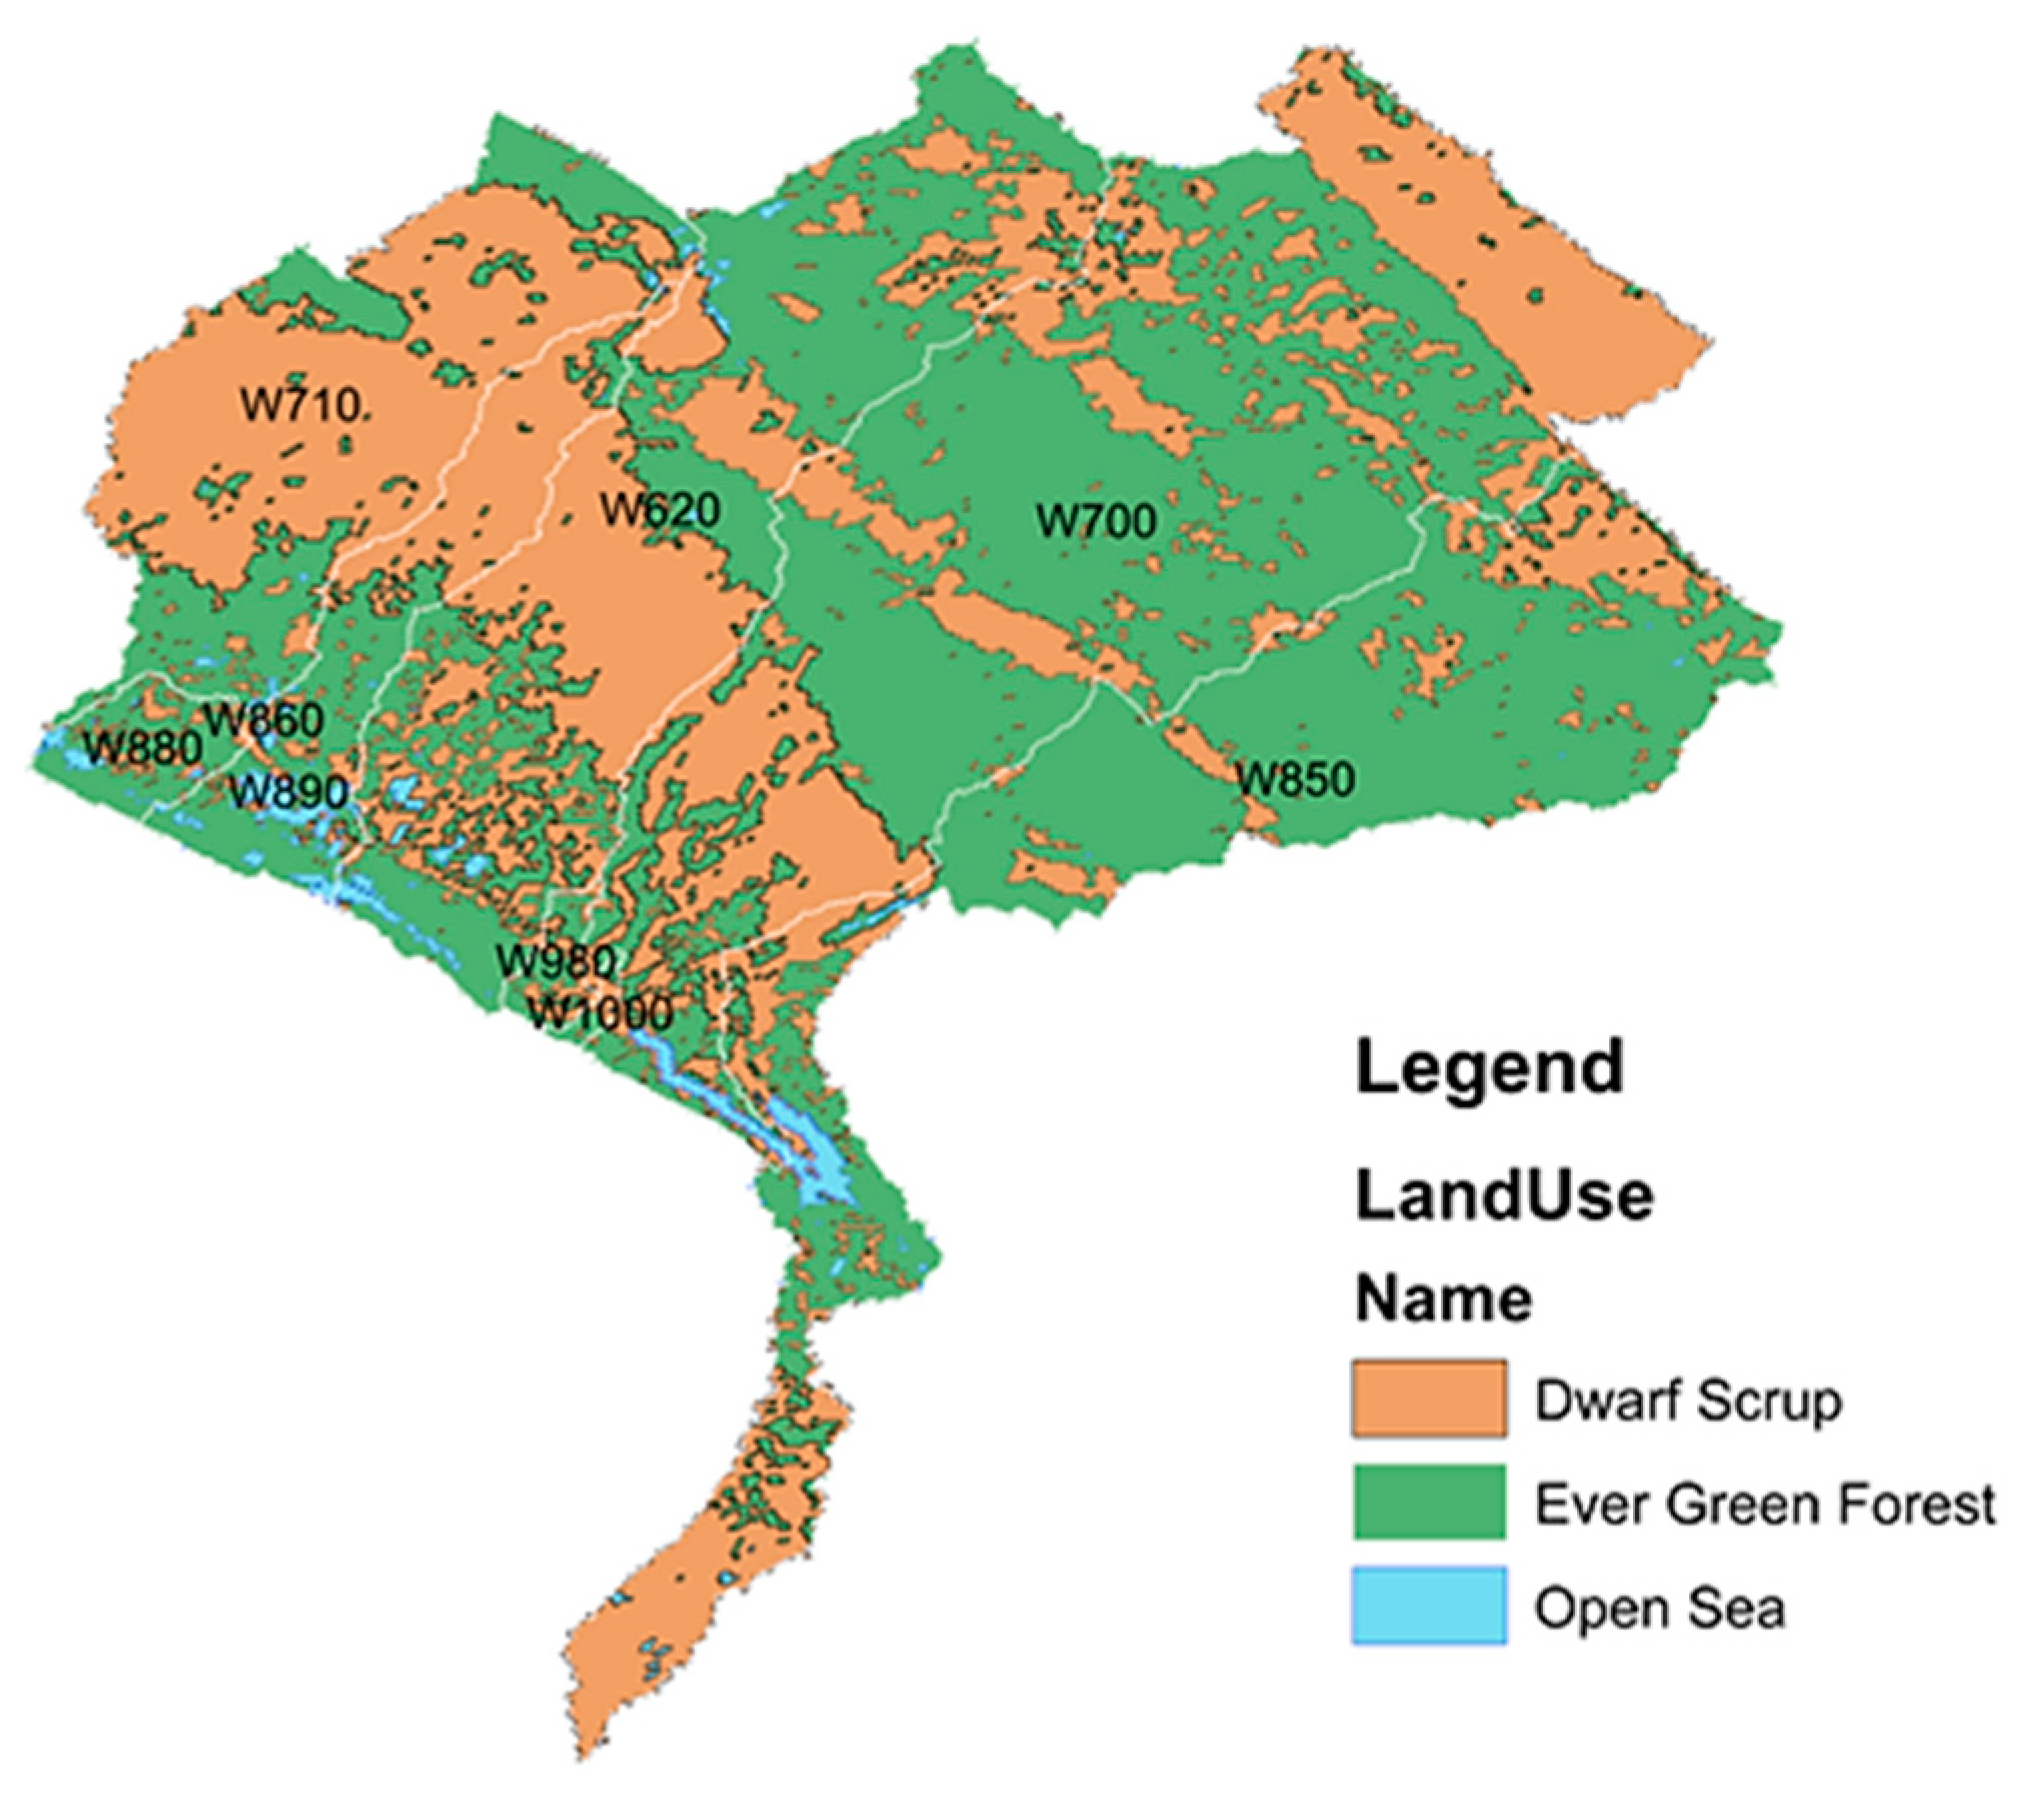
Procedures to get the land use/cover for the Al-Adhaim catchment include downloading of the raster file of the global soil type from the website http://due.esrin.esa.int/page_globcover.php, (accessed on 26 March 2021). Data were then exported to Arc map to clip the study area from the global map of soil types and convert it from the raster file to the shape file. A symbology has been performed afterwards. Finally, a shape file has been created by converting the raster to polygons to get a file that can be merged with the soil type file to calculate the curve number. The land use in the Al-Adhaim catchment is either Ever Green Forest, Dwarf Scrup or Open Sea (Figure 6).
3.2.2. Curve Number
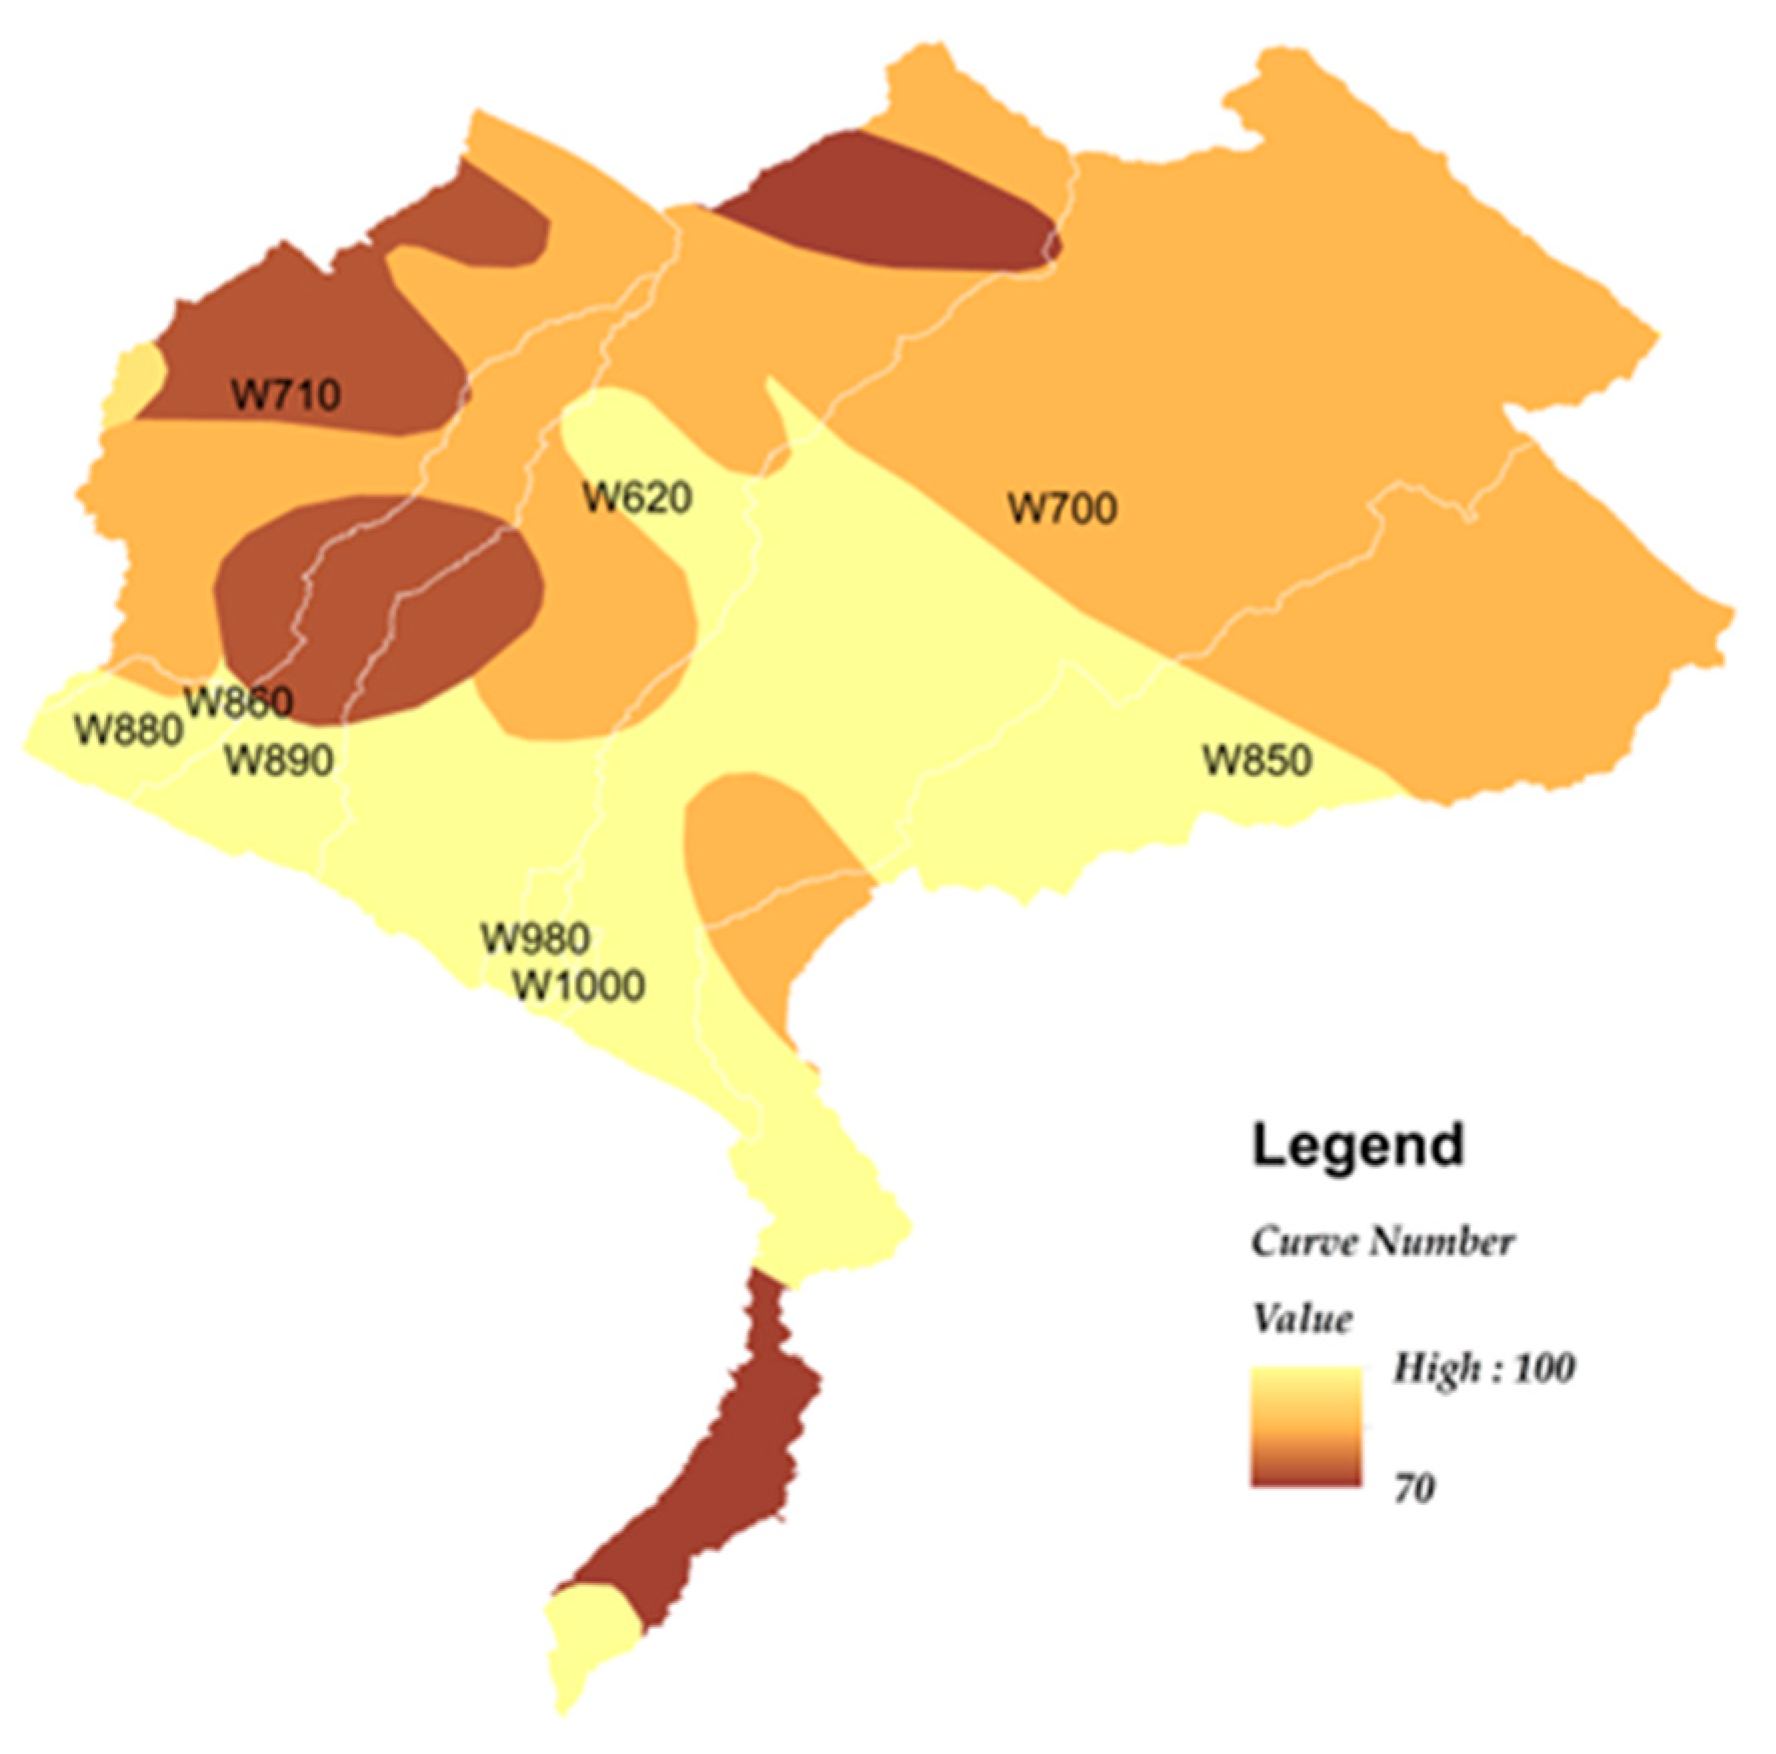
Soil map and land use datasets were used to generate the Curve Number (CN) grid file, which is required to build the HEC-HMS model. CN values were used to determine the stream/sub-basin characteristics and to estimate the hydrological parameters used in the model [10]; Figure 7. CN values range from 30 corresponding to permeable soils with high infiltration rates to approximately 100 corresponding to water bodies.
3.3. Parameters Estimation
3.3.1. Loss Model—Soil Conservation Service Curve Number
The loss models in HEC-HMS were calculated by subtracting the volume of water that was intercepted, infiltrated, stored, evaporated or transpired to the rainfall water volume [10]. We used the Soil Conservation Service Curve Number loss (SCS curve number) method to calculate the direct runoff from a design rainfall.
For the loss model, the SCS-CN has two parameters: the curve number (CN) and the initial abstraction (Ia). The default initial abstraction ratio was equal to 0.2 but then varied after the model calibration. The CN is a function of land use and soil type estimated by using the HEC-GeoHMS toolkit of Arc Map 10.5. The percentage of imperviousness for each sub-basin was assumed to be 0% (the entire catchment was assumed to be completely pervious). The CN values for each sub-basin were calculated by using formula (1) [21,22].
where Ai is the area (km2) of the sub-basin and CNi is the corresponding curve number. Ia (mm) is obtained by multiplying the loss coefficient by the potential abstraction S (mm). The potential abstraction is a function of CN and calculated by using the formula (2) [22].
3.3.2. Transform Model—Soil Conservation Service Unit Hydrograph Method
The transform prediction models in HEC-HMS simulate the process of excess rainfall direct runoff in the catchment and transform the rainfall excess in point runoff [10]. During the analysis of the study data, the SCS Unit Hydrograph model was used to transform the excess rainfall into runoff.
The basin lag time parameter values have been calculated during data processing by means of the HEC GeoHMS application and stored in the attributes’ table of the sub-basin data layer. Basin lag times were initially calculated in hours for the sub-basins by using Equation (3) and were then converted to minutes when used with HEC-HMS.
where S = maximum retention (mm) as defined by Equation (2), lag = basin lag time (hour), L= hydraulic length of the catchment (longest flow path) (feet) and Y = basin slope (%). Table 4 shows the Loss and Transform Model parameter value estimations.
3.3.3. Routing—Muskingum Method
As the flood runoff moves through the channel reach, it weakens because of the channel storage effects. The routing model available in the HEC-HMS software for this scenario was the Muskingum method [23].
The Muskingum method is a common lumped flow routing technique. In this model, a calibration for two parameters, X and K, was required. X is a dimensionless weight, which is a constant coefficient that varies between 0 and 0.5, where X is a factor representing the relative influence of flow on storage levels. It can be assumed that the value equals 0.1 as an initial value of the calibration parameters, which was corrected during the calibration process. K is the parameter having a unit of time and value ranging from 1 to 5 h. It is related to the delay between discharge peaks [24]. K is estimated using Equation (4).
where Vw is the flood wave velocity, which can be taken as 1.5 times the average velocity, and L is the reach length. The average velocity was obtained from the stream gauging sites. The value of K was used also in the calibration process within short limits based on Equation (4) until the simulated hydrographs approached the observed ones.
The rainfall runoff processes of the dendritic catchment systems were simulated by using the hydrological modeling system of the HEC-HMS software. After considering the pre-processing in the HEC-GeoHMS, the model was imported to the HEC-HMS software as a basin file. Figure 8 shows the basin model file. HEC-HMS input data are important to run the rainfall-runoff modeling.
The calculated parameters, such as loss parameters (curve number, initial abstraction and percentage of imperviousness), transform parameters (lag time) and routing parameters (k and x), were added to the sub-basins and the reaches either manually or automatically from the GIS attribute tables. The precipitation, temperature, evaporation and discharge gauge data were added as time series using the time series data manager, while the elevation-area table was added as paired data.
Three files were created for rainfall data input in the meteorological folder, corresponding to the hydrological year intervals 2015–2016, 2016–2017 and 2017–2018. For the control run, daily rainfall was started on 1 October at 00:00 and ended on 30 September at 00:00. The selected time interval for the hydrograph was of one day for the three corresponding hydrological years.
3.4. Model Calibration
The model is calibrated by using the daily rainfall data from the hydrological year intervals 2016–2017 and 2015–2016. Manual calibration was applied to estimate the values of the different parameters. The optimal values of the Muskingum Model parameters (K, X) were obtained by comparing the observed and simulated flows, while the parameters of the Loss Model and the Transform Model were calculated as explained in Section 3.3.1 and Section 3.3.2. The dam data and the data needed for running the HEC-HMS models such as the spillway level, the gates opening area and the center elevation were obtained from the Central Statistical Organization of Iraq [17].
3.5. Comparison of the Simulated and Observed Hydrograph and Validation of Model
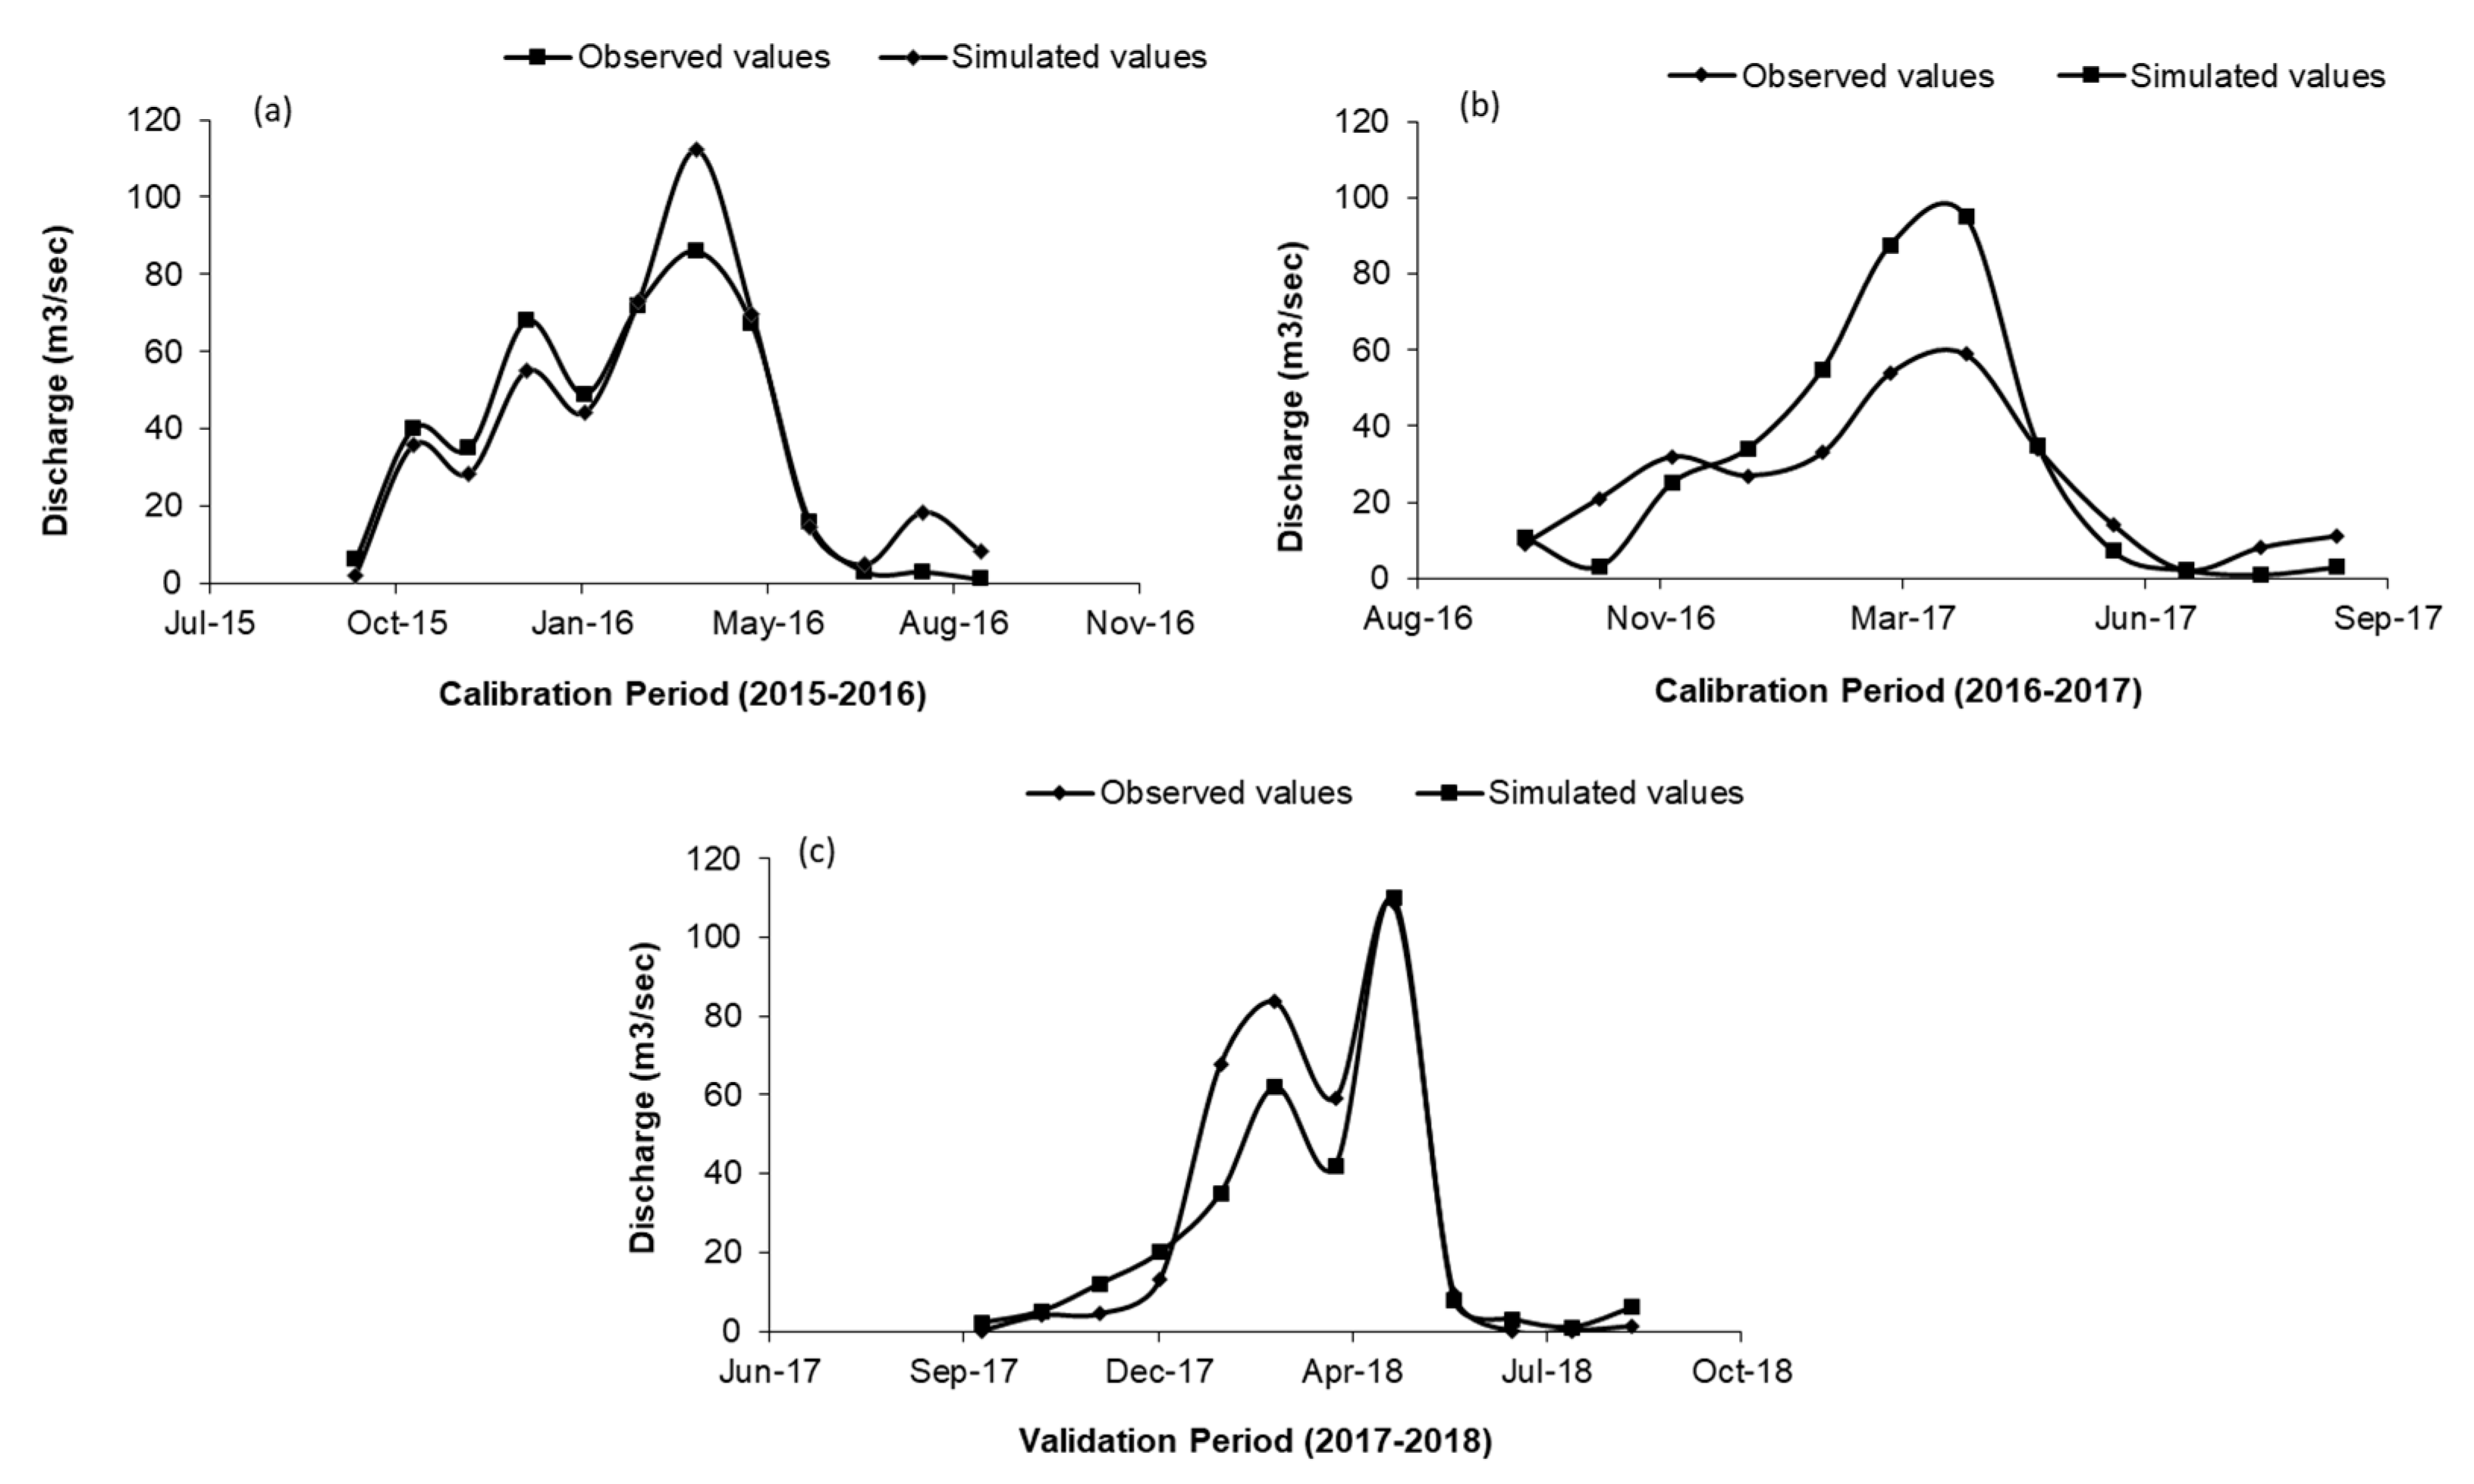
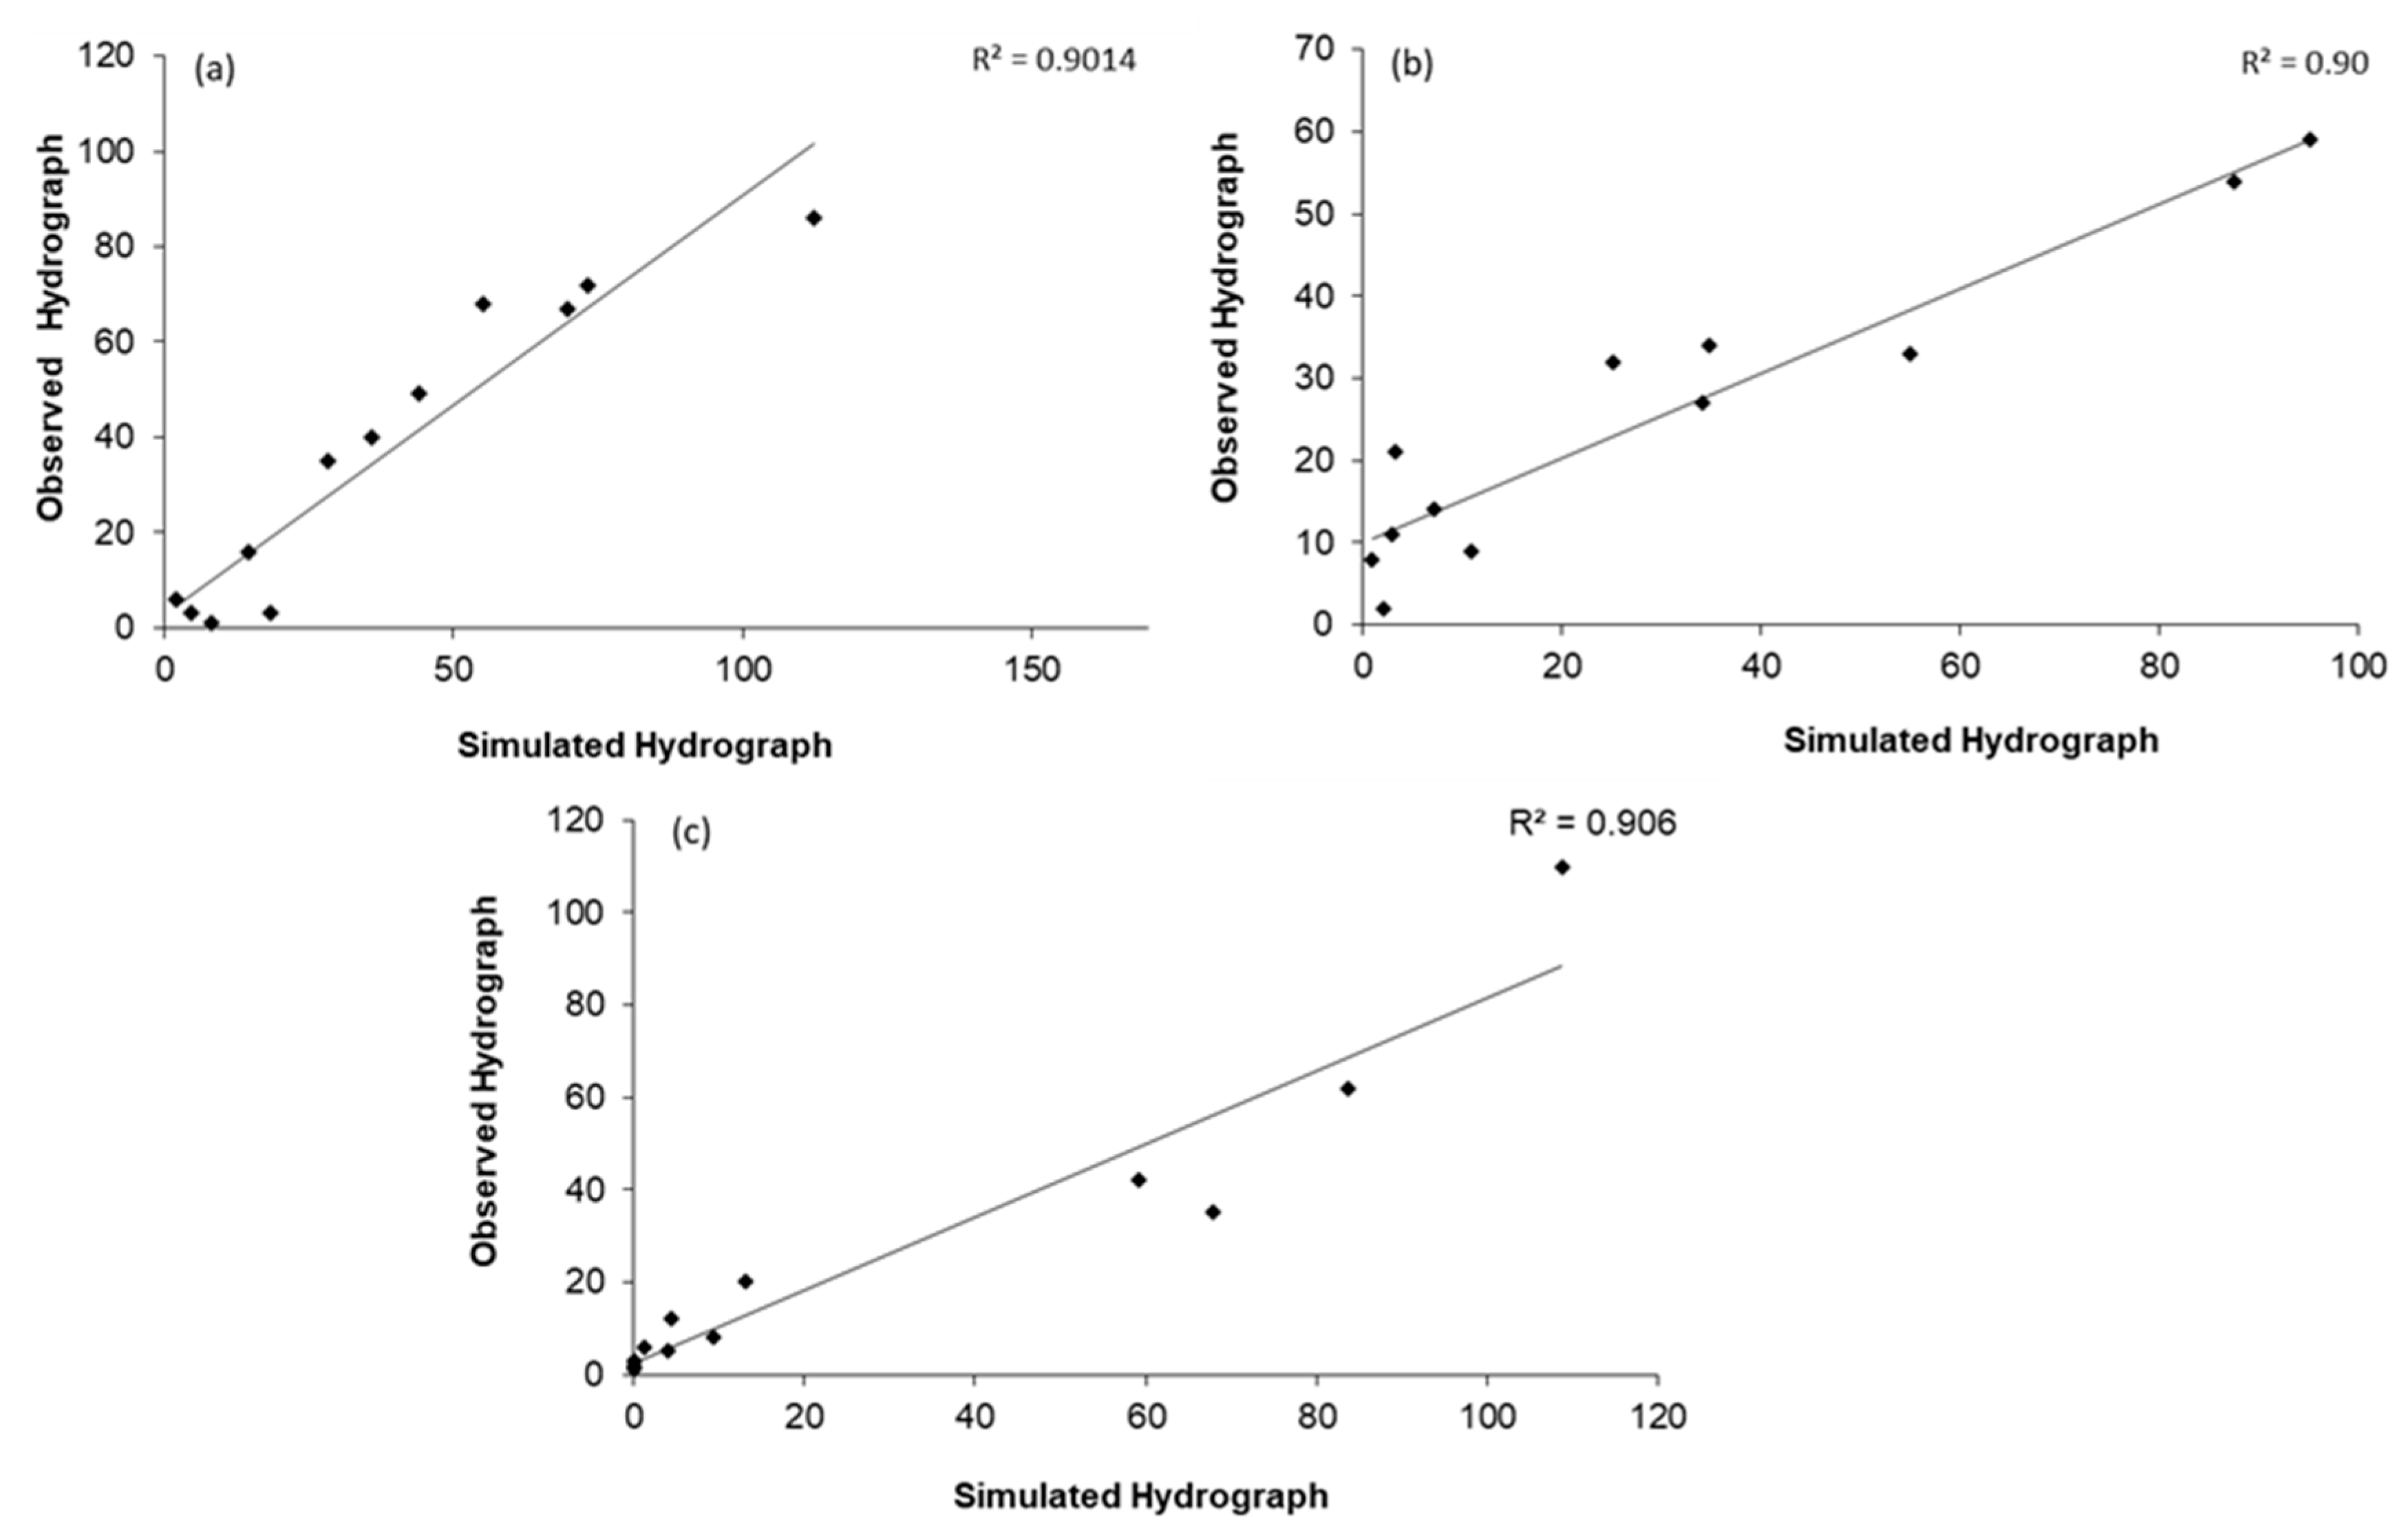
The simulated and observed hydrographs for the calibration period intervals 2015–2016 and 2016–2017 are shown in Figure 9a,b and Figure 10a,b for both the simulated and observed hydrographs exhibiting nearly similar trends and shapes. However, the peak discharge of the simulated hydrographs is greater than the observed ones. The results of the model in this study showed an acceptable fit between the simulated values and observations. The trend and shape of the hydrograph seems compatible. The R2 values for the calibration periods 2015–2016 and 2016–2017 were 0.90 for the outlet section.
The model was run for one year of daily rainfall data for validation purposes. The runoff was simulated by using the hydrological year interval 2017–2018 in the validation model. The model calibration parameters were applied to the validation model. The simulated and observed hydrograph and regression scatter plot for the outlet section for the validation period of the years 2017 and 2018 is presented in Figure 9c and Figure 10c. As observed in the calibration plots, the observed and simulated hydrographs are almost identical except for the peak discharge, which is higher for the simulated graph. The R2 for the validation period of 2017–2018 is 0.906 for the outlet section.
A similar result for R2 of 0.9 was obtained by Oleyiblo et al. [7] on Misai and Wan’an catchments in China using HEC-HMS. Tassew et al. [10] did a comparison of the observed and simulated hydrographs and the performance of the model was as follows: NSE = 0.884 and the R2 = 0.925. It follows that the model is suitable for hydrological simulations in the Gilgel Abay Catchment. Barbosa [14] used seven different methods to investigate the performance of the HEC-HMS model: MAE, RMSE, RSR, NSE, PBIAS, R2, and KGE. The researcher concluded that the HEC-HMS model represents the hydrological processes of the basin under investigation efficiently. The results suggest that the subdivision of a catchment does not result in the improvement of the HEC-HMS model’s performance without significant differences in physiographic characteristics; for example, the values of R2 ranged between 0.72 for two sub-basins to 0.73 for 32 sub-basins. From the above, it can be concluded that the model performs considerable well, and the simulation can be judged to be satisfactory.
During modeling using HEC-HMS, it was noticed that the main parameters which affect runoff quantities were the curve number and then initial abstraction. However, lag time and percentage of impervious area were less affected by the runoff results.
3.6. Reservoir Modelling
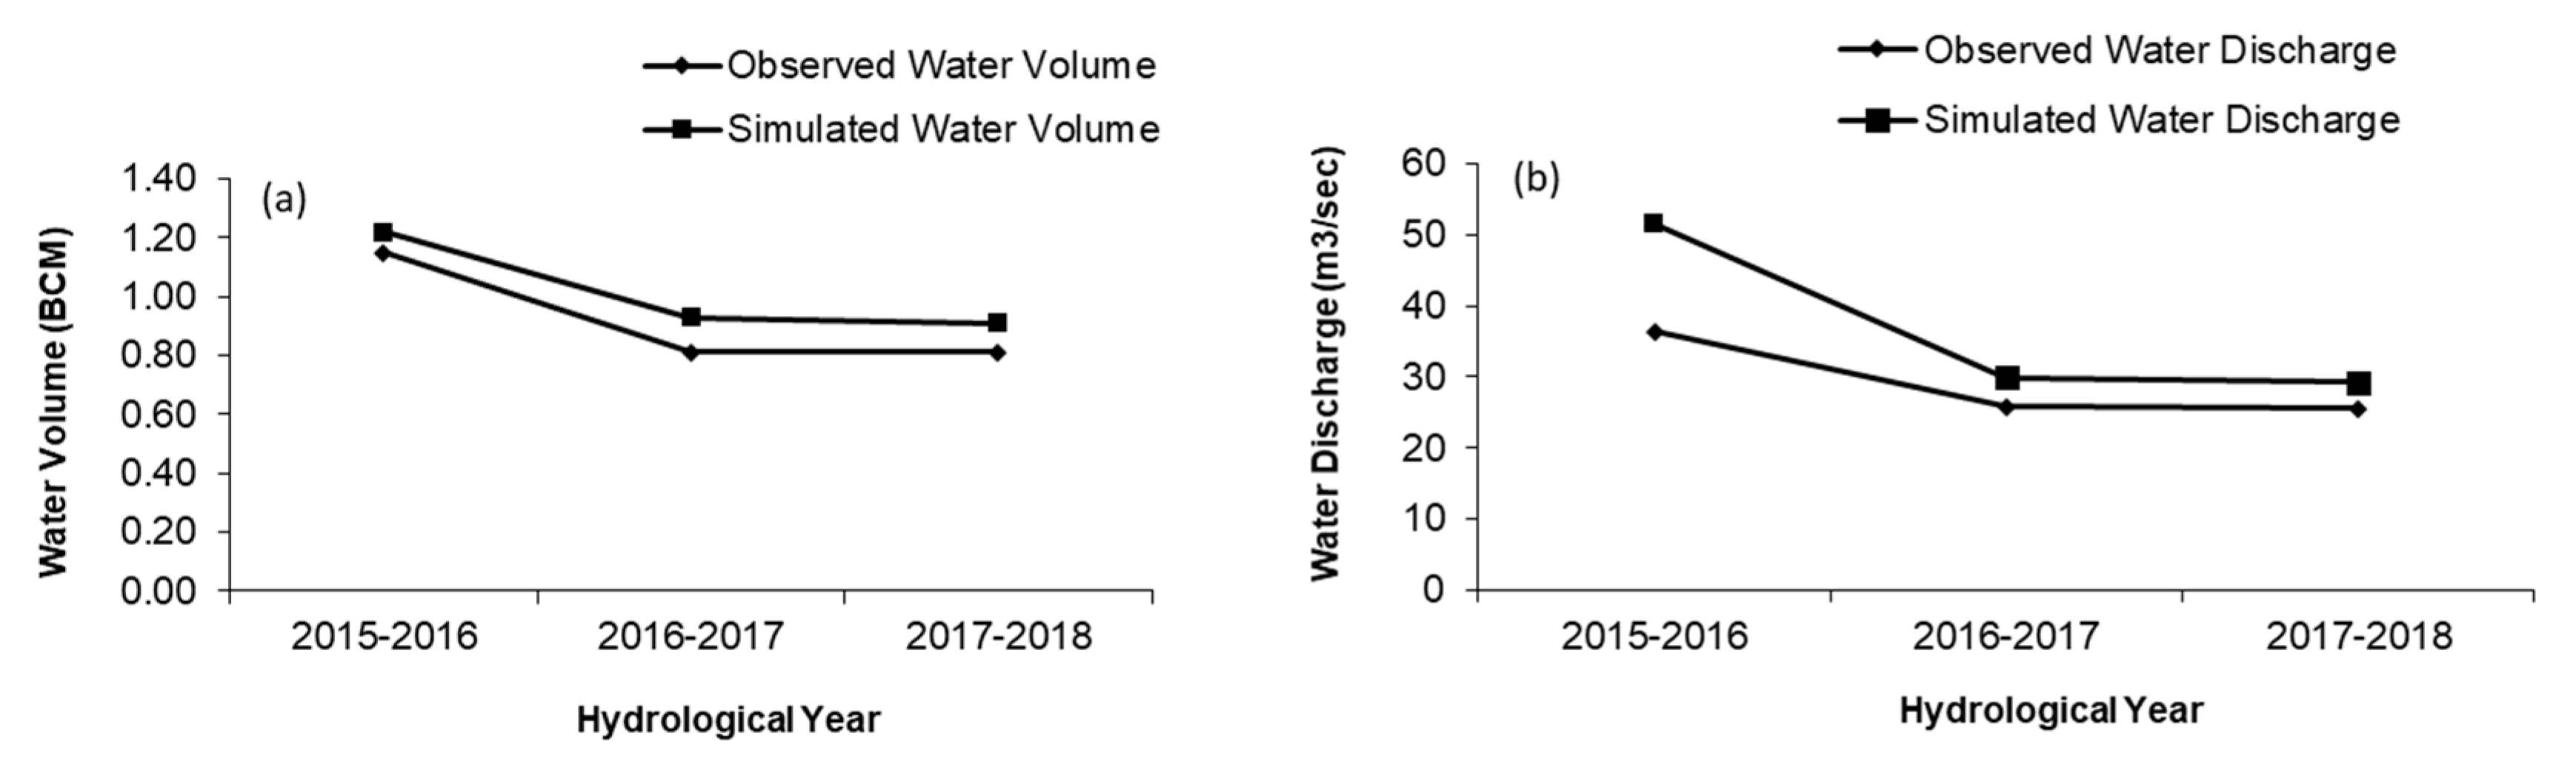
According to the Department of Environment Statistics [17], the observed annual volumes discharged from the dam concerning its outlet were 1.15, 0.81 and 0.81 billion cubic meters (BCM), while the simulated volumes were 1.22, 0.93 and 0.909 BCM for the hydrological year intervals 2015–2016, 2016–2017 and 2017–2018, respectively (Figure 11a). Additionally, the simulated values for the average annual discharge flow were 51.6, 29.9 and 29.3 m3/s, while the observed values [17] for the outlet were 36.42, 25.83 and 25.58 m3/s for the hydrological year intervals 2015–2016, 2016–2017 and 2017–2018, respectively, as shown in Figure 11b. The figures indicate a slightly overestimated discharge flow.
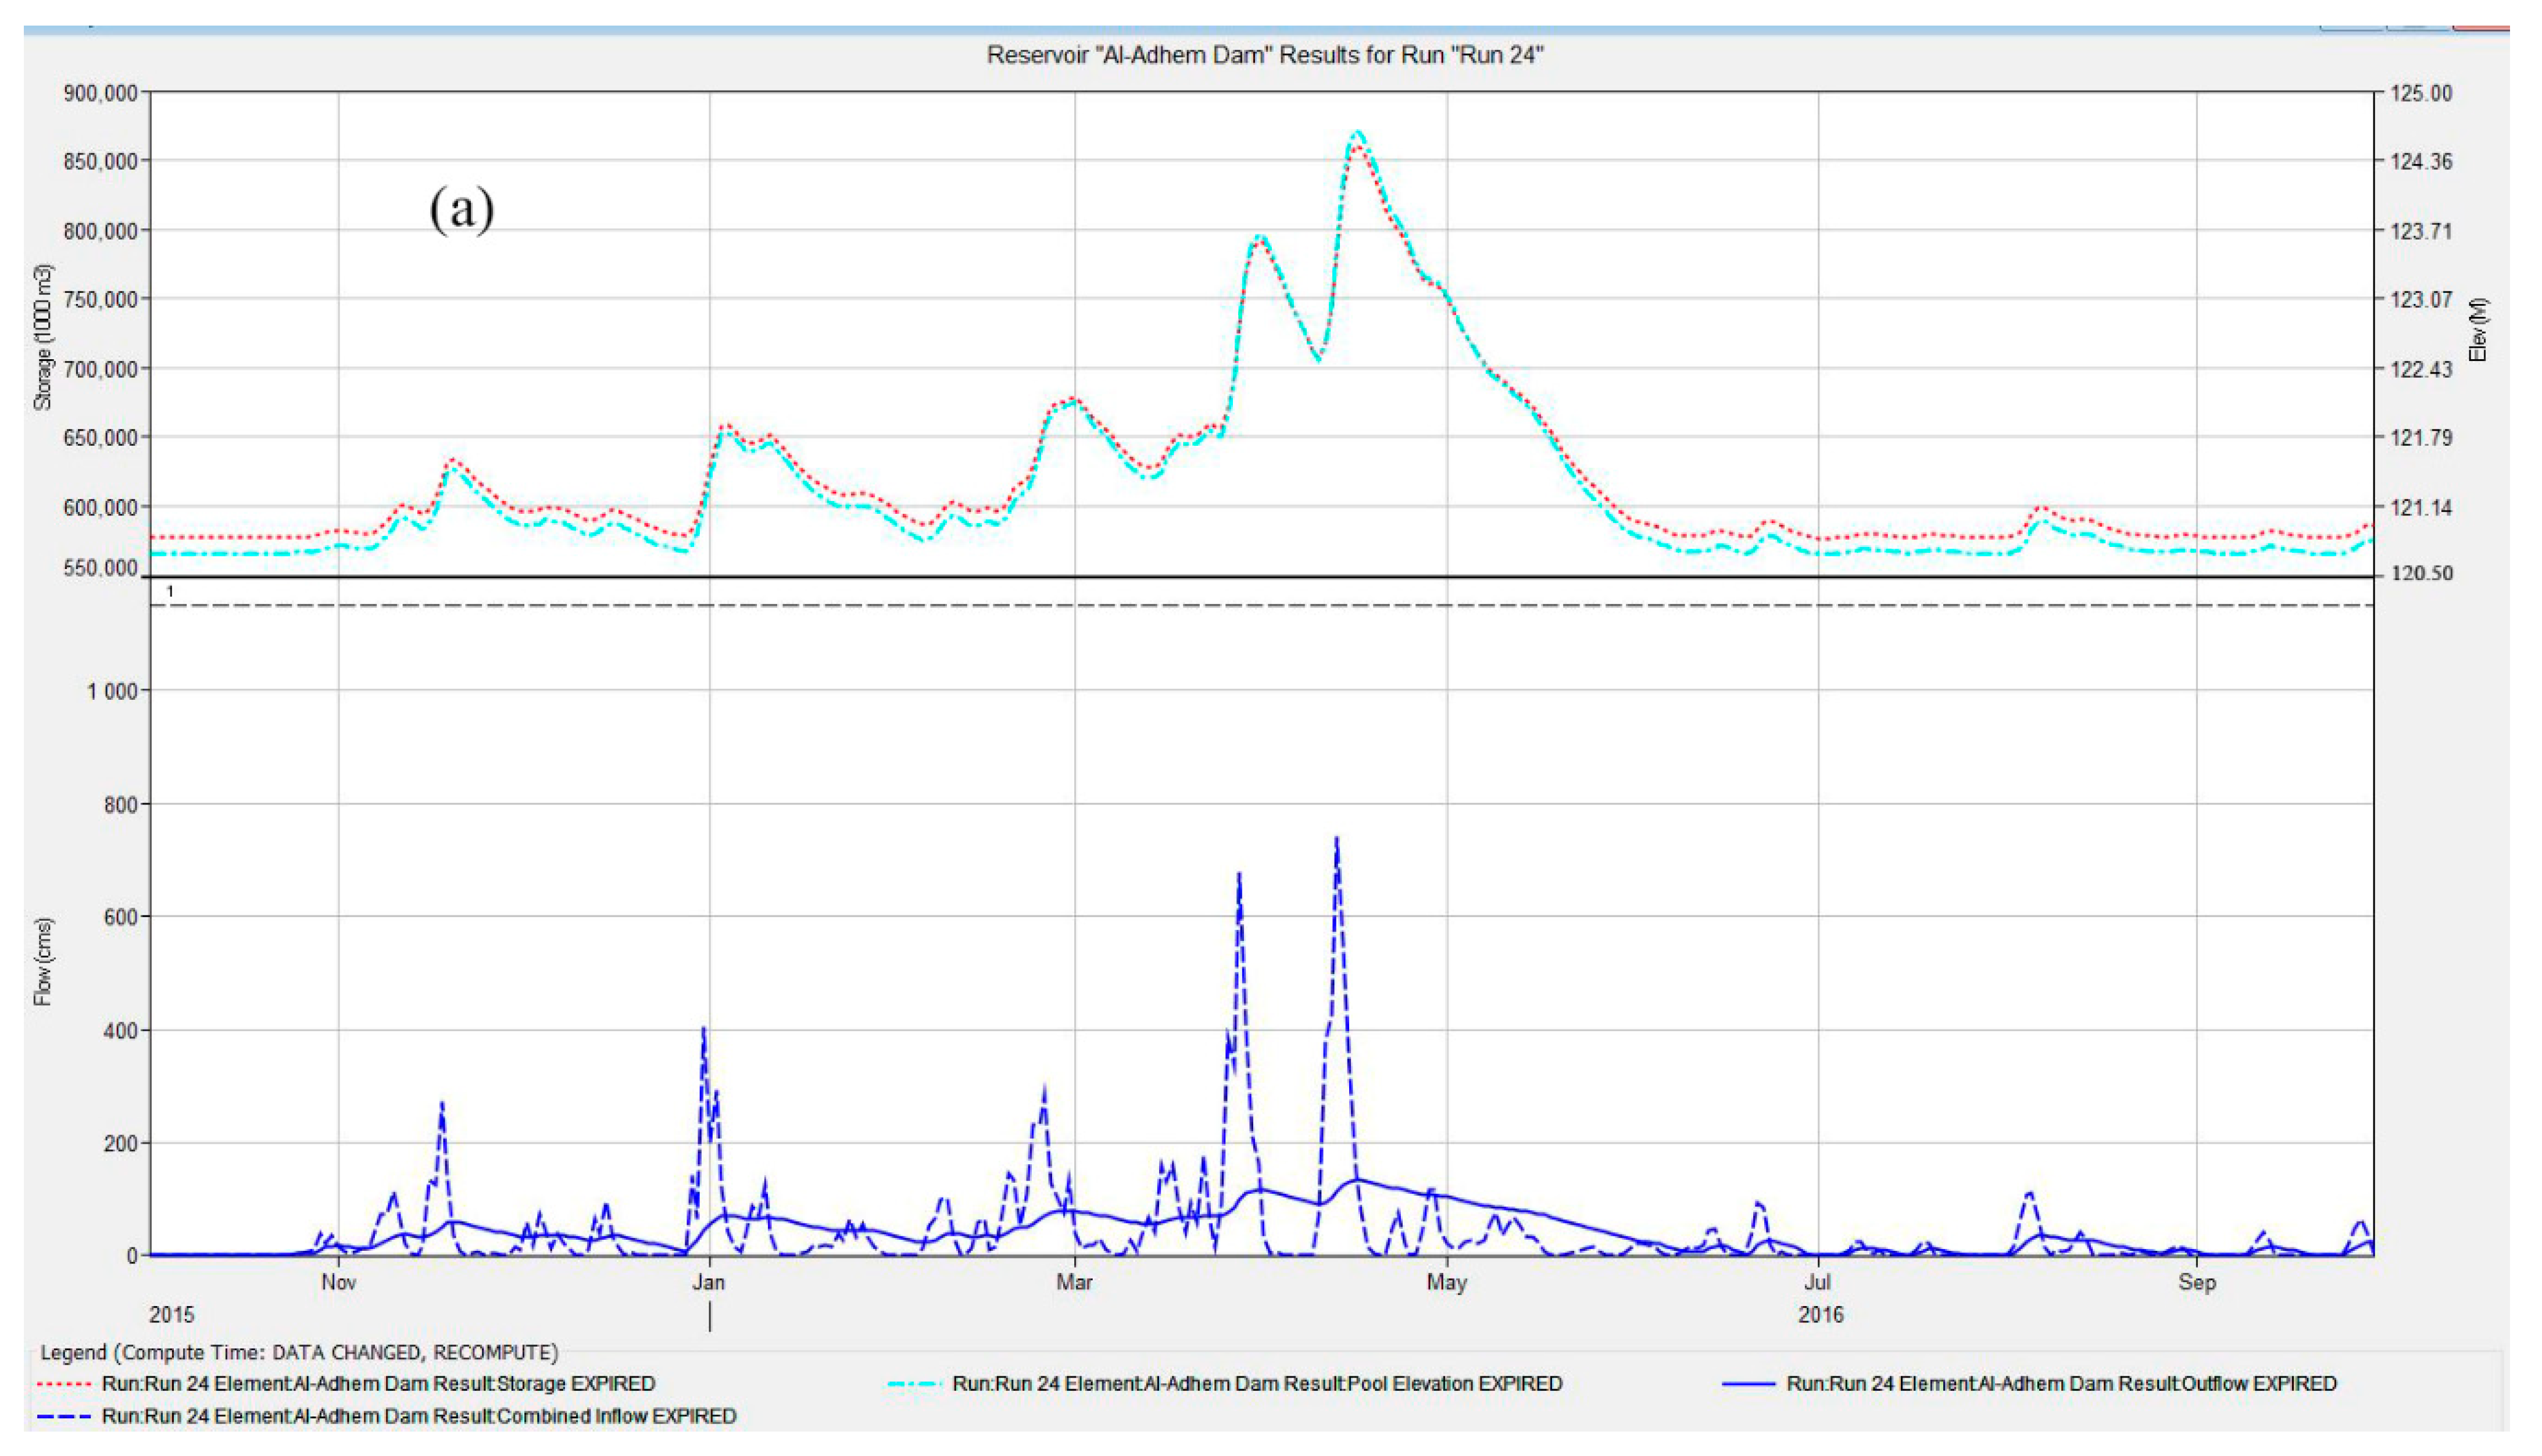
Table 5 shows the results of the simulation run for the dam storage area. The results indicate that the storage and the pool elevation at the beginning of the hydrological years were compatible with Table 2 for all years assessed in this study. The results showed that the years 2015–2016 can be considered as wet ones, with peak storage of 0.86 BCM and an elevation of 124.6 m. However, for this period the storage capacity was just under the maximum limits, accounting for approximately 1.5 BCM at the elevation of 131.54 m, which is when the spillway comes into operation.
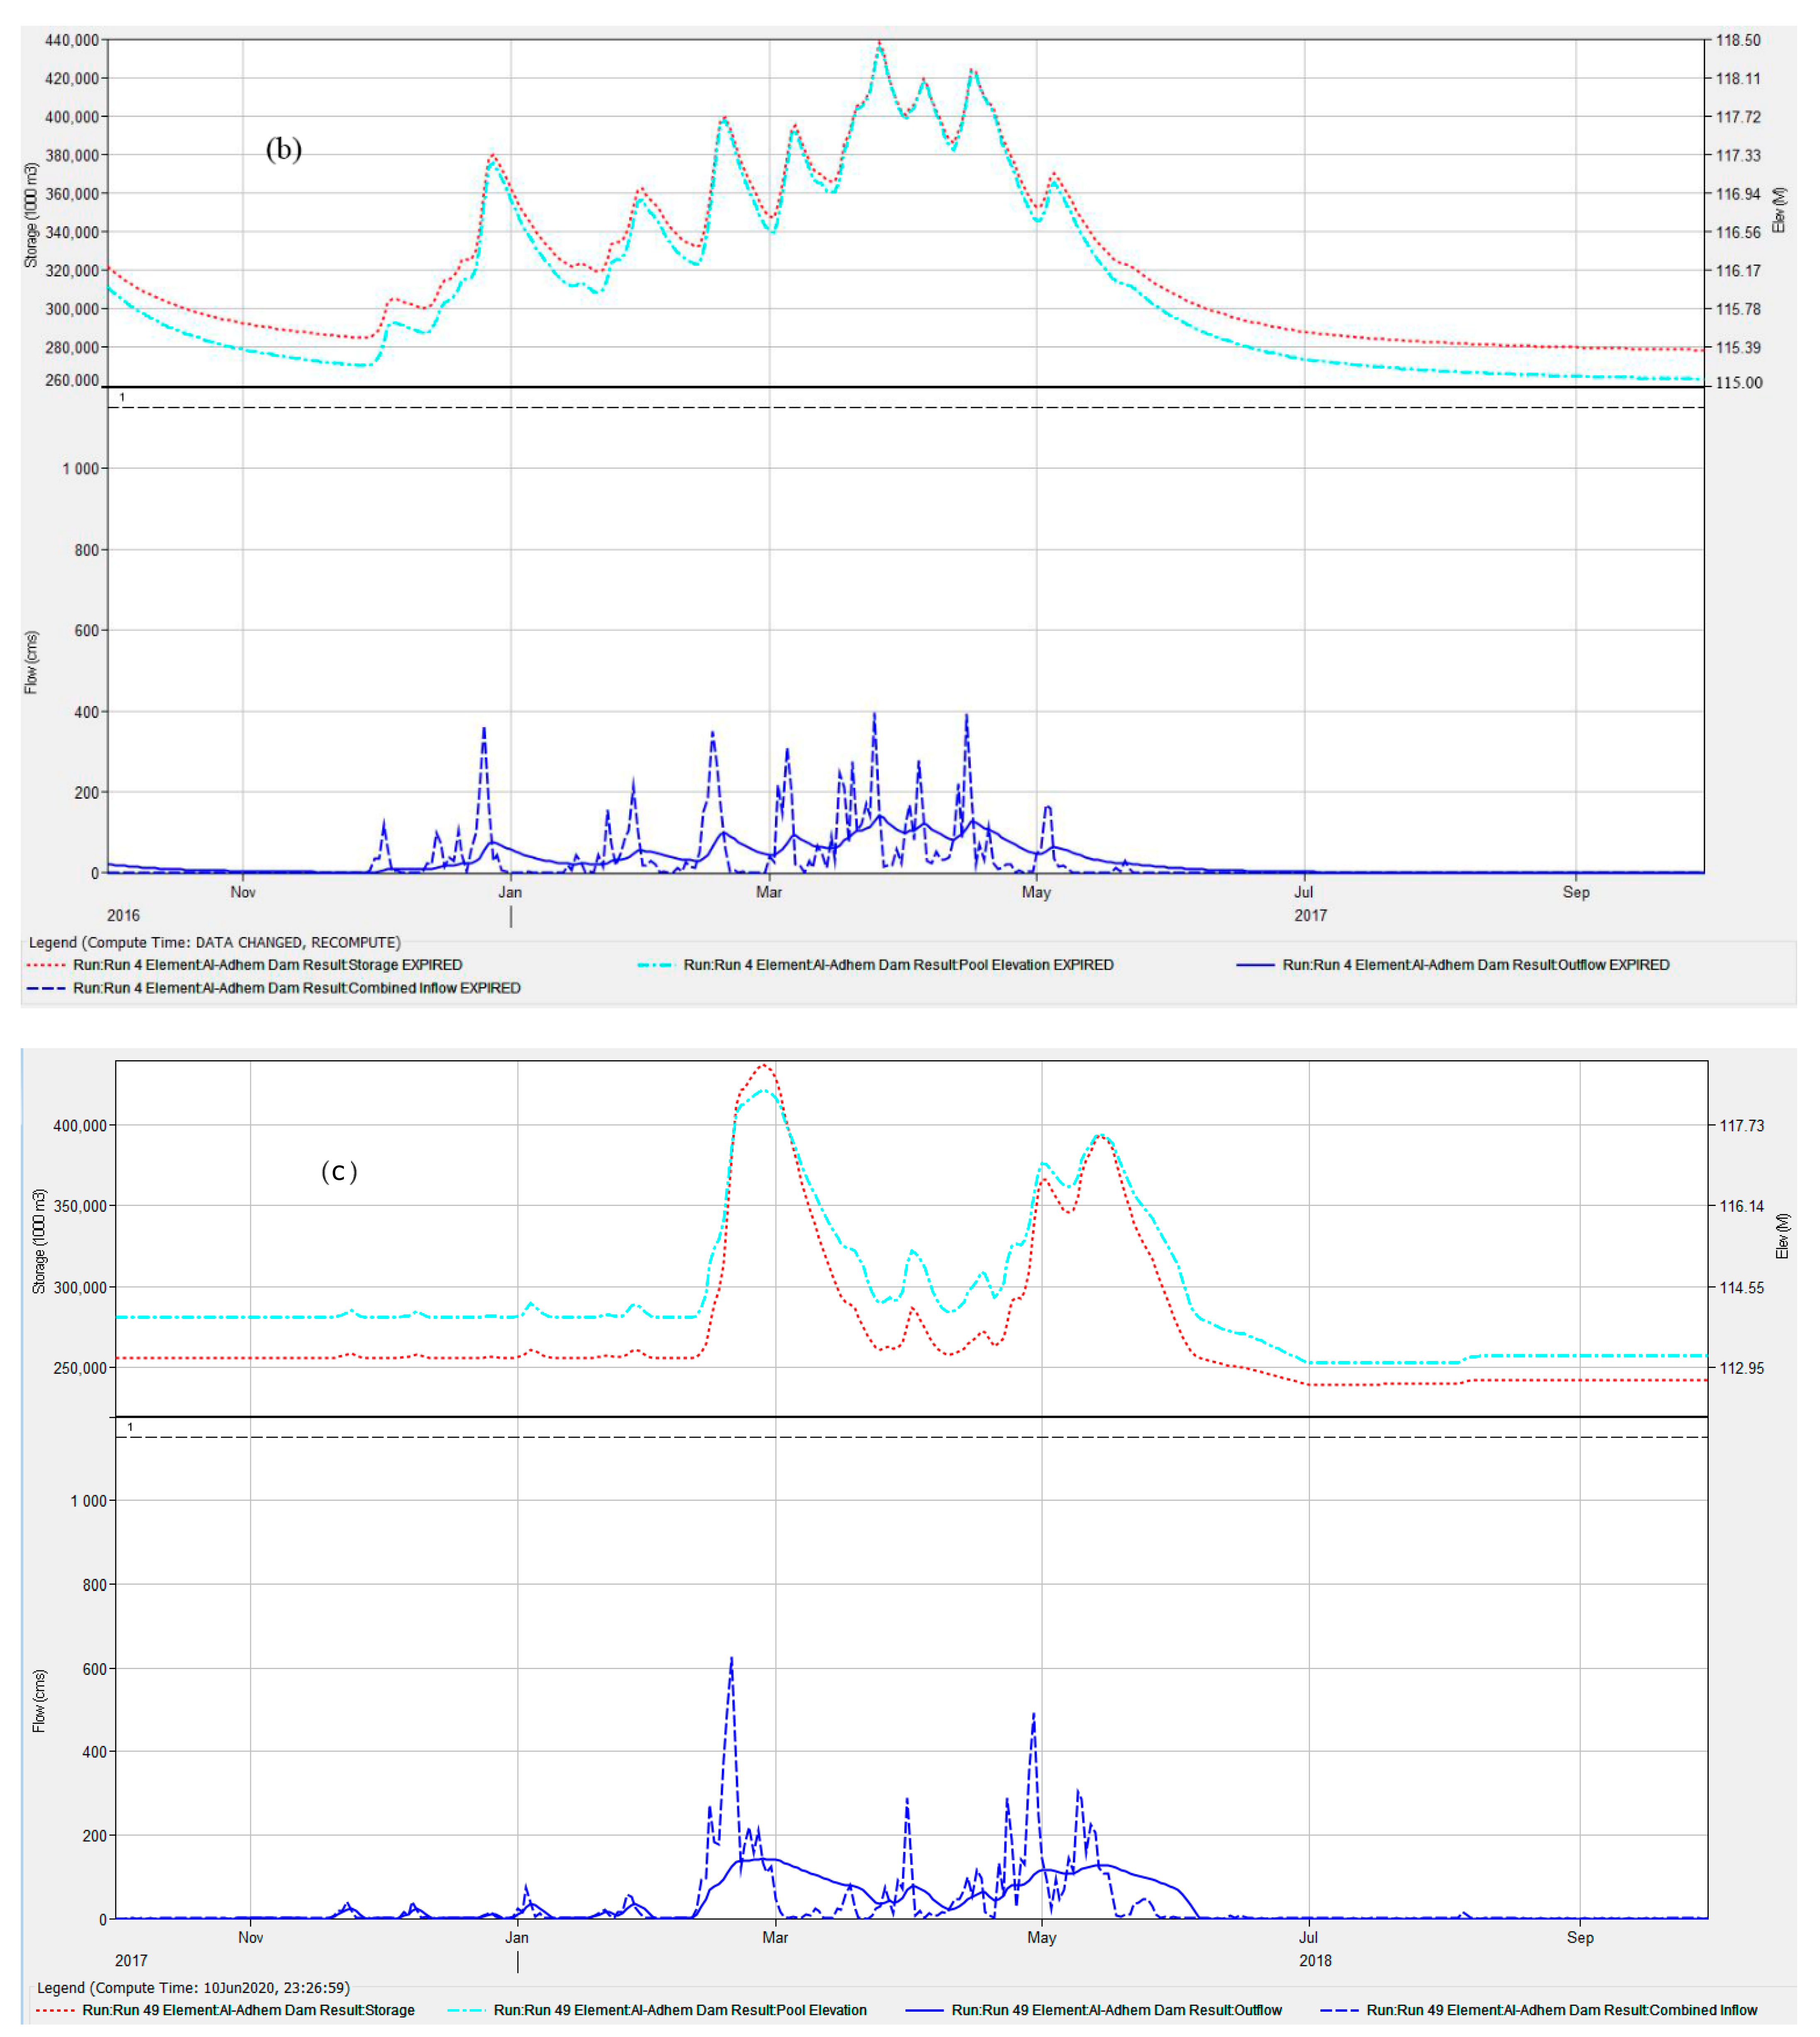
Figure 12a–c show the Al-Adhaim reservoir simulations for the year intervals 2015–2016, 2016–2017 and 2017–2018. These figures show that during the summer season when there was almost no rain, no flow occurred, and the pool elevation approached its minimum. This is due to the fact that the main water source for the Al-Adhaim river is rainfall. In contrast, during the period of precipitation, the storage capacity increased, reaching peak inflow values of 742.4, 396.9 and 625.1 m3/s corresponding to maximum rainfall values of 39.91, 29.14 and 33.41 mm for the year intervals 2015–2016, 2016–2017 and 2017–2018, respectively.
The model used in our research is useful in predicting runoff volumes and flooding in the area of interest. Figure 12 shows that the peaks of the estimated discharges for the hydrological years from 2015 to 2018 occurred between March and May, which is considered to be the time in which severe flooding takes place in the area. Moreover, it can be noted that during the March to May period, runoff depth and volume increased, and therefore, special attention should be dedicated to dam outlet management during this period in the coming years.
4. Conclusions and Recommendations
The HEC-HMS hydrologic model was used in combination with the HEC-GeoHMS and GIS to identify flow by simulated rainfall-runoff processes. The outlet flow discharge of the Al Adhaim Dam has been simulated and compared with the flow obtained from the discharge gauge located downstream of the dam by calibration of the parameters for two hydrological years and verification for one hydrological year. The results show a good agreement between observed and simulated flows, and R2 was 0.9 for both calibration and verification. The correlation between simulation and observation was good, but the total volume of discharge storage for these years was slightly overestimated. The conclusions from the analysis are listed below:
- The HEC-HMS model can be used to obtain satisfactory simulated hydrological models and is a valuable tool for the management of dam storage by forecasting rainfall amounts.
- The simulation results of runoff discharge peaks are slightly different compared with the observed data.
- In the summer season with almost no precipitation, there was no flow and the pool elevation approached minimum limits. On the contrary, during the period of precipitation, the storage capacity approached the peak inflow of 742.4 m3/s for the years 2015–2016, which corresponds to maximum daily rainfall of 39.91 mm.
- The area of interest does not have an available discharge station other than the one located near the outlet. Discharge stations could provide real observed discharge data that can be used to validate the modeling results. Therefore, the provision of an upstream discharge station is vital.
- The development of serious water policy and planning strategies in accordance with the results obtained from this study could reduce the probability of floods and may help in the management and control of the dam outlet.
- During modeling using HEC-HMS, it was noticed that the main parameters which affect runoff quantities were the curve number and then initial abstraction.
- HEC-HMS model results were good for flood forecasting concerning the Al-Adhaim catchment. Data can be exported to simulate a 2-dimensional flood inundation map using a hydraulic model such as HEC-RAS. They can also be used for forecasting the rainfall using a suitable program to predict flooding for long-time periods.
Author Contributions
Conceptualization, A.N.A.H., S.A., and M.S.; methodology, S.A.; software, A.N.A.H.; validation, S.A., A.N.A.H. and M.S.; formal analysis, A.N.A.H.; investigation, S.A.; resources, A.N.A.H.; data curation, S.A. and A.N.A.H.; writing—original draft preparation, A.N.A.H.; writing—review and editing, S.A. and M.S.; visualization, S.A., A.N.A.H. and M.S. All authors have read and agreed to the published version of the manuscript.
Funding
This research received no external funding.
Institutional Review Board Statement
Not applicable.
Informed Consent Statement
Not applicable.
Data Availability Statement
Not applicable.
Conflicts of Interest
The authors declare no conflict of interest.
References
- Al-Ansari, N. Management of water resources in Iraq: Perspectives and prognoses. Engineering 2013, 5, 667–684. [Google Scholar] [CrossRef] [Green Version]
- Abbas, N.; Wasimia, S.A.; Al-Ansari, N. Assessment of climate change impacts on water resources of Al-Adhaim, Iraq using SWAT model. Engineering 2016, 8, 716–732. [Google Scholar] [CrossRef] [Green Version]
- Rahi, K.A.; Al-Madhhachi, A.-S.T.; Al-Hussaini, S.N. Assessment of Surface Water Resources of Eastern Iraq. Hydrology 2019, 6, 57. [Google Scholar] [CrossRef] [Green Version]
- Jia, Y.; Zhao, H.; Niu, C.; Jiang, Y.; Gan, H.; Xing, Z.; Zhao, X.; Zhao, Z. A WebGIS-based system for rainfall-runoff prediction and real-time water resources assessment for Beijing. Comput. Geosci. 2009, 35, 1517–1528. [Google Scholar] [CrossRef]
- Halwatura, D.; Najim, M. Application of the HEC-HMS model for runoff simulation in a tropical catchment. Environ. Modell. Softw. 2013, 46, 155–162. [Google Scholar] [CrossRef]
- Hoogestraat, G.K. Flood hydrology and Dam-Breach Hydraulic Analyses of Four Reservoirs in the Black Hills, South Dakota; U.S. Geological Survey Scientific Investigations Report 2011–5011; U.S. Geological Survey: Reston, VA, USA, 2011; p. 37.
- Oleyiblo, J.O.; Li, Z.-j. Application of HEC-HMS for flood forecasting in Misai and Wan’an catchments in China. Water Sci. Eng. 2010, 3, 14–22. [Google Scholar]
- Saeedrashed, Y.S. Hydrologic and Hydraulic Modelling of the Greater Zab River-Basin for an Effective Management of Water Resources in the Kurdistan Region of Iraq Using DEM and Raster Images. In Environmental Remote Sensing and GIS in Iraq; Springer: Cham, Switzerland, 2020; pp. 415–446. [Google Scholar]
- Martin, O.; Rugumayo, A.; Ovcharovichova, J. Application of HEC HMS/RAS and GIS tools in flood modeling: A case study for river Sironko–Uganda. J. Eng. Des. Technol. 2012, 1, 19–31. [Google Scholar]
- Tassew, B.G.; Belete, M.A.; Miegel, K. Application of HEC-HMS model for flow simulation in the Lake Tana basin: The case of Gilgel Abay catchment, upper Blue Nile basin, Ethiopia. Hydrology 2019, 6, 21. [Google Scholar] [CrossRef] [Green Version]
- Tahmasbinejad, H.; Feyzolahpour, M.; Mumipour, M.; Zakerhoseini, F. Rainfall-runoff Simulation and Modeling of Karon River Using HEC-RAS and HEC-HMS Models, Izeh District, Iran. J. Appl. Sci. 2012, 12, 1900–1908. [Google Scholar] [CrossRef] [Green Version]
- Radmanesh, F.; Hemat, J.P.; Behnia, A.; Khond, A.; Mohamad, B.A. Calibration and assessment of HEC-HMS model in Roodzard watershed. In Proceedings of the 17th International Conference of River Engineering, University of Shahid Chamran, Ahva, Iran, 26–28 February 2020. [Google Scholar]
- Olayinka, D.; Irivbogbe, H. Estimation of Hydrological Outputs using HEC-HMS and GIS. N. J. Environ. Sci. Technol. 2017, 1, 390–402. [Google Scholar] [CrossRef]
- Barbosa, J.; Fernandes, A.; Lima, A. The influence of spatial discretization on HEC-HMS modelling: A case study. Int. J. Hydrol. 2019, 3, 442–449. [Google Scholar]
- Salman, A.H.; Habib, Z.H.; Rahman, A.A. Environmental impacts of water dams in Iraq. J. Geog. Univ. Kufa 2014, 20, 329–364. [Google Scholar]
- Jasim, S.M. The natural constituents of the Great Dam Lake and its impact on developing tourism demand. J. Admin. Econ. 2008, 71, 207–231. [Google Scholar]
- The Central Statistical Organization of Iraq/Environment Statistics/Bagdad. Available online: http://cosit.gov.iq/en/ (accessed on 5 August 2020).
- UN-ESCWA. Inventory of shared water resources in Western Asia. In United Nations Economic and Social Commission for Western Asia; Federal Institute for Geosciences and Natural Resources: Beirut, Lebanon, 2013. [Google Scholar]
- USGS. Available online: https://earthexplorer.usgs.gov (accessed on 5 August 2020).
- Mhaina, A.S. Modeling suspended sediment load using SWAT model in data scarce area-Iraq (Al-Adhaim Watershed as a Case Study). Master’s Thesis, University of Technology, Baghdad, Iraq, 2017. [Google Scholar]
- FAO. State of Food and Agriculture 2012: Investing in Agriculture for a Better Future; FAO: Rome, Italy, 2012. [Google Scholar]
- Manoj, N.; Kurian, C.; Sudheer, K. Development of a flood forecasting model using HEC-HMS. In Proceedings of the National Conference on Water Resources & Flood Management, National Conference on Water Resources & Flood Management with special reference to Flood Modelling, Sardar Vallabhbhai National Institute of Technology, Surat, India, 14–15 October 2016; pp. 14–15. [Google Scholar]
- McCarthy, G.T. The unit hydrograph and flood routing. In Proceedings of the Conference of North Atlantic Division, US Army Corps of Engineers, New London, CT, USA, 1 January 1939; pp. 608–609. [Google Scholar]
- Din, S.U.; Khan, N.M.; Israr, M.; Nabi, H.; Khan, M. Runoff modelling using HEC HMS for rural watershed. Development 2019, 6. [Google Scholar] [CrossRef]
Figure 1.
Layout of Al-Adhaim Dam (Arc-GIS by authors).

Figure 2.
Distribution of the maximum rainfall in the study area, which occurred on 17 November 2015 (Power Data Access Viewer website; https://power.larc.nasa.gov/data-access-viewer, (accessed on 26 March 2021)).
Figure 2.
Distribution of the maximum rainfall in the study area, which occurred on 17 November 2015 (Power Data Access Viewer website; https://power.larc.nasa.gov/data-access-viewer, (accessed on 26 March 2021)).

Figure 3.
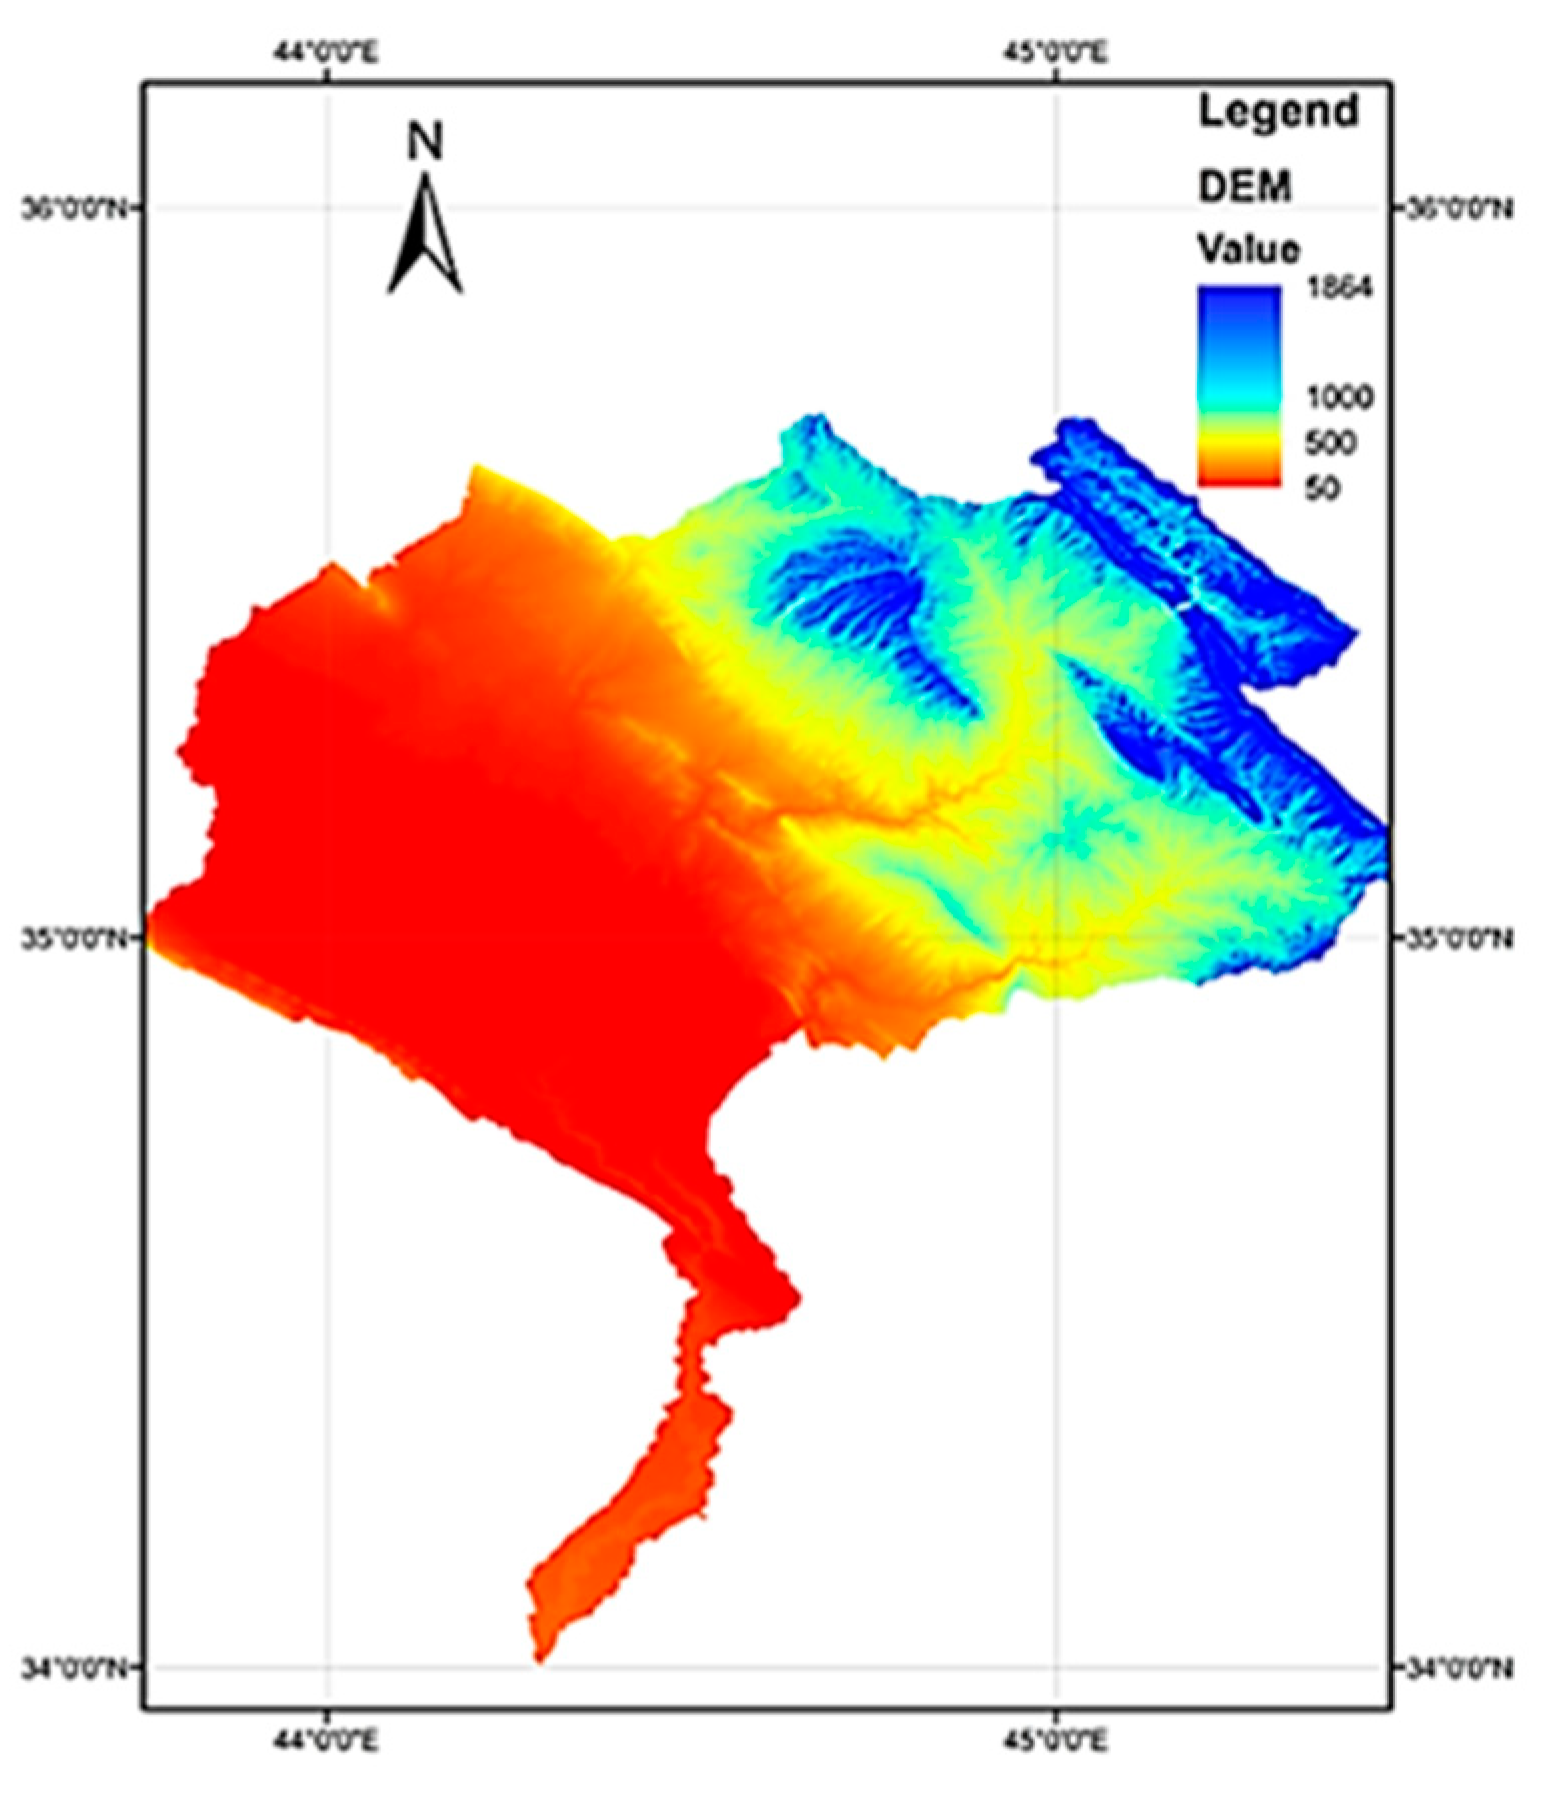
Digital elevation model for Al-Adhaim (downloaded from United States Geological Survey (USGS) [19] and modified by the authors).
Figure 3.
Digital elevation model for Al-Adhaim (downloaded from United States Geological Survey (USGS) [19] and modified by the authors).

Figure 4.
Pre-processing and model development: (a) raw digital elevation model; (b) fill sinks; (c) low directions; (d) catchment polygon; (e) basin raster; (f) flow accumulation; (g) generated project; (h) basin merge; (i) longest flow path; (j) Hydrologic Engineering Center (HEC-HMS) legend; (k) HEC-HMS schematic; and (l) basin centroid.

Figure 5.
Soil map of the Al-Adhaim catchment (adapted and modified by the authors).

Figure 6.
Land use classification of the Al-Adhaim catchment (adapted and modified by the authors).

Figure 7.
Curve Number calculations for the Al-Adhaim catchment (adapted and modified by authors).

Figure 8.
Hydrologic modeling system of the Al-Adhaim catchment by HEC-HMS.

Figure 9.
Observed and simulated discharge values for the dam outlet (a) calibration of 2015–2016; (b) calibration of 2016–2017; and (c) validation of 2017–2018.
Figure 9.
Observed and simulated discharge values for the dam outlet (a) calibration of 2015–2016; (b) calibration of 2016–2017; and (c) validation of 2017–2018.

Figure 10.
Regression scatter plot for the (a) calibration period for the dam outlet for the years 2015–2016; (b) calibration period for the dam outlet for the years 2016–2017; and (c) validation period for the dam outlet for the years 2017–2018.
Figure 10.
Regression scatter plot for the (a) calibration period for the dam outlet for the years 2015–2016; (b) calibration period for the dam outlet for the years 2016–2017; and (c) validation period for the dam outlet for the years 2017–2018.

Figure 11.
Observed and simulated hydrographs corresponding to (a) the annual water volume discharged; and (b) the annual discharge flow.
Figure 11.
Observed and simulated hydrographs corresponding to (a) the annual water volume discharged; and (b) the annual discharge flow.

Figure 12.
The simulation run for the Al-Adhaim reservoir concerning the intervals (a) 2015–2016; (b) 2016–2017; and (c) 2017–2018.
Figure 12.
The simulation run for the Al-Adhaim reservoir concerning the intervals (a) 2015–2016; (b) 2016–2017; and (c) 2017–2018.


| Elevation 1 (m) | Area (km2) | Volume (MCM 2) |
|---|---|---|
| 100 | 3 | 70 |
| 115 | 41 | 310 |
| 118 | 52 | 450 |
| 120 | 60 | 520 |
| 125 | 85 | 980 |
| 130 | 122 | 1400 |
| 135 | 170 | 2150 |
| 140 | 233 | 3130 |
| 143 | 270 | 3750 |
1 Elevation: meters above sea level; 2 MCM: million cubic meters.
Table 2.
Elevations and the corresponding water volumes at the start of the hydrological year [17].
Table 2.
Elevations and the corresponding water volumes at the start of the hydrological year [17].
| Date | Elevation 1 (m) | Capacity (BCM 2) |
|---|---|---|
| 1/10/2015 | 120.71 | 0.60 |
| 1/10/2016 | 115.22 | 0.31 |
| 1/10/2017 | 113.94 | 0.27 |
| 1/10/2018 | 117.20 | 0.42 |
1 Elevation: meters above sea level; 2 BCM: Billion Cubic Meters.
Table 3.
The hydrological model named Hydrologic Engineering Center (HEC-HMS) catchment model parameters for Al-Adhaim.
Table 3.
The hydrological model named Hydrologic Engineering Center (HEC-HMS) catchment model parameters for Al-Adhaim.
| No. | Model | Method | Parameters Required (Unit) |
|---|---|---|---|
| 1 | Loss Rate Parameter | SCS Curve Number | Initial abstraction (mm), Curve Number and Impervious area (%) |
| 2 | Runoff Transform | SCS Unit Hydrograph | Lag time (min) |
| 3 | Routing Method Constants | Muskingum | Travel time (K) and dimensionless weight (X) |
Table 4.
The estimation of Loss and Transform Model parameter values.
| Sub-Basin | Basin Area (km2) | Basin Slope (%) | Curve Number (CN) | Potential Abstraction (mm) | Ia (mm) | Basin Lag (Hours) |
|---|---|---|---|---|---|---|
| W880 | 193.5333 | 37.00 | 87 | 1.49 | 7.59 | 5.3959 |
| W890 | 708.2559 | 29.87 | 80 | 2.50 | 12.70 | 6.1618 |
| W710 | 1635.3000 | 14.20 | 78 | 2.82 | 14.33 | 9.0085 |
| W860 | 8.15850 | 35.00 | 95 | 0.53 | 2.67 | 5.4074 |
| W620 | 2490.1000 | 18.24 | 75 | 3.33 | 16.93 | 8.0493 |
| W980 | 81.4450 | 47.00 | 100 | 0.00 | 0.00 | 4.5998 |
| W1000 | 24.7302 | 49.00 | 100 | 0.00 | 0.00 | 4.50491 |
| W700 | 4485.1000 | 21.04 | 79 | 2.66 | 13.50 | 7.37090 |
| W850 | 2718.1000 | 38.06 | 70 | 4.29 | 21.77 | 5.70099 |
Table 5.
Results of a simulation run for the dam storage area.
| Year | Storage (BCM)/Elevation (m) at the Start of the Hydrological Year | Peak Inflow (m3/s)/Date | Peak Discharge (m3/s)/Date | Inflow Volume (BCM) | Peak Storage (BCM)/Elevation (m) |
|---|---|---|---|---|---|
| 2015–2016 | 0.60/120.71 | 742.4/12 April 2016 | 133.3/16 April 2016 | 1.320 | 0.860/124.6 |
| 2016–2017 | 0.31/115.20 | 396.9/24 March 2017 | 142.1/26 March 2017 | 0.895 | 0.438/118.4 |
| 2017–2018 | 0.27/113.94 | 625.1/18 February 2018 | 142.4/26 February 2018 | 0.953 | 0.438/118.4 |
BCM, billion cubic meters.
Publisher’s Note: MDPI stays neutral with regard to jurisdictional claims in published maps and institutional affiliations. |
© 2021 by the authors. Licensee MDPI, Basel, Switzerland. This article is an open access article distributed under the terms and conditions of the Creative Commons Attribution (CC BY) license (http://creativecommons.org/licenses/by/4.0/).
Share and Cite
MDPI and ACS Style
Hamdan, A.N.A.; Almuktar, S.; Scholz, M. Rainfall-Runoff Modeling Using the HEC-HMS Model for the Al-Adhaim River Catchment, Northern Iraq. Hydrology 2021, 8, 58. https://doi.org/10.3390/hydrology8020058
AMA Style
Hamdan ANA, Almuktar S, Scholz M. Rainfall-Runoff Modeling Using the HEC-HMS Model for the Al-Adhaim River Catchment, Northern Iraq. Hydrology. 2021; 8(2):58. https://doi.org/10.3390/hydrology8020058
Chicago/Turabian StyleHamdan, Ahmed Naseh Ahmed, Suhad Almuktar, and Miklas Scholz. 2021. "Rainfall-Runoff Modeling Using the HEC-HMS Model for the Al-Adhaim River Catchment, Northern Iraq" Hydrology 8, no. 2: 58. https://doi.org/10.3390/hydrology8020058
Note that from the first issue of 2016, this journal uses article numbers instead of page numbers. See further details here.