
Real-Time Detection of the Nutritional Compounds in Green ‘Ratuni UNPAD’ Cayenne Pepper


1
Department of Agronomy, Faculty of Agriculture, Universitas Padjadjaran, Sumedang 45363, Indonesia
2
Department of Agricultural Engineering, Faculty of Agriculture, The University of Lampung, Bandar Lampung 35145, Indonesia
*
Author to whom correspondence should be addressed.
Horticulturae 2022, 8(6), 554; https://doi.org/10.3390/horticulturae8060554
Submission received: 5 May 2022
/
Revised: 12 June 2022
/
Accepted: 13 June 2022
/
Published: 20 June 2022
Abstract
:The detection of nutritional compounds is usually performed through laboratory analysis, which requires extensive planning, time, cost, and effort. Alternatively, visible/near-infrared (Vis/NIR) spectroscopy can be used to determine the presence of nutritional compounds in real-time. This study aimed to investigate the potential application of the Vis/NIR spectroscopy in the quantitative detection of nutritional compounds in green ‘Ratuni UNPAD’ cayenne pepper. Prior to the model development, 80 samples were prepared for the calibration set, while another 40 samples were provided for the prediction set. Subsequently, the parameters used to calculate the model accuracy included the coefficient of correlation in calibration set (Rcal), coefficient of correlation in prediction set (Rpred), root mean square error of calibration set (RMSEC), root mean square error of prediction set (RMSEP) and the ratio of prediction to deviation (RPD). The experimental results involving the total carotenoids showed good model indicators with Rcal, Rpred, RMSEC, RMSEP, and RPD at 0.94, 0.89, 1.29, 1.75, and 2.21, respectively. Additionally, the analysis of the water content indicated Rcal, Rpred, RMSEC, RMSEP, and RPD values of 0.86, 0.85, 0.59, 0.61, and 1.90, respectively, while that of capsaicin had Rcal, Rpred, RMSEC, RMSEP, and RPD values of 0.89, 0.90, 117.82, 115.62, and 2.29, respectively. The results showed that Vis/NIR spectroscopy can be used to detect the nutritional compounds in green ‘Ratuni UNPAD’ cayenne pepper based on total carotenoids, water content, and capsaicin parameters.
1. Introduction
Cayenne pepper (Capsicum frustencens L.) is one of the world’s most cultivated horticultural crops. ‘Ratuni UNPAD’ is one of the varieties that has been grown extensively in West Java, Indonesia due to its high yield potential and suitability for planting in the medium-high plains. The potential varies from 7–10 tons/hectare. Moreover, cayenne pepper is also nutrient dense. Generally, some of the ingredients associated with the cayenne pepper include color pigments, water content, and capsaicin [1,2,3,4].
The color pigments present in cayenne pepper contain carotenoids, such as lutein, β-carotene, β-cryptoxanthin, zeaxanthin, violaxanthin, capsanthin, and capsorubin, which affect the appearance of the fruit [5] and have a positive relationship with the color of the fruit peel [6]. Additionally, the water content can also affect the appearance of the fruit since it determines the texture, and freshness.
Cayenne pepper, like other commodities in the Capsicum group, contains a unique compound called capsaicin, which gives it a spicy flavor. According to Cheema and Pant [7], capsaicin levels are affected by variety, climate, geographical location, maturity level, and post-harvest processing methods. Capsaicin is the most abundant compound in the capsaicinoid group, accounting for approximately 49–68% of total capsaicinoid content [8].
The various methods used to quantify the water content, carotenoid, and capsaicin in cayenne pepper include gravimetry, spectrophotometry, and chromatography due to their high precision [9,10]. However, the disadvantages associated with these methods include the need for expertise in laboratory analysis, sample preparation, time, cost, the use of chemicals, and the uncertainty of the destruction measurement results in real-time. Practically, it will be challenging to ascertain the nutritional content within a short time frame in the industrial world. Consequently, a technology is required for measuring nutritional compounds present in cayenne pepper in a real-time manner, which provides fast, chemical-free, and accurate determination regarding the chemical content of samples [11,12].
Visible/near-infrared (Vis/NIR) spectroscopy is a recent technology that can be used to predict the chemical content of fruit with speed and accuracy. The quantitative nutritional content can be determined in real-time using this method. Vis/NIR spectroscopy has been extensively used to monitor the quality of various vegetables and fruits for example in the Cucurbitaceae family [13,14,15], tomato [16], apple [17], banana [18], sapodilla [19], and mandarin orange [20]. Kusumiyati et al. [21] conducted a study on cayenne pepper and predicted the quality attributes of intact and powdered ‘Manik’ and ‘Domba’ cayenne peppers. However, the built calibration model only considers antioxidant property parameters. To the best of our knowledge, there has never been a real-time detection of green ‘Ratuni UNPAD’ cayenne pepper on various nutritional compounds. This calibration model is designed to be more efficient, representative, fast, and accurate in prediction. The application of this technology to the ‘Ratuni UNPAD’ cayenne pepper allows for grading based on its nutritional compounds. This will replace the conventional grading method based solely on the appearance of the sample. The hypothesis is that Vis/NIR spectroscopy guarantees precision and reliability in predicting nutritional compounds in green ‘Ratuni UNPAD’ cayenne pepper. Consequently, this study aimed to test the reliability of Vis/NIR spectroscopy, as well as regression and spectra correction methods to predict water content, total carotenoids, and capsaicin present in the green ‘Ratuni UNPAD’ cayenne pepper.
2. Materials and Methods
2.1. Cayenne Pepper Samples
The samples were harvested at the green stage based on visual appearance. There were 120 samples of green ‘Ratuni UNPAD’ cayenne pepper, all fresh and powdered, with approximately 30 g of cayenne pepper in each. The samples were split into two groups, with 80 representing the calibration set and 40 representing the prediction set. The study was conducted at Horticulture Laboratory, Faculty of Agriculture, Universitas Padjadjaran, Indonesia.
2.2. Chemical Analysis Methods
Various methods were employed to conduct the water content, total carotenoids, and capsaicin analysis. The gravimetric method was used to measure the water content [13]. For total carotenoid quantification, approximately 0.05 g of powdered sample was weighed into a centrifuge tube, followed by 10 mL of acetone. The sample was then centrifuged at 4000 rpm for 10 minutes. The working standard was prepared to obtain 0.5; 1; 2; 4; 8; 16; 32 ppm of β-carotene. Total carotenoids were analyzed at a wavelength of 450 nm using UV–visible spectrophotometer (Shimadzu, UV mini-1240, Tokyo, Japan) [22]. Lastly, the capsaicin was evaluated using high-performance liquid chromatography (HPLC) (Shimadzu, LC 20AT Prominence, Tokyo, Japan). The HPLC was equipped with C18 column (particle size 5 μm; 4.6 mm × 150 mm) and UV–visible detector. The standard solution of capsaicin was made at 2, 4, 8, 16, 32, and 64 ppm. The detection of capsaicin was set at 222 nm. The sample preparation and extraction for capsaicin analysis refer to the procedures described by González-Zamora et al. [23].
2.3. Measurement of Vis/NIR Spectra
The Vis/NIR spectrometer (NirVana AG410, Integrated Spectronics Pty, Ltd., North Ryde, Australia) with a wavelength range of 381–1065 nm at 3 nm intervals was utilized for spectra acquisition. Each sample was placed into a Petri dish and exposed to radiation five times [21]. The irradiated parts of each sample included the top, bottom, right, left, and center surfaces. Afterward, the original spectra were generated from the absorbance spectra and averaged for each sample.
2.4. Data Analysis
The Unscrambler X 10.4 (Camo AS, Oslo, Norway) software was used for the data analysis. The regression methods employed were the partial least squares regression (PLSR) and principal component regression (PCR). PLSR and PCR are the most commonly used linear regression methods for the development of the Vis/NIR calibration model. The similarity between the two methods is that they transform independent variables into principal components (PCs). However, in PCR, PCs are formed only by involving the independent variables, while in PLSR, PCs are determined by independent and dependent variables. The goal of PLSR is to maximize the covariance of both variables [24,25]. Additionally, the standard normal variate (SNV) and first derivative Savitzky–Golay (dg1) spectra correction methods were applied. The parameters associated with the model accuracy were evaluated by the coefficient of correlation in the calibration set (Rcal), root mean square error of the calibration set (RMSEC), coefficient of correlation in the prediction set (Rpred), root mean square error of the prediction set (RMSEP), and the ratio of prediction to deviation (RPD). The developed model is expected to have low RMSEC and RMSEP, and also have high Rcal, Rpred, and RPD [26,27].
3. Results and Discussion
3.1. Analysis of Vis/NIR Spectra
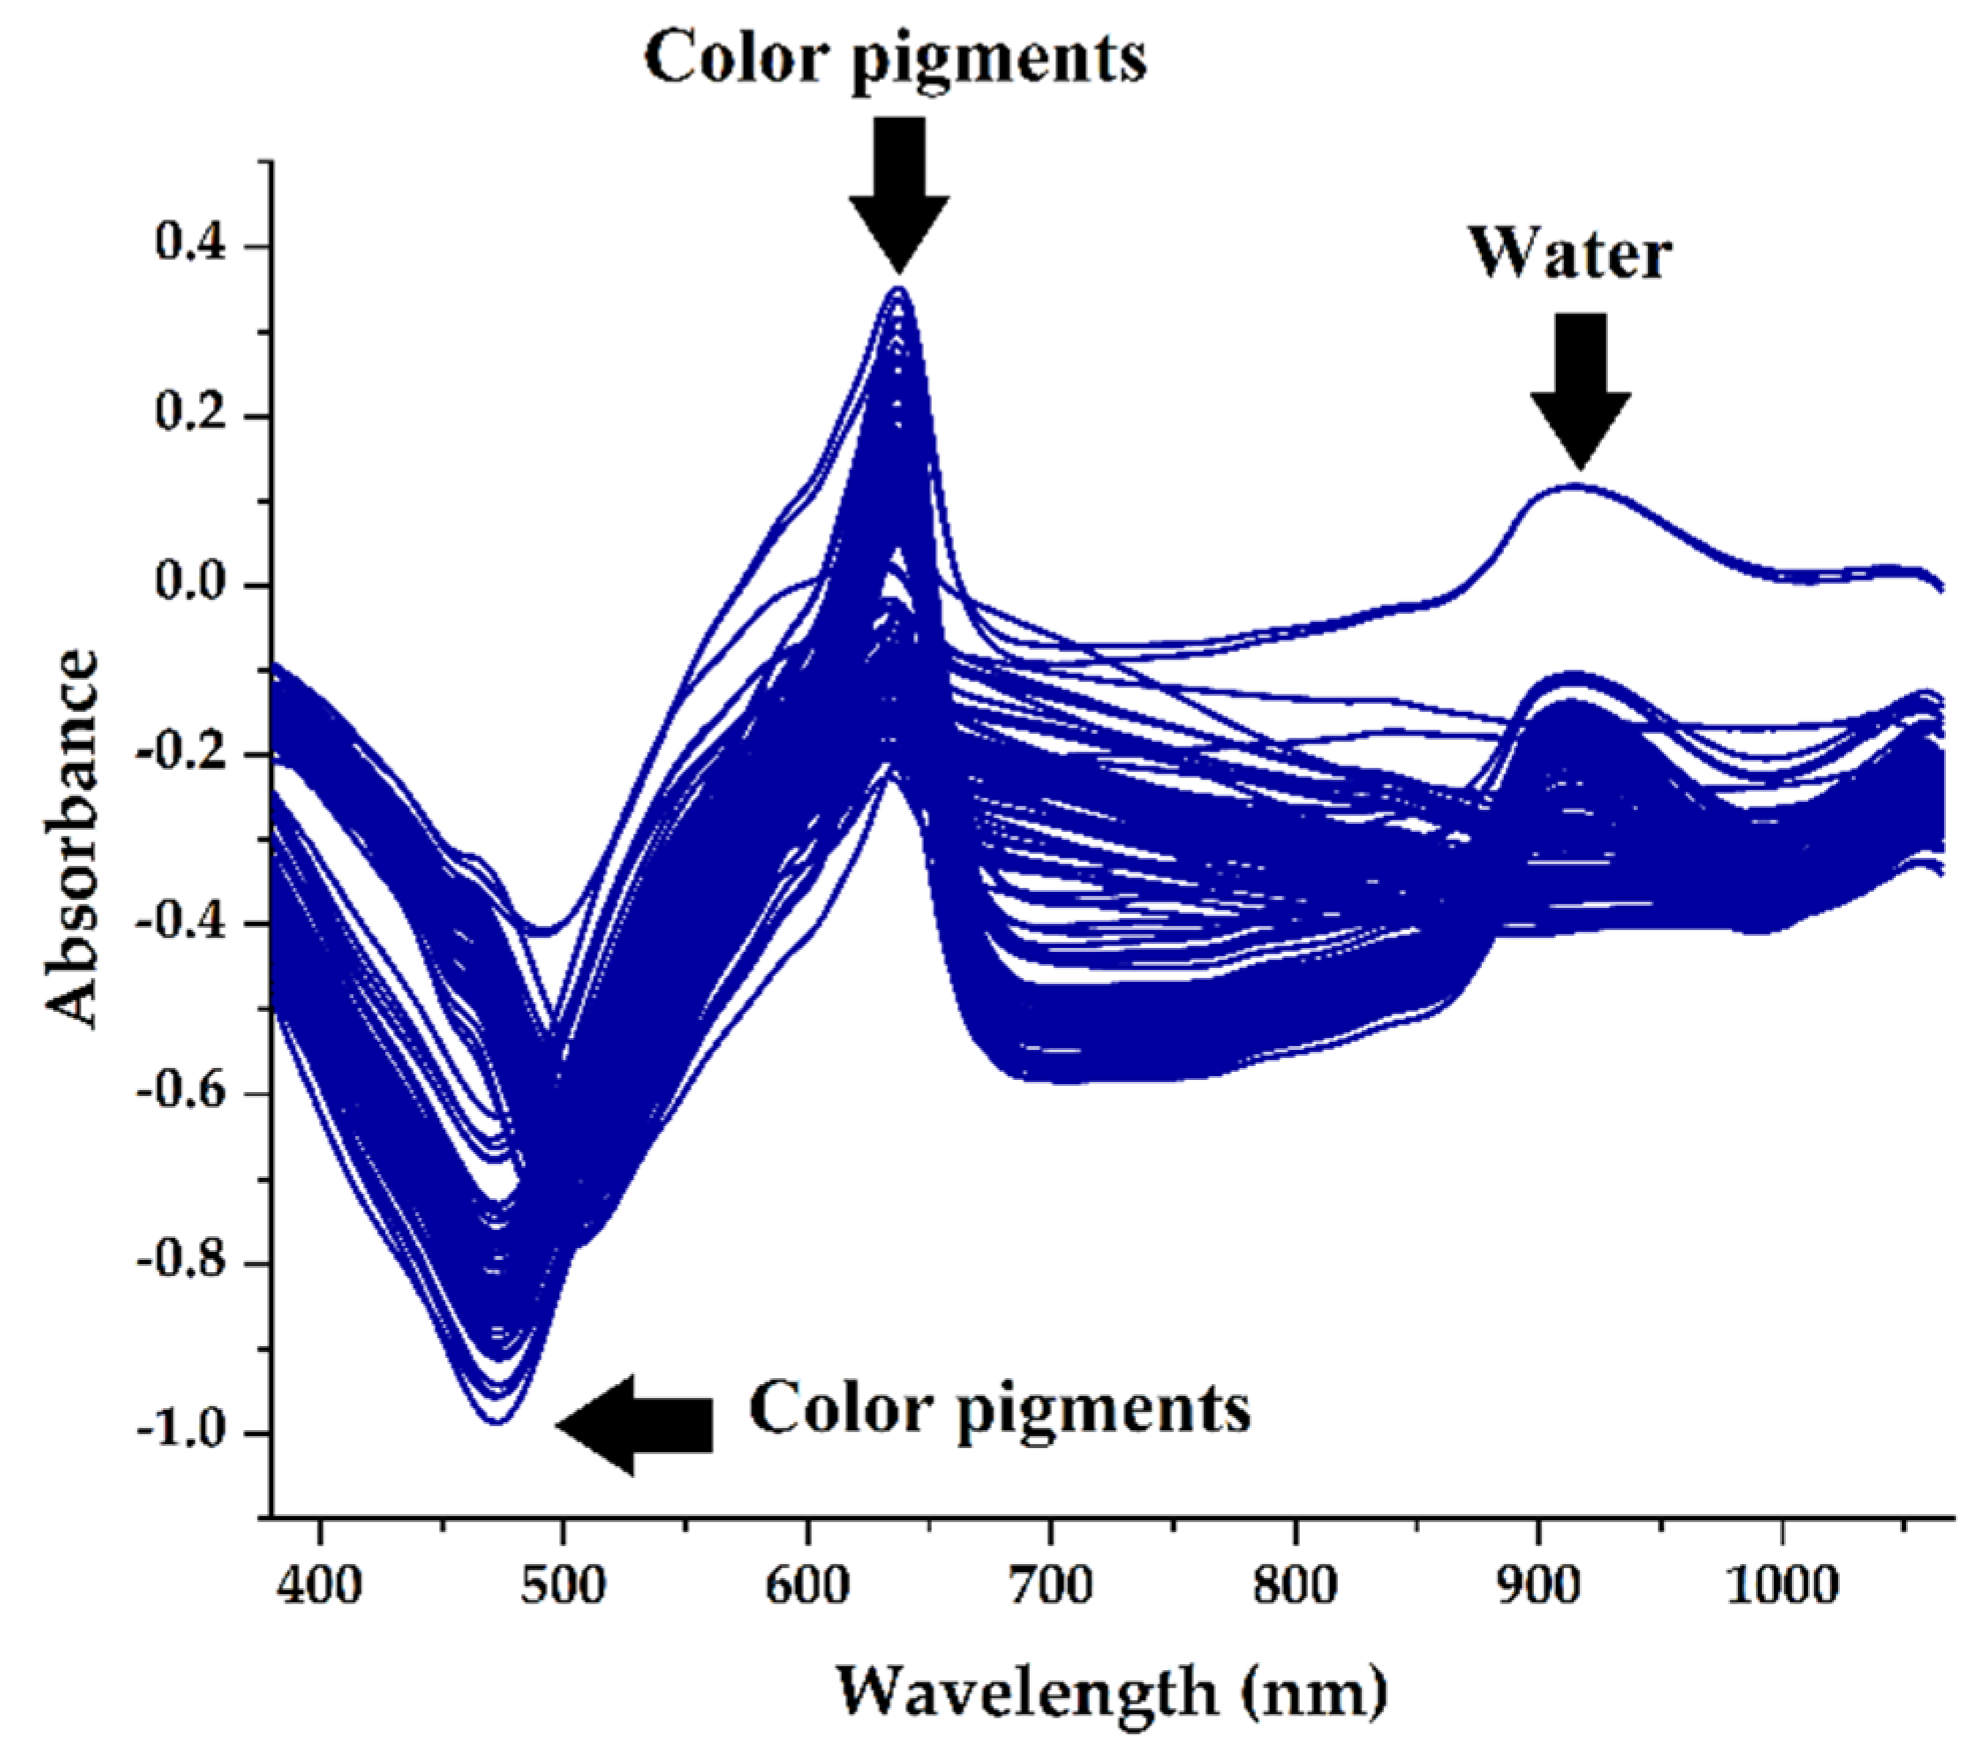
The absorbance spectra of green ‘Ratuni UNPAD’ cayenne pepper are shown in Figure 1. Several peaks and valleys have been identified to provide relevant information and are closely related to the chemical content of the sample. The wavelengths used ranged from 381–1065 nm, and the absorption peaks indicated that these wavelengths were related, and they became the primary focus of biochemical information [28]. The green ‘Ratuni UNPAD’ cayenne pepper displayed absorption peaks approximately at 465 nm, 498 nm, 639 nm, 642 nm, and 915 nm, and they were found to be closely related to color pigments and water. The wavelengths ranging from 465 nm to 642 nm were associated with various color pigments such as carotenoids, xanthophylls, and chlorophyll [29]. Furthermore, there was a peak of approximately 915 nm that correlated with the water content. The previous study reported the wavelength of 760–970 nm was discovered to be the second overtones of O-H bands that correspond to water absorption [30].
3.2. Prediction Results of Nutritional Compounds
The nutritional compounds data collected from laboratory analysis were displayed in Table 1. The data were then used for model development and evaluation. The calibration model was achieved through regression analysis involving spectra data of samples and actual data of nutritional compounds (calibration). The developed calibration model was then applied to predict the unknown samples (prediction). The best calibration model was selected based on the consistency of the high Rcal, Rpred, and RPD, as well as the low RMSEC/RMSEP [31]. The presence of noise in the spectra could reduce the model accuracy, which led to the application of various spectra correction methods. The application of PLSR + original resulted in the best model for total carotenoids with Rcal, Rpred, RMSEC, RMSEP, and RPD having values of 0.94, 0.89, 1.29, 1.75, and 2.21, respectively (Table 2). These results indicate that the total carotenoids can be predicted with a high degree of accuracy and reliability for further prediction [32,33]. This analysis is consistent with the use of Vis/NIR spectroscopy on total banana fruit carotenoids, which yielded R2cal, R2pred, RMSEC, RMSEP, and RPD values of 0.95, 0.96, 18.89, 28.70, and 3.35, respectively [34]. This discovery supported the hypothesis that Vis/NIR spectroscopy can predict total carotenoids in cayenne pepper, particularly the ‘Ratuni UNPAD’ variety, which was determined statistically through the multivariate analysis.
The model development and evaluation for water content and capsaicin also showed sufficient results. Furthermore, the best water content results were obtained using PLSR + original, with Rcal, RMSEC, Rpred, RMSEP, and RPD with their values given as 0.86, 0.59, 0.85, 0.61, and 1.90, respectively. The Vis/NIR prediction of the water content of pomelo fruit was reported to have similar accuracy, with the R2cal, R2pred, RMSEC, and RMSEP having accuracies of 0.89, 0.71, 0.03, and 0.04, respectively [35]. The accuracy of the capsaicin parameter with PLSR + original was the highest, with Rcal, Rpred, RMSEC, RMSEP, and RPD having accuracies of 0.89, 0.90, 117.82, 115.62, and 2.29, respectively. The results of this study produced higher accuracies than those obtained by Johnson et al. [36] in Habanero chili, which gave the capsaicin accuracy results of R2cal, RMSEC, Rpred, RMSEP, and RPD to be 0.19, 589, 0.15, 611, and 1.08, respectively. However, Lim et al. [37] obtained better results on capsaicinoids in Korean red pepper with R2cal, R2pred, RMSEC, and RMSEP having values of 0.87, 0.84, 12.18, and 13.63, respectively. Different accuracy in the prediction of nutritional compounds can occur due to various factors, for example, the variability of data, the number of samples, type of samples, samples condition, instrumentation, model development, etc.
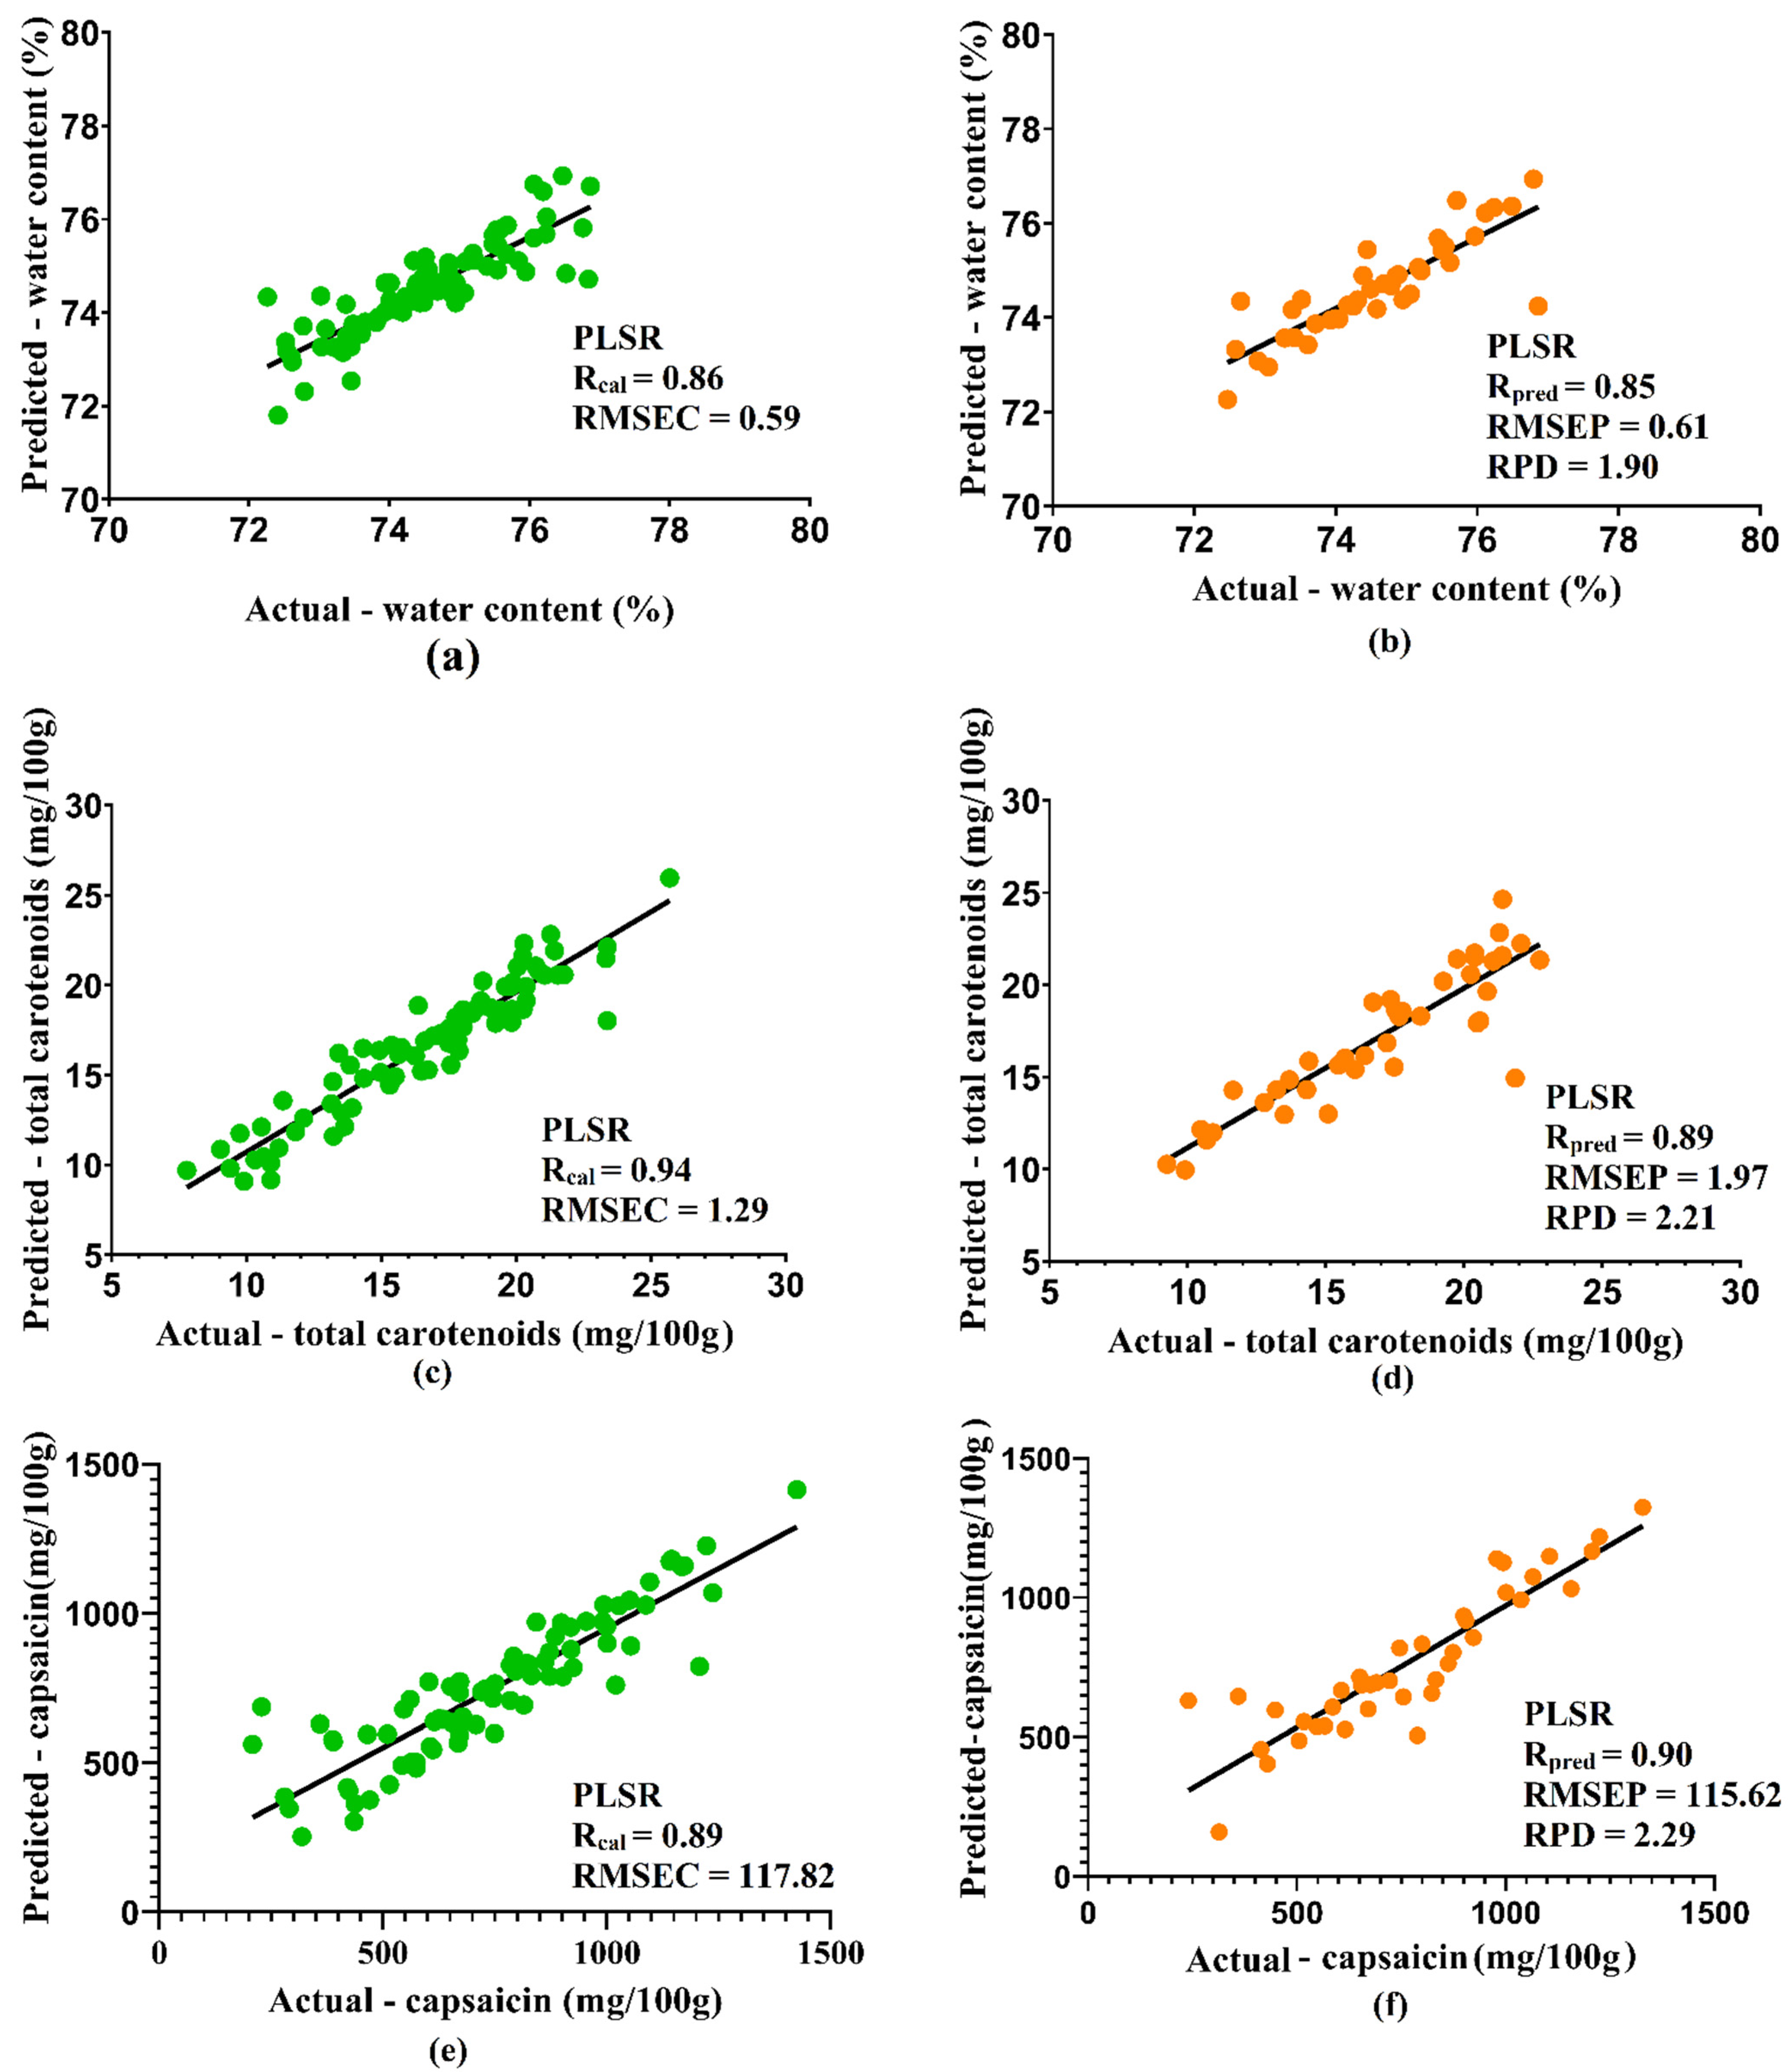
Figure 2 depicts the visualization of the data distribution for the calibration and prediction sets. The two sets were selected after comparing the results of the best regression and spectra correction methods for each quality attribute. Subsequently, satisfactory results were obtained from all quality attributes, with Rcal and Rpred having values greater than or equal to 0.86 and 0.85, respectively. The model obtained met the criteria for being designated as a robust model for predicting total carotenoids, as well as the water content and capsaicin. Furthermore, RPD values obtained for water content, total carotenoids, and capsaicin were 1.90, 2.21, and 2.29, respectively. The RPD below 1.5 indicate poor prediction and unsuitability, while those between 1.5 and 2 show that the model can distinguish between low and high response variables. Additionally, RPD values between 2 and 2.5 suggest the possibility of making coarse quantitative predictions, while a value between 2.5 and 3 or above indicates good and outstanding prediction accuracy [32,38].
3.3. Wavelength Selection by Regression Coefficient
Figure 3 describes the regression coefficients on model development of water content, total carotenoids, and capsaicin. The water absorption was found at wavelengths of 561, 621, 651, 906, and 999 nm (Figure 3a). Our findings regarding the water absorption peaks were comparable to those of strawberries at various stages of ripeness [39]. In this study, we employed a total of 230 wavelengths; however, the peaks that contributed to the prediction of total carotenoids were 402, 429, 483, 633, 645, 669, 750, 891, and 930 nm (Figure 3b). This discovery is consistent with studies arranged by Walsh et al. [29] and Ruiz et al. [40], which stated that the carotenoid content has wavelengths ranging from 420–503 nm and 940–1200 nm. Zhang et al. [30] and Jamshidi et al. [41], also reported that the absorption around 550 nm and 650 nm were associated with pigments interpretation.
Furthermore, this study revealed information about the wavelength that contributed to the capsaicin. Figure 3c represents wavelengths of 468, 519, 633, 657, 714, 912, and 1005 nm at peaks for capsaicin. The previous study addressed that absorption of the capsaicinoids content was around 450–950 nm [37]. This finding verifies that Vis/NIR spectroscopy has peaks that can predict water content, total carotenoids, and capsaicin of green ‘Ratuni UNPAD’ cayenne pepper. In this study, reliable and potent nutritional compounds were detected in real-time and with high accuracy. However, there has not been any other study on Vis/NIR technology that has developed a predictive potential for various quality attributes of green ‘Ratuni UNPAD’ cayenne pepper besides this study. The application of Vis/NIR spectroscopy has the advantage of being practical, efficient, and real-time. Overall, the hypothesis in this study demonstrates that Vis/NIR spectroscopy can be trusted to predict nutritional compounds in green ‘Ratuni UNPAD’ cayenne pepper.
4. Conclusions
The Vis/NIR spectroscopy has the potential to predict the nutritional compounds of green ‘Ratuni UNPAD’ cayenne pepper in real-time. The overall accuracy of the carotenoids obtained for Rcal, Rpred, RMSEC, RMSEP, and RPD were 0.94, 0.89, 1.29, 1.75, and 2.21, respectively. Furthermore, the Rcal, Rpred, RMSEC, RMSEP, and RPD values for water content and capsaicin were 0.86, 0.85, 0.59, 0.61, and 1.90, and of 0.89, 0.90, 117.82, 115.62, and 2.29, respectively. The finding of this study also confirmed the expectations that Vis/NIR spectroscopy is reliable in detecting the total carotenoids, water content, and capsaicin of green ‘Ratuni UNPAD’ cayenne pepper. The application of Vis/NIR spectroscopy as a real-time and accurate quality prediction technology needs to be explored further because it has many advantages over other measurement methods in terms of practicality, labor, time, and cost. In terms of cost–benefit, this technique can reduce cost for quality control when used by cayenne pepper producers who need daily quality control for large samples.
Author Contributions
Conceptualization, K.K.; formal analysis, I.E.P.; funding acquisition, K.K.; investigation, D.S. and J.S.H.; methodology, K.K.; writing—original draft, K.K.; writing—review and editing, I.E.P., D.S. and J.S.H. All authors have read and agreed to the published version of the manuscript.
Funding
This research obtained no particular support from governmental, private, or non-profit funding sources.
Institutional Review Board Statement
Not applicable.
Informed Consent Statement
Not applicable.
Data Availability Statement
The data presented in this study are available on request from the corresponding author.
Acknowledgments
The authors would like to express their gratitude to Neni Rostini, Anne Nuraini, Anas, and Noladhi Wicaksana, the plant breeders of ‘Ratuni UNPAD’ cayenne pepper. We are also grateful to Yuda Hadiwijaya, Yusuf Eka Maulana, and Rahmatillah Ramadhani for their assistance and chemical analysis of the samples.
Conflicts of Interest
The authors declare no conflict of interest.
References
- Deepa, N.; Kaur, C.; George, B.; Singh, B.; Kapoor, H.C. Antioxidant constituents in some sweet pepper (Capsicum annuum L.) genotypes during maturity. LWT Food Sci. Technol. 2007, 40, 121–129. [Google Scholar] [CrossRef]
- Del Rocío Gómez-García, M.; Ochoa-Alejo, N. Biochemistry and molecular biology of carotenoid biosynthesis in chili peppers (Capsicum spp.). Int. J. Mol. Sci. 2013, 14, 19025–19053. [Google Scholar] [CrossRef] [Green Version]
- Jiang, J.; Cen, H.; Zhang, C.; Lyu, X.; Weng, H.; Xu, H.; He, Y. Nondestructive quality assessment of chili peppers using near-infrared hyperspectral imaging combined with multivariate analysis. Postharvest Biol. Technol. 2018, 146, 147–154. [Google Scholar] [CrossRef]
- Al Othman, Z.A.; Ahmed, Y.B.H.; Habila, M.A.; Ghafar, A.A. Determination of capsaicin and dihydrocapsaicin in capsicum fruit samples using high performance liquid chromatography. Molecules 2011, 16, 8919–8929. [Google Scholar] [CrossRef] [Green Version]
- Villa-Rivera, M.G.; Ochoa-Alejo, N. Chili pepper carotenoids: Nutraceutical properties and mechanisms of action. Molecules 2020, 25, 5573. [Google Scholar] [CrossRef]
- Bixley, G.S.; Clark, K.M.; James, A.P. Skin colour predicts fruit and vegetable intake in young Caucasian men: A cross-sectional study. J. Nutr. Intermed. Metab. 2018, 12, 20–27. [Google Scholar] [CrossRef]
- Cheema, S.K.; Pant, M.R. Estimation of capsaicin in seven cultivated varieties of Capsicum annuum L. Res. J. Pharm. Biol. Chem. Sci. 2011, 2, 701–706. [Google Scholar]
- Barbero, G.F.; Liazid, A.; Azaroual, L.; Palma, M.; Barroso, C.G. Capsaicinoid contents in peppers and pepper-related spicy foods. Int. J. Food Prop. 2016, 19, 485–493. [Google Scholar] [CrossRef]
- Hornero-Méndez, D.; Minguez-Mosquera, M.I. Rapid spectrophotometric determination of red and yellow isochromic carotenoid fractions in paprika and red pepper oleoresins. J. Agric. Food Chem. 2001, 49, 3584–3588. [Google Scholar] [CrossRef]
- De Andrade, E.T.; Figueira, V.G.; Teixeira, L.P.; Martinazzo, A.P.; Araujo, K.G.D.L. Effect of drying kinetics on color of “Dedo de Moca” chili peppers (Capsicum baccatum). Eng. Agrícola 2019, 39, 659–667. [Google Scholar] [CrossRef]
- Genis, H.E.; Durna, S.; Boyaci, I.H. Determination of green pea and spinach adulteration in pistachio nuts using NIR spectroscopy. LWT Food Sci. Technol. 2021, 136, 110008. [Google Scholar] [CrossRef]
- Asikin, Y.; Kusumiyati; Shikanai, T.; Wada, K. Volatile aroma components and MS-based electronic nose profiles of dogfruit (Pithecellobium jiringa) and stink bean (Parkia speciosa). J. Adv. Res. 2018, 9, 79–85. [Google Scholar] [CrossRef] [PubMed]
- Kusumiyati; Hadiwijaya, Y.; Putri, I.E.; Munawar, A.A. Multi-product calibration model for soluble solids and water content quantification in cucurbitaceae family, using visible/near-infrared spectroscopy. Heliyon 2021, 7, e07677. [Google Scholar] [CrossRef] [PubMed]
- Kusumiyati, K.; Hadiwijaya, Y.; Putri, I.E.; Munawar, A.A. Enhanced visible/near-infrared spectroscopic data for prediction of quality attributes in cucurbitaceae commodities. Data Br. 2021, 39, 107458. [Google Scholar] [CrossRef]
- Kusumiyati, K.; Hadiwijaya, Y.; Sutari, W.; Munawar, A.A. Global model for in-field monitoring of sugar content and color of melon pulp with comparative regression approach. AIMS Agric. Food 2022, 7, 312–325. [Google Scholar] [CrossRef]
- Saad, A.; Jha, S.N.; Jaiswal, P.; Srivastava, N.; Helyes, L. Non-destructive quality monitoring of stored tomatoes using VIS-NIR spectroscopy. Eng. Agric. Environ. Food 2016, 9, 158–164. [Google Scholar] [CrossRef]
- Beghi, R.; Giovanelli, G.; Malegori, C.; Giovenzana, V.; Guidetti, R. Testing of a VIS-NIR system for the monitoring of long-term apple storage. Food Bioprocess Technol. 2014, 7, 2134–2143. [Google Scholar] [CrossRef]
- Zude, M. Non-destructive prediction of banana fruit quality using VIS/NIR spectroscopy. Fruits 2003, 58, 135–142. [Google Scholar] [CrossRef] [Green Version]
- Kusumiyati; Hadiwijaya, Y.; Hadiwijaya, Y.; Elisa Putri, I. Determination of Water Content of Intact Sapodilla Using Near Infrared Spectroscopy. In IOP Conference Series: Earth and Environmental Science, Proceedings of the 1st International Conference on Food and Agriculture 2018, Bali, Indonesia, 20–21 October 2018; IOP Publishing: Bristol, Belgium, 2018; Volume 207, p. 012047. [Google Scholar] [CrossRef]
- Mc Glone, V.A.; Fraser, D.G.; Jordan, R.B.; Künnemeyer, R. Internal quality assessment of mandarin fruit by Vis/NIR spectroscopy. J. Near Infrared Spectrosc. 2003, 11, 323–332. [Google Scholar] [CrossRef]
- Kusumiyati, K.; Putri, I.E.; Munawar, A.A.; Suhandy, D. A data fusion model to merge the spectra data of intact and powdered cayenne pepper for the fast inspection of antioxidant properties. Sustainability 2022, 14, 201. [Google Scholar] [CrossRef]
- Biswas, A.K.; Sahoo, J.; Chatli, M.K. A Simple UV-Vis spectrophotometric method for determination of β-carotene content in raw carrot, sweet potato and supplemented chicken meat nuggets. LWT Food Sci. Technol. 2011, 44, 1809–1813. [Google Scholar] [CrossRef]
- González-Zamora, A.; Sierra-Campos, E.; Luna-Ortega, J.G.; Pérez-Morales, R.; Carlos, J.; Ortiz, R.; García-Hernández, J.L. Characterization of different capsicum varieties by evaluation of their capsaicinoids content by high performance liquid chromatography, determination of pungency and effect of high temperature. Molecules 2013, 18, 13471–13486. [Google Scholar] [CrossRef]
- Suhandy, D.; Yulia, M.; Kusumiyati. Chemometric Quantification of Peaberry Coffee in Blends Using UV-Visible Spectroscopy and Partial Least Squares Regression. In Proceedings of the 8th Annual Basic Science International Conference: Coverage of Basic Sciences toward the World’s Sustainability Challenges, East Java, Indonesia, 6–7 March 2018; AIP Conference Proceedings: College Park, MA, USA, 2018; Volume 2021, p. 060010. [Google Scholar] [CrossRef]
- Suhandy, D.; Yulia, M. The Authentication of Peaberry and Civet Ground Roasted Robusta Coffee Using UV-Visible Spectroscopy and PLS-DA Method with Two Different Particle Sizes. In IOP Conference Series: Earth and Environmental Science, Proceedings of the International Conference on Science, Infrastructure Technology and Regional Development, Institut Teknologi Sumatera campus, Lampung Selatan, Indonesia, 19–20 October 2018; IOP Publishing: Bristol, Belgium, 2019; Volume 258, p. 012043. [Google Scholar]
- Kusumiyati, K.; Munawar, A.A.; Suhandy, D. Fast, simultaneous and contactless assessment of intact mango fruit by means of near infrared spectroscopy. AIMS Agric. Food 2021, 6, 172–184. [Google Scholar] [CrossRef]
- Kusumiyati, K.; Munawar, A.A.; Suhandy, D. Fast and Contactless Assessment of Intact Mango Fruit Quality Attributes Using near Infrared Spectroscopy (NIRS). In IOP Conference Series: Earth and Environmental Science, Proceedings of the International Conference on Agricultural Technology, Engineering and Environmental Sciences, Banda Aceh, Indonesia, 21–22 September 2020; IOP Publishing: Bristol, Belgium, 2021; Volume 644, p. 012028. [Google Scholar] [CrossRef]
- Skolik, P.; Morais, C.L.M.; Martin, F.L.; McAinsh, M.R. Determination of developmental and ripening stages of whole tomato fruit using portable infrared spectroscopy and chemometrics. BMC Plant Biol. 2019, 19, 236. [Google Scholar] [CrossRef] [PubMed]
- Walsh, K.B.; Blasco, J.; Zude-Sasse, M.; Sun, X. Visible-NIR ‘point’ spectroscopy in postharvest fruit and vegetable assessment: The science behind three decades of commercial use. Postharvest Biol. Technol. 2020, 168, 111246. [Google Scholar] [CrossRef]
- Zhang, Q.; Li, Q.; Zhang, G. Rapid determination of leaf water content using Vis/NIR spectroscopy analysis with wavelength selection. Spectrosc. An Int. J. 2012, 27, 93–105. [Google Scholar] [CrossRef]
- Zhao, N.; Wu, Z.S.; Zhang, Q.; Shi, X.Y.; Ma, Q.; Qiao, Y.J. Optimization of parameter selection for partial least squares model development. Sci. Rep. 2015, 5, 11647. [Google Scholar] [CrossRef] [Green Version]
- Nicolaï, B.M.; Beullens, K.; Bobelyn, E.; Peirs, A.; Saeys, W.; Theron, K.I.; Lammertyn, J. Nondestructive measurement of fruit and vegetable quality by means of NIR spectroscopy: A review. Postharvest Biol. Technol. 2007, 46, 99–118. [Google Scholar] [CrossRef]
- Workman, J.J. A review of calibration transfer practices and instrument differences in spectroscopy. Appl. Spectrosc. 2018, 72, 340–365. [Google Scholar] [CrossRef]
- Davey, M.; Saeys, W.; Hof, E.; Ramon, H.; Swennen, R.; Keulemans, J. Application of visible and near-infrared reflectance spectroscopy (Vis/NIRS) to determine carotenoid contents in banana (Musa spp.) fruit pulp. J. Agric. Food Chem. 2009, 57, 1742–1751. [Google Scholar] [CrossRef]
- Xu, S.; Lu, H.; Ference, C.; Qiu, G.; Liang, X. Rapid nondestructive detection of water content and granulation in postharvest “Shatian” pomelo using visible/near-infrared spectroscopy. Biosensors 2020, 10, 41. [Google Scholar] [CrossRef] [PubMed] [Green Version]
- Johnson, J.B.; Mani, J.S.; Naiker, M. Infrared spectroscopy for the quality assessment of habanero chilli: A proof-of-concept study. Eng. Proc. 2021, 8, 19. [Google Scholar] [CrossRef]
- Lim, J.; Kim, G.; Mo, C.; Kim, M.S. Design and fabrication of a real-time measurement system for the capsaicinoid content of Korean red pepper (Capsicum annuum L.) powder by visible and near-infrared spectroscopy. Sensors 2015, 15, 27420–27435. [Google Scholar] [CrossRef] [PubMed]
- Saeys, W.; Mouazen, A.M.; Ramon, H. Potential for onsite and online analysis of pig manure using visible and near infrared reflectance spectroscopy. Biosyst. Eng. 2005, 91, 393–402. [Google Scholar] [CrossRef]
- Xie, D.; Liu, D.; Guo, W. Relationship of the optical properties with soluble solids content and moisture content of strawberry during ripening. Postharvest Biol. Technol. 2021, 179, 111569. [Google Scholar] [CrossRef]
- Ruiz, D.; Reich, M.; Bureau, S.; Renard, C.M.G.C.; Audergon, J.M. Application of reflectance colorimeter measurements and infrared spectroscopy methods to rapid and nondestructive evaluation of carotenoids content in apricot (Prunus armeniaca L.). J. Agric. Food Chem. 2008, 56, 4916–4922. [Google Scholar] [CrossRef]
- Jamshidi, B.; Minaei, S.; Mohajerani, E.; Ghassemian, H. Reflectance Vis/NIR spectroscopy for nondestructive taste characterization of valencia oranges. Comput. Electron. Agric. 2012, 85, 64–69. [Google Scholar] [CrossRef]
Figure 1.
Original spectra for green ‘Ratuni UNPAD’ cayenne pepper.

Figure 2.
Scatter plots and regression line of calibration set (green) and prediction set (orange) of water content (a,b), total carotenoids (c,d), and capsaicin (e,f) in green ‘Ratuni UNPAD’ cayenne pepper.
Figure 2.
Scatter plots and regression line of calibration set (green) and prediction set (orange) of water content (a,b), total carotenoids (c,d), and capsaicin (e,f) in green ‘Ratuni UNPAD’ cayenne pepper.

Figure 3.
Regression coefficients: (a) water content, (b) total carotenoids, and (c) capsaicin of green ‘Ratuni UNPAD’ cayenne pepper.
Figure 3.
Regression coefficients: (a) water content, (b) total carotenoids, and (c) capsaicin of green ‘Ratuni UNPAD’ cayenne pepper.


Table 1.
Summary of laboratory analysis of water content, total carotenoids, and capsaicin in calibration set and prediction set.
Table 1.
Summary of laboratory analysis of water content, total carotenoids, and capsaicin in calibration set and prediction set.
| Nutritional Compounds | Calibration Set | Prediction Set | ||
|---|---|---|---|---|
| Range | Mean | Range | Mean | |
| Water content (%) | 72.26–76.87 | 74.52 | 72.47–76.86 | 74.57 |
| Total carotenoids (mg/100 g) | 7.79–25.69 | 16.65 | 9.24–22.73 | 16.93 |
| Capsaicin (mg/100 g) | 208.57–1424.72 | 752.26 | 240.35–1328.36 | 762.95 |
Table 2.
Summary of PLSR and PCR of water content, total carotenoids, and capsaicin in calibration set and prediction set.
Table 2.
Summary of PLSR and PCR of water content, total carotenoids, and capsaicin in calibration set and prediction set.
| Nutritional Compounds | Regression Methods | Spectra | PC | Rcal | RMSEC | Rpred | RMSEP | RPD |
|---|---|---|---|---|---|---|---|---|
| Water content | PLSR | Original | 7 | 0.86 | 0.59 | 0.85 | 0.61 | 1.90 |
| dg1 | 7 | 0.83 | 0.64 | 0.76 | 0.75 | 1.57 | ||
| SNV | 7 | 0.82 | 0.65 | 0.81 | 0.68 | 1.72 | ||
| PCR | Original | 11 | 0.86 | 0.59 | 0.83 | 0.64 | 1.81 | |
| dg1 | 7 | 0.76 | 0.75 | 0.80 | 0.69 | 1.69 | ||
| SNV | 8 | 0.81 | 0.68 | 0.81 | 0.67 | 1.74 | ||
| Total carotenoids | PLSR | Original | 14 | 0.94 | 1.29 | 0.89 | 1.75 | 2.21 |
| dg1 | 15 | 0.95 | 1.18 | 0.86 | 1.97 | 1.96 | ||
| SNV | 14 | 0.93 | 1.47 | 0.82 | 2.17 | 1.78 | ||
| PCR | Original | 20 | 0.93 | 1.43 | 0.87 | 1.91 | 2.02 | |
| dg1 | 20 | 0.91 | 1.65 | 0.78 | 2.40 | 1.61 | ||
| SNV | 20 | 0.90 | 1.67 | 0.83 | 2.11 | 1.83 | ||
| Capsaicin | PLSR | Original | 8 | 0.89 | 117.82 | 0.90 | 115.62 | 2.29 |
| dg1 | 9 | 0.89 | 119.29 | 0.64 | 199.98 | 1.32 | ||
| SNV | 9 | 0.89 | 120.60 | 0.74 | 176.03 | 1.50 | ||
| PCR | Original | 11 | 0.89 | 118.26 | 0.90 | 115.92 | 2.28 | |
| dg1 | 14 | 0.87 | 130.14 | 0.57 | 215.19 | 1.23 | ||
| SNV | 13 | 0.88 | 124.40 | 0.69 | 188.14 | 1.41 |
PC: principal component, Rcal: coefficient of correlation in calibration set, RMSEC: root mean square error of calibration set, Rpred: coefficient of correlation in prediction set, RMSEP: root mean square error of prediction set, RPD: the ratio of prediction to deviation.
Publisher’s Note: MDPI stays neutral with regard to jurisdictional claims in published maps and institutional affiliations. |
© 2022 by the authors. Licensee MDPI, Basel, Switzerland. This article is an open access article distributed under the terms and conditions of the Creative Commons Attribution (CC BY) license (https://creativecommons.org/licenses/by/4.0/).
Share and Cite
MDPI and ACS Style
Kusumiyati, K.; Putri, I.E.; Hamdani, J.S.; Suhandy, D. Real-Time Detection of the Nutritional Compounds in Green ‘Ratuni UNPAD’ Cayenne Pepper. Horticulturae 2022, 8, 554. https://doi.org/10.3390/horticulturae8060554
AMA Style
Kusumiyati K, Putri IE, Hamdani JS, Suhandy D. Real-Time Detection of the Nutritional Compounds in Green ‘Ratuni UNPAD’ Cayenne Pepper. Horticulturae. 2022; 8(6):554. https://doi.org/10.3390/horticulturae8060554
Chicago/Turabian StyleKusumiyati, Kusumiyati, Ine Elisa Putri, Jajang Sauman Hamdani, and Diding Suhandy. 2022. "Real-Time Detection of the Nutritional Compounds in Green ‘Ratuni UNPAD’ Cayenne Pepper" Horticulturae 8, no. 6: 554. https://doi.org/10.3390/horticulturae8060554
Note that from the first issue of 2016, this journal uses article numbers instead of page numbers. See further details here.