Article

Rapid Identification of Apple Maturity Based on Multispectral Sensor Combined with Spectral Shape Features

1
College of Mechanical and Electronic Engineering, Northwest A&F University, Xianyang 712100, China
2
Key Laboratory of Agricultural Internet of Things, Ministry of Agriculture and Rural Affairs, Xianyang 712100, China
3
Shaanxi Key Laboratory of Agricultural Information Perception and Intelligent Service, Xianyang 712100, China
4
College of Horticulture, Northwest A&F University, Xianyang 712100, China
*
Author to whom correspondence should be addressed.
These authors contributed equally to this work.
Horticulturae 2022, 8(5), 361; https://doi.org/10.3390/horticulturae8050361
Submission received: 15 December 2021 / Revised: 16 April 2022 / Accepted: 17 April 2022 / Published: 21 April 2022
(This article belongs to the Special Issue Genetics and Breeding of Fruit Trees)

Abstract

:
The rapid and convenient detection of maturity is of great significance to determine the harvest time and postharvest storage conditions of apples. In this study, a portable visible and near-infrared (VIS/NIR) analysis device prototype was developed based on a multispectral sensor and applied to ‘Fuji’ apple maturity detection. The multispectral data of apples with maturity variation was measured, and the prediction model was established by a least-square support vector machine and linear discriminant analysis. Due to the low resolution of the multispectral data, regular preprocessing methods cannot improve the prediction accuracy. Instead, the spectral shape features (spectral ratio, spectral difference, and normalized spectral intensity difference) were used for preprocessing and model establishment, and the combination of the three features effectively improved the model performance with a prediction accuracy of 88.46%. In addition, the validation accuracy of the optimal model was 84.72%, and the area under curve (AUC) value of each maturity level was higher than 0.8972. The results show that the multispectral sensor is an appliable choice for the development of the portable detection device of apple maturity, and the data processing method proposed in this study provides a potential solution to improve the detection accuracy for multispectral sensors.

1. Introduction

Apples are one of the most important agricultural products in the global market, which are nutritious and crisp and are deeply loved by consumers [1]. Maturity is closely related to the harvest time and postharvest quality of apples, making it a reliable index to scientifically manage the harvest and storage of apples, thereby prolonging their shelf life and ensuring their final quality [2,3]. Maturity indicators are determined by destructive measurements, such as starch pattern index (SPI), firmness, soluble solids content (SSC), Streif index, etc. [4]. In recent years, investigations have been done to fulfill the non-destructive detection need of the fruit industry. Visible and near-infrared (VIS/NIR) spectroscopy is a promising solution for the quality characterization of fruits and other agricultural products [5,6] due to its fast, non-destructive measurement for simultaneous analysis of multiple components without sample preparation.
VIS/NIR spectroscopy has been applied to the non-destructive detection of the maturity of apples, pears, and other fruits [7]. Peirs et al. [8,9] used VIS/NIR spectroscopy to study the prediction of the Streif index of different apple varieties and analyzed the effect of natural variability on the prediction. Zhang et al. [10] determined the maturity according to starch dyeing and accurately predicted the apple maturity level by VIS/NIR spectroscopy. Pourdarbani et al. [11,12] used color and spectral data to make non-destructive discrimination of the four ripening stages of an apple.
In the past decade, research on portable VIS/NIR analysis devices has gradually sprung up. The devices are of small size and low manufacturing cost and can realize the on-site detection of fruit quality [13]. Fan, et al. [14] developed a VIS/NIR analysis device prototype using a commercial spectrometer (USB2000+, Ocean Optics Inc., Dunedin, FL, USA) combined with partial least squares regression to achieve non-destructive testing of apple SSC. Guo, et al. [15] developed a hand-held fruit SSC detector using an STS micro-spectrometer (Ocean Optics Inc., Dunedin, FL, USA), which was combined with partial least squares regression to realize the SSC non-destructive testing of kiwifruit, nectarine, and apricot. Because of the high price of high-resolution spectrometers, some researchers have explored the potential of some low-cost optical sensors as the collector for spectra of multiple wavelengths instead. In this case, two common strategies have been applied. The first one is using photodiodes to collect the spectrum of characteristic LEDs. Zhao, et al. [16] realized the characteristic spectrum collection of apple quality by using characteristic LED light sources combined with a photodiode and established a related quantitative analysis model. Abasi, et al. [17] used six characteristic LED light sources to form an array, combined with photodiodes to develop a portable fruit quality detector. The other solution is to use multispectral sensors, which can detect the spectral information of multiple wavelengths at the same time and has the advantage of low cost. Li, et al. [18] used a 7-wavelength spectral sensor combined with a tungsten halogen lamp to achieve the non-destructive detection of moldy apple cores. Yang, et al. [19] designed a VIS/NIR analysis device using an 18-wavelength spectral sensor for measuring the composition of milk.
Multispectral sensors have low spectral resolution and can only collect a few wavelengths of spectral information. The conventional preprocessing methods for the whole spectrum are no longer applicable for multispectral data. Spectral shape features can be described by some spectral indices to enhance spectral information according to previous VIS/NIR studies. Ma, et al. [20] used the spectral absorption index as a pretreatment method to extract morphological characteristic information from the absorption spectrum and reflection spectrum to detect the water content of pork. Li, et al. [21] used the normalized spectral ratio to correct the light scattering effect in the original spectrum and improve the prediction accuracy of SSC and dry matter content of apples. Combined with the empirical threshold, the spectral indices can also be used to detect fruit diseases [22], defects [23], and maturity [24]. Spectral shape features could enhance spectral information and help to improve the prediction accuracy of multispectral sensors.
This study aims to achieve low-cost and convenient non-destructive testing of apple ripeness by combining multispectral sensors with spectral shape features. A portable VIS/NIR analyzer based on a multispectral sensor was used to collect the spectral information of apples of different maturity. A least-square support vector machine (LSSVM) and linear discriminant analysis (LDA) were used to build predictive models, and the performance of the optimal model was validated using apples in different seasons. The prediction results of multi-spectral data processed by conventional spectral data processing methods and spectral shape features were analyzed and compared. The results of the comparison proved that the spectral shape feature is a more effective method for processing multispectral data, and the multispectral sensor combined with the spectral shape features can predict apple ripeness non-destructively.

2. Materials and Methods

2.1. Experimental Samples

The experimental samples were obtained from a commercial orchard in Fufeng, Shaanxi Province, China. Twelve ‘Fuji’ apple trees with similar growth status were randomly selected as fixed sampling points in the orchard. In 2019, 836 apples (Set-1) at different maturity stages were collected to develop a calibration model for the device. In 2020, 360 apples (Set-2) of different maturity stages were collected in the same orchard to verify the performance of the model. All apples picked from the trees were washed and numbered after being transported back to the lab on the same day. Before spectral measurements, all samples were stored in the laboratory for 24 h, allowing the samples to reach room temperature to avoid the influence of temperature.

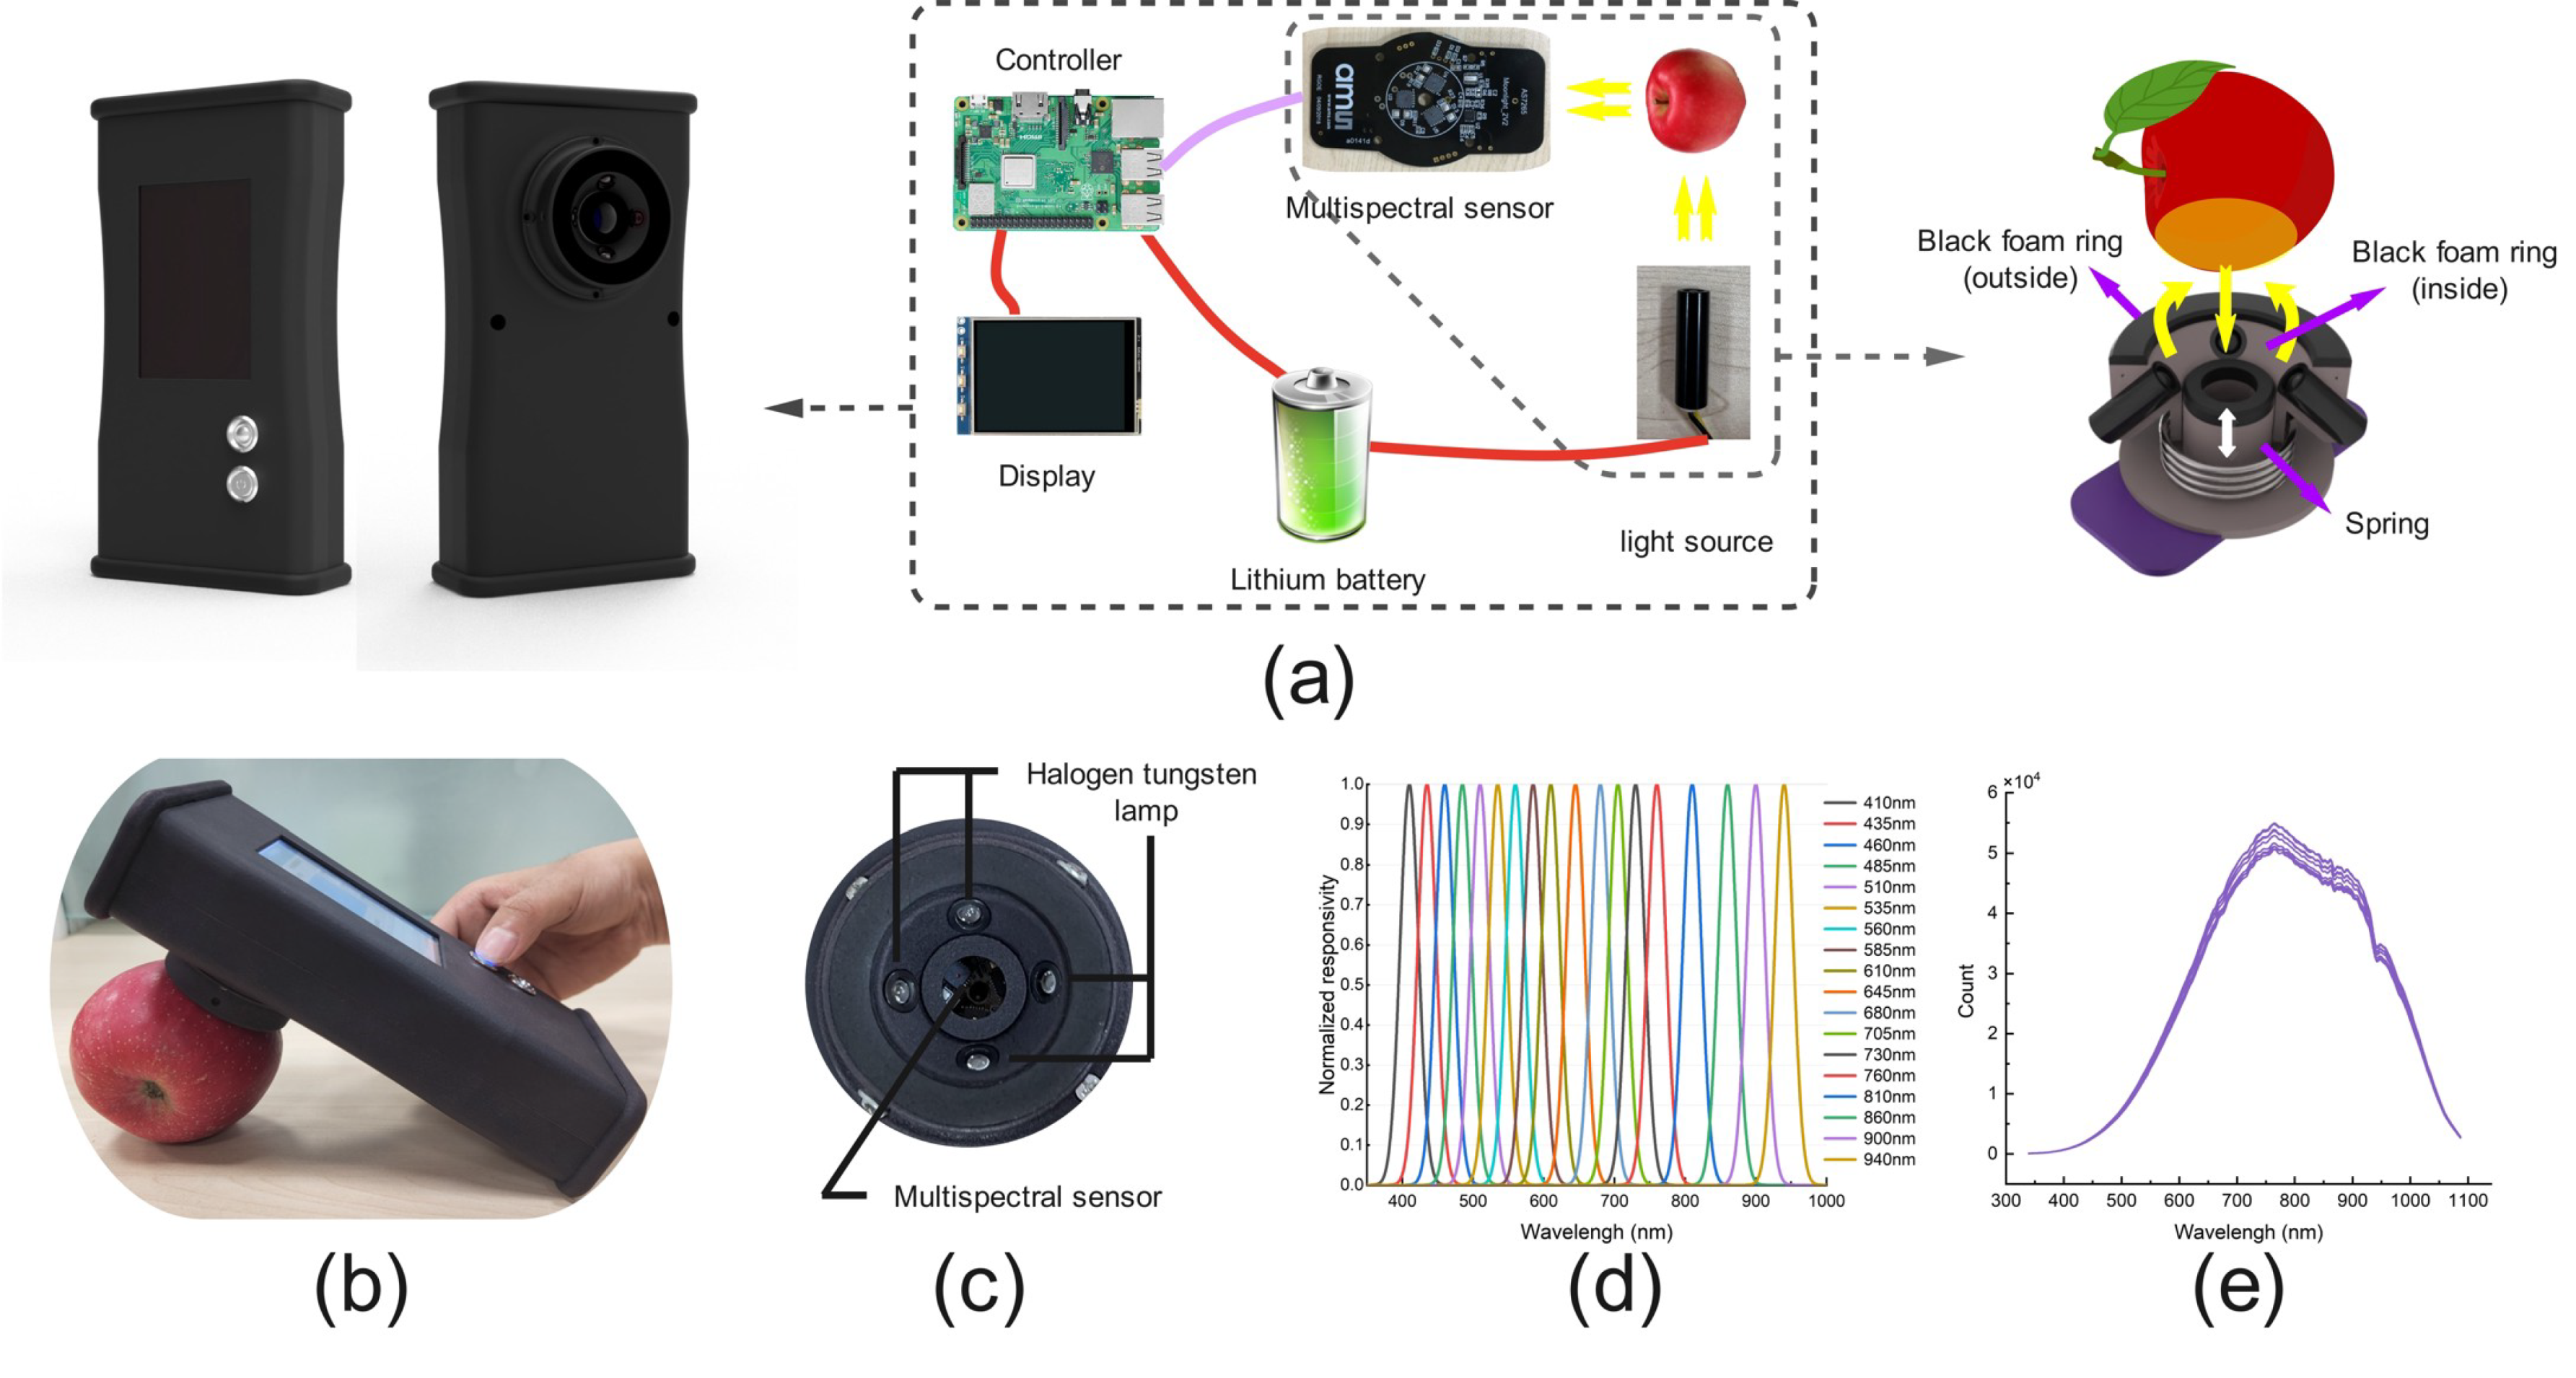
2.2. Spectral Data Acquisition

Spectral data acquisition was completed by a Vis/NIR analysis device based on multispectral sensors. The device was mainly composed of a microcontroller, multispectral sensor, halogen tungsten lamp, display, and power supply unit (Figure 1). The multispectral sensor (AS7265x, Austria Mikro Systeme, Styria, Austria) can perform spectral detection at 18 wavelengths (410, 435, 460, 485, 510, 535, 560, 585, 610, 645, 680, 705, 730, 760, 810, 860, 900 and 940 nm) from 410 nm to 940 nm. Four 4.5 W halogen tungsten lamps (VIVO-B, Ocean Optics Inc., USA) were selected as the light source, which have a spectral range of 360–2000 nm and provide stable illumination. The device was powered by a lithium battery. The structure of the device was designed using PTC Creo Parametric 5.0 (PTC Inc., Boston, MA, USA) and produced using a 3D printer. The appearance of the device is square. The OLED display and the detection probe were placed in the upper part of the device, the lithium battery and microcontroller were placed in the lower part of the device, and insulated cotton was added between the battery and the microcontroller. Ventilation holes were added to the back of the device to enhance heat dissipation.
Previous studies have shown that the interaction mode can obtain more internal optical information in fruits [25]. Maturity is a comprehensive attribute of apples, and more internal optical information could contribute to better maturity detection. Therefore, a detection probe based on interaction mode was designed to collect spectra (Figure 1a). The sensor and the light source were integrated into the detection probe to decrease the size and avoid a complex optical path design. The collimating light source with 45° incidence was arranged around the detection channel in a ring. When the device is working, the light emitted by the light source will reach the apple surface directly and integrate with fruit tissue by reflection, scattering and absorption. The sensor will then receive the reflected and scattered light signal. The diameter of the detection probe was only 50 mm. A soft black foam ring with an outer diameter of 50 mm was placed on the probe to avoid the interference of stray ambient light. A soft black foam ring with an outer diameter of 20 mm was placed around the detection channel to support the fruit and separate the collection area from the lighting area, ensuring that the measured light signal is from the fruit tissue rather than the light source. In addition, considering the variation size (diameter 70–120 mm) and shape of apples, an adaptive structure was designed to ensure that the distance between the detector and the fruit was approximately fixed. The adaptive structure was realized by a soft spring (Figure 1a). When testing, pressing the apple can make the spring stretch and the sensor move down; therefore, the foam ring was tightly attached to the surface of the apple. After the testing was completed, the spring returned to its original state.
The software of the device was developed by Python, which was used to realize the control of the device, the acquisition and analysis of spectral data, and the display of detection results. The integration time was set to 200 ms. The average value obtained by ten consecutive scans at the same position was recorded as the spectrum of each sample. The measured spectral data were automatically named and stored using predefined file name prefixes and save paths. It takes less than three seconds to complete the analysis of each fruit spectrum. To improve the data stability, we calibrated the light source intensity using a standard whiteboard (WR-D97, material PTFE) so that the light source intensity was adjusted to the standard spectrum every time the device was turned on. The dark spectrum was obtained by turning off the light source, and the original spectrum was corrected according to Equation (1) [10]:
R = R r a w R d a r k R w h i t e R d a r k × 100 %
where Rraw represents the original spectrum, Rdark represents the dark spectrum, Rwhite represents the standard spectrum, and R represents the corrected spectrum.
For the spectral detection system, the signal-to-noise ratio (SNR) is an important index to evaluate the performance of the system. Walsh, et al. [26] defined SNR as the average count (intensity) of each selected wavelength divided by the standard deviation. In addition, the area change rate (ACR) was used as the indicator for the system stability. ACR describes the variation in spectra measured at the same position of a sample by calculating the difference in the spectral region area. Before ACR analysis, the spectrum data is normalized to the range of 0–1 to reduce the influence of different light source settings in the experiment. ACR is approximately the root-mean-square deviation (RMSD) of all spectral areas and can be calculated by Equation (2) [27]:
RMSD = 1 N i = 1 N ( Y i Y m e a n ) 2
where N represents the number of the spectra, Y represents the area of the ith spectrum, and Ymean represents the mean area of all spectra.

2.3. Data Measurement

After the spectra collection, the destructive tests were carried out to measure the maturity of the apples. The starch pattern index (SPI) was measured by cutting the fruit in half along the equator, soaking half of the fruit in I2-KI solution, and comparing it with the Cornell general SPI chart [28]. In addition, other qualities (texture, SSC, acidity) were measured to observe the quality changes of apples with different maturity. The texture was characterized by a texture analyzer (TA. XT Express, Stable Micro Systems, Godalming, UK). The type of probe was P/2 and the puncture depth was 10 mm. According to texture analysis, the phenotypic texture parameters including pulp firmness, peel firmness, pericarp elasticity, pulp elasticity, and fruit brittleness were determined [29,30]. The juice of the remaining half of the fruit was extracted, and the SSC and acidity were measured by a digital refractometer (PAL-BX/ACID5, Atago, Tokyo, Japan) and a fruit acidity meter (GMK-835F (apple), G-WON, Seoul, Korea).
According to the SPI, the maturity of apples was characterized by three levels: immature, harvest mature, and eatable mature [10]. The number of apples obtained in 2019 was 270, 320, and 246 for each maturity level. For apples in 2020, the number was 103, 135, and 122, respectively. The number of the harvest mature apples (326 apples) and immature apples (274 apples) harvested in 2019 was significantly higher than that of eatable mature apples (246 apples). To avoid the over-fitting problem caused by sample imbalance, we selected the same number of samples (246 apples) from immature apples and harvested mature apples. On this basis, the fruits of each level were divided into calibration set and prediction set at a ratio of 3:1 by the Kennard–Stone (KS) method. The samples from 2020 were all used to verify the model performance.

2.4. Spectra Preprocessing

Spectra preprocessing can decrease the noise of raw data and improve prediction accuracy. Common preprocessing methods include Savitzky–Golay smoothing (SGS), multivariate scattering correction (MSC), standard normal variable transformation (SNV), and so on. However, those methods can hardly apply to the data of this study since the spectra measured only contained signals of 18 wavelengths, which is far less than the data of regular spectrometers. In this study, three spectral shape features (spectral ratio (SR), spectral difference (SD), and normalized spectral intensity difference (NSID)) were used to preprocess the spectra. SR and SD were considered effective parameters to evaluate specific components or properties of fruits, like fruit maturity and surface damage. Lleó, et al. [24] calculated the spectral index related to SR and SD by three wavelengths (Index1 = Rλ=720 + Rλ=634 − 2Rλ=674, Index2 = 2Rλ=674/(Rλ=720 + Rλ=634)) for peach maturity detection. NSID is a standardized index, also known as the normalized vegetation index in remote sensing, which is used to generate images showing the amount of vegetation (relative biomass). Jie, et al. [31] used SR and NSID (Index1 = Rλ=730/Rλ=803, Index2 = (Rλ=730Rλ=803)/(Rλ=730 + Rλ=803)) to assess watermelon maturity. Although these spectral indices are calculated by only three wavelengths, they effectively revealed the spectral shape features highly related to fruit maturity. The equations for spectral shape features are as follows [18,31]:
SR = R λ = i R λ = j
SD = R λ = i R λ = j
NSID = R λ = i R λ = j R λ = i +   R λ = j
where Rλ=i and Rλ=j represent the spectral reflection intensity of the ith and jth wavelength in a spectral curve, respectively.
In previous VIS/NIR studies, a single spectral shape feature (spectral index) has also been successfully applied to detect the firmness and maturity of peaches, strawberries, and other fruits [24,31,32]. In this study, four commonly used spectral indices were compared with the multivariate analysis of spectral shape features. Specifically, 680 nm is an important wavelength related to chlorophyll content, which is suitable for checking the maturity and ripening process of apples [33]. The peaks (645 nm and 730 nm) of the spectral curve on both sides of 680 nm were both selected with 680 nm to establish the spectral index to identify apple maturity. The equations for spectral indices are as follows [10]:
Index 1 = R λ = 730 + R λ = 645 2 R λ = 680
Index 2 = R λ = 730 + R λ = 645 R λ = 680
Index 3 = R λ = 730 R λ = 680 R λ = 720 + R λ = 680
Index 4 = l o g 10 R λ = 730 R λ = 680

2.5. Model Establishment and Evaluation

The least-square support vector machine (LSSVM) and linear discriminant analysis (LDA) were used to establish the calibration model for maturity prediction. LSSVM is an improved form of support vector machine, which simplifies the solution of the problem by transforming the solution of the quadratic optimization problem into the solution of a system of linear equations. LSSVM can handle linear and nonlinear multivariate analysis. Before training the LSSVM model, the optimal combination of the regularization parameter of the model and the kernel function parameter of the radial basis function is determined by using the two-dimensional grid search method [34]. LDA projects sample spectral variables to the best discriminant vector space to ensure that the same category of data after projection is as close as possible, and different categories of data are separated as far as possible [35,36].
For the spectral index, it is necessary to determine an optimal threshold for sample maturity assessment. The Otsu method is an effective algorithm to determine the threshold of image binary segmentation in image analysis [37]. Variance is a measure of the uniformity of gray distribution. The larger the between-class variance between the background and the target in the image, the greater the difference between the two parts. Misclassification will make the between-class variance lower. Therefore, the segmentation that maximizes the variance between classes could minimize the probability of misclassification. For the spectral index, after arranging the spectral index in descending order, the method for maximizing between-class variance can be used to determine the optimal threshold between immaturity and harvest maturity, as well as between harvest maturity and eatable maturity.
The accuracy was used to evaluate the overall accuracy of the classifier. The confusion matrix, recall, precision, and F1-Score were used to further analyze the prediction results. The receiver operating characteristic curve (ROC) can demonstrate the prediction ability of the classifier. In the ROC graph, the closer the curve is to the upper-left edge of the graph, the better the performance of the classifier. The equations for each evaluation index are as follows [10]:
accuracy = T P + T N T P + T N + F P + F N
recall = T P T P + F N
precision = T P T P + F P
F1-Score = 2 × precision × recall precision + recall
where TP represents the correctly classified positive sample; TN represents correctly classified negative samples; FP represents the positive sample of misclassification; and FN represents the negative sample of misclassification.

3. Results and Discussion

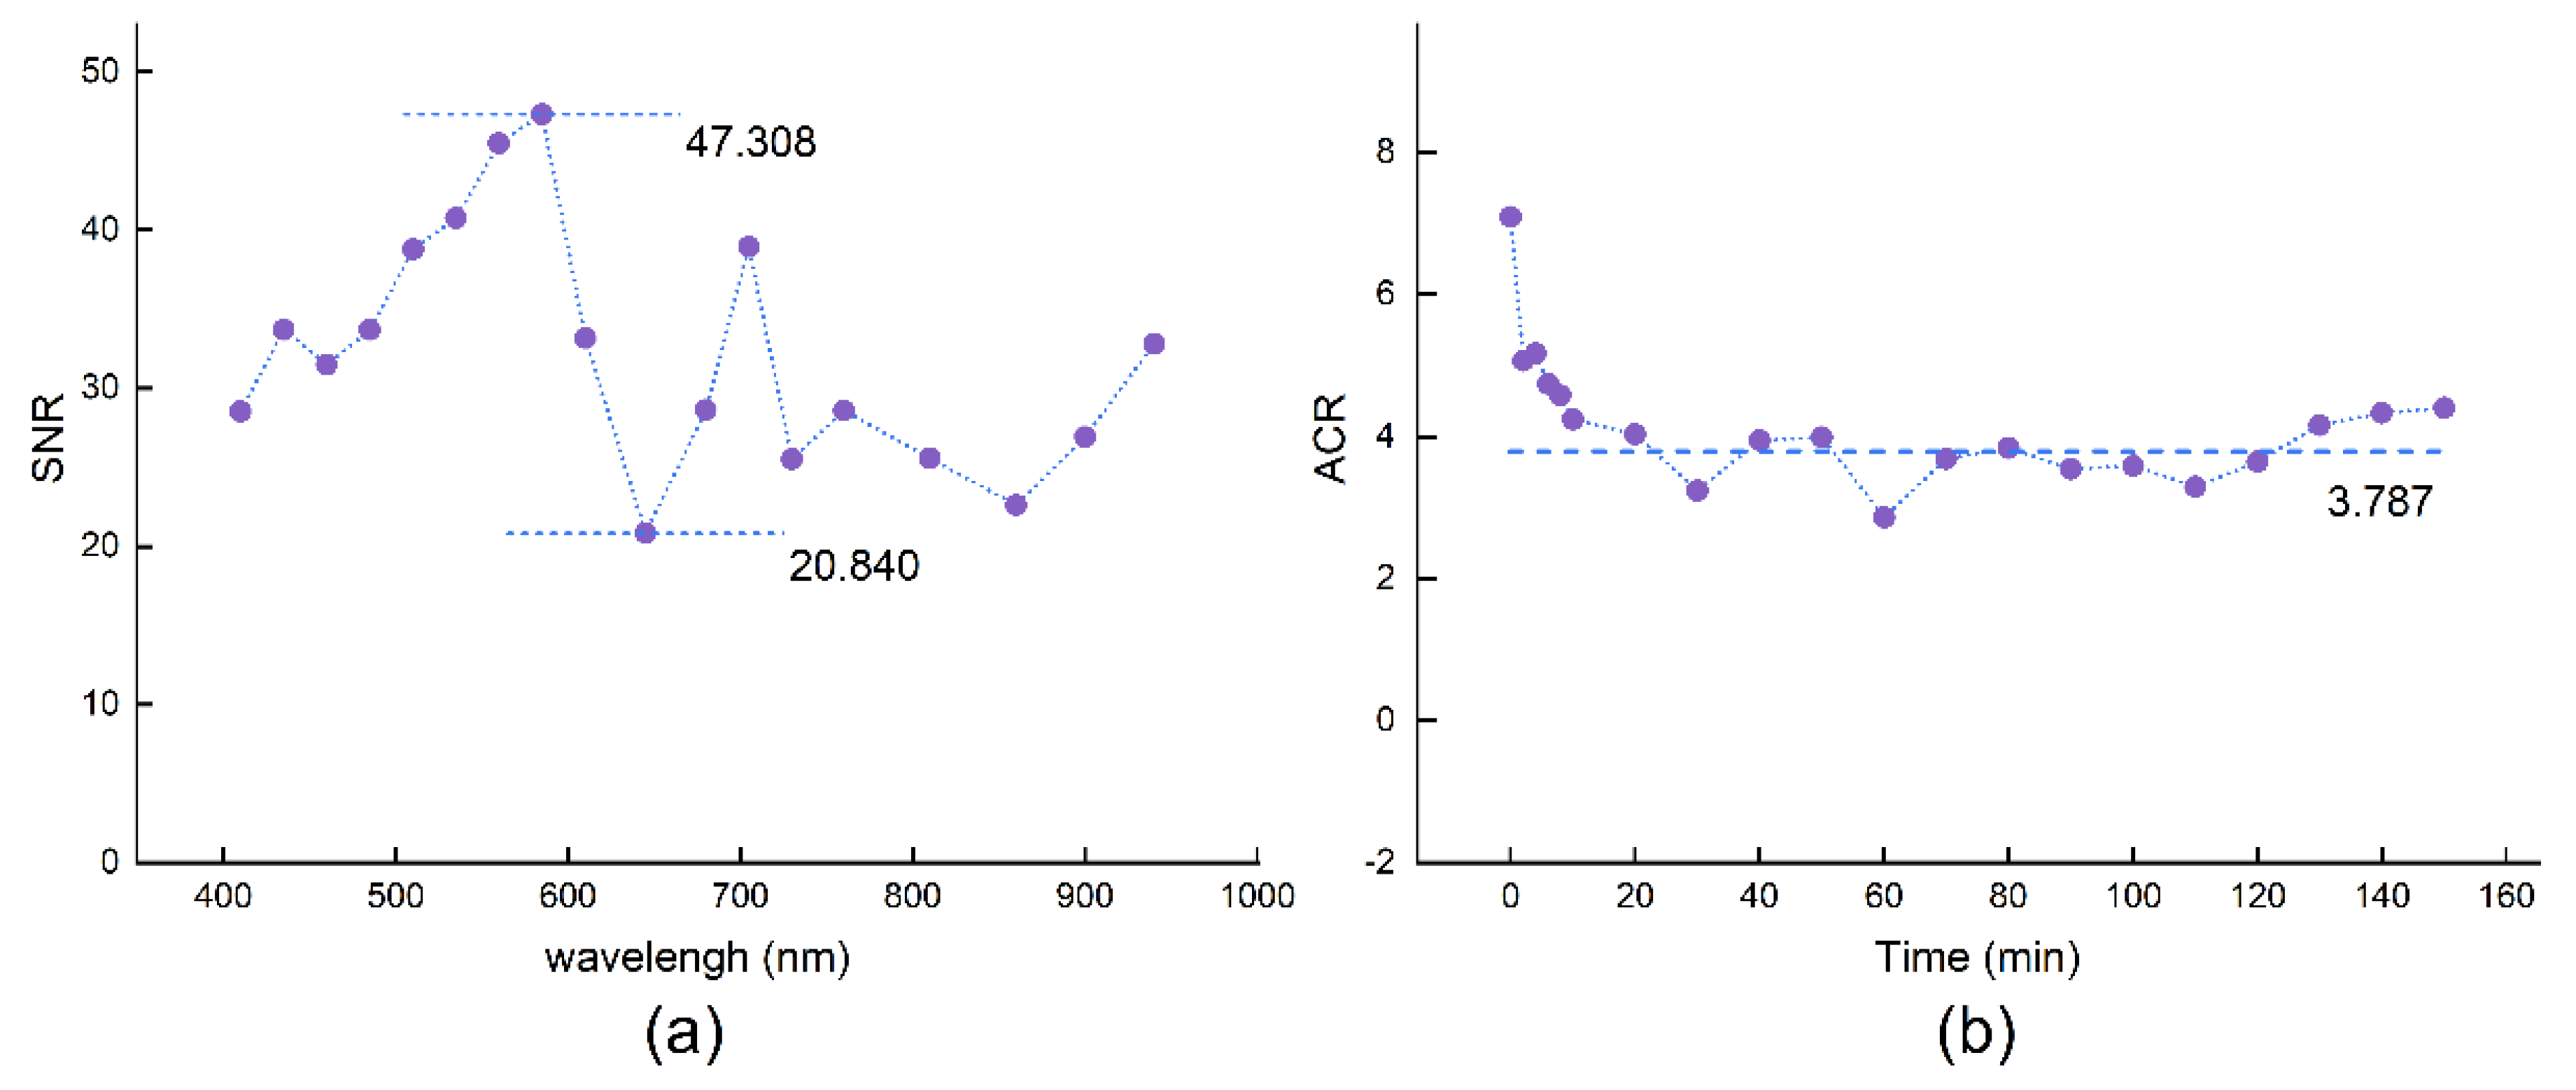
3.1. The Sensor Stability Test

The white ball made of polytetrafluoroethylene was used as a reference to test the stability of the spectrum collected by the multispectral sensor. In order to observe the effect of preheating time on the stability of the sensor, the spectrum was collected every 2 min in the first 10 min. Then, spectrum was collected every 10 min, and a total of 200 spectra were collected. The SNR and ACR were calculated to reflect the stability of the sensor. Figure 2a shows the SNR at different wavelengths. The SNR of the sensor at different wavelengths was 20.840–47.308. Figure 2b shows the ACR values of each measurement. Since the device was not fully preheated at the beginning, the collected spectrum fluctuated greatly, and the maximum ACR value was 7.094. After 10 min, the fluctuation of ACR decreased. The dotted line represents that the average ACR value obtained after 10 min was 3.787. The SNR and ACR values of the sensor in this study were close to the previous research on the dynamic transmission spectrum detection system [1,38], indicating that this sensor has good stability.

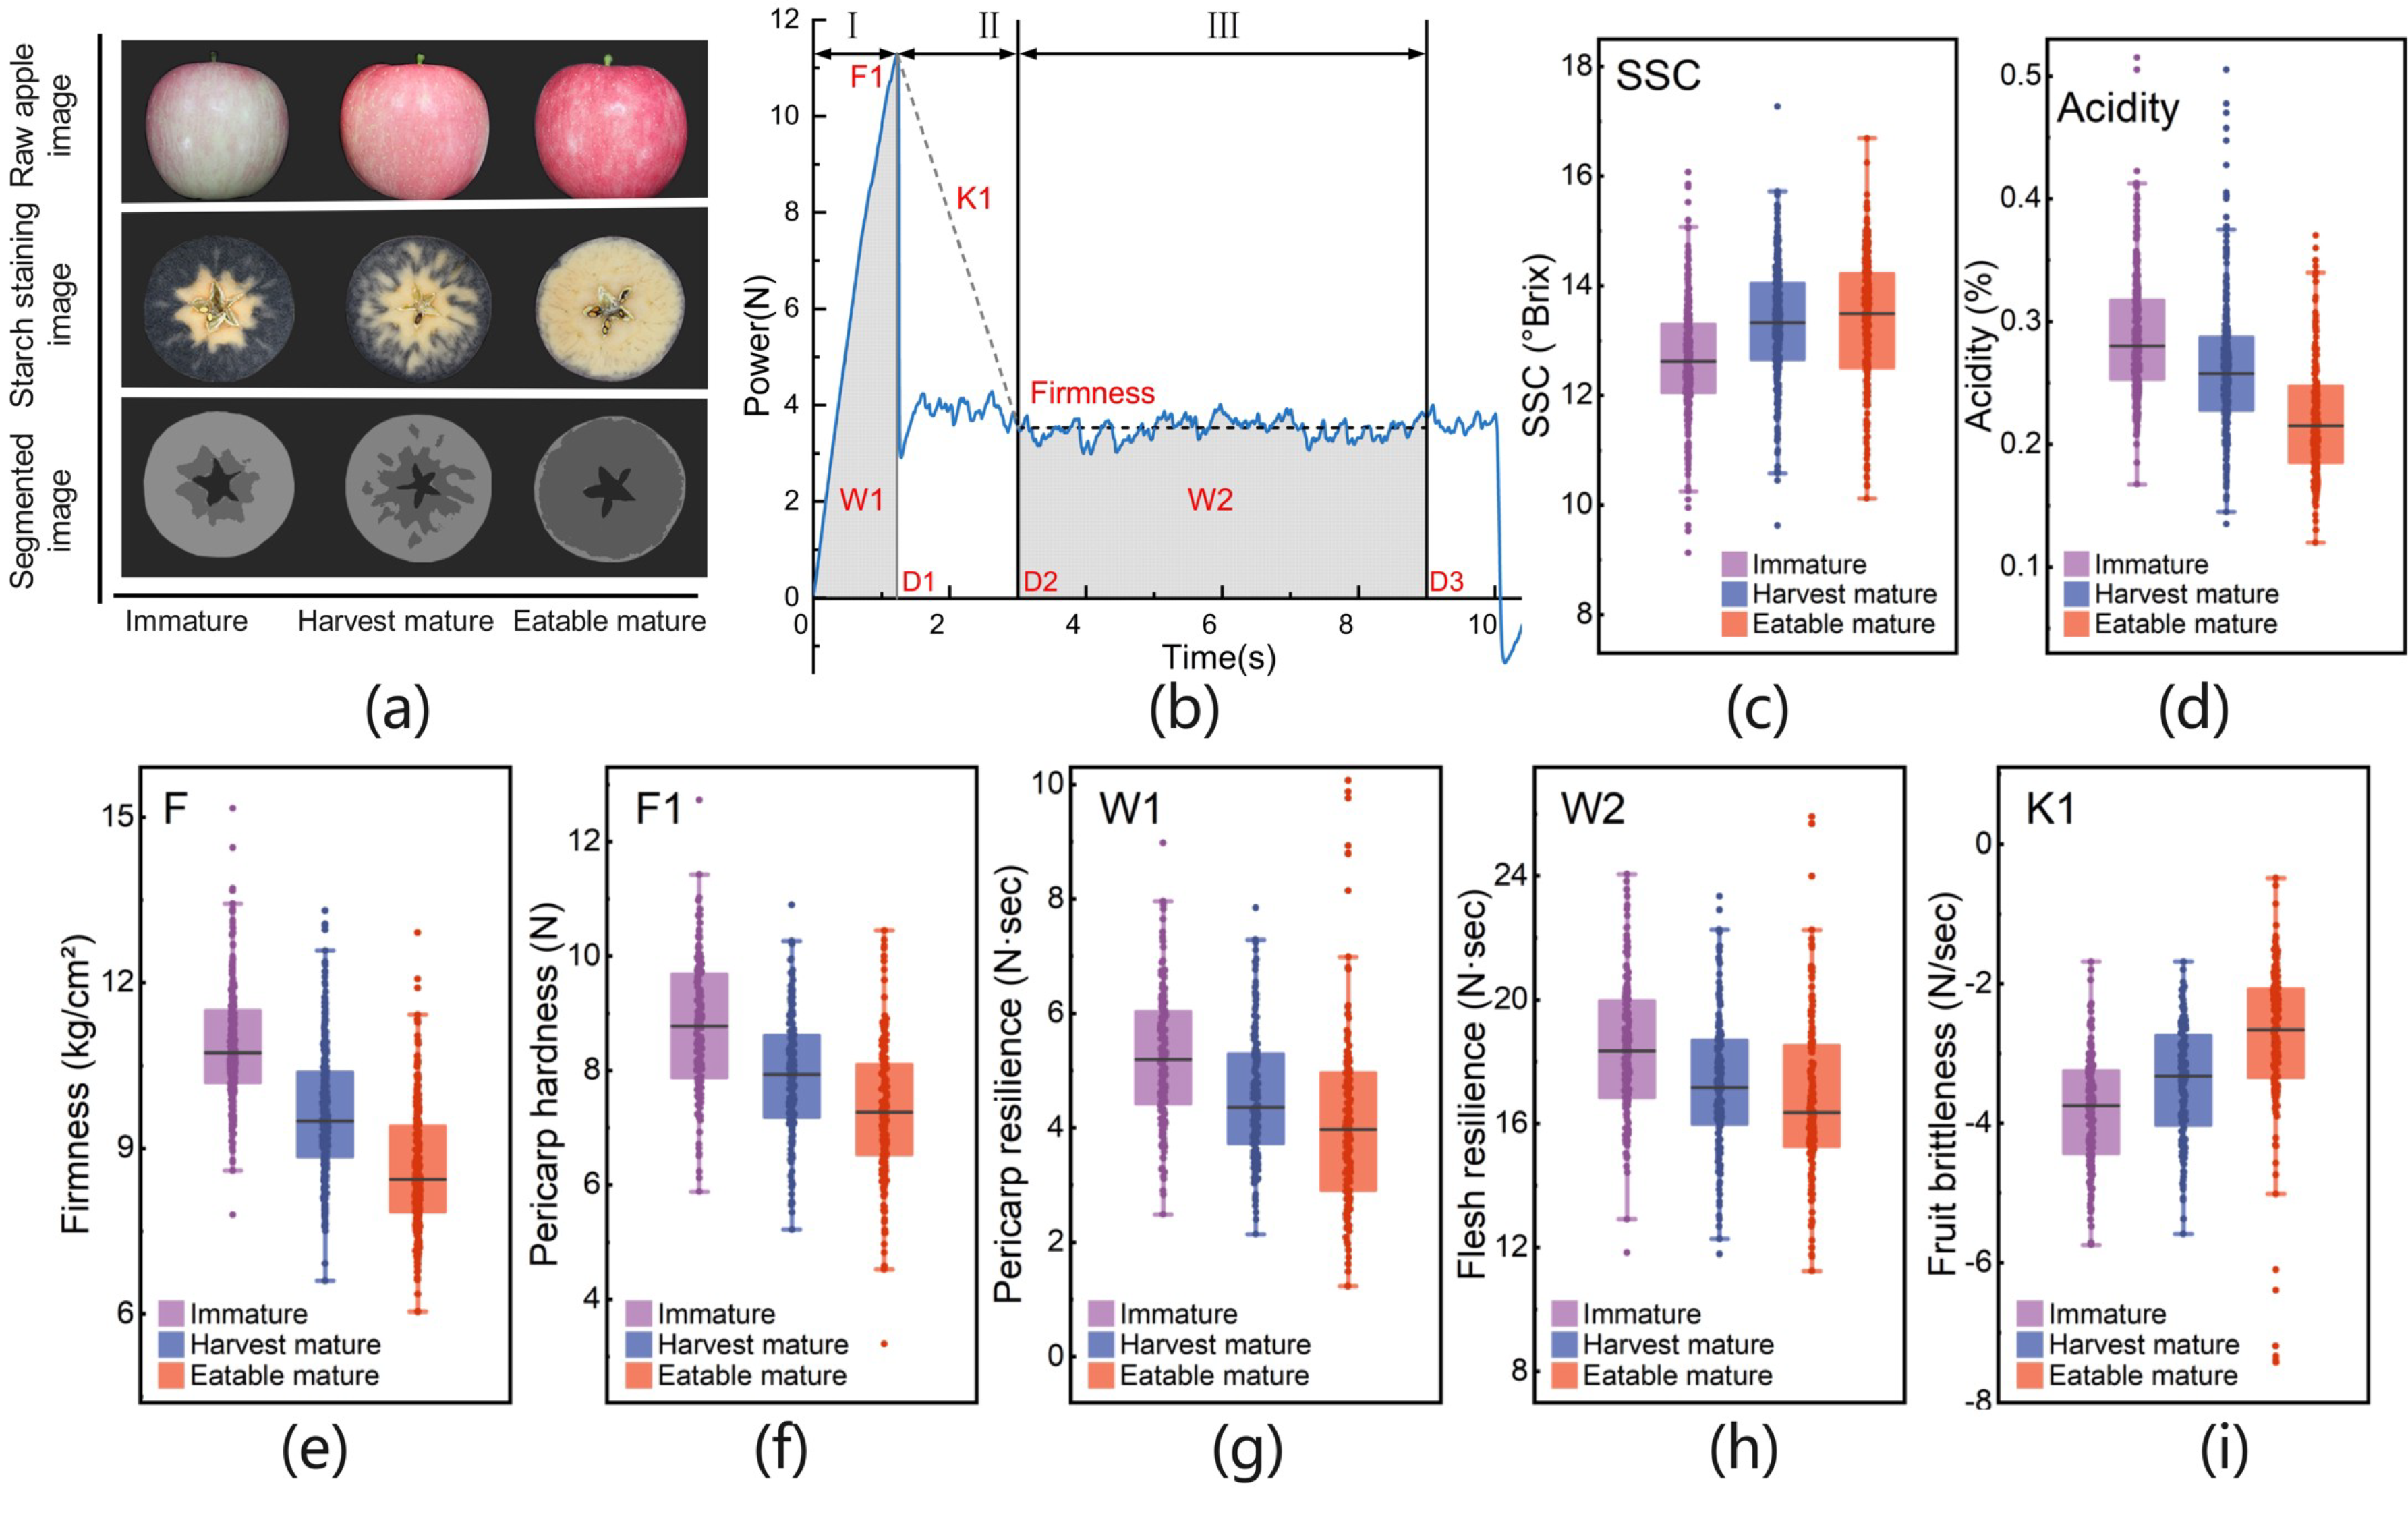
3.2. Apple Quality at Different Maturity Levels

The quality changes of ‘Fuji’ apples during ripening are shown in Figure 3. During apple ripening, the color gradually turned red (Figure 3a). Due to the increase in the activities of amylase, invertase, and sucrose synthase in the fruit, the starch was gradually hydrolyzed, the starch staining area decreased (Figure 3a), SSC increased (Figure 3c), and the acidity decreased (Figure 3d). The texture changed due to the changes in pectin content and cell wall composition during ripening. There were differences in firmness (Figure 3e), pericarp hardness (Figure 3f), pericarp resilience (Figure 3g), flesh resilience (Figure 3h), and fruit brittleness (Figure 3i) among apples with different maturity levels. The above quality changes will affect the measured spectral data, which provides a basis for using VIS/NIR spectroscopy to detect apple maturity.

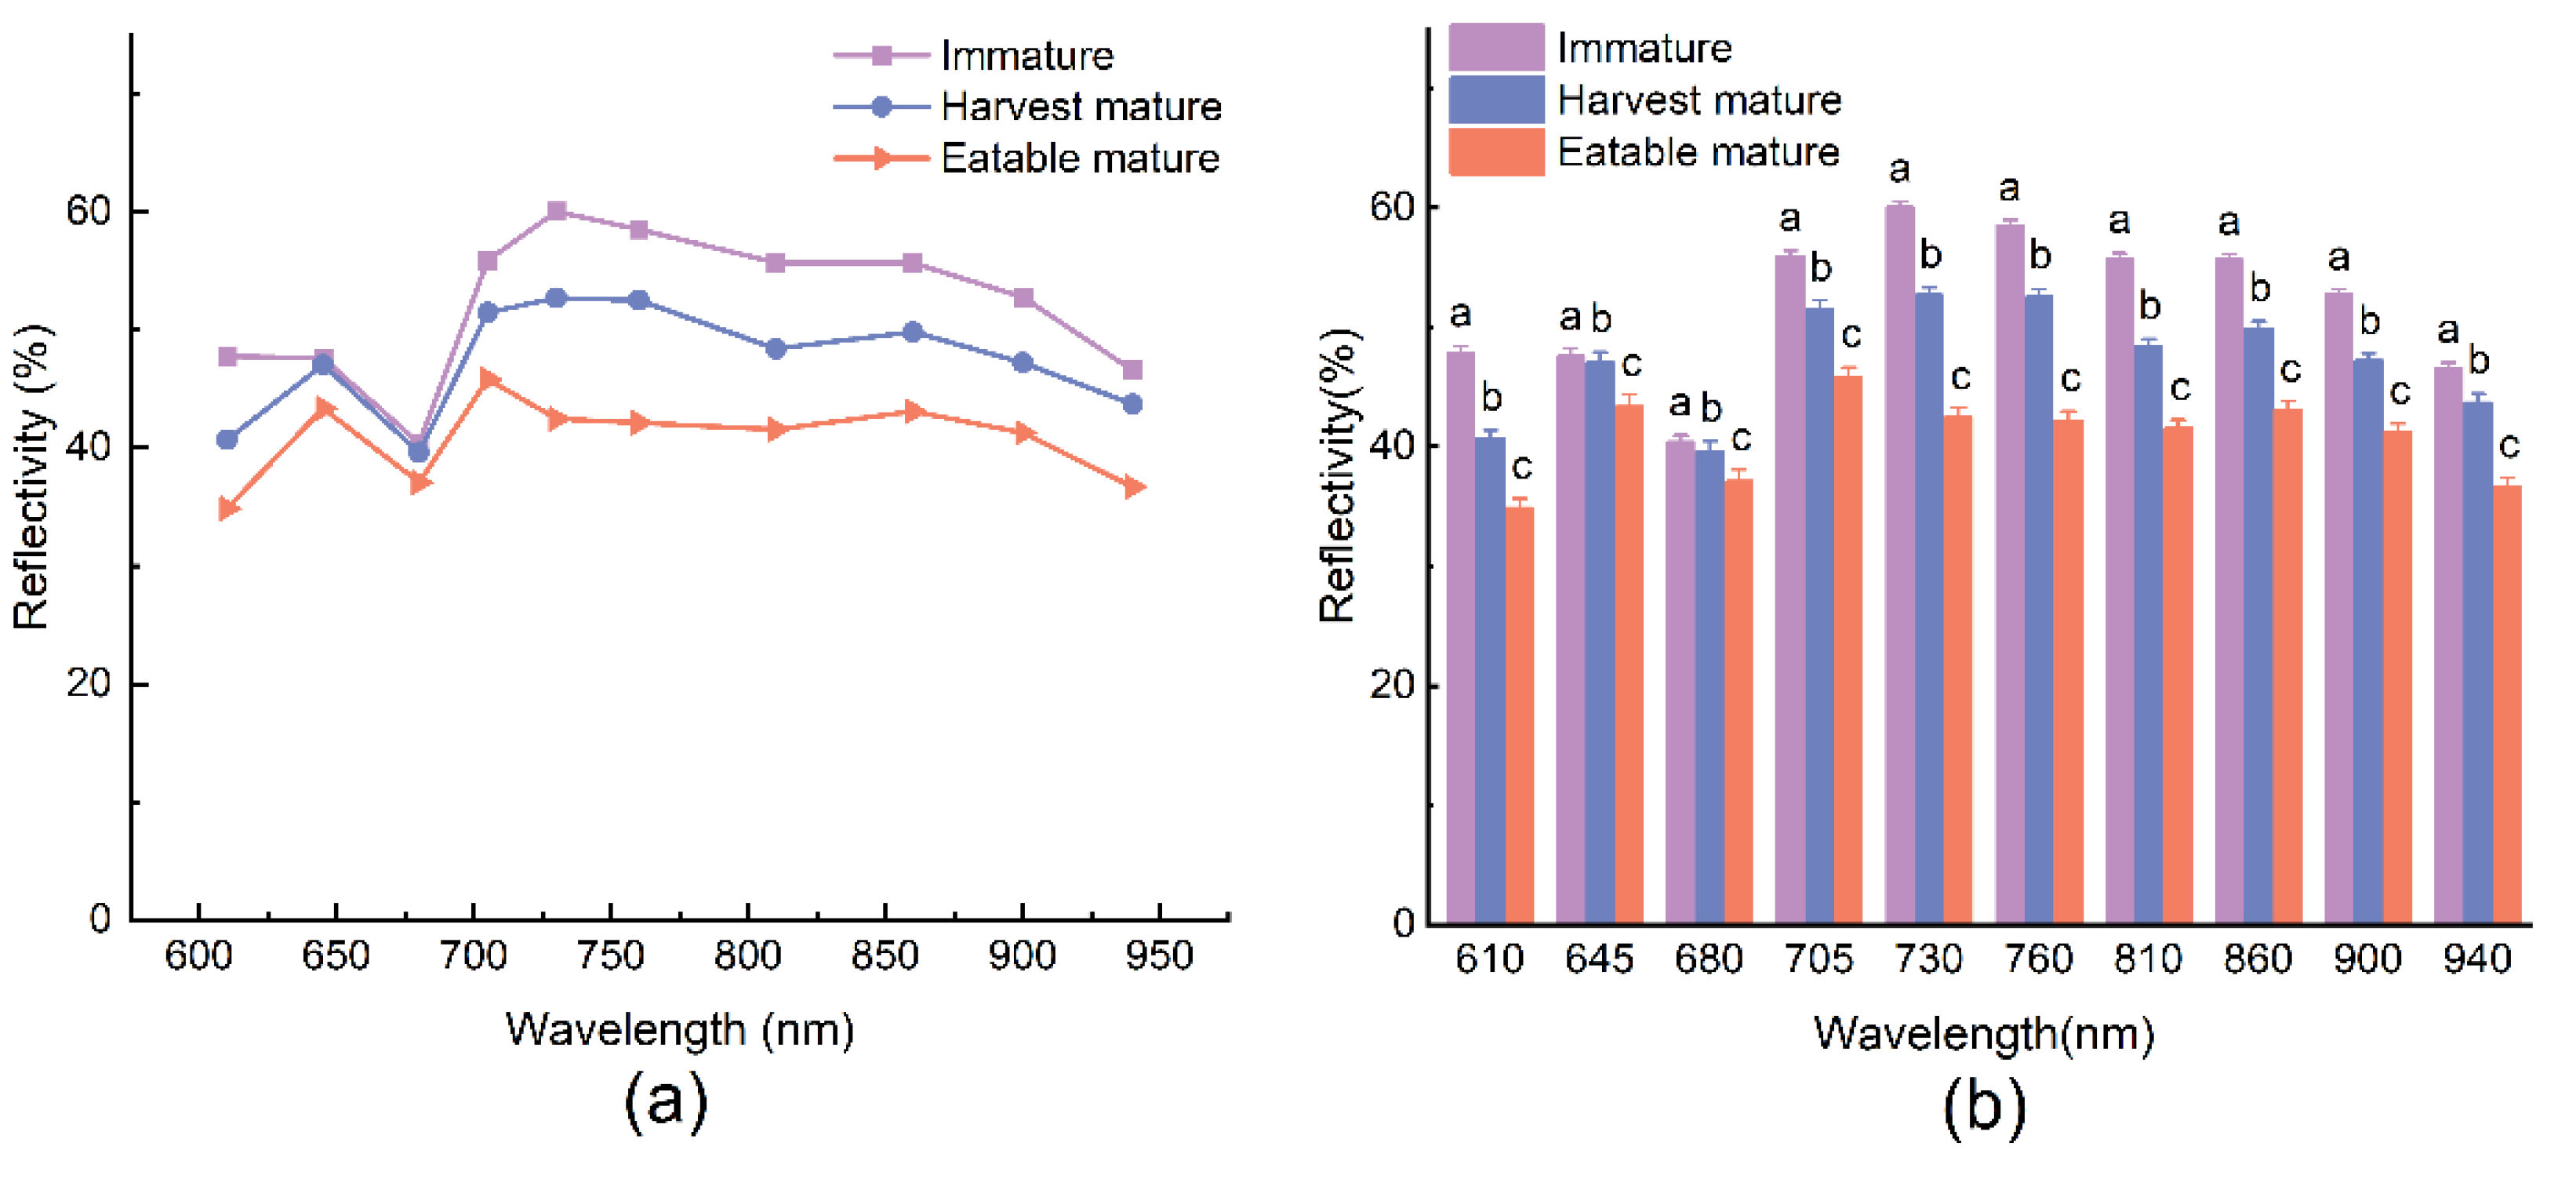
3.3. Spectral Analysis

The spectral data before 600 nm was affected by the content of anthocyanins in apples, so it is not suitable for the maturity detection of bagged apples [39,40]. Ten wavelengths in the wavelength range of 600–940 nm were selected for analysis. The spectral curves of different maturity and the spectral intensity distribution at different wavelengths are shown in Figure 4. At a given wavelength, the spectral intensity of high-maturity apples was lower than that of low-maturity apples, and there was a similar trend. The chlorophyll absorption peak at 680 nm and the downward trend close to the water absorption peak at 940 nm can be observed. A similar phenomenon was also observed by Zhang, et al. [10]. After the Kruskal–Wallis test, the spectral intensity of apples with a different maturity was significantly different at the same wavelength, which shows that the spectral information obtained based on a multispectral sensor has the potential to effectively detect apple maturity.

3.4. Modeling Based on Traditional Methods

The calibration models were developed using LSSVM and LDA. Several common pretreatment methods (SGS, MSC, and SNV) were used to compare with the original spectrum. Table 1 shows the prediction results of the developed models. The prediction performances of the LSSVM models were better than that of the LDA models because LSSVM can deal with the potential nonlinear relation between spectral data and fruit maturity [41]. The accuracy of the LSSVM model and LDA model based on the raw spectra was 84.70% and 82.51%, respectively. Compared with the raw spectra, the models based on the pretreated spectrum did not achieve better prediction accuracy. The accuracy of the calibration set was 80.36–89.01%, and that of the prediction set was 71.58–81.97%. Compared with the previous study, the prediction accuracy of multispectral sensors in predicting apple ripeness was significantly lower than that of the Vis/NIR spectrometer [10]. This result could be attributed to the fact that the pretreatment methods effective for regular spectra with high resolution are hardly applicable for multispectral data.
The prediction results of the model developed based on the raw spectra and LSSVM is shown in Table 2. The recall rate of the harvested mature samples (88.52%) was higher than that of the immature samples (83.61%) and the eatable mature samples (81.90%), and the precision (77.14%) was significantly lower than that of the immature samples (87.93%) and the eatable mature samples (90.91%). According to the confusion matrix, this is mainly because more immature and eatable mature samples were misclassified as being of harvest maturity, resulting in poor credibility of the developed model for the prediction of harvest maturity. Therefore, it is necessary to further improve the prediction accuracy of the model for immature and eatable mature samples.

3.5. Modeling Based on Spectral Shape Features

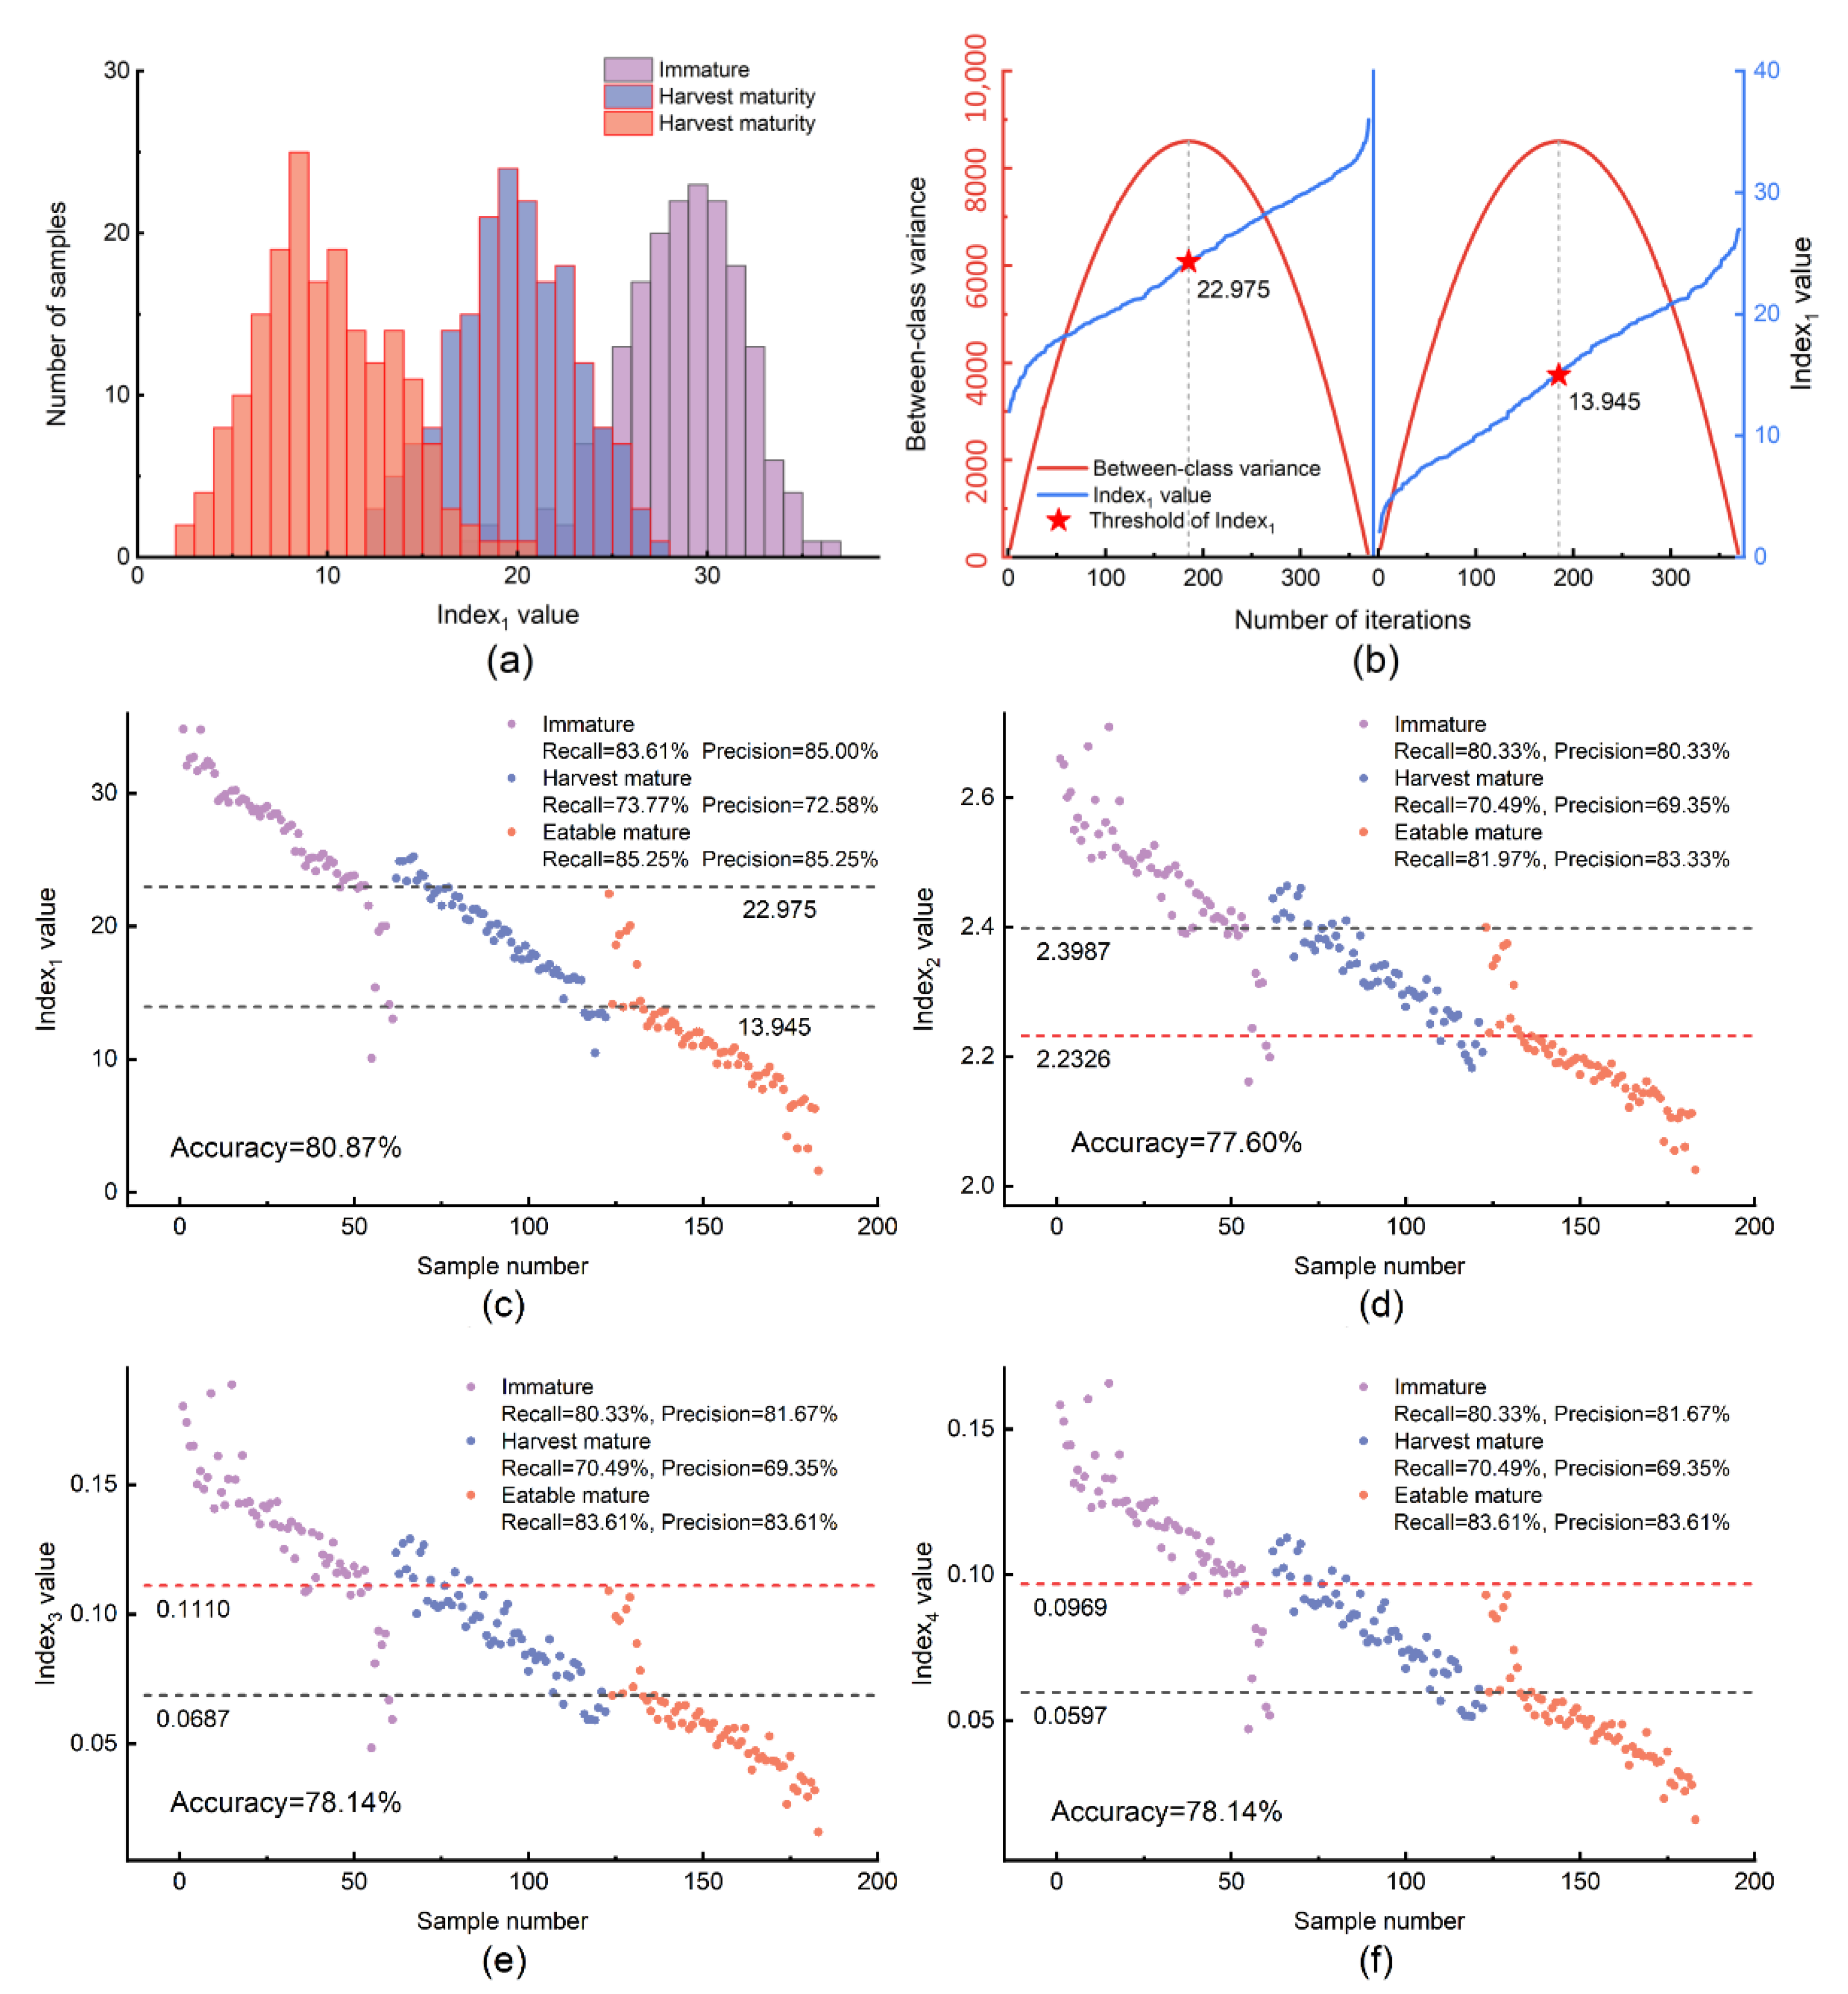
3.5.1. Spectral Index

The spectral indices can reflect the shape features of the spectral curves. Specifically, 680 nm is an important wavelength related to chlorophyll content. The peaks (645 nm and 730 nm) of the spectral curve on both sides of the 680 nm were both selected with 680 nm to establish a spectral index to identify the maturity level. The Otsu method was used to determine the threshold in the calibration set, and the prediction set was used to verify the effectiveness of the threshold. The distribution and threshold determination process for Index1 is shown in Figure 5a,b. In the process of determining the threshold, the between-class variance increases gradually in the initial iterative stage and then decreases gradually. When the between-class variance was at its maximum, the optimal threshold could be determined. Table 3 shows the threshold of four spectral indices.
After determining the optimal threshold, the reliability of the threshold was verified on the prediction set. The distribution of the spectral index of the prediction set is shown in Figure 5d–f, where the dotted line represents the threshold. The prediction accuracy of the spectral indices was 77.60–80.87%. Index1 has the best prediction performance, with an accuracy of 80.87%. According to the results, the maturity level of apples can be easily identified by the spectral index combined with a threshold. However, because the selected wavelength (645 nm, 680 nm, and 730 nm) was mainly related to the absorption peak of chlorophyll, the spectral index contains less internal quality information of apples, and the prediction accuracy was low, so it should not be directly applied.

3.5.2. Preprocessing Based on Spectral Shape Features

Table 4 shows the prediction results based on different spectral shape features. Similarly, the prediction results of the LSSVM model were better than that of the LDA model. Compared with preprocessing methods such as MSC, better prediction results were obtained using spectral shape features, and the prediction results of SR and NSID were better than the raw spectra, in which SR-LSSVM has the highest prediction accuracy, and the accuracy of the calibration set and prediction set was 89.73% and 87.43%, respectively. The prediction result of the combination of the three features was higher than that of every single feature. The prediction performance of the LDA model was significantly improved, with a prediction accuracy of 87.98%. The LSSVM model still achieved the best prediction accuracy of 88.52%. The results show that both the single features and their combination can improve the model performance.
The prediction result of the calibration model based on spectral shape features combined with LSSVM is shown in Table 5. The recall, precision, and F-Score were 86.89–90.16%, 84.38–92.98%, and 86.89–89.83%, respectively. The results show that the developed classifier can accurately predict the maturity level of apples. Compared with the prediction results of the model established directly using the raw spectra, the precision of the harvest mature increased from 77.14% to 84.38%. The reliability of the prediction results of harvest mature was greatly increased, indicating that the spectral shape features can be used to obtain more effective spectral information and improve the prediction performance of the model.

3.6. Validation of the Device

After implementing the optimal LSSVM model into the device, the detection performance of the model was evaluated using the samples obtained in 2020. The validation result is shown in Figure 6. The validation accuracy was 84.72%. The recall, precision, and F-Score were 84.43–85.44%, 82.01–87.29%, and 83.21–85.83%, respectively. All the evaluation indicators were higher than 82%, indicating that the developed model can predict the maturity level of apples at relatively high precision. Further analysis of the validation results using the ROC curve shows that the area under curve (AUC) values of different maturity were all higher than 0.8972, indicating that the developed model still has good prediction performance under the effect of seasonal variation. The results show that the multispectral sensor combined with the data analysis strategy can be used as a cheap and portable alternative for a spectrometer in the case of apple maturity detection.

3.7. Discussion

In general, the multispectral sensors combined with spectral shape features can well distinguish the maturity levels of apples in this paper. The prediction accuracy of the optimal model, namely the SR + SD + NSID-LSSVM model, in the calibration set was 89.55%, the prediction accuracy of the prediction set was 88.52%, and the prediction accuracy of the external verification set was 84.72%. The quality of apples changed significantly during ripening, resulting in significant differences in spectral reflectance among apples with different maturity levels, which provided a theoretical basis for the prediction of apple ripening in this study.
However, non-destructive detection of apple maturity based on multispectral sensors was not easy. In this study, both traditional methods and spectral shape feature analysis can well distinguish immature and eatable mature samples. This result could be attributed to the fact that the contents of endogenous substances and spectral information of these two maturity levels of apples are of huge differences. However, through the analysis of the samples misclassified by the model, it is found that some of the samples are easily misclassified. The maturity of these samples is usually between two maturity levels, and there is little difference in quality and spectrum. A similar phenomenon was also observed by a previous study [10]. In fact, in the subsequent growth of these samples, the maturity will gradually change to the next level, especially for immature samples. Therefore, in order to solve this problem in the actual production, the mature time is still an important reference. Another reason for misclassification is that maturity is an overall attribute of apples, and the interaction model can only collect local information, so there will be misclassification of immaturity and edible maturity. For this kind of sample, the detection method needs to be improved, and the transmission spectrum is a reliable way to detect the internal properties of fruits [42]. In future research, transmission spectra can be collected for maturity detection to improve detection accuracy.
Multispectral sensors combined with spectral shape features have unique advantages. Because the absorption peaks of substances in VIS/NIR spectra are wide and overlapping, the spectral variables are collinear [43]. The reduction of spectral resolution can eliminate the collinear problem. The decrease in spectral resolution will lose part of the spectral information, which directly leads to the decline of the performance of multispectral sensors [19]. The spectral shape feature can be used to calculate the shape information contained in the spectral curve, which improves the detection accuracy of the multispectral sensor. In addition, the unique advantage of spectral shape features to eliminate the adverse effects of physical and biological variability on spectral information may also be the reason for the higher prediction accuracy [21,44].
In summary, a multispectral sensor combined with data analysis techniques can be used in the detection of fruit maturity and internal diseases instead of a spectrometer. However, the quantitative detection of fruit quality, such as SSC and firmness, needs more accurate and rich spectral information, so the application of multispectral sensors in fruit quality quantitative detection needs further research.

4. Conclusions

In this study, apple maturity can be detected rapidly and accurately at low cost by combining multispectral sensors with spectral shape features. There are significant differences in spectral information of apples with different maturity at the same wavelength due to significant differences in quality. Compared with the common pretreatment methods, spectral shape features were effective for processing multispectral information. The model based on the combination of SD, SR, NSID, and LSSVM had the highest accuracy, with 88.80% of prediction accuracy and 84.72% of validation accuracy. Our results proved that quality changes induce significant spectral changes in apples during ripening and the spectral changes can be detected by low-resolution multispectral sensors. As a tool for rapid and convenient detection of apple maturity, low-cost multispectral sensors could serve to determine the best harvest date and post-harvest processing strategy. As this study is aimed at ‘Fuji’ apples, the application of the developed model in apples of other cultivars should be further studied in the future and extend to practical fruit production.

Author Contributions

Conceptualization, M.Z., Y.P., H.L., B.Z., Z.Z. and J.Z.; Data curation, M.Z.; Funding acquisition, J.Z.; Methodology, M.Z., M.S., Y.P., H.L., B.Z. and Z.Z.; Supervision, X.R. and J.Z.; Validation, M.Z.; Writing—original draft, M.Z.; Writing—review & editing, M.S., X.R. and J.Z. All authors have read and agreed to the published version of the manuscript.

Funding

This study was financially supported by the National Natural Science Foundation of China (31701664), the Major Special Science and Technology Project of Shaanxi (2020zdzx03-05-01), the Key Research and Development Projects of Shaanxi (2017ZDXM-NY-017), and the Shaanxi Post-doctoral Science Foundation (2017BSHEDZZ141).

Institutional Review Board Statement

Not applicable.

Conflicts of Interest

The authors declare that they have no known competing financial interests or personal relationships that could have appeared to influence the work reported in this paper.

References

  1. Tian, S.; Zhang, M.; Li, B.; Zhang, Z.; Zhao, J.; Zhang, Z.; Zhang, H.; Hu, J. Measurement orientation compensation and comparison of transmission spectroscopy for online detection of moldy apple core. Infrared Phys. Technol. 2020, 111, 103510. [Google Scholar] [CrossRef]
  2. Pathange, L.P.; Mallikarjunan, P.; Marini, R.P.; O’Keefe, S.; Vaughan, D. Non-destructive evaluation of apple maturity using an electronic nose system. J. Food Eng. 2006, 77, 1018–1023. [Google Scholar] [CrossRef] [Green Version]
  3. Van Beers, R.; Aernouts, B.; León Gutiérrez, L.; Erkinbaev, C.; Rutten, K.; Schenk, A.; Nicolaï, B.; Saeys, W. Optimal Illumination-Detection Distance and Detector Size for Predicting Braeburn Apple Maturity from Vis/NIR Laser Reflectance Measurements. Food Bioprocess Technol. 2015, 8, 2123–2136. [Google Scholar] [CrossRef] [Green Version]
  4. Skic, A.; Szymańska-Chargot, M.; Kruk, B.; Chylińska, M.; Pieczywek, P.M.; Kurenda, A.; Zdunek, A.; Rutkowski, K.P. Determination of the Optimum Harvest Window for Apples Using the Non-Destructive Biospeckle Method. Sensors 2016, 16, 661. [Google Scholar] [CrossRef] [Green Version]
  5. Guo, W.; Gu, J.; Liu, D.; Shang, L. Peach variety identification using near-infrared diffuse reflectance spectroscopy. Comput. Electron. Agric. 2016, 123, 297–303. [Google Scholar] [CrossRef]
  6. Zhang, M.; Shen, M.; Li, H.; Zhang, B.; Zhang, Z.; Quan, P.; Ren, X.; Xing, L.; Zhao, J. Modification of the effect of maturity variation on nondestructive detection of apple quality based on the compensation model. Spectrochim. Acta Part A Mol. Biomol. Spectrosc. 2022, 267, 120598. [Google Scholar] [CrossRef]
  7. Sohaib Ali Shah, S.; Zeb, A.; Qureshi, W.S.; Arslan, M.; Ullah Malik, A.; Alasmary, W.; Alanazi, E. Towards fruit maturity estimation using NIR spectroscopy. Infrared Phys. Technol. 2020, 111, 103479. [Google Scholar] [CrossRef]
  8. Peirs, A.; Lammertyn, J.; Ooms, K.; Nicolaï, B.M. Prediction of the optimal picking date of different apple cultivars by means of VIS/NIR-spectroscopy. Postharvest Biol. Technol. 2001, 21, 189–199. [Google Scholar] [CrossRef]
  9. Peirs, A.; Tirry, J.; Verlinden, B.; Darius, P.; Nicolaï, B.M. Effect of biological variability on the robustness of NIR models for soluble solids content of apples. Postharvest Biol. Technol. 2003, 28, 269–280. [Google Scholar] [CrossRef]
  10. Zhang, M.; Zhang, B.; Li, H.; Shen, M.; Tian, S.; Zhang, H.; Ren, X.; Xing, L.; Zhao, J. Determination of bagged ‘Fuji’ apple maturity by visible and near-infrared spectroscopy combined with a machine learning algorithm. Infrared Phys. Technol. 2020, 111, 103529. [Google Scholar] [CrossRef]
  11. Pourdarbani, R.; Sabzi, S.; Kalantari, D.; Karimzadeh, R.; Ilbeygi, E.; Arribas, J.I. Automatic non-destructive video estimation of maturation levels in Fuji apple (Malus Malus pumila) fruit in orchard based on colour (Vis) and spectral (NIR) data. Biosyst. Eng. 2020, 195, 136–151. [Google Scholar] [CrossRef]
  12. Pourdarbani, R.; Sabzi, S.; Kalantari, D.; Paliwal, J.; Benmouna, B.; García-Mateos, G.; Molina-Martínez, J.M. Estimation of different ripening stages of Fuji apples using image processing and spectroscopy based on the majority voting method. Comput. Electron. Agric. 2020, 176, 105643. [Google Scholar] [CrossRef]
  13. Choi, J.-H.; Chen, P.-A.; Lee, B.; Yim, S.-H.; Kim, M.-S.; Bae, Y.-S.; Lim, D.-C.; Seo, H.-J. Portable, non-destructive tester integrating VIS/NIR reflectance spectroscopy for the detection of sugar content in Asian pears. Sci. Hortic. 2017, 220, 147–153. [Google Scholar] [CrossRef]
  14. Fan, S.; Wang, Q.; Tian, X.; Yang, G.; Xia, Y.; Li, J.; Huang, W. Non-destructive evaluation of soluble solids content of apples using a developed portable Vis/NIR device. Biosyst. Eng. 2020, 193, 138–148. [Google Scholar] [CrossRef]
  15. Guo, W.; Li, W.; Yang, B.; Zhu, Z.; Liu, D.; Zhu, X. A novel noninvasive and cost-effective handheld detector on soluble solids content of fruits. J. Food Eng. 2019, 257, 1–9. [Google Scholar] [CrossRef]
  16. Zhao, J.; Quan, P.; Zhang, M.; Tian, S.; Zhang, H.; Ren, X. Design of Apple Quality Integrated Non- destructive Testing Device Based on Multi- band LED Light Source. Trans. Chin. Soc. Agric. Mach. 2019, 50, 326–332. [Google Scholar] [CrossRef]
  17. Abasi, S.; Minaei, S.; Jamshidi, B.; Fathi, D. Development of an Optical Smart Portable Instrument for Fruit Quality Detection. IEEE Trans. Instrum. Meas. 2021, 70, 7000109. [Google Scholar] [CrossRef]
  18. Li, L.; Peng, Y.; Li, Y.; Yang, C.; Chao, K. Rapid and low-cost detection of moldy apple core based on an optical sensor system. Postharvest Biol. Technol. 2020, 168, 111276. [Google Scholar] [CrossRef]
  19. Yang, B.; Zhu, Z.; Gao, M.; Yan, X.; Zhu, X.; Guo, W. A portable detector on main compositions of raw and homogenized milk. Comput. Electron. Agric. 2020, 177, 105668. [Google Scholar] [CrossRef]
  20. Ma, J.; Sun, D.-W.; Pu, H. Spectral absorption index in hyperspectral image analysis for predicting moisture contents in pork longissimus dorsi muscles. Food Chem. 2016, 197, 848–854. [Google Scholar] [CrossRef]
  21. Li, L.; Peng, Y.; Yang, C.; Li, Y. Optical sensing system for detection of the internal and external quality attributes of apples. Postharvest Biol. Technol. 2020, 162, 111101. [Google Scholar] [CrossRef]
  22. Han, D.; Tu, R.; Lu, C.; Liu, X.; Wen, Z. Nondestructive detection of brown core in the Chinese pear ‘Yali’ by transmission visible–NIR spectroscopy. Food Control 2006, 17, 604–608. [Google Scholar] [CrossRef]
  23. Moscetti, R.; Haff, R.P.; Aernouts, B.; Saeys, W.; Monarca, D.; Cecchini, M.; Massantini, R. Feasibility of Vis/NIR spectroscopy for detection of flaws in hazelnut kernels. J. Food Eng. 2013, 118, 1–7. [Google Scholar] [CrossRef]
  24. Lleó, L.; Roger, J.M.; Herrero-Langreo, A.; Diezma-Iglesias, B.; Barreiro, P. Comparison of multispectral indexes extracted from hyperspectral images for the assessment of fruit ripening. J. Food Eng. 2011, 104, 612–620. [Google Scholar] [CrossRef] [Green Version]
  25. Li, H.; Zhang, M.; Shen, M.; Zhang, Z.; Zhang, B.; Zhang, H.; Hu, J.; Ren, X.; Xing, L.; Zhao, J. Effect of ambient temperature on the model stability of handheld devices for predicting the apple soluble solids content. Eur. J. Agron. 2022, 133, 126430. [Google Scholar] [CrossRef]
  26. Walsh, K.B.; Guthrie, J.A.; Burney, J.W. Application of commercially available, low-cost, miniaturised NIR spectrometers to the assessment of the sugar content of intact fruit. Funct. Plant Biol. 2000, 27, 1175–1186. [Google Scholar] [CrossRef] [Green Version]
  27. Zhang, L.; Xu, H.; Gu, M. Use of signal to noise ratio and area change rate of spectra to evaluate the Visible/NIR spectral system for fruit internal quality detection. J. Food Eng. 2014, 139, 19–23. [Google Scholar] [CrossRef]
  28. Blanpied, G.; Silsby, K.J. Predicting Harvest Date Windows for Apples; Cornell Cooperative Extension: Ithaca, NY, USA, 1992. [Google Scholar]
  29. Gálvez-López, D.; Laurens, F.; Devaux, M.F.; Lahaye, M. Texture analysis in an apple progeny through instrumental, sensory and histological phenotyping. Euphytica 2012, 185, 171–183. [Google Scholar] [CrossRef] [Green Version]
  30. Zhao, J.; Quan, P.; Liu, H.; Li, L.; Qi, S.; Zhang, M.; Zhang, B.; Li, H.; Zhao, Y.; Ma, B.; et al. Transcriptomic and Metabolic Analyses Provide New Insights into the Apple Fruit Quality Decline during Long-Term Cold Storage. J. Agric. Food Chem. 2020, 68, 4699–4716. [Google Scholar] [CrossRef]
  31. Jie, D.; Zhou, W.; Wei, X. Nondestructive detection of maturity of watermelon by spectral characteristic using NIR diffuse transmittance technique. Sci. Hortic. 2019, 257, 108718. [Google Scholar] [CrossRef]
  32. Li, B.; Lecourt, J.; Bishop, G. Advances in Non-Destructive Early Assessment of Fruit Ripeness towards Defining Optimal Time of Harvest and Yield Prediction-A Review. Plants 2018, 7, 3. [Google Scholar] [CrossRef] [PubMed] [Green Version]
  33. Nagy, A.; Riczu, P.; Tamas, J. Spectral evaluation of apple fruit ripening and pigment content alteration. Sci. Hortic. 2016, 201, 256–264. [Google Scholar] [CrossRef] [Green Version]
  34. Chauchard, F.; Cogdill, R.; Roussel, S.; Roger, J.M.; Bellon-Maurel, V. Application of LS-SVM to non-linear phenomena in NIR spectroscopy: Development of a robust and portable sensor for acidity prediction in grapes. Chemom. Intell. Lab. Syst. 2004, 71, 141–150. [Google Scholar] [CrossRef] [Green Version]
  35. Li, X.; Wei, Y.; Xu, J.; Feng, X.; Wu, F.; Zhou, R.; Jin, J.; Xu, K.; Yu, X.; He, Y. SSC and pH for sweet assessment and maturity classification of harvested cherry fruit based on NIR hyperspectral imaging technology. Postharvest Biol. Technol. 2018, 143, 112–118. [Google Scholar] [CrossRef]
  36. Ye, J. Least squares linear discriminant analysis. In Proceedings of the 24th international Conference on Machine Learning, Corvalis, OR, USA, 20–24 June 2007; pp. 1087–1093. [Google Scholar]
  37. Otsu, N. A Threshold Selection Method from Gray-Level Histograms. IEEE Trans. Syst. Man Cybern. 1979, 9, 62–66. [Google Scholar] [CrossRef] [Green Version]
  38. Xia, Y.; Huang, W.; Fan, S.; Li, J.; Chen, L. Effect of spectral measurement orientation on online prediction of soluble solids content of apple using Vis/NIR diffuse reflectance. Infrared Phys. Technol. 2019, 97, 467–477. [Google Scholar] [CrossRef]
  39. Merzlyak, M.N.; Solovchenko, A.E.; Gitelson, A.A. Reflectance spectral features and non-destructive estimation of chlorophyll, carotenoid and anthocyanin content in apple fruit. Postharvest Biol. Technol. 2003, 27, 197–211. [Google Scholar] [CrossRef]
  40. Wang, H.; Arakawa, O.; Motomura, Y. Influence of maturity and bagging on the relationship between anthocyanin accumulation and phenylalanine ammonia-lyase (PAL) activity in ‘Jonathan’ apples. Postharvest Biol. Technol. 2000, 19, 123–128. [Google Scholar] [CrossRef]
  41. Zhao, Y.; Zhang, C.; Zhu, S.; Li, Y.; He, Y.; Liu, F. Shape induced reflectance correction for non-destructive determination and visualization of soluble solids content in winter jujubes using hyperspectral imaging in two different spectral ranges. Postharvest Biol. Technol. 2020, 161, 111080. [Google Scholar] [CrossRef]
  42. Tian, S.; Wang, S.; Xu, H. Early detection of freezing damage in oranges by online Vis/NIR transmission coupled with diameter correction method and deep 1D-CNN. Comput. Electron. Agric. 2022, 193, 106638. [Google Scholar] [CrossRef]
  43. Saeys, W.; Do Trong, N.N.; Van Beers, R.; Nicolai, B.M. Multivariate calibration of spectroscopic sensors for postharvest quality evaluation: A review. Postharvest Biol. Technol. 2019, 158, 110981. [Google Scholar] [CrossRef]
  44. Tian, S.; Xu, H. Nondestructive Methods for the Quality Assessment of Fruits and Vegetables Considering Their Physical and Biological Variability. Food Eng. Rev. 2022, 1–28. [Google Scholar] [CrossRef]
Figure 1. The schematic (a), the prototype (b), and the detection probe (c) of the Vis/NIR device based on the multispectral sensor, the spectral response of the sensor (d) and the light source (e).
Horticulturae 08 00361 g001
Figure 2. The device stability test results. (a) Signal-to-noise ratio (SNR) values at different wavelengths, and (b) area change rate (ACR) values at different times.
Horticulturae 08 00361 g002
Figure 3. ‘Fuji’ apple quality changes at different maturity levels: (a) apple fruit and starch staining image, (b) apple-pulp puncture force-displacement curve, and (ci) the distribution of SSC, acidity, firmness, pericarp firmness, pericarp resilience, flesh resilience, and fruit brittleness, respectively.
Horticulturae 08 00361 g003
Figure 4. Spectra of apples with different maturity levels: (a) spectral curve, (b) spectral intensity distribution at different wavelengths. Mean values in the same wavelength with different letters (a, b, c) are significantly different (p ≤ 0.05).
Horticulturae 08 00361 g004
Figure 5. The prediction results based on the spectral index: (a) the distribution of Index1 in the calibration set, (b) the process of determining the threshold of Index1, and the distribution of (c) Index1, (d) Index2, (e) Index3, and (f) Index4 in the prediction set.
Horticulturae 08 00361 g005
Figure 6. Validation results of the device: (a) confusion matrix, (b) ROC curve.
Horticulturae 08 00361 g006
Table 1. Prediction results of the model based on different pretreatment methods.
ModelPretreatmentCalibration SetPrediction Set
SampleCorrectAccuracy/%SampleCorrectAccuracy/%
LSSVMRAW55548587.3918315584.70
SGS55547084.6818314277.60
MSC55549489.0118315081.97
SNV55549288.6518314780.33
LDARAW55548387.0318315182.51
SGS55544680.3618313171.58
MSC55546683.9618314478.69
SNV55547485.4118314679.78
Table 2. Confusion matrix, recall, precision, and F-score based on the Raw-LSSVM model.
ModelMaturity Category123No.Recall/%Precision/%F-Score/%Accuracy/%
Raw-LSSVM151736183.6187.9385.7184.70%
255426188.5277.1482.44
329506181.9090.9186.21
Table 3. The threshold of spectral indices.
ThresholdSpectral Index
Index1Index2Index3Index4
Threshold-122.9752.39870.11100.0969
Threshold-213.9452.23260.06870.0567
Table 4. Prediction results of the model based on different spectral shape features.
ModelPretreatmentCalibration SetPrediction Set
SampleCorrectAccuracy/%SampleCorrectAccuracy/%
LSSVMSR55549889.7318316087.43
SD55547485.4118315484.15
NSID55549288.6518315785.79
SR + SD + NSID55549789.5518316288.52
LDASR55549489.0118315484.15
SD55548787.7518315383.61
NSID55548787.7518315283.06
SR + SD + NSID55550691.1718316187.98
Table 5. Confusion matrix, recall, precision, and F-score based on the SR + SD + NSID-LSSVM model.
ModelMaturity Category123No.Recall/%Precision/%F-Score/%Accuracy/%
SR + SD + NSID-LSSVM155516190.1688.7189.4388.52%
245436188.5284.3886.89
335536186.8992.9889.83
Publisher’s Note: MDPI stays neutral with regard to jurisdictional claims in published maps and institutional affiliations.

