Article

Iodine Biofortification Counters Micronutrient Deficiency and Improve Functional Quality of Open Field Grown Curly Endive

by
Leo Sabatino
1,*,†,
Francesca Di Gaudio
2,†,
Beppe Benedetto Consentino
1,
Youssef Rouphael
3,
Christophe El-Nakhel
3,
Salvatore La Bella
1,*,
Sonya Vasto
4,
Rosario Paolo Mauro
5,
Fabio D’Anna
1,
Giovanni Iapichino
1,
Rosalia Caldarella
6 and
Claudio De Pasquale
1
1
Dipartimento Scienze Agrarie, Alimentari e Forestali (SAAF), University of Palermo, viale delle Scienze, ed. 5, 90128 Palermo, Italy
2
Department of Promoting Health, Maternal-Infant, Excellence and Internal and Specialized Medicine (ProMISE) G. D’Alessandro, University of Palermo, 90127 Palermo, Italy
3
Department of Agricultural Sciences, University of Naples Federico II, 80055 Portici, Italy
4
Department of Biological, Chemical and Pharmaceutical Sciences and Technologies, University of Palermo, 90128 Palermo, Italy
5
Dipartimento di Agricoltura, Alimentazione e Ambiente (Di3A), University of Catania, Via Valdisavoia, 5, 95123 Catania, Italy
6
Department of Laboratory Medicine, “P. Giaccone” University Hospital, 90128 Palermo, Italy
*
Authors to whom correspondence should be addressed.
These authors are equally contributed.
Horticulturae 2021, 7(3), 58; https://doi.org/10.3390/horticulturae7030058
Submission received: 19 February 2021 / Revised: 17 March 2021 / Accepted: 19 March 2021 / Published: 21 March 2021

Abstract

:
Human iodine (I) shortage disorders are documented as an imperative world-wide health issue for a great number of people. The World Health Organization (WHO) recommends I consumption through ingestion of seafood and biofortified food such as vegetables. The current work was carried out to appraise the effects of different I concentrations (0, 50, 250, and 500 mg L−1), supplied via foliar spray on curly endive grown in the fall or spring–summer season. Head fresh weight, stem diameter, head height, and soluble solid content (SSC) were negatively correlated to I dosage. The highest head dry matter content was recorded in plants supplied with 250 mg I L−1, both in the fall and spring–summer season, and in those cultivated in the fall season and supplied with 50 mg I L−1. The highest ascorbic acid concentration was recorded in plants cultivated in the spring–summer season and biofortified with the highest I dosage. The highest fructose and glucose concentrations in leaf tissues were obtained in plants cultivated in the spring–summer season and treated with 250 mg I L−1. Plants sprayed with 250 mg I L−1 and cultivated in the fall season had the highest I leaf concentration. Overall, our results evidently suggested that an I application of 250 mg L−1 in both growing seasons effectively enhanced plant quality and functional parameters in curly endive plants.

1. Introduction

Iodine (I) is a crucial trace element for the biosynthesis of thyroid hormones in humans [1]. Iodine deficiency illnesses are caused by unsatisfactory dietary iodine consumption [2] and associated with inadequate thyroid hormone synthesis, which, in turn, produces deleterious effects on the human organism, such as goiters, reproductive failure, hearing loss, growth impairment, cretinism, and numerous kinds of brain injury [3,4,5,6].
The World Health Organization (WHO) [7] highlights that approximately 45% of European inhabitants are distressed by I deficiency. As declared by the European Food Safety Authority [8], the recommended daily allowance (RDA) for I is estimated as follows: 90–120 μg for children, 150 μg for adults, and 290 μg for pregnant or breastfeeding women. However, according to the WHO [7], human I content, determined via urinary I concentration in spot urine samples, is considered insufficient at less than 100 μg L1, moderately deficient at 20–49 μg L1, and severely deficient at less than 20 μg L1.
Although Zimmermann [9] and Gonzali et al. [10] suggest that the primary approach to overcome low I assumption is the conventional iodination of table salt, Mottiar and Altosaar [11] point out that salt iodination alone is unsatisfactory to cover the entire human necessity of I. In addition, inorganic I is volatile, and therefore, its loss is difficult to control during storage, transport, and during cooking, particularly in the presence of high-temperature oils [12]. Moreover, the use of table salt is not recommended for people affected by cardiovascular disorders [13]. The WHO [7] suggests I intake via consumption of seafood and biofortified food such as fruiting and leafy green vegetables.
From an environmental and economic point of view, crop biofortification is recognized as a feasible strategy to combat human mineral malnourishment [14]. Although I is an imperative trace element for humans and animals [15], it is not essential for plants. As indicated by Tschiersch et al. [16], higher plants can absorb I by the roots or by the shoot and leaves via the stomata and/or the cuticular waxes. Additionally, Lawson et al. [17] reported that I supply through foliar sprays is more effective than soil application to enhance I concentration in butterhead lettuce. It is known that plant response to I enrichment is related to various factors, such as the chemical adopted form, the concentration in the nutrient solution, and the cultivation system [18,19]. A number of research initiatives have been aimed at enriching I concentration in various fruit and leafy vegetable crops, such as lettuce, spinach, Brassica genotypes, and tomato [13,20,21,22,23,24].
Curly endive (Cichorium endivia L. var. crispum Hegi) is widely grown all over the world and appreciated as a constituent of mixed salads. Furthermore, curly endive encloses a considerable level of bioactive constituents, such as ascorbic acid, phenolics, glucosinolates, sesquiterpene lactones, and minerals, especially potassium and calcium [25,26,27]. There is also evidence that the concentration of these compounds is significantly influenced by the growing season [28]. To the best of our knowledge, there is a lack of scientific literature on I biofortification of curly endive. Starting from the aforesaid evidence, the aim of the current study was to evaluate the effects of four levels of I supply on yield, bioactive compounds, sugars, and mineral profile of curly endive cultivated in the spring–summer or fall season.

2. Materials and Methods

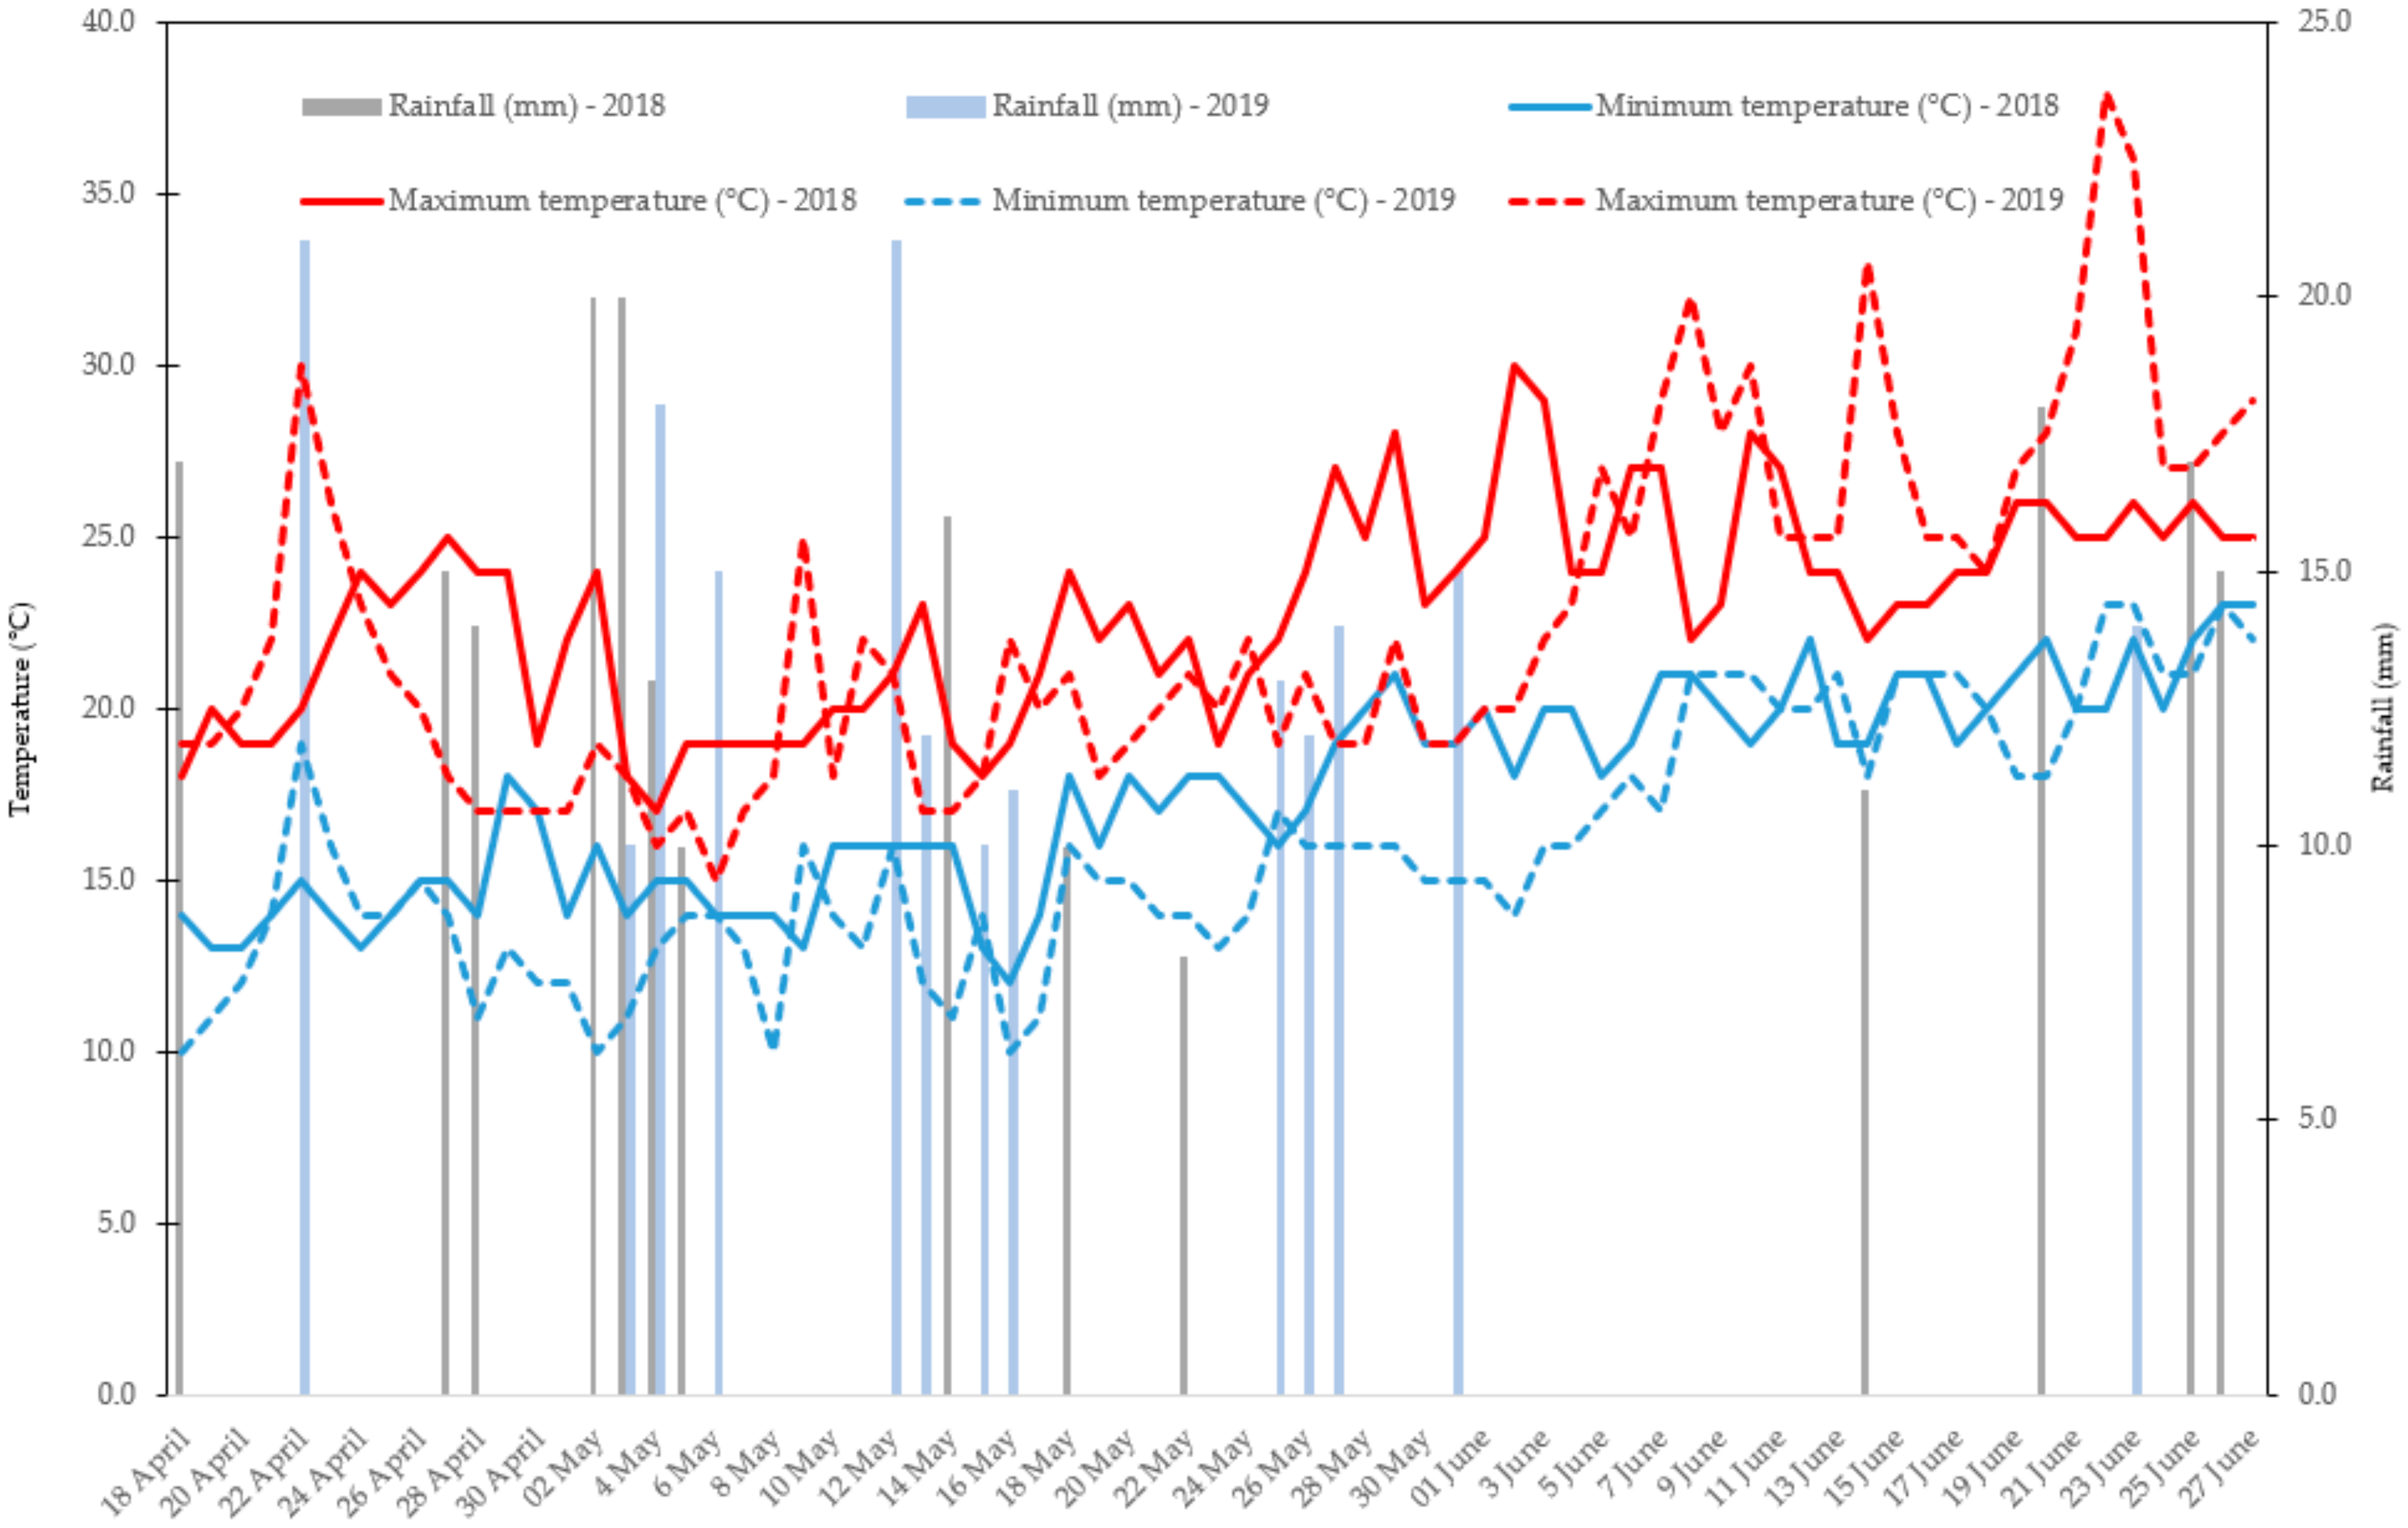
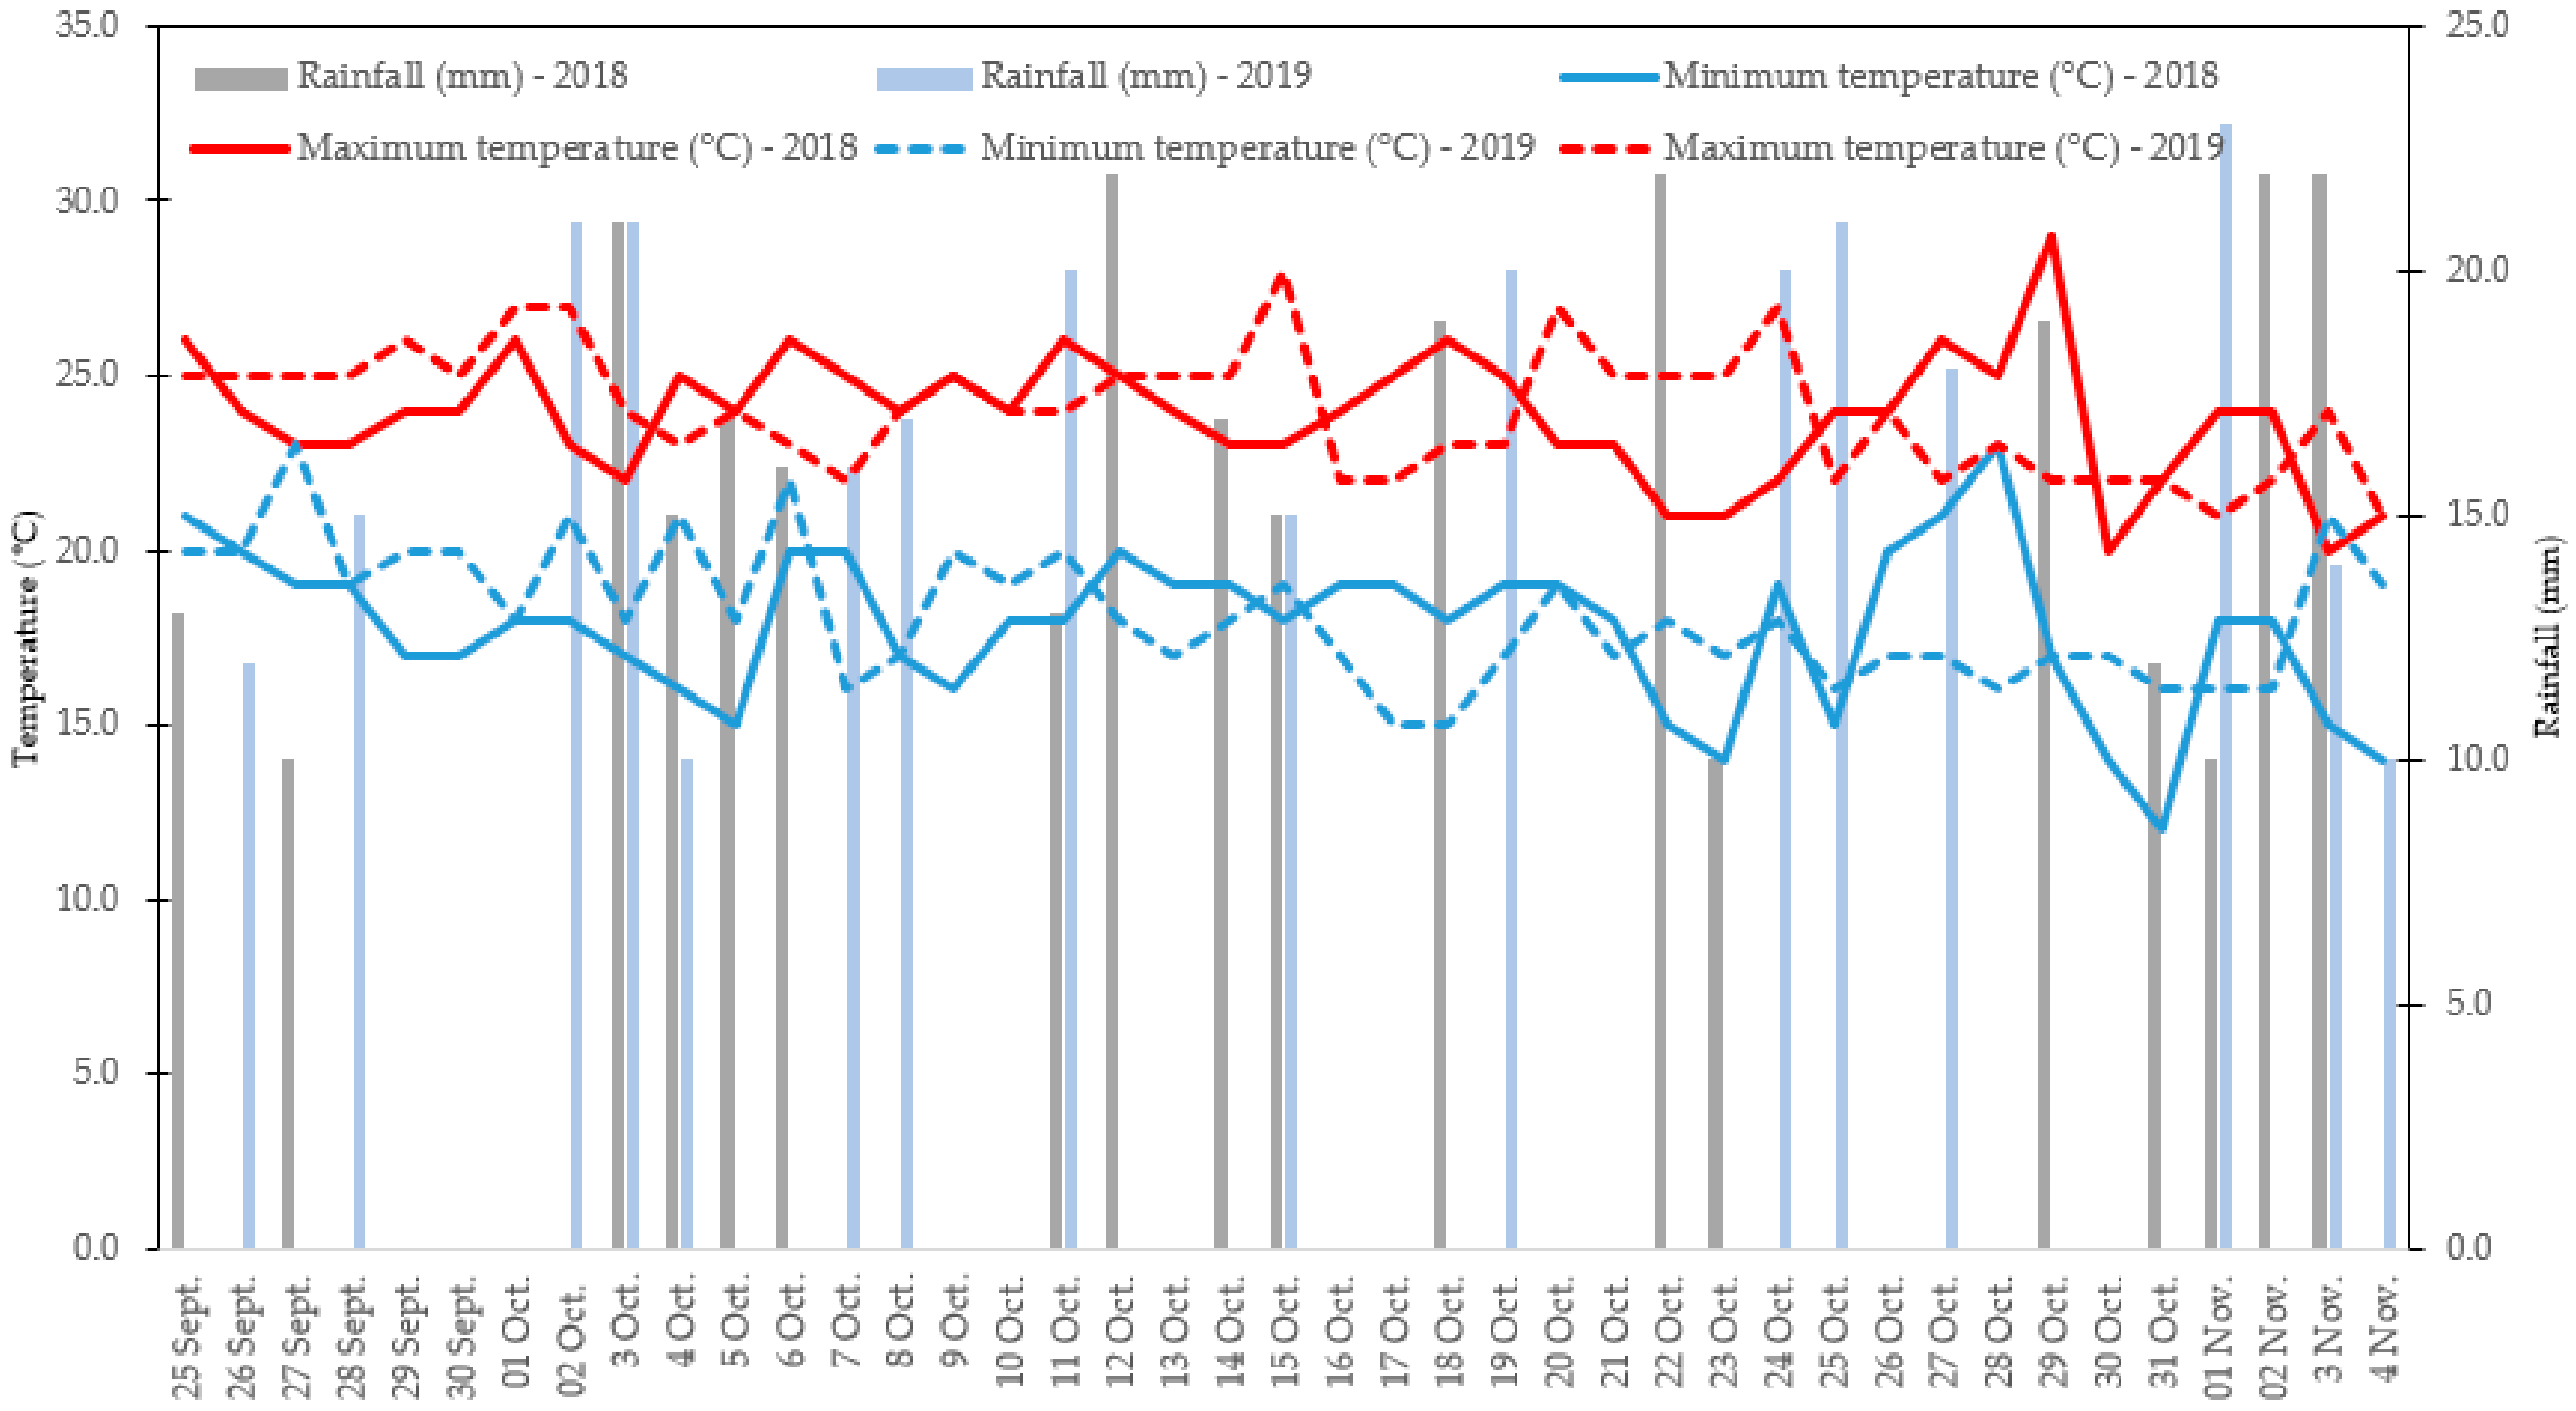
2.1. Trial Setup, Plant Materials, and Crop Management

A two-year trial (2018 and 2019) was carried out in open field conditions in two consecutive growing seasons (spring–summer and fall). The research was performed at Blufi, Palermo Province (longitude 14°04′ E, latitude 37°45′ N, altitude 500 m) Sicily (Italy) in an experimental field of the Department of Agricultural, Food and Forest Sciences (SAAF) of the University of Palermo. Daily temperature (maximum and minimum) and rainfall throughout the plant cultivation cycles were collected (Figure 1 and Figure 2).
On 18 April (2018 and 2019) and 25 September (2018 and 2019), plug plants of curly endive (Cichorium endivia L., var. crispum Hegi) (var. Trusty, HM Clause, France) were grown with 0.33 m between rows and 0.30 m apart within the row, rendering 10 plants m2. Experimental soil was essentially sandy clay loam, characterized by a total nitrogen of 1.5% and organic matter of 3.0%.
Iodine-enrichment was made by supplying I in form of potassium iodate (KIO3, Sigma-Aldrich ACS reagent, purity 99.5%). Four concentrations of I (0, 50, 250, and 500 mg L1) were provided through foliar spray. The foliar applications were carried out every 14 days, beginning on 2 May and 9 October (2018 and 2019) and finishing on 13 June and 20 October (2018 and 2019) for the spring–summer and fall seasons, respectively. In sum, for each growing cycle, four foliar applications were performed. For each foliar spray application, 1.5 L m2 of solution was distributed. Curly endive plants belonging to the plots maintained at 0 mg L1 of I (control) received 1.5 L m2 of water foliar spray. Fertilization was managed via drip irrigation during the cultivation cycle and comprised 100 kg nitrogen ha1, 60 kg phosphorous pentoxide ha1, and 180 kg potassium oxide ha1 [29].

2.2. Yield and Biometric Parameters

Endive plants were harvested 70 days after plug transplant. All plants were taken into consideration for yield assessment and biometric traits determination. Biometric traits, consisting of head fresh weight, head height, stem diameter, and number of leaves, were recorded for all curly endive plants. To appraise dry matter content, five casually designated plants from each replicate were dehydrated in an oven (Memmert, Serie standard, Venice, Italy) set at 105 °C until constant weight.

2.3. Nutraceutical Features

Samples dedicated to nutraceutical quality investigation were collected immediately after harvest. Five casually designated plants from each replicate were taken into consideration for the functional property determinations. Soluble solid content (SSC) was assessed via a refractometer (MTD-045nD, Three-In-161 One Enterprises Co. Ltd., New Taipei City, Taiwan). Prior to SSC determination, curly endive samples were juiced and filtered. Titratable acidity (TA) was evaluated as reported by Han et al. [30]. Briefly, 10 g aliquots of curly endive were mixed in 50 mL of distilled water and titrated with 0.1 N NaOH to an end-point of pH 8.1. TA was expressed as percentage of malic acid. Ascorbic acid content was appraised by reflectometer Merck RQflex* 10 m using Reflectoquant Ascorbic Acid Test Strips, as reported by Sabatino et al. [27]. Concisely, 1 g of leaf juice sample was mixed with distilled water till reaching a final volume of 10 mL. Ascorbic acid was expressed as mg of ascorbic acid kg1 fresh weight. To measure total phenolics, the methodology reported by Rivero et al. [31] was adopted. Briefly, 5 g of leaf sample were used for the extraction procedure using methanol as solvent and evaluated quantitatively by A765. Total phenolics concentration was appraised using Folin–Ciocalteu reagent and the outcomes were shown as mg of caffeic acid g1 fresh weight.

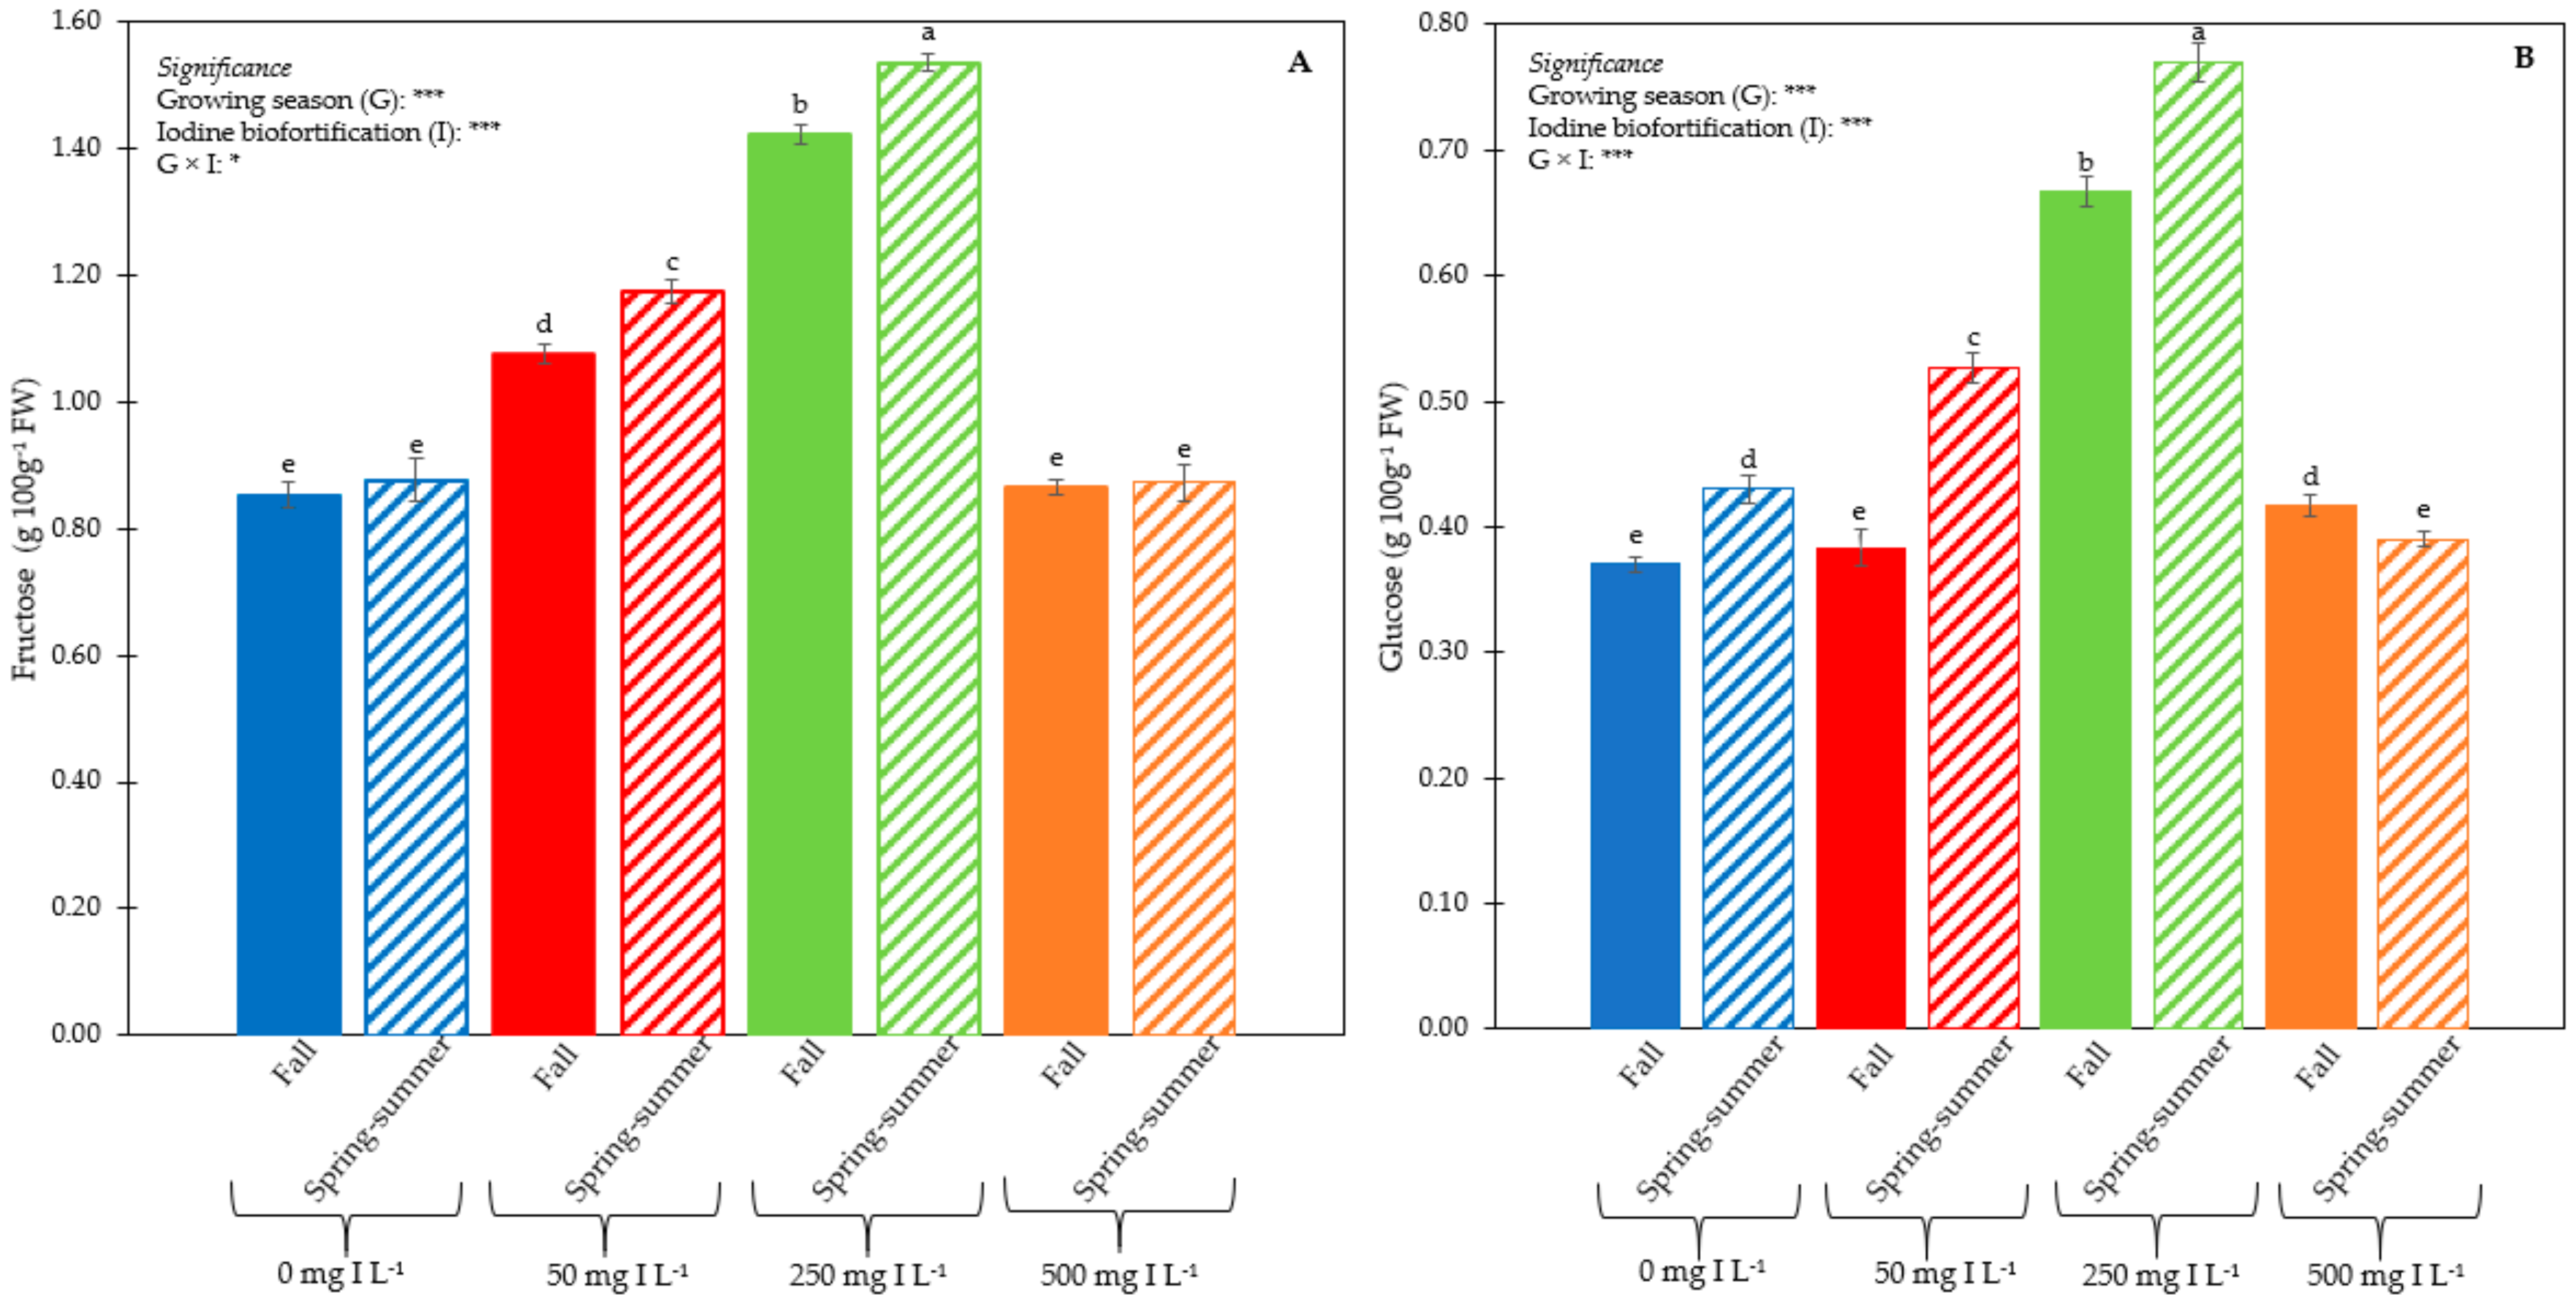
2.4. Sugars Assessment

Five plants from each replicate were considered for sugars investigation. Sugars were appraised as described by Serna et al. [32]. Thus, leaf samples of 3 g were homogenised with 10 mL of deionized water and centrifuged at 15,000× g for 20 min at 4 °C. For sugars quantification, high-performance liquid chromatography (HPLC) was used and 10 μL of the supernatant was employed. Standard curves for pure standards of sugars (glucose, fructose, and sucrose) (Sigma, Poole, UK) were utilized for quantification. Findings were communicated as g 100 g1 of fresh weight.

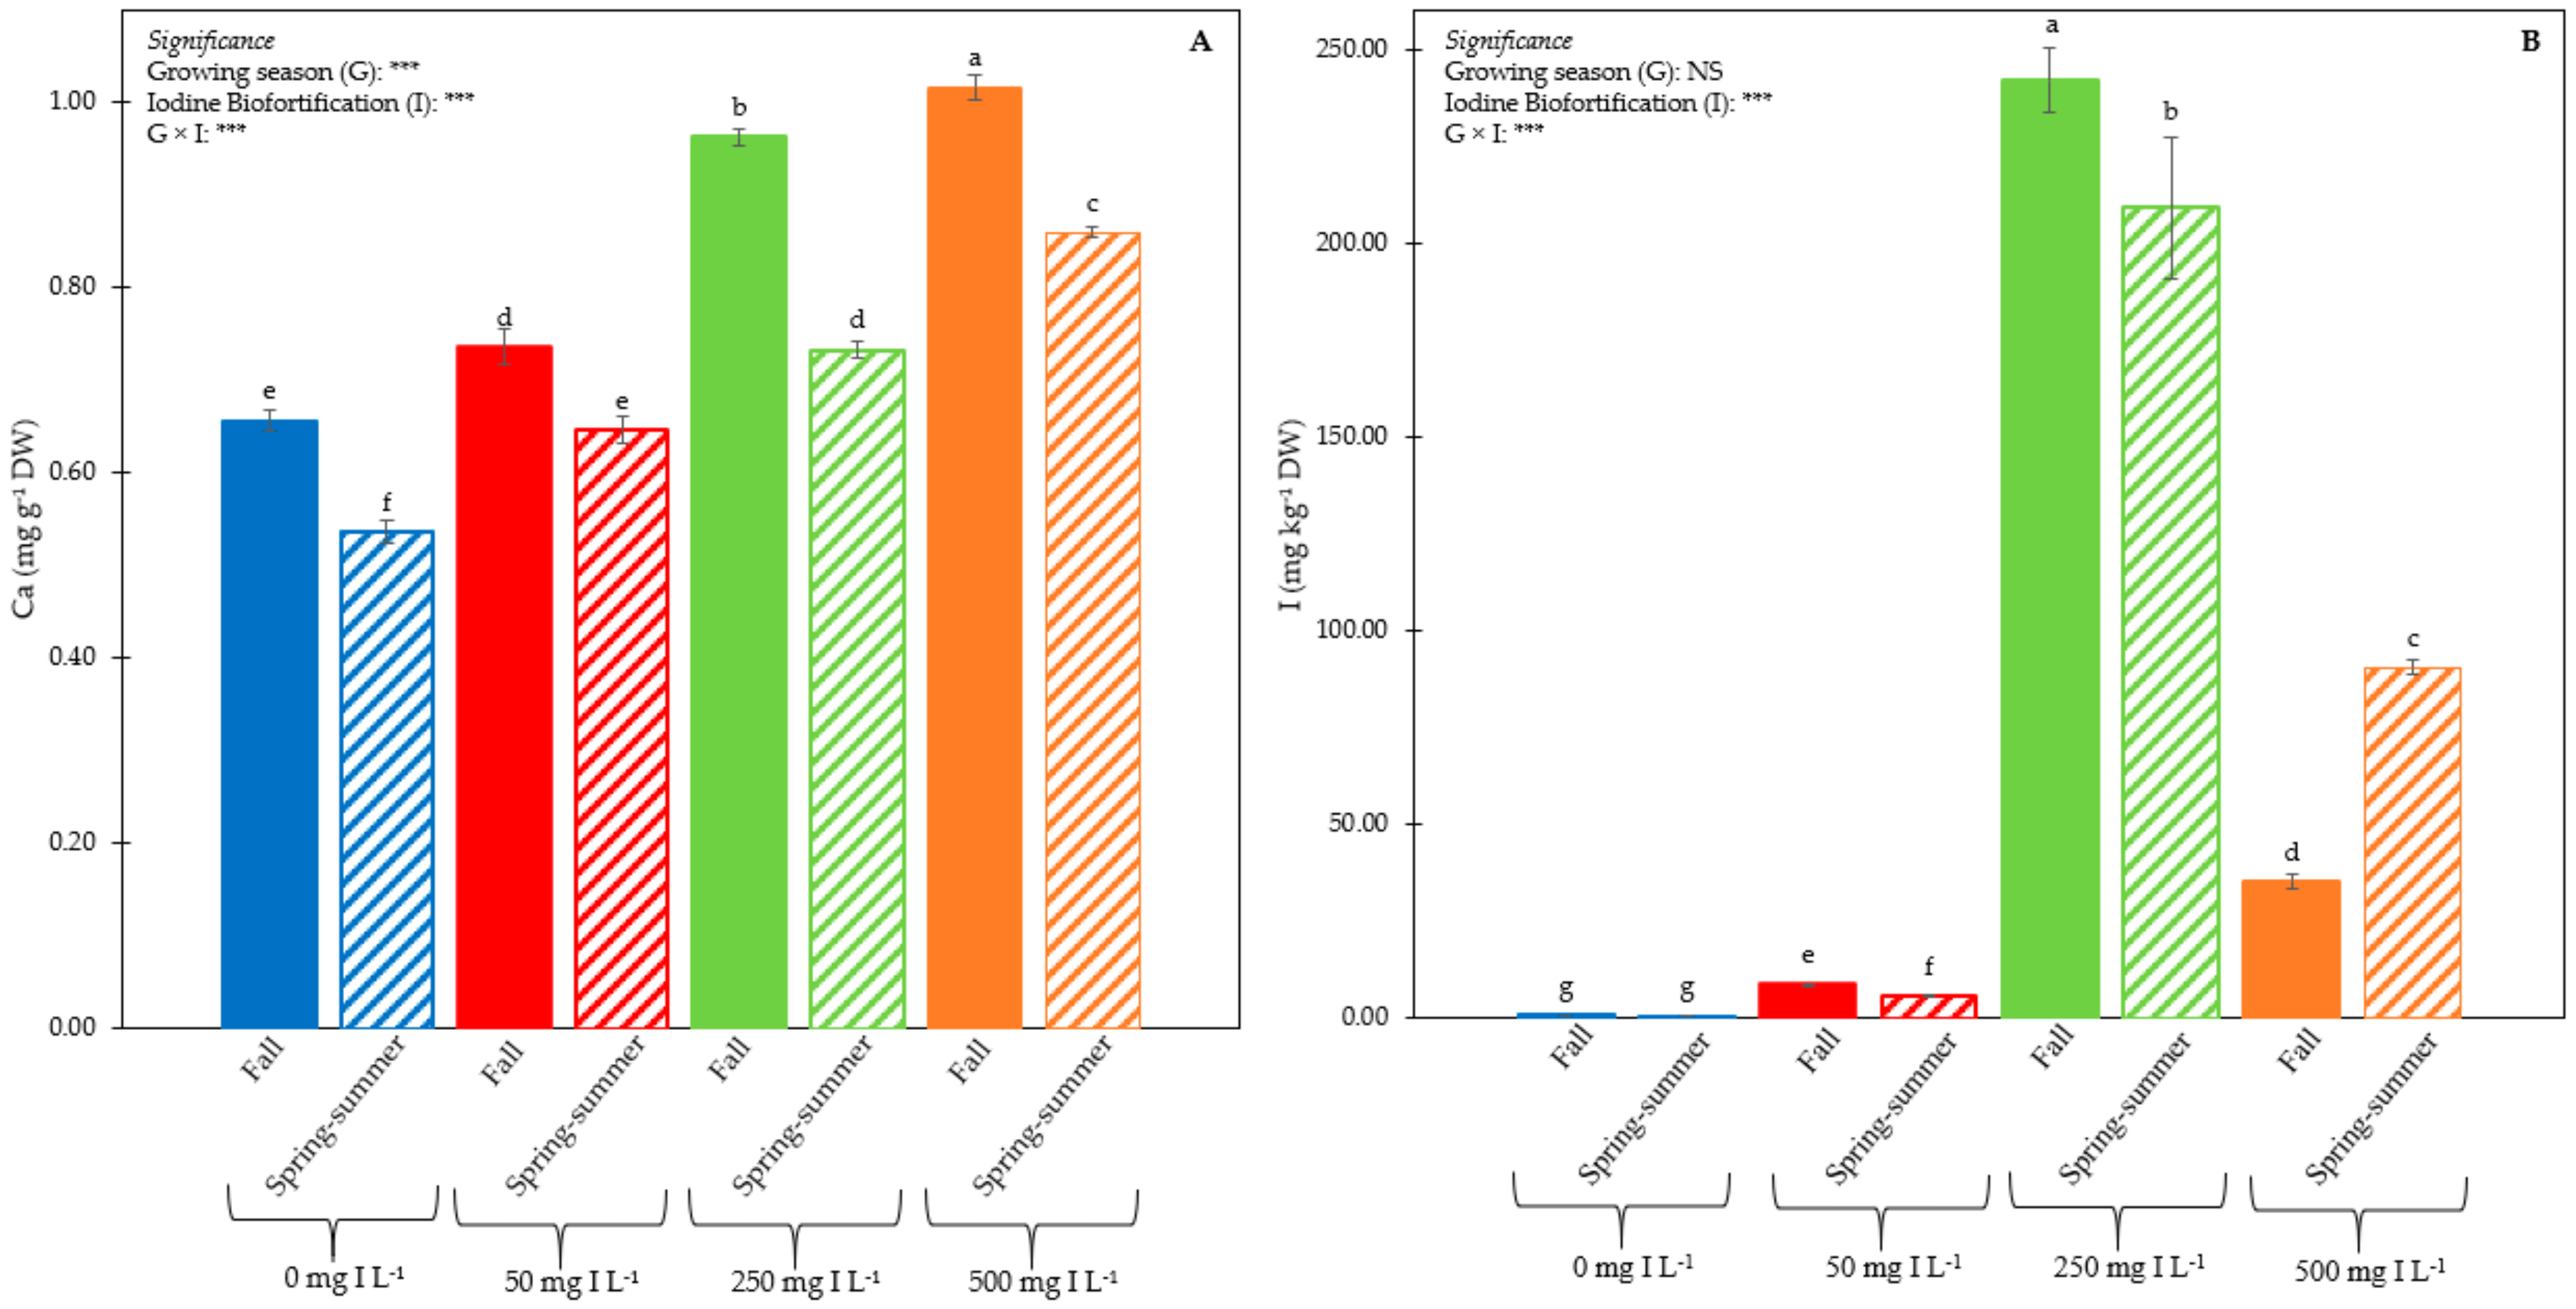
2.5. Mineral Profile

Five plants from each replicate were considered for minerals determination. Leaves Nitrogen (N) concentration was evaluated using the Kjeldahl method. The procedure described by Morand and Gullo [33] was followed for calcium (Ca), magnesium (Mg), and potassium (K) determination. Thus, atomic absorption spectroscopy (SavantAA, 200 ERRECI, Milan, Italy) was used. Phosphorus concentration was appraised using colorimetry, as reported by Fogg and Wilkinson [34].
With regard to I determination, the total I content in leaves tissues was assessed via inductively coupled plasma mass spectrometry (ICP-MS). In line with the official methodology for I evaluation (European Standard BS EN 15111:2007), an alkaline extraction was performed using the tetramethylammonium hydroxide. Afterwards, all the samples were filtered and analyzed via ICP-MS. The I content was expressed as mg kg1 of dry weight.

2.6. Experimental Design and Statistics

Two different growing seasons (fall and spring–summer) were combined with four I enrichment levels (0, 50, 250, and 500 mg L1) in a two factorial experimental design rendering a total of eight treatments, two growing seasons (G) times four I doses. Every treatment constituted of three replicates, each containing 15 plants, for a total of 360 plants. The same experiment was performed in two consecutive years (2018 and 2019) following the same experimental scheme. All data sets were subjected to two-way analysis of variance (ANOVA), setting growing season and I dosage as source of variation. To appraise the influence of the year, a preliminary ANOVA analysis was performed. Percentage data were subjected to the arcsin transformation prior ANOVA analysis (Ø = arcsin(p/100)1/2). Tukey honestly significant difference (HSD) test was applied to separate mean values (p < 0.05). The statistical analyses were accomplished using the SPSS software version 20 (StatSoft, Inc., Chicago, IL, USA). Principal component analysis (PCA) was provided for the agronomical dataset (yield and biometric traits, nutraceutical features, sugars, and mineral profile) to evaluate any underlying relationships among the diverse I dosages and growing seasons of curly endive. Principal components with eigenvalues higher than 1.0 were considered for the individuation of the principal factors numbers (PCs). As a result, the PCs permit the investigation of relationships between the variables of the data set. Thus, the original variables were planned into the space demarcated by the PC1 and PC2, and connected variables were acknowledged. SPSS version 20.0 (StatSoft, Inc., Chicago, IL, USA) was utilized to accomplish PCA analysis.

3. Results

The trial was reiterated a second year using the identical experimental design and attaining analogous outcomes (Table S1). Thus, data from 2018 are shown.

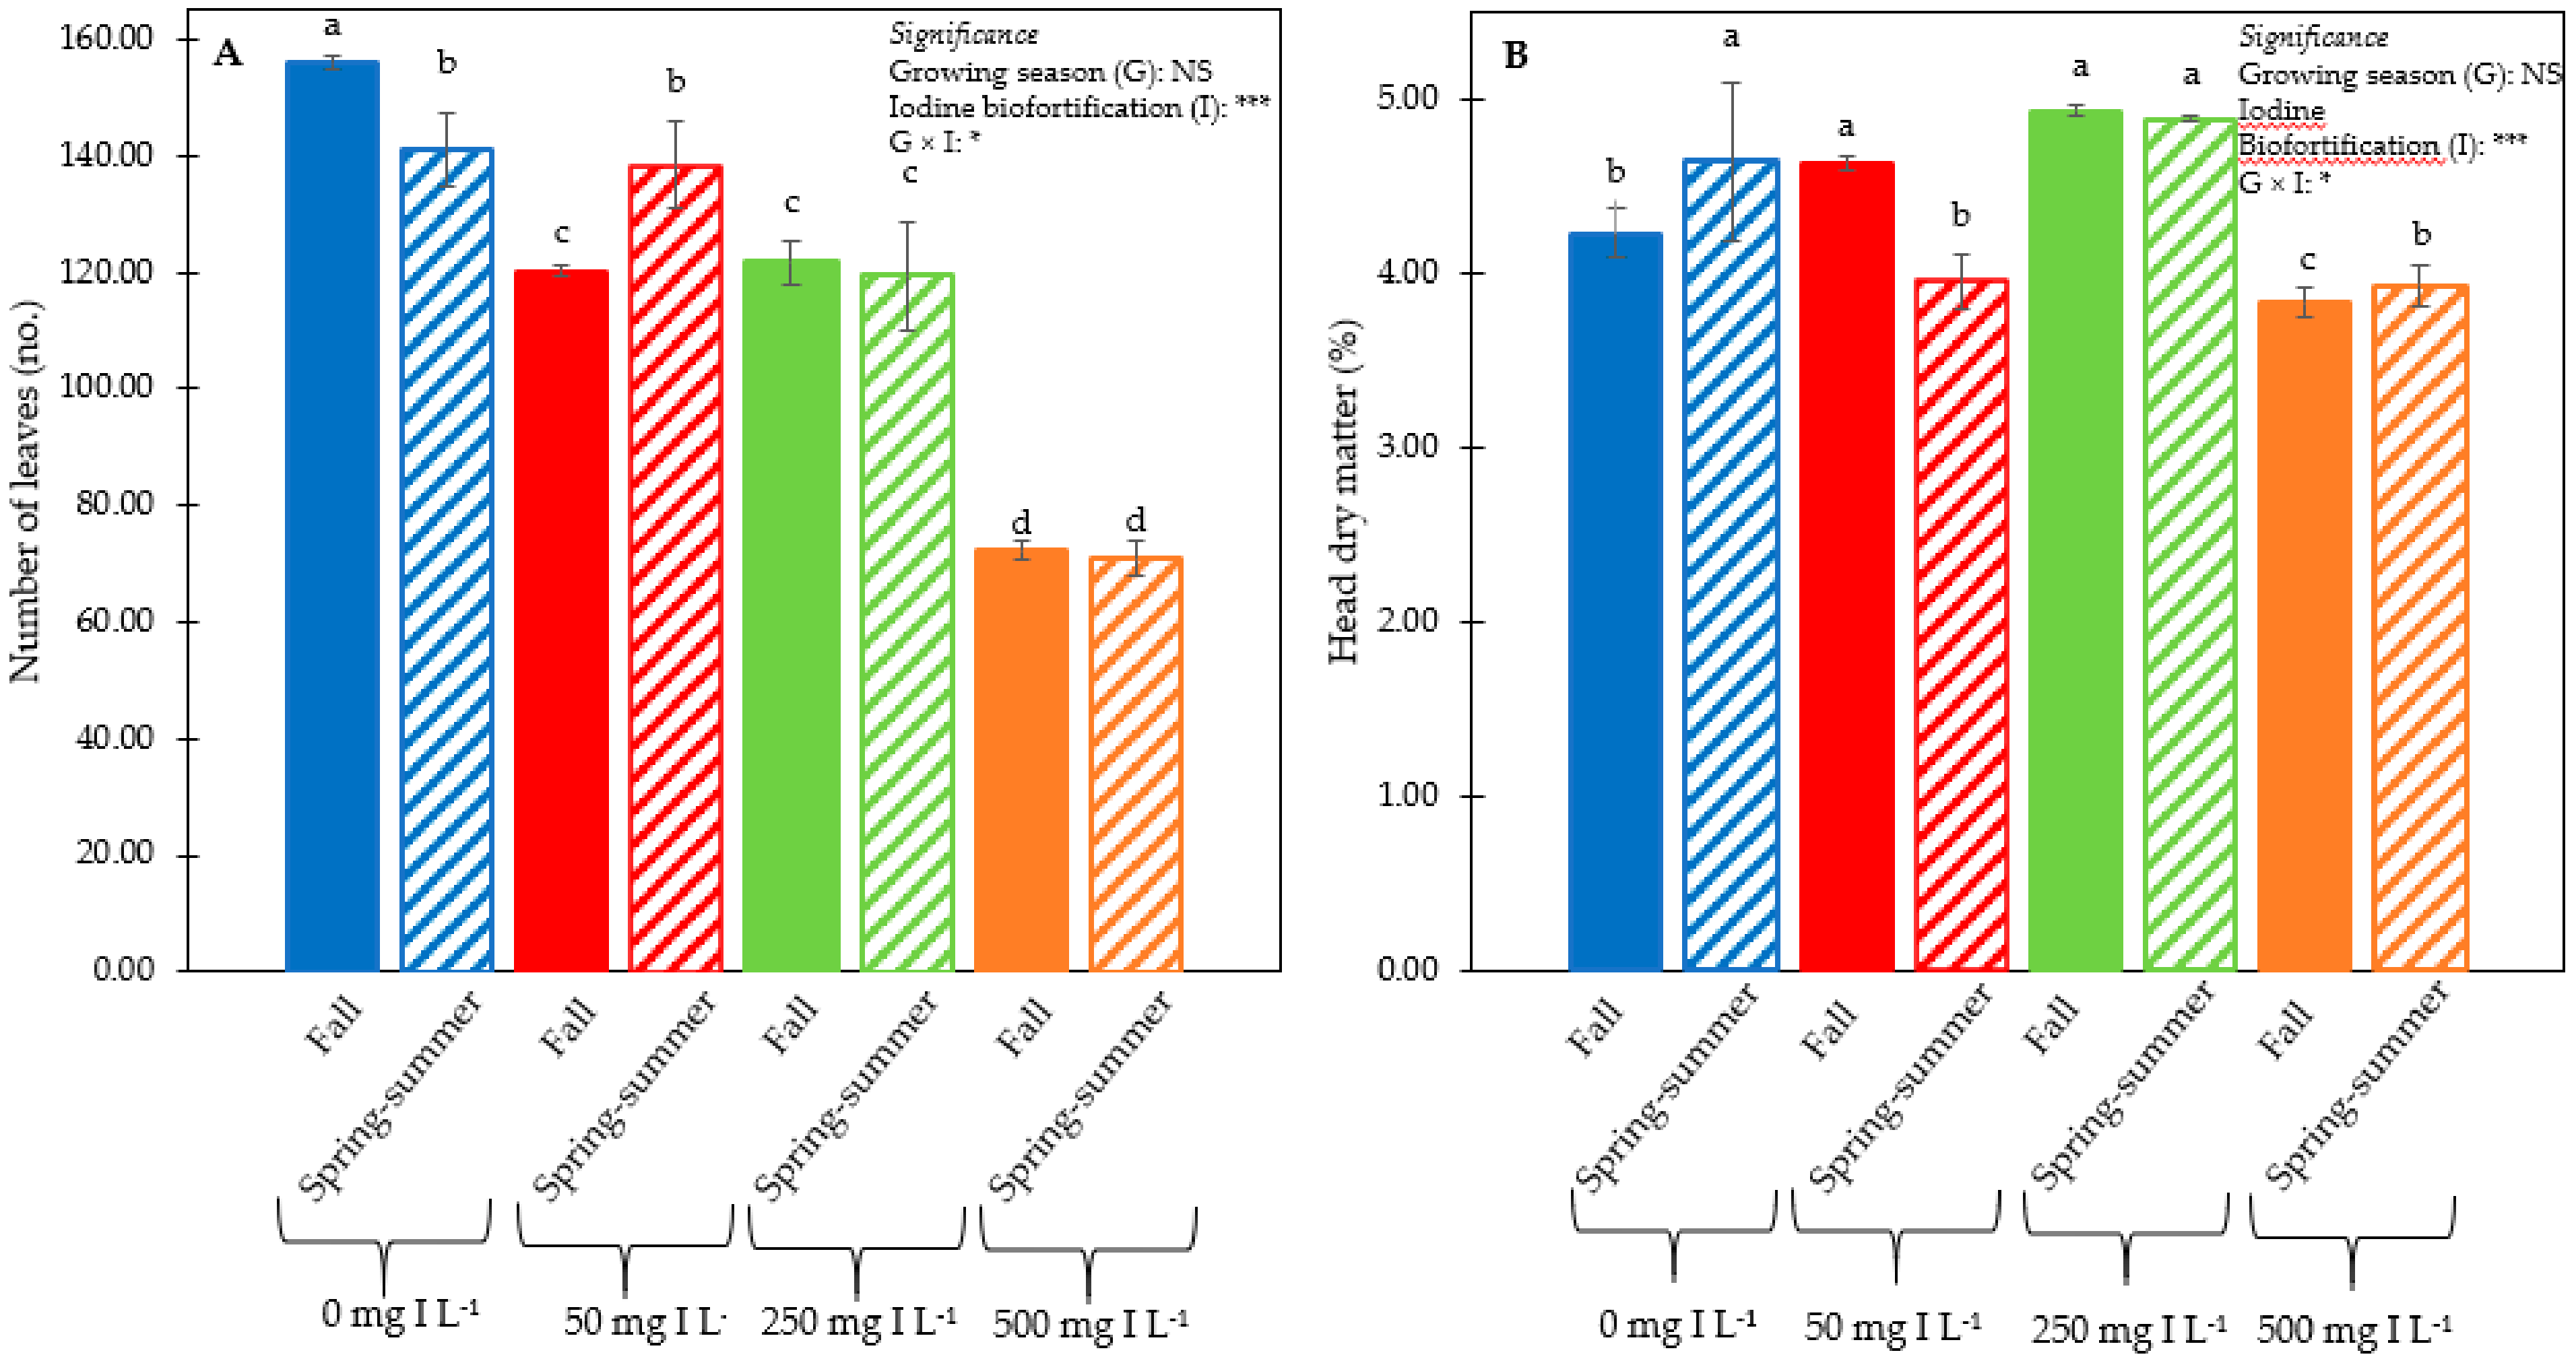
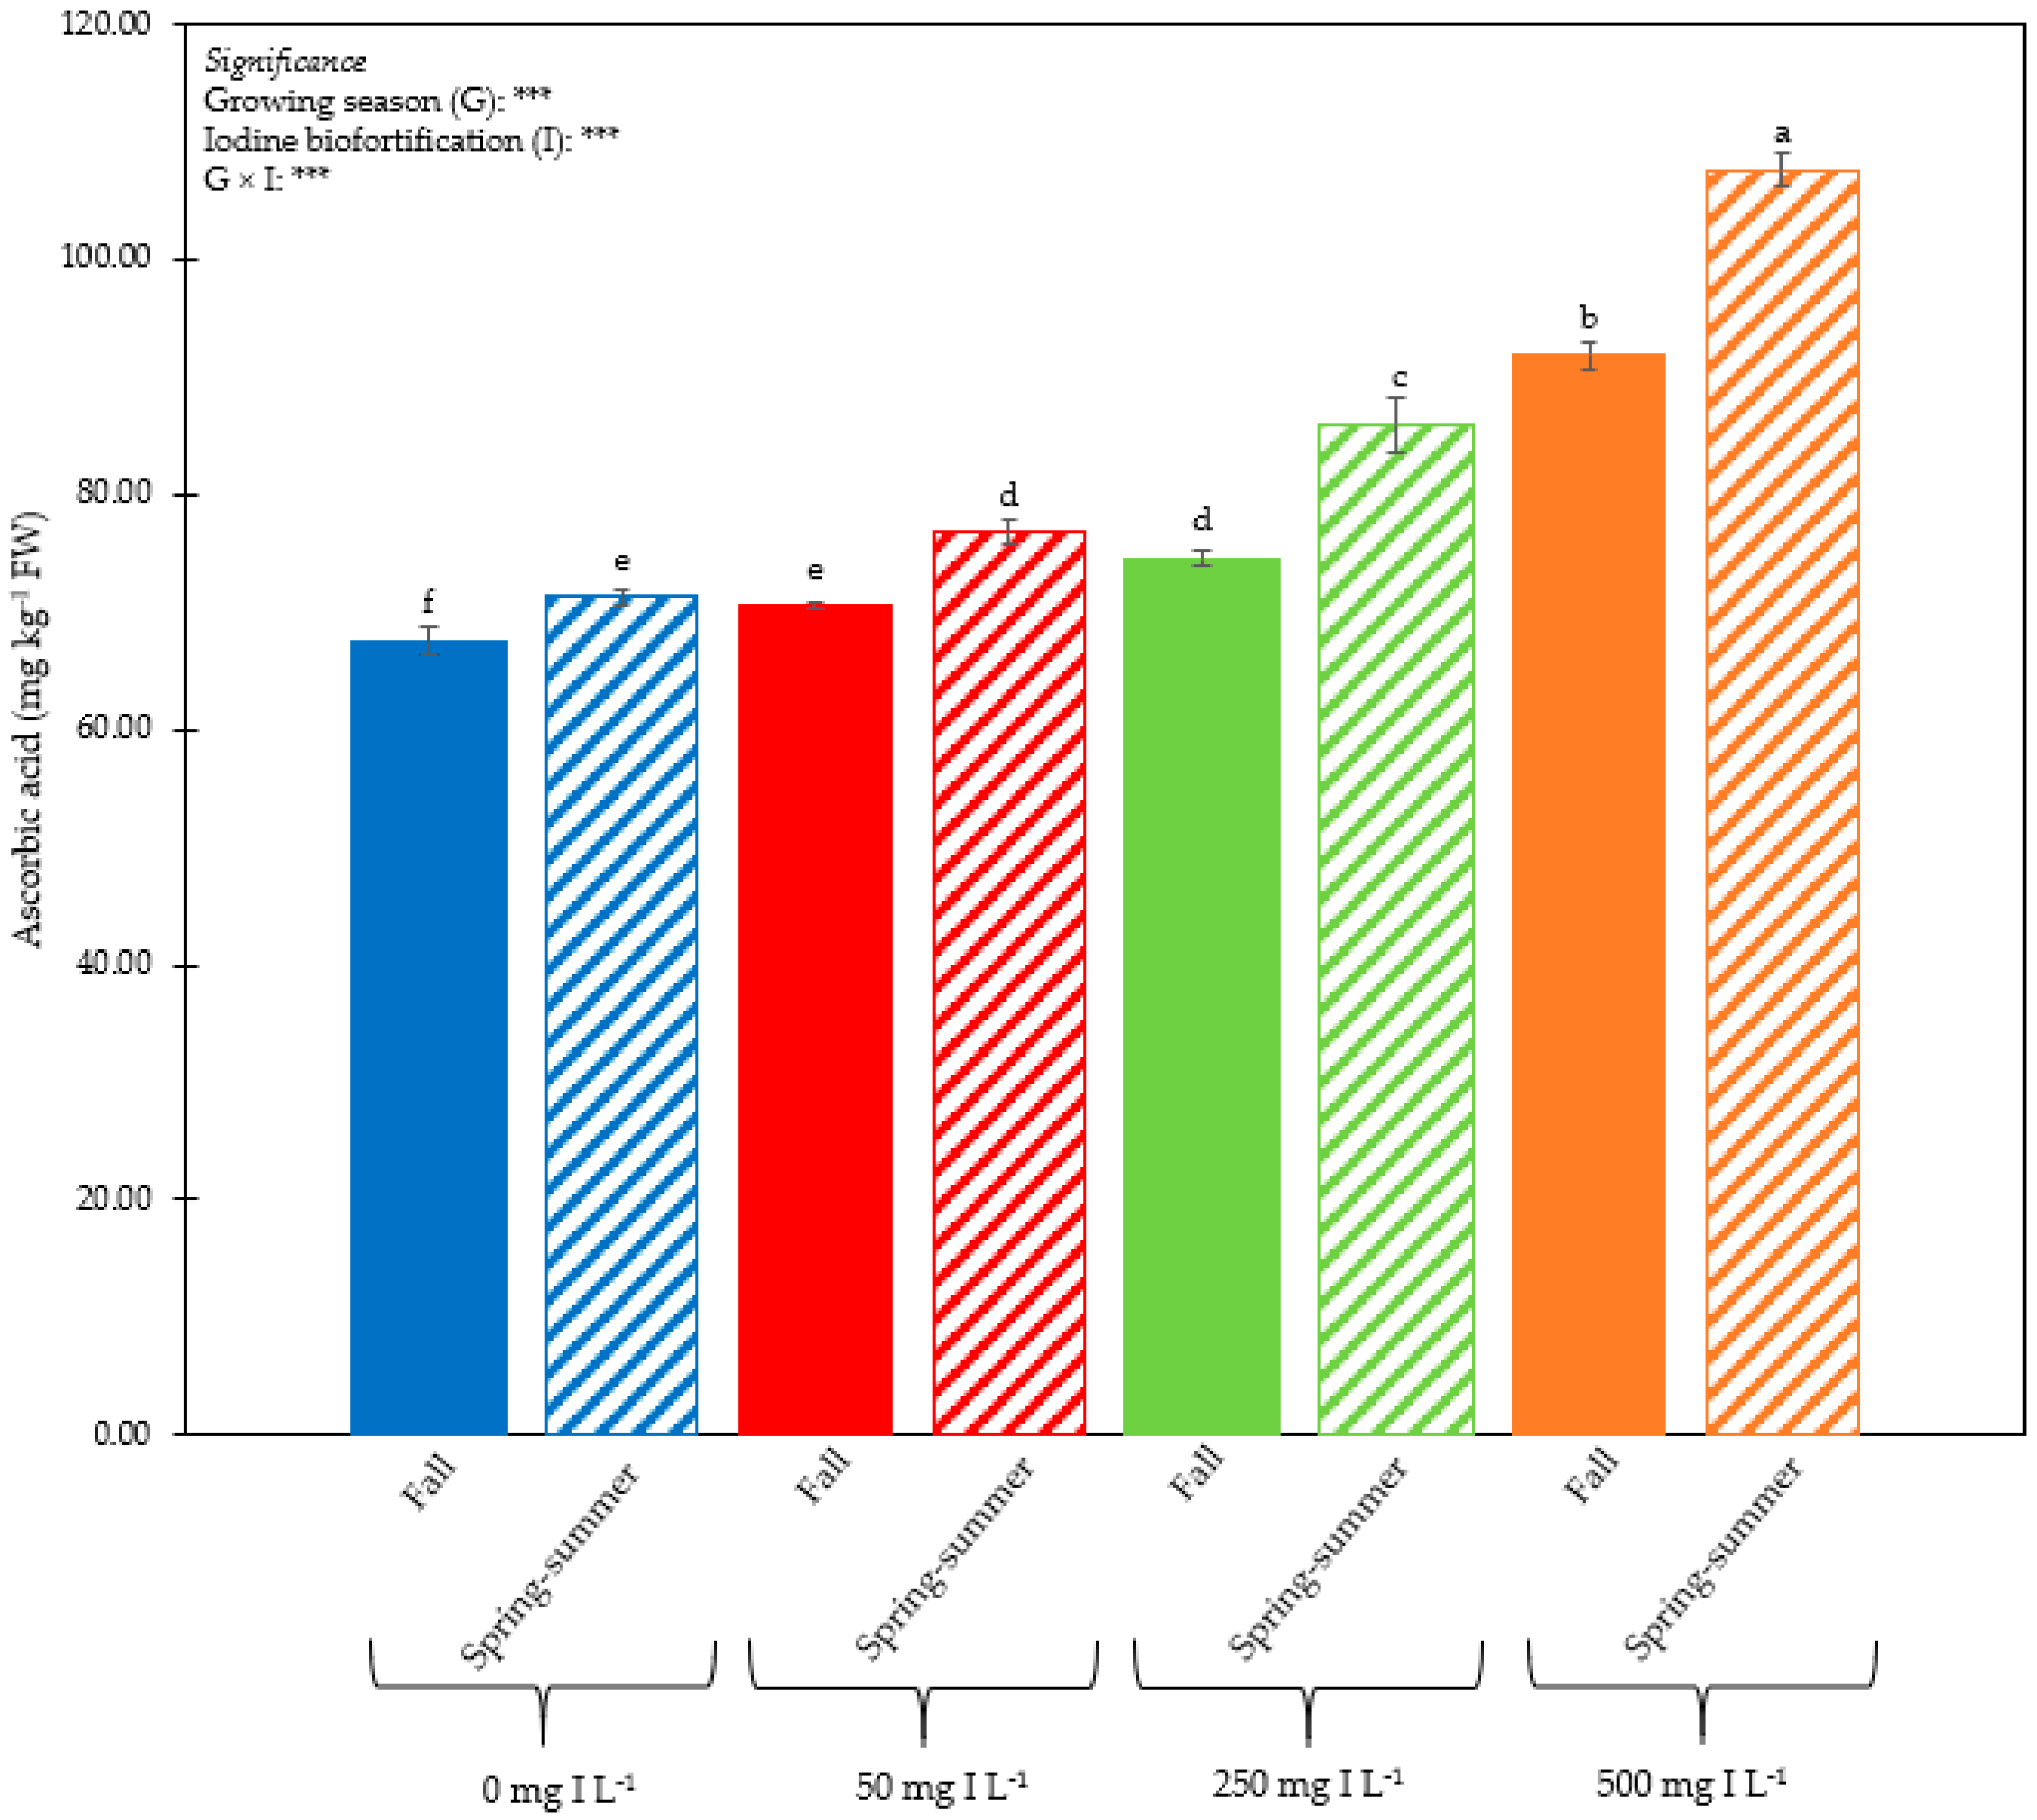
3.1. Plant Performance and Quality

ANOVA analysis for head fresh weight, stem diameter, and head height did not display a significant influence on the interaction G × I (Table 1).
Regardless of the biofortification, growing season did not significantly affect head fresh weight and stem diameter (Table 1). Conversely, non-biofortified plants showed the highest head fresh weight, followed by those biofortified with 50 mg I L1. The lowest head fresh weight was recorded in plants treated with 500 mg I L1. Irrespective of the growing season, control plants and plants supplied with 50 mg I L1 had the biggest stem diameter, whereas the smallest stem diameter was recorded in plants biofortified with 500 mg I L1. Aside from the biofortification, head height was greater in plants cultivated during the spring–summer season (Table 1). Irrespective of the growing season, control plants had the highest head height, followed by those treated with 50 or 250 mg I L1, whereas plants treated with a dosage of 500 mg I L1 had the lowest height.
ANOVA for the number of leaves and head dry matter revealed a significant effect of the interaction G × I (Figure 3).
Control plants cultivated in the fall season had the highest number of leaves, followed by spring–summer grown control plants and by plants biofortified with 50 mg I L1 cultivated in the spring–summer season (Figure 3A). Plants subjected to the highest I-biofortification dosage grown both in the fall and spring–summer season displayed the lowest number of leaves. Dry matter percentage was the highest in the combinations 0 mg I L1 × spring–summer season, 50 mg I L1 × fall season, and 250 mg I L1 × fall or spring–summer season (Figure 3B), whereas the lowest value was observed in plants fed with the highest biofortification dosage (500 mg I L1) grown in the fall.
ANOVA for titratable acidity, soluble solid content, and total phenolics did not exhibit a significant effect of the main treatments and of their interaction. (Table 2).
Regardless of I-biofortification, the growing season did not have a significant effect on SSC (Table 2). Irrespective of the growing season, the highest SSC values were detected in control plants and in those treated with 250 mg I L1. Plants supplied with an I-biofortification dosage of 50 mg I L1 did not significantly differ neither from control plants nor from those biofortified with 250 mg I L1. The lowest SSC was recorded in plants biofortified with the highest dosage. Notwithstanding the I-biofortification, plants grown in the spring–summer season had a higher total phenolic concentration than those cultivated during the fall season (Table 2). Disregarding the growing season, plants biofortified with the highest dosage of I displayed the highest total phenolics concentration, followed by those biofortified with 250 mg I L1. The lowest total phenolics concentration was observed in control plants.
ANOVA for ascorbic acid showed a significant effect of the interaction G × I (Figure 4); plants from the combination spring–summer cycle × 500 mg I L1 had the highest ascorbic acid value followed by those from the combination fall × 500 mg I L1, which, in turn, revealed a higher ascorbic acid content than those grown during the spring–summer season and supplied with 250 mg I L1 (Figure 4). The lowest ascorbic acid concentration was exhibited by control plants grown in the fall season.
Concerning fructose concentration, a significant effect of the interaction G × I was detected (Figure 5A). Plants grown in the spring–summer season and treated with 250 mg I L1 had the highest fructose concentration, followed by those biofortified with the same I dosage but grown during the fall season (Figure 5A). The lowest plant fructose concentration was recorded in control plants and in those biofortified with the highest I dosage.
Regarding glucose concentration, ANOVA revealed a significant effect of the interaction between the growing season and I-biofortification (Figure 5B); plants from the combination spring–summer × 250 mg I L1 had the highest glucose concentration, followed by plants exposed to the same I concentration but grown during fall (Figure 5). The lowest glucose concentration was observed in control plants cultivated in the fall and in plants grown during spring–summer and treated with 500 mg I L1. The treatments had no effect on sucrose concentration (Figure 6).
ANOVA for N, P, K, and Mg concentration did not show a significant effect of the interaction G × I (Table 3).
Independently of the I-biofortification, plants grown in the fall showed a higher N concentration than plants cultivated in the spring–summer season (Table 3). On the contrary, regardless of the growing season, ANOVA analysis did not reveal a significant influence of the I-biofortification. Data on P concentration maintained the trend recognised for N concentration (Table 3). For K and Mg, ANOVA analysis did not display a significant effect of the treatments (Table 3).
ANOVA for Ca concentration revealed a significant influence of the interaction between growing season and I-biofortification (Figure 7).
Plants grown in the fall season and treated with the highest I dosage had the highest Ca concentration, followed by those grown in the fall season and supplied with 250 mg I L1 (Figure 7). The lowest Ca concentration was recorded in control plants cultivated in the spring–summer season. However, curly endive plants cultivated in the fall season revealed a higher Ca concentration than plants cultivated in the spring–summer season at the same I dosage (Figure 7).

3.2. Iodine Concentration in Leaf Tissues

ANOVA analysis showed a significant effect of the interaction G × I in terms of plant I concentration (Figure 7). Plants enriched with 250 mg I L1 and grown in the fall season had the highest I leaf tissue concentration, followed by plants grown in the spring–summer season and biofortified with the same dosage (Figure 7). These plants, in turn, displayed a higher I concentration than plants cultivated in the spring–summer season and treated with 500 mg I L1. The lowest leaf I concentration was observed in non-biofortified plants.

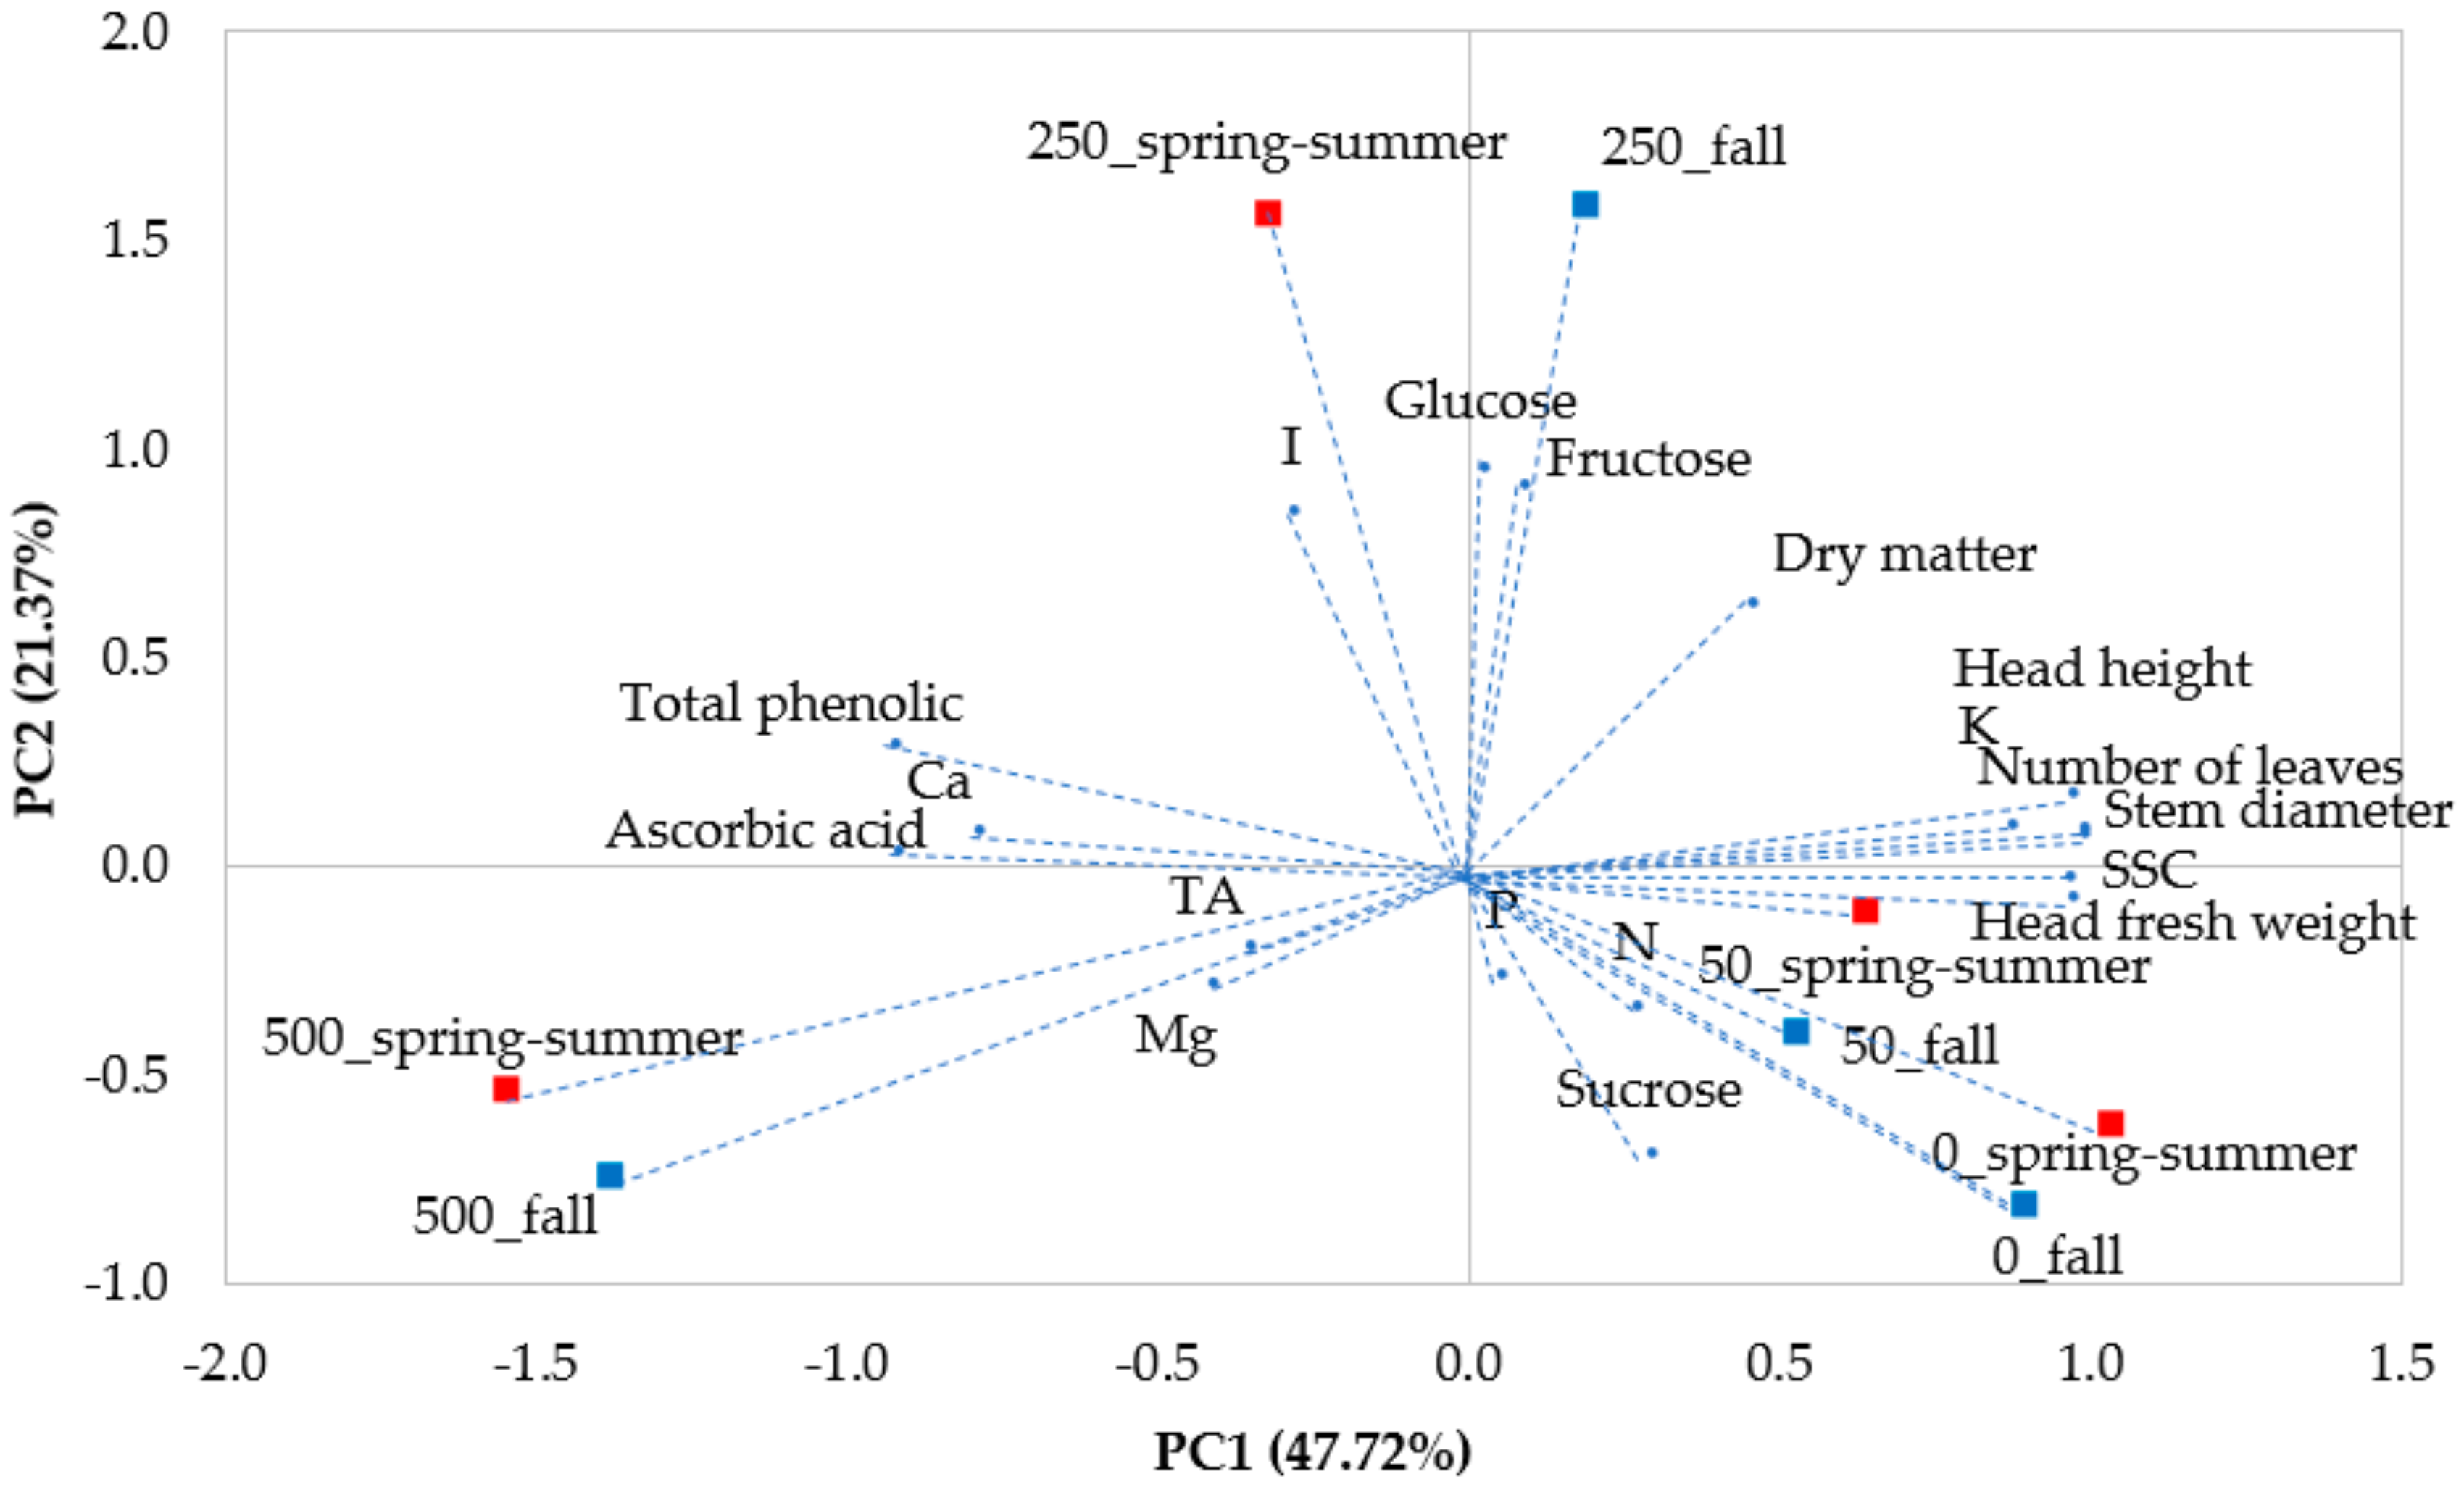
3.3. Principal Component Analysis of all Plant Traits (PCA)

Principal component analysis (PCA) was conducted on all agronomical datasets. The loading plot and scores are presented in Figure 8.
As presented in Table S2, the outcomes of the PCA revealed four main factors (PCs) with eigenvalues higher than 1.00, representing 47.72%, 21.37%, 15.46%, and 8.38% of the total variance, respectively, and, consequently, clarifying 92.94% of the entire variance. PC1 was predominantly positively correlated to head fresh weight, head height, stem diameter, number of leaves, and SSC and negatively correlated to ascorbic acid, total phenolics, and Ca; PC2 was mostly positively correlated to fructose, glucose, and I; PC3 was mainly positively correlated to N and P; PC4 was essentially positively correlated to TA (Table S2). The PC1-PC2 graphic representation can be assumed in Figure 8. The 250_fall is placed on the top-right side of the plot of loading; the 0_fall, 0_spring–summer, 50_fall, and 50_spring–summer are located in the bottom-right side of the plot of loading; the 250_spring–summer is allocated in the top-left side of the loading plot; and finally, 500_spring–summer and 500_fall are placed in the bottom-left side of the plot of loading (Figure 8).

4. Discussion

Mineral malnutrition can be controlled via an appropriate dietary diversification, mineral increase consumption, foodstuff fortification, and by enhancing the bio-available mineral content in edible crops (a procedure named biofortification) [27,35,36]. Accordingly, functional food is very interesting and promising to prevent and cure diverse human disorders. Iodine is an imperative trace element for human and can be mainly assimilated via seafood and/or biofortified food intake, such as vegetables [7]. Indeed, there are reports that I shortage determines a number of negative effects on human health related to insufficient thyroid hormone production [3,4,5,6]. The current study highlighted that I supply and growing season can significantly influence plant performance and quality of curly endive grown in an open field. Our results showed that increasing I dosage in the nutrient solution resulted in significant decrease in yield (head fresh weight), head height, stem diameter, number of leaves, and percentage of head dry matter compared to the control. Our findings are in line with those obtained by Blasco et al. [37], who, studying the interactive effect between I and mineral nutrients in lettuce plants, found a reduction in the biomass of I-biofortified plants. Our outcomes concur with those reported by Smoleń et al. [20], who tested the effect of selenium and I biofortification on lettuce grown in a NFT hydroponic system and found a decrease of the biomass of I-enriched plants. Our results are also supported by those attained by Incrocci et al. [38], who reported a significant decrease in plant height, total dry matter, and leaf area of sweet basil I-enriched plants. A reduction in plant biomass was also reported in tomato and potato [22]. Conversely, other authors [39,40,41] reported a stimulating plant growth effect of I supply in barley, tomato, spinach, and strawberry. Blasco et al. [42] observed injurious effects in lettuce when I concentration in the nutrient solutions was higher than 10–40 μM or 100–200 μM. However, Signore et al. [43] reported that I biofortification does not have significant effect on leaves and roots biomass in a carrot Italian landrace. Thus, considering our results and those reported by other authors, it seems that the lowest I concentration tested in the current study (50 mg L1) is excessive for curly endive.
Our outcomes revealed that head fresh weight and stem diameter were not affected by the growing season. On the contrary, Sabatino et al. [28] reported that the number of leaves is positively influenced by the fall season in control plants, whereas spring–summer plants treated with 50 mg I L1 performed better than those cultivated in the fall. Moreover, the number of leaves in spring–summer grown plants treated with 250 or 500 mg I L1 did not significantly differ from that recorded in the fall grown plants supplied with the same I dosage. Thus, considering that the optimum growing temperature for curly endive is the 15–18 °C range [44] and since such temperatures occur in Sicily in the fall, we may assume that curly endive mineral absorption is more efficient during this season. Consequently, the toxic I threshold value was reached in the fall at a lower I supply dosage than in the spring–summer season.
Our results showed that neither the growing season nor I biofortification affected TA. These findings are in accordance with those reported by Islam et al. [45] in cherry tomatoes. Our findings, also, showed that I-biofortification significantly decreased SSC in curly endive. However, this is in contrast with the results by Golubkina et al. [46] in Indian mustard and by Islam et al. [45] in cherry tomato. Our outcomes, also, highlighted that the growing season did not affect SSC. This result is in accordance with the finding of Sabatino et al. [28], who did not determine differences in terms of SSC between curly endive plants grown in the fall and those grown in the spring–summer season. Moreover, our outcomes showed that, regardless of the growing season, total phenolics increased as I concentration in the nutrient solution increased. Our results are supported by those of Blasco et al. [42], who showed an increase of total phenolic in lettuce plants biofortified with an I dosage ranging from 0 to 240 µM. Furthermore, our results are in line with those reported by Kiferle et al. [47], who declared that KIO3 treatments enhance phenolic concentration in basil. However, our findings did not concur with those of Incrocci et al. [38], who reported that, unlike I-biofortification via KI, I-biofortification via KIO3 does not affect total phenolic concentration in sweet basil. Our results pointed out, also, that the spring–summer season promoted total phenolic concentration in curly endive plants. Hence, considering that: (i) stress conditions promote phenolic synthesis [48,49,50,51,52]; (ii) I-biofortification is a stressful treatment for plants because iodide might be oxidized to elemental I and, consequently, can irreversibly damage the root cell membranes and oxidize chlorophylls and carotenoids, resulting in chlorosis of leaf and decreased CO2 assimilation [17,18,53]; (iii) the optimum growth temperature for curly endive is 15–18 °C [44], we may speculate that the higher total phenolic concentration detected in curly endive plants grown in the spring–summer season and treated with higher I dosages could be positively correlated to the stressful conditions previously reported. Focusing on ascorbic acid, we found that curly endive cultivated during the spring–summer season and treated with a higher I-dosage revealed a higher ascorbic acid concentration. Our findings concur with those of Blasco et al. [42] and Blasco et al. [53], who found that I supply increases ascorbate concentration in lettuce plants. Our results also agree with those of Lester [54], who reported that a higher light intensity promotes ascorbic acid synthesis in green mustard. Furthermore, there are reports that radiation stress elicits plant ascorbic acid concentration [55,56]. Thus, considering that, in the Mediterranean region, curly endive is generally grown during the fall, we assume that the higher ascorbic acid concentration found in our study could be related to unfavourable spring–summer light intensity and photoperiod.
Regarding fructose, we found that I supply positively affected fructose concentration up to 250 mg L1. Conversely, I-biofortification at 500 mg L1 reduced fructose concentration to a level similar to the control. Furthermore, plants grown in the spring–summer season and treated with 500 or 250 mg I L1 had a higher fructose concentration than those grown during the fall. Data on glucose supported the tendency established for fructose. Our results concur with those by Blasco et al. [57], who, studying the effect of I on photosynthesis and metabolism of sugars in lettuce plants, found that increasing I supply results in an increase of fructose and glucose leaf concentration. Thus, in our study, the decrease in fructose and glucose concentration in the plants treated with 500 mg I L1 could be due to a toxic effect of high I dosages. Our results are in agreement with those of Weston and Barth [58] and Caruso et al. [59], who reported that strawberry and tomato plants grown in full sunlight contain more sugar than those cultivated in the shade and suggested that a lower light intensity can significantly reduce sugar accumulation in vegetables.
Medrano-Macias et al. [19] reported that I supply has a relevant effect on the redox state of the system that absorbs elements; thus, it interrelates also with metal ions, altering the oxidation state and bioavailability.
Independently of the season, our data on mineral profile are fully in agreement with those reported by Islam et al. [45], who found that I-implementation does not influence N, P, K, and Mg fruit concentration compared to the control. Our findings are also in accordance with those by Incrocci et al. [38], who found that I supplied by KIO3 does not significantly affect N, P, K, and Mg content in sweet basil. However, irrespective of I-biofortification, our results agree with those by Sabatino et al. [27], who reported that plants fertilized via standard nitrogen source and cultivated during the fall have a N leaf concentration higher than plants grown in the spring–summer. Concerning Ca content, we found that a higher I-dosage stimulated Ca leaf concentration. Additionally, fall grown plants displayed a higher Ca concentration than plants grown in the spring–summer season. This is in accord with the results of Incrocci et al. [38], who found a positive correlation between I-dosage and Ca leaf content. Our results partially concur with those by Blasco et al. [37], who found no significant effect in terms of N, P, and K when I was supplied via IO3. As reported by Kato et al. [60], plant I-enrichment via IO3 form might elicit reductase activity in the roots. This could have an impact on the mineral nutrients bioavailability and on the iodate reductase and it may induce a redox signalling, resulting in a plant response to counter the I effect. Our data on mineral concentration showed that the nutrients fluctuated within the optimal range for curly endive [44]. Thus, as observed by other authors [18,38], the reduction in plant growth cannot be linked to I-induced mineral deficiencies.
Plants can absorb I by the root and, also, by epigeal organs such as stem and leaves via stomata and cuticular waxes [16]. As stated by White and Broadley [61], plants absorb I via ionic channels and chloride transporters. Moreover, there is evidence that I supplied by foliar spray is more effective than by soil applications for enhancing I concentration in plant tissues [17]. Additionally, Voogt et al. [62] established that the differences in iodine allocation among genotypes and seasons can be elucidated by the change in the transpiration rate. Our outcomes on leaf I concentration revealed that plants treated with 250 mg I L1 had the highest I concentration in leaf tissues. Furthermore, plants enriched with a dosage of 50 or 250 mg I L1 during the fall had a higher I concentration than those treated with the highest I-dosage.
Our results are in agreement with those of Incrocci et al. [38], who evidenced that I supplied as KI or KIO3 causes an increase in I plant tissue concentration. Our findings also confirm those reported by Blasco et al. [37], who claimed that an I supply higher than 120 µM determines a reduction in I leaf concentration.
According to our results and taking into consideration the plant I uptake capacity and tolerance, we may suggest that both in the fall and in the spring–summer season, 250 mg I L1 represents the best dosage to improve curly endive functional and nutraceutical traits.

5. Conclusions

In the current study, growing season combined with I-enrichment significantly affected yield and plant biometric traits, functional features, sugars, and mineral profile in curly endive. Overall, I-biofortification improved total phenolic and ascorbic acid, especially in plants cultivated in the spring–summer season. Furthermore, I-enrichment enhanced fructose and glucose concentration in curly endive up to the dose of 250 mg I L−1, particularly in plants grown during the spring–summer season. The I concentration in the spraying solution was positively related to the Ca concentration in plant tissues. Our results also displayed that fall season increased Ca concentration as compared to the spring–summer season. Plants cultivated in the fall and I-biofortified at 250 mg L−1 had the highest I concentration in leaf tissues. Finally, our outcomes suggested that a combination of fall or spring–summer growing season and an I-dosage of 250 mg L−1 may effectively improve plant functional and nutritional quality of curly endive.

Supplementary Materials

The following are available online at https://www.mdpi.com/2311-7524/7/3/58/s1, Table S1: Significance of three-way ANOVA analysis (growing season × iodine biofortification × year). Table S2: Eigenvalues, proportion of total variability and correlation between the 28 variables and the first four principal components (PCs).

Author Contributions

Conceptualization, L.S., G.I., F.D., and B.B.C.; methodology, L.S. and G.I.; software, L.S. and B.B.C.; validation, L.S., G.I., B.B.C., Y.R., and C.E.-N.; formal analysis, L.S., B.B.C., C.D.P., and F.D.G.; investigation, L.S., S.L.B., B.B.C., C.E.-N., S.V., R.P.M., and R.C.; resources, L.S., F.D., and C.D.P.; data curation, L.S., Y.R., B.B.C., and C.E.-N.; writing—original draft preparation, L.S., G.I., Y.R., and S.L.B.; writing—review and editing, L.S., G.I., and Y.R.; visualization, L.S., G.I., and Y.R.; supervision, L.S., F.D., G.I., S.L.B., and Y.R; project administration, L.S., F.D., G.I., S.L.B., and Y.R; funding acquisition, F.D. and C.D.P. All authors have read and agreed to the published version of the manuscript.

Funding

This research received no external funding.

Institutional Review Board Statement

Not applicable.

Informed Consent Statement

Not applicable.

Acknowledgments

Authors are grateful to the farm Di Gioia Salvatore for hosting our experiment.

Conflicts of Interest

The authors declare no conflict of interest.

References

  1. Grasberger, H.; Refetoff, S. Genetic causes of congenital hypothyroidism due to dyshormonogenesis. Curr. Opin. Pediatr. 2011, 23, 421–428. [Google Scholar] [CrossRef] [PubMed] [Green Version]
  2. Zimmermann, M.B. Iodine deficiency. Endocr. Rev. 2009, 30, 376–408. [Google Scholar] [CrossRef] [PubMed] [Green Version]
  3. Andersson, M.; Takkouche, B.; Egli, I.; Allen, H.E.; de Benoist, B. Current global iodine status and progress over the last decade towards the elimination of iodine deficiency. Bull. World Health Organ. 2005, 83, 518–525. [Google Scholar]
  4. Delange, F. The role of iodine in brain development. Proc. Nutr. Soc. 2000, 59, 75–79. [Google Scholar] [CrossRef] [PubMed] [Green Version]
  5. Dillon, J.C.; Milliez, J. Reproductive failure in women living in iodine deficient areas of West Africa. Br. J. Obstet. Gynaecol. 2000, 107, 631–636. [Google Scholar] [CrossRef] [PubMed]
  6. Haddow, J.E.; Palomaki, G.E.; Allan, W.C.; Williams, J.R.; Knight, G.J.; Gagnon, J.; O’Heir, C.E.; Mitchell, M.L.; Hermos, R.J.; Waisbren, S.E.; et al. Maternal thyroid deficiency during pregnancy and subsequent neuropsychological development of the child. N. Engl. J. Med. 1999, 341, 549–555. [Google Scholar] [CrossRef] [PubMed] [Green Version]
  7. World Health Organization. UNICEF, International Council for the Control of Iodine Deficiency Disorders. In Assessment of Iodine Deficiency Disorders and Monitoring Their Elimination, 3rd ed.; World Health Organization: Geneva, Switzerland, 2007. [Google Scholar]
  8. EFSA Panel on Dietetic Products, Nutrition and Allergies (NDA). Scientific opinion on dietary reference values for iodine. EFSA J. 2014, 12, 3660. [Google Scholar]
  9. Zimmermann, M.B. Iodine. In Nutrition and Health in a Developing World; de Pee, D., Taren, M., Bloem, S., Eds.; Springer International Publishing: Cham, Switzerland, 2017; pp. 287–295. [Google Scholar]
  10. Gonzali, S.; Kiferle, C.; Perata, P. Iodine biofortification of crops: Agronomic biofortification, metabolic engineering and iodine bioavailability. Curr. Opin. Biotechnol. 2017, 44, 16–26. [Google Scholar] [CrossRef] [Green Version]
  11. Mottiar, Y.; Altosaar, I. Iodine sequestration by amy lose to combat iodine deficiency disorders. Trends Food Sci. Technol. 2011, 22, 335–340. [Google Scholar] [CrossRef]
  12. Tonacchera, M.; Dimida, A.; De Servi, M.; Frigeri, M.; Ferrarini, E.; De Marco, G.; Grasso, L.; Agretti, P.; Piaggi, P.; Alghino-Lombardi, F.; et al. Iodine fortification of vegetables improves human iodine nutrition: In vivo evidence for a new model of iodine prophylaxis. J. Clin. Endocrinol. Metab. 2013, 98, E694–E697. [Google Scholar] [CrossRef]
  13. Kiferle, C.; Gonzali, S.; Holwerda, H.T.; Real Ibaceta, R.; Perata, P. Tomato fruits: A good target for iodine biofortification. Front. Plant Sci. 2013, 4, 205. [Google Scholar] [CrossRef] [PubMed] [Green Version]
  14. Marschner, P. Mineral Nutrition of Higher Plants, 3rd ed.; Elsevier: Amsterdam, The Netherlands; Academic Press: Amsterdam, The Netherlands, 2012. [Google Scholar]
  15. Stein, A.J. Global impacts of human mineral nutrition. Plant Soil 2010, 335, 133–154. [Google Scholar] [CrossRef]
  16. Tschiersch, J.; Shinonaga, T.; Heuberger, H. Dry deposition of gaseous radioiodine and particulate radiocaesium onto leafy vegetables. Sci. Total Environ. 2009, 407, 5685–5693. [Google Scholar] [CrossRef] [PubMed]
  17. Lawson, P.G.; Daum, D.; Czauderna, R.; Meuser, H.; Härtling, J.W. Soil versus foliar iodine fertilization as a biofortification strategy for field-grown vegetables. Front. Plant Sci. 2015, 6, 450. [Google Scholar] [CrossRef] [PubMed]
  18. Duborská, E.; Urík, M.; Kubová, J. Interaction with soil enhances the toxic effect of iodide and iodate on barley (Hordeum vulgare L.) compared to artificial culture media during initial growth stage. Arch. Agron. Soil Sci. 2018, 64, 46–57. [Google Scholar] [CrossRef]
  19. Medrano-Macías, J.; Leija-Martínez, P.; González-Morales, S.; Juárez- Maldonado, A.; Benavides Mendoza, A. Use of iodine to biofortify and promote growth and stress tolerance in crops. Front. Plant Sci. 2016, 7, 1146. [Google Scholar] [CrossRef] [PubMed] [Green Version]
  20. Smoleń, S.; Kowalska, I.; Sady, W. Assessment of biofortification with iodine and selenium of lettuce cultivated in the NFT hydroponic system. Sci. Hortic. 2014, 166, 9–16. [Google Scholar] [CrossRef]
  21. Smoleń, S.; Sady, W. Influence of iodine form and application method on the effectiveness of iodine biofortification, nitrogen metabolism as well as the content of mineral nutrient sand heavy metals in spinach plants (Spinacia oleracea L.). Sci. Hortic. 2012, 143, 176–183. [Google Scholar] [CrossRef]
  22. Caffagni, A.; Arru, L.; Meriggi, P.; Milc, J.; Perata, P.; Pecchioni, N. Iodine fortification plant screening process and accumulation in tomato fruits and potato tubers. Commun. Soil Sci. Plant Anal. 2011, 42, 706–718. [Google Scholar] [CrossRef]
  23. Smoleń, S.; Sady, W.; Kołton, A.; Wiszniewska, A.; Liszka-Skoczylas, M. Iodine biofortification with additional application of salicylic acid affects yield and selected parameters of chemical composition of tomato fruits (Solanum lycopersicum L.). Sci. Hortic. 2015, 188, 89–96. [Google Scholar] [CrossRef]
  24. Gonnella, M.; Renna, M.; D’Imperio, M.; Santamaria, P.; Serio, F. Iodine Biofortification of Four Brassica Genotypes is Effective Already at Low Rates of Potassium Iodate. Nutrients 2019, 11, 451. [Google Scholar] [CrossRef] [PubMed] [Green Version]
  25. Koudela, M.; Petříková, K. Nutritional composition and yield of endive cultivars—Cichorium endivia L. Hort. Sci. 2007, 34, 6–10. [Google Scholar] [CrossRef] [Green Version]
  26. D’Antuono, L.F.; Ferioli, F.; Manco, M.A. The impact of sesquiterpene lactones and phenolics on sensory attributes: An investigation of a curly endive and escarole germplasm collection. Food Chem. 2016, 199, 238–245. [Google Scholar] [CrossRef] [PubMed]
  27. Sabatino, L.; Ntatsi, G.; Iapichino, G.; D’Anna, F.; De Pasquale, C. Effect of selenium enrichment and type of application on yield, functional quality and mineral composition of curly endive grown in a hydroponic system. Agronomy 2019, 9, 207. [Google Scholar] [CrossRef] [Green Version]
  28. Sabatino, L.; Iapichino, G.; La Bella, S.; Tuttolomondo, T.; D’Anna, F.; Cardarelli, M.; Rouphael, Y. An Appraisal of Calcium Cyanamide as Alternative N Source for Spring-Summer and Fall Season Curly Endive Crops: Effects on Crop Performance, NUE and Functional Quality components. Agronomy 2020, 10, 1357. [Google Scholar] [CrossRef]
  29. Pardossi, A.; Prosdocimi Gianquinto, G.; Santamaria, P.; Incrocci, L. Orticoltura Principi e Pratica; Edagricole: Milano, Italy, 2018. [Google Scholar]
  30. Han, C.; Zhao, Y.; Leonard, S.W.; Traber, M. Edible coatings to improve storability and enhance nutritional value of fresh and frozen strawberries (Fragaria × ananassa) and raspberries (Rubus ideaus). Postharvest Biol. Technol. 2008, 33, 67–78. [Google Scholar] [CrossRef]
  31. Rivero, R.M.; Ruiz, J.M.; Garcia, P.C.; López-Lefebre, L.R.; Sánchez, E.; Romero, L. Resistance to cold and heat stress: Accumulation of phenolic compounds in tomato and watermelon plants. Plant Sci. 2001, 160, 315–321. [Google Scholar] [CrossRef]
  32. Serna, M.; Hernández, F.; Coll, F.; Coll, Y.; Amorós, A. Effects of brassinosteroid analogues on total phenols, antioxidant activity, sugars, organic acids and yield of field grown endive (Cichorium endivia L.). J. Sci. Food Agric. 2013, 93, 1765–1771. [Google Scholar] [CrossRef]
  33. Morand, P.; Gullo, J.L. Mineralisation des tissus vegetaux en vue du dosage de P, Ca, Mg, Na, K. Ann. Agron. 1970, 21, 229–236. [Google Scholar]
  34. Fogg, D.N.; Wilkinson, N.T. The colorimetric determination of phosphorus. Analist 1958, 83, 406–414. [Google Scholar] [CrossRef]
  35. Puccinelli, M.; Landi, M.; Maggini, R.; Pardossi, A.; Incrocci, L. Iodine biofortification of sweet basil and lettuce grown in two hydroponic systems. Sci. Hortic. 2021, 276, 109783. [Google Scholar] [CrossRef]
  36. Sabatino, L.; D’Anna, F.; Iapichino, G.; Moncada, A.; D’Anna, E.; De Pasquale, C. Interactive effects of genotype and molybdenum supply on yield and overall fruit quality of tomato. Front. Plant Sci. 2019, 9, 1922. [Google Scholar] [CrossRef] [Green Version]
  37. Blasco, B.; Ríos, J.J.; Sánchez-Rodríguez, E.; Rubio-Wilhelmi, M.M.; Leyva, R.; Romero, L.; Ruiz, J.M. Study of the interactions between iodine and mineral nutrients in lettuce plants. J. Plant Nutr. 2012, 35, 1958–1969. [Google Scholar] [CrossRef]
  38. Incrocci, L.; Carmassi, G.; Maggini, R.; Poli, C.; Saidov, D.; Tamburini, C.; Pardossi, A. Iodine accumulation and tolerance in sweet basil (Ocimum basilicum L.) with green or purple leaves grown in floating system technique. Front. Plant Sci. 2019, 10, 1494. [Google Scholar] [CrossRef]
  39. Borst Pauwels, G.W.F.H. Iodine as a micronutrient for plants. Plant Soil 1961, 14, 377–392. [Google Scholar] [CrossRef]
  40. Zhu, Y.G.; Huang, Y.-Z.; Hu, Y.; Liu, Y.-X. Iodine uptake by spinach (Spinacia oleracea L.) plants grown in solution culture: Effects of iodine species and solution concentrations. Environ. Int. 2003, 29, 33–37. [Google Scholar] [CrossRef]
  41. Li, R.; Liu, H.P.; Hong, C.L.; Dai, Z.X.; Liu, J.W.; Zhou, J.; Hu, C.Q.; Weng, H.X. Iodide and iodate effects on the growth and fruit quality of strawberry. J. Sci. Food Agric. 2017, 97, 230–235. [Google Scholar] [CrossRef] [PubMed]
  42. Blasco, B.; Rios, J.J.; Cervilla, L.M.; Sánchez-Rodrigez, E.; Ruiz, J.M.; Romero, L. Iodine biofortification and antioxidant capacity of lettuce: Potential benefits for cultivation and human health. Ann. Appl. Biol. 2008, 152, 289–299. [Google Scholar] [CrossRef]
  43. Signore, A.; Renna, M.; D’Imperio, M.; Serio, F.; Santamaria, P. Preliminary evidences of biofortification with iodine of “Carota di Polignano”, an Italian carrot landrace. Front. Plant Sci. 2018, 9, 170. [Google Scholar] [CrossRef] [Green Version]
  44. Tesi, R. Orticoltura Mediterranea Sostenibile; Pàtron Editore: Bologna, Italy, 2010. [Google Scholar]
  45. Islam, M.Z.; Ho-Min, K.A.N.G. Iron, iodine and selenium effects on quality, shelf life and microbial activity of cherry tomatoes. Not. Bot. Horti Agrobot. Cluj Napoca 2018, 46, 388–392. [Google Scholar] [CrossRef] [Green Version]
  46. Golubkina, N.; Kekina, H.; Caruso, G. Yield, quality and antioxidant properties of Indian mustard (Brassica juncea L.) in response to foliar biofortification with selenium and iodine. Plants 2018, 7, 80. [Google Scholar] [CrossRef] [Green Version]
  47. Kiferle, C.; Ascrizzi, R.; Martinelli, M.; Gonzali, S.; Mariotti, L.; Pistelli, L.; Flamini, G.; Perata, P. Effect of Iodine treatments on Ocimum basilicum L.: Biofortification, phenolics production and essential oil composition. PLoS ONE 2020, 15, e0229016. [Google Scholar] [CrossRef]
  48. Dixon, R.A.; Paiva, N.L. Stress-induced phenylpropanoid metabolism. Plant Cell 1995, 7, 1085–1097. [Google Scholar] [CrossRef]
  49. Moglia, A.; Lanteri, S.; Comino, C.; Acquadro, A.; de Vos, R.; Beekwilder, J. Stress induced biosynthesis of dicaffeoylquinic acids in globe artichoke. J. Agric. Food Chem. 2008, 56, 8641–8649. [Google Scholar] [CrossRef]
  50. Gisbert, C.; Prohens, J.; Raigón, M.D.; Stommel, J.R.; Nuez, F. Eggplant relatives as sources of variation for developing new rootstocks: Effects of grafting on eggplant yield and fruit apparent quality and composition. Sci. Hortic. 2011, 128, 14–22. [Google Scholar] [CrossRef] [Green Version]
  51. Maršič, N.K.; Mikulič-Petkovšek, M.; Štampar, F. Grafting influences phenolic profile and carpometric traits of fruits of greenhouse-grown eggplant (Solanum melongena L.). J. Agric. Food Chem. 2014, 62, 10504–10514. [Google Scholar] [CrossRef]
  52. Sabatino, L.; Iapichino, G.; Rotino, G.L.; Palazzolo, E.; Mennella, G.; D’Anna, F. Solanum aethiopicum gr. gilo and its interspecific hybrid with S. melongena as alternative rootstocks for eggplant: Effects on vigor, yield, and fruit physicochemical properties of cultivar ‘Scarlatti’. Agronomy 2019, 9, 223. [Google Scholar] [CrossRef] [Green Version]
  53. Blasco, B.; Rios, J.J.; Cervilla, L.M.; Sánchez-Rodríguez, E.; Rubio-Wilhelmi, M.M.; Rosales, M.A.; Romero, L. Photorespiration process and nitrogen metabolism in lettuce plants (Lactuca sativa L.): Induced changes in response to iodine biofortification. J. Plant Growth Regul. 2010, 29, 477–486. [Google Scholar] [CrossRef]
  54. Lester, G.E. Environmental regulation of human health nutrients (ascorbic acid, β-carotene, and folic acid) in fruits and vegetables. HortScience 2006, 41, 59–64. [Google Scholar] [CrossRef] [Green Version]
  55. Eskling, M.; Akerlund, H.E. Changes in the quantities of violaxanthin de-epoxidase, xanthophylls and ascorbate in spinach upon shift from low to high light. Photosynth. Res. 1998, 57, 41–50. [Google Scholar] [CrossRef]
  56. Schonhof, I.; Kläring, H.P.; Krumbein, A.; Claußen, W.; Schreiner, M. Effect of temperature increase under low radiation conditions on phytochemicals and ascorbic acid in greenhouse grown broccoli. Agric. Ecosyst. Environ. 2007, 119, 103–111. [Google Scholar] [CrossRef]
  57. Blasco, B.; Rios, J.J.; Cervilla, L.M.; Sánchez-Rodríguez, E.; Rubio-Wilhelmi, M.M.; Rosales, M.A.; Ruiz, J.M. Iodine application affects nitrogen-use efficiency of lettuce plants (Lactuca sativa L.). Acta Agric. Scand. Sect. B Soil Plant Sci. 2011, 61, 378–383. [Google Scholar]
  58. Weston, L.A.; Barth, M.M. Preharvest factors affecting postharvest quality of vegetables. HortScience 1997, 32, 812–816. [Google Scholar] [CrossRef] [Green Version]
  59. Caruso, G.; Villari, A.; Villari, G. Quality characteristics of Fragaria vesca L. fruits influenced by NFT solution EC and shading. In South Pacific Soilless Culture Conference-SPSCC 648; ISHS: Belgium, Leuven, February 2003; pp. 167–175. [Google Scholar]
  60. Kato, S.; Wachi, T.; Yoshihira, K.; Nakagawa, T.; Ishikawa, A.; Takagi, D.; Takahashi, M. Rice (Oryza sativa L.) roots have iodate reduction activity in response to iodine. Front. Plant Sci. 2013, 4, 227. [Google Scholar] [CrossRef] [Green Version]
  61. White, P.J.; Broadley, M.R. Biofortification of crops with seven mineral elements of ten lacking in human diets–iron, zinc, copper, calcium, magnesium, selenium, and iodine. New Phytol. 2009, 182, 49–84. [Google Scholar] [CrossRef]
  62. Voogt, W.; Steenhuizen, J.W.; Eveleens, B.A. Uptake and Distribution of Iodine in Cucumber, Sweet Pepper, Round, and Cherry Tomato; Wageningen UR Greenhouse Horticulture: Bleiswijk, The Netherlands, 2014; pp. 1–69. [Google Scholar]
Figure 1. Daily temperature (maximum and minimum) and rainfall from 18 April to 27 June (2018 and 2019).
Horticulturae 07 00058 g001
Figure 2. Daily temperature (maximum and minimum) and rainfall from 25 September to 4 November (2018 and 2019).
Horticulturae 07 00058 g002
Figure 3. Number of leaves (A) and head dry matter (B) as affected by combining the growing season (fall or spring–summer) and iodine supply (0, 50, 250, or 500 mg L1) in curly endive. Different letters indicate significant differences at p ≤ 0.05. *, *** significant at 0.05 and 0.001, respectively. NS, not significant.
Horticulturae 07 00058 g003
Figure 4. Ascorbic acid concentration as affected by combining growing season (fall or spring–summer) and iodine supply (0, 50, 250 or 500 mg L1) in curly endive. Different letters indicate significant differences at p ≤ 0.05. *** significant at 0.001.
Horticulturae 07 00058 g004
Figure 5. Fructose (A) and glucose (B) concentration as influenced by combining the growing season (fall or spring–summer) and iodine supply (0, 50, 250 or 500 mg L1) in curly endive. Different letters indicate significant differences at p ≤ 0.05. *, *** significant at 0.05 and 0.001, respectively.
Horticulturae 07 00058 g005
Figure 6. Effect of the growing season (fall or spring–summer) and iodine supply (0, 50, 250 or 500 mg L1) on sucrose concentration in curly endive. Different letters indicate significant differences at p ≤ 0.05. NS, not-significant.
Horticulturae 07 00058 g006
Figure 7. Ca (A) and I (B) concentration as affected by combining growing season (fall or spring–summer) and iodine supply (0, 50, 250, or 500 mg L1) in curly endive. Different letters indicate significant differences at p ≤ 0.05. *** significant at 0.001. NS, not significant.
Horticulturae 07 00058 g007
Figure 8. Scores and loading plots of PCA of curly endive plant performance and quality traits as affected by combining the growing season [fall (blue squares) or spring–summer (red squares)] and iodine dosage (0, 50, 250 or 500 mg L−1).
Horticulturae 07 00058 g008
Table 1. Effect of the growing season (fall or spring–summer) and iodine biofortification supply (0, 50, 250 or 500 mg L−1) on head fresh weight, stem diameter, and head height of curly endive.
TreatmentsHead Fresh Weight (g)Stem Diameter (mm)Head Height (cm)
Growing season
Fall734.07a22.94a31.00a
Spring–summer797.81a23.02a32.08a
Iodine Biofortification (mg L−1)
01125.45a26.28a36.78a
50853.02b25.30a32.53b
250697.25c23.15b32.53b
500388.05d17.18c24.32c
Significance
Growing season (G)NSNSNS
Iodine biofortification (I)*********
G × INSNSNS
Values within a column followed by different letters are significantly different at p ≤ 0.05. *** significant at 0.001, respectively. NS, not significant.
Table 2. Effect of growing season (fall or spring–summer) and iodine biofortification supply (0, 50, 250 or 500 mg L−1) on TA, SSC, and total phenolics of curly endive.
TreatmentsTA (%)SSC (°Brix)Total Phenolics (mg of Caffeic Acid g−1 FW)
Growing season
Fall0.667 2.71 0.701b
Spring–summer0.667 2.64 0.786a
Iodine Biofortification (mg L−1)
00.683 2.90a0.580d
500.683 2.87ab0.700c
2500.663 2.62b0.790b
5000.667 2.32c0.910a
Significance
Growing season (G)NSNS***
Iodine biofortification (I)NS******
G × INSNSNS
Values within a column followed by different letters are significantly different at p ≤ 0.05. *** significant at 0.001. NS, not significant. TA: titratable acidity, SSC: soluble solid content.
Table 3. Effect of the growing season (fall or spring–summer) and iodine supply (0, 50, 250 or 500 mg L1) on N, P, K, and Mg concentration in curly endive.
TreatmentsN (mg g−1 DW)P (mg g−1 DW)K (mg g−1 DW)Mg (mg g−1 DW)
Growing season
Fall5.77a0.61a3.23 0.34
Spring–summer5.59b0.57b3.23 0.33
Iodine Biofortification (mg L−1)
05.73 0.58 3.25 0.30
505.73 0.60 3.25 0.35
2505.68 0.59 3.23 0.33
5005.68 0.59 3.19 0.34
Significance
Growing season (G)****NSNS
Iodine biofortification (I)NSNSNSNS
G × INSNSNSNS
Values within a column followed by different letters are significantly different at p ≤ 0.05. *, *** significant at 0.05 and 0.001, respectively. NS, not significant. DW: dry weight.
Publisher’s Note: MDPI stays neutral with regard to jurisdictional claims in published maps and institutional affiliations.

