
pXRF Data Evaluation Methodology for On-Site Analysis of Precious Artifacts: Cobalt Used in the Blue Decoration of Qing Dynasty Overglazed Porcelain Enameled at Customs District (Guangzhou), Jingdezhen and Zaobanchu (Beijing) Workshops

 , ,
, ,
Abstract
:1. Introduction
2. Materials and Methods
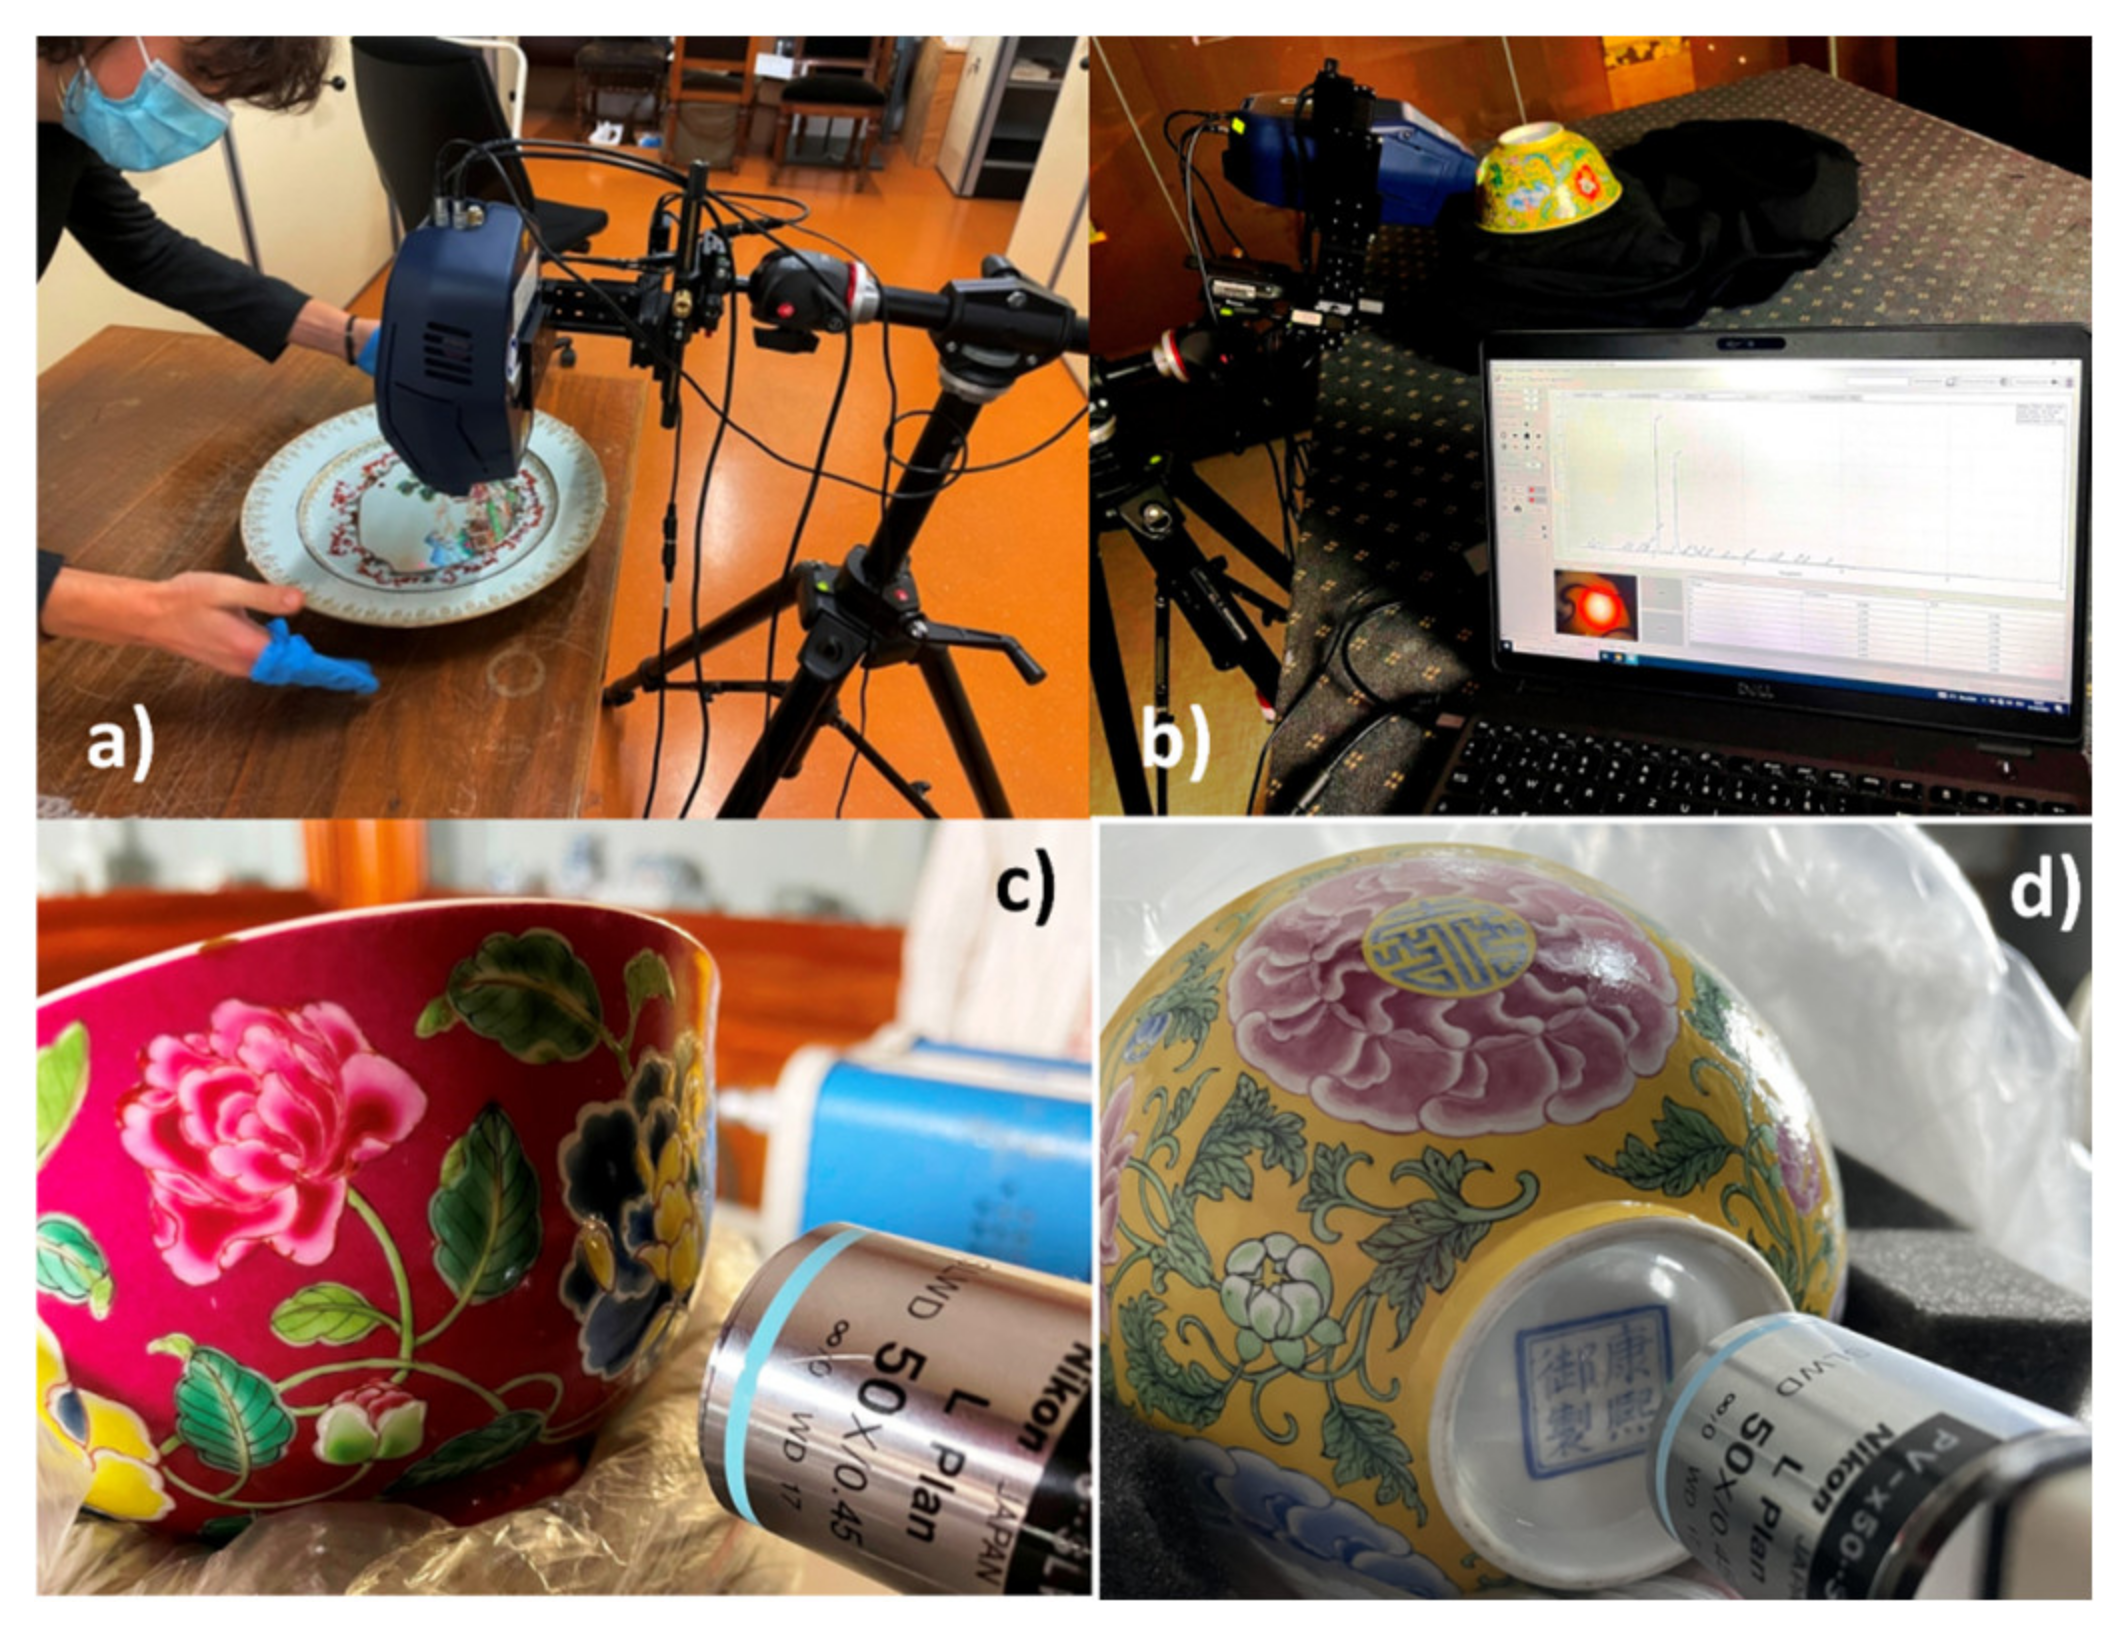
2.1. Portable X-ray Fluorescence Spectroscopy (pXRF)
2.2. Processing of XRF Data
2.3. Raman Microspectroscopy
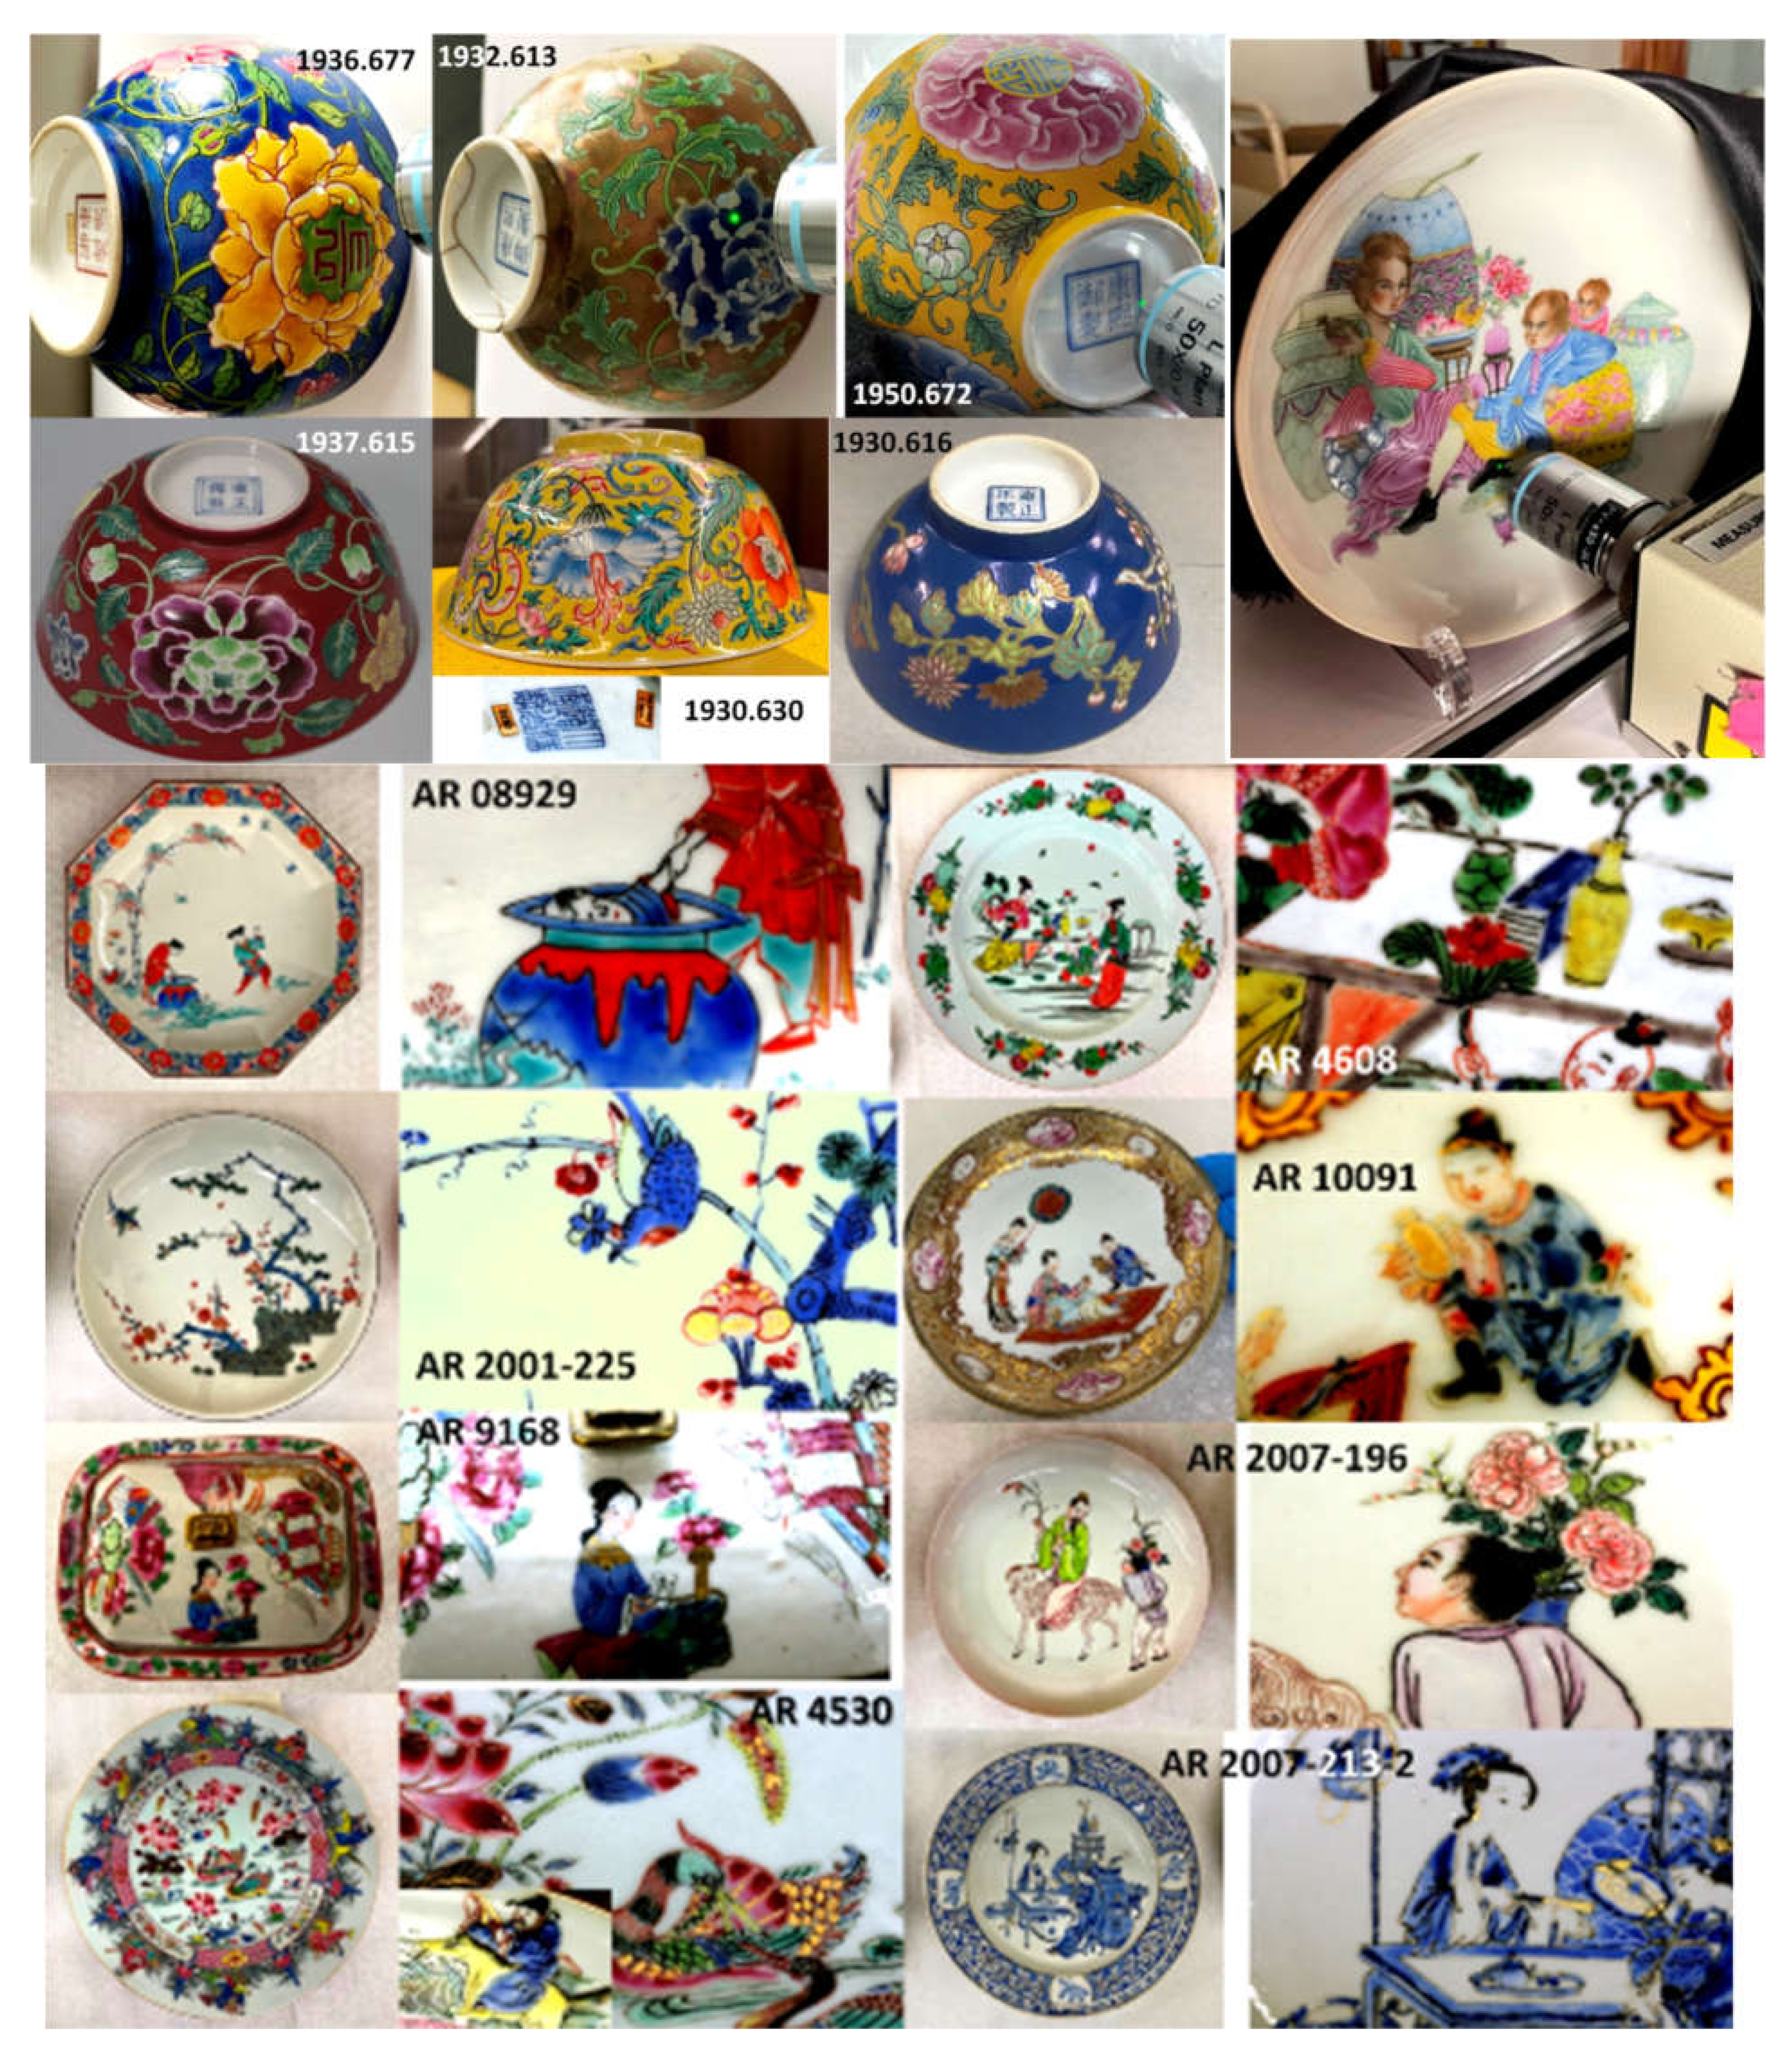
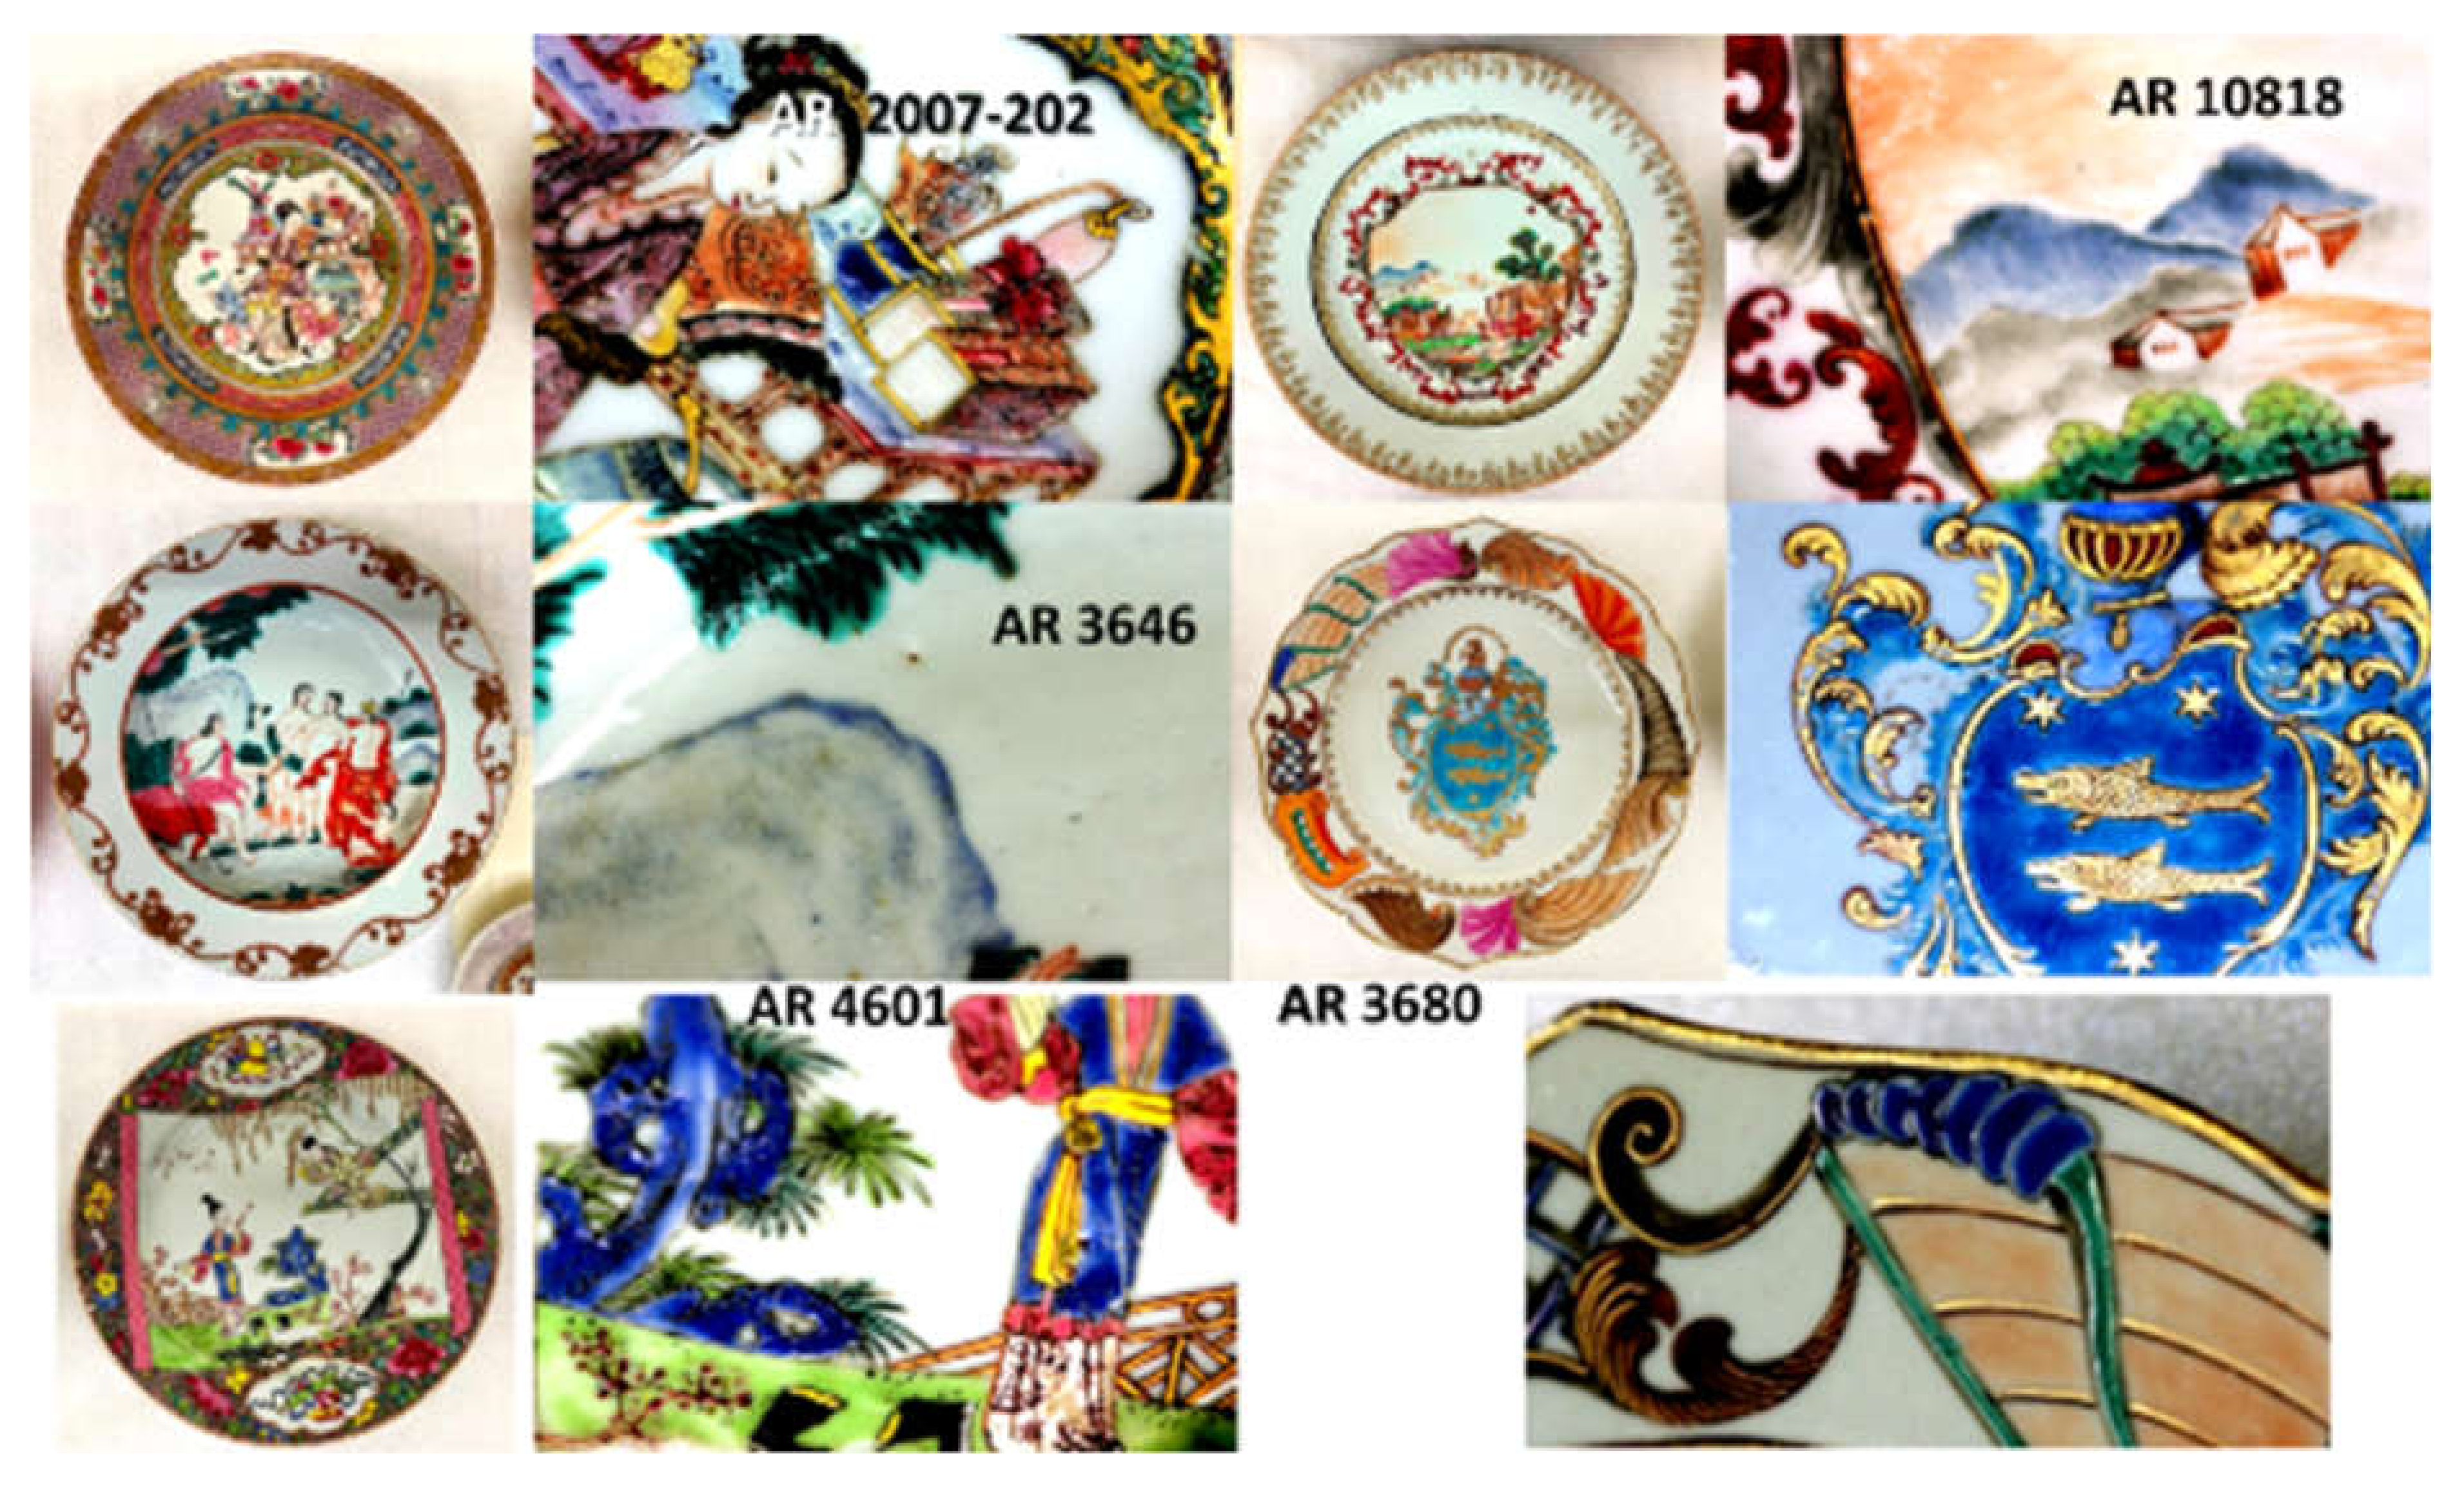
2.4. Objects Studied
3. Results
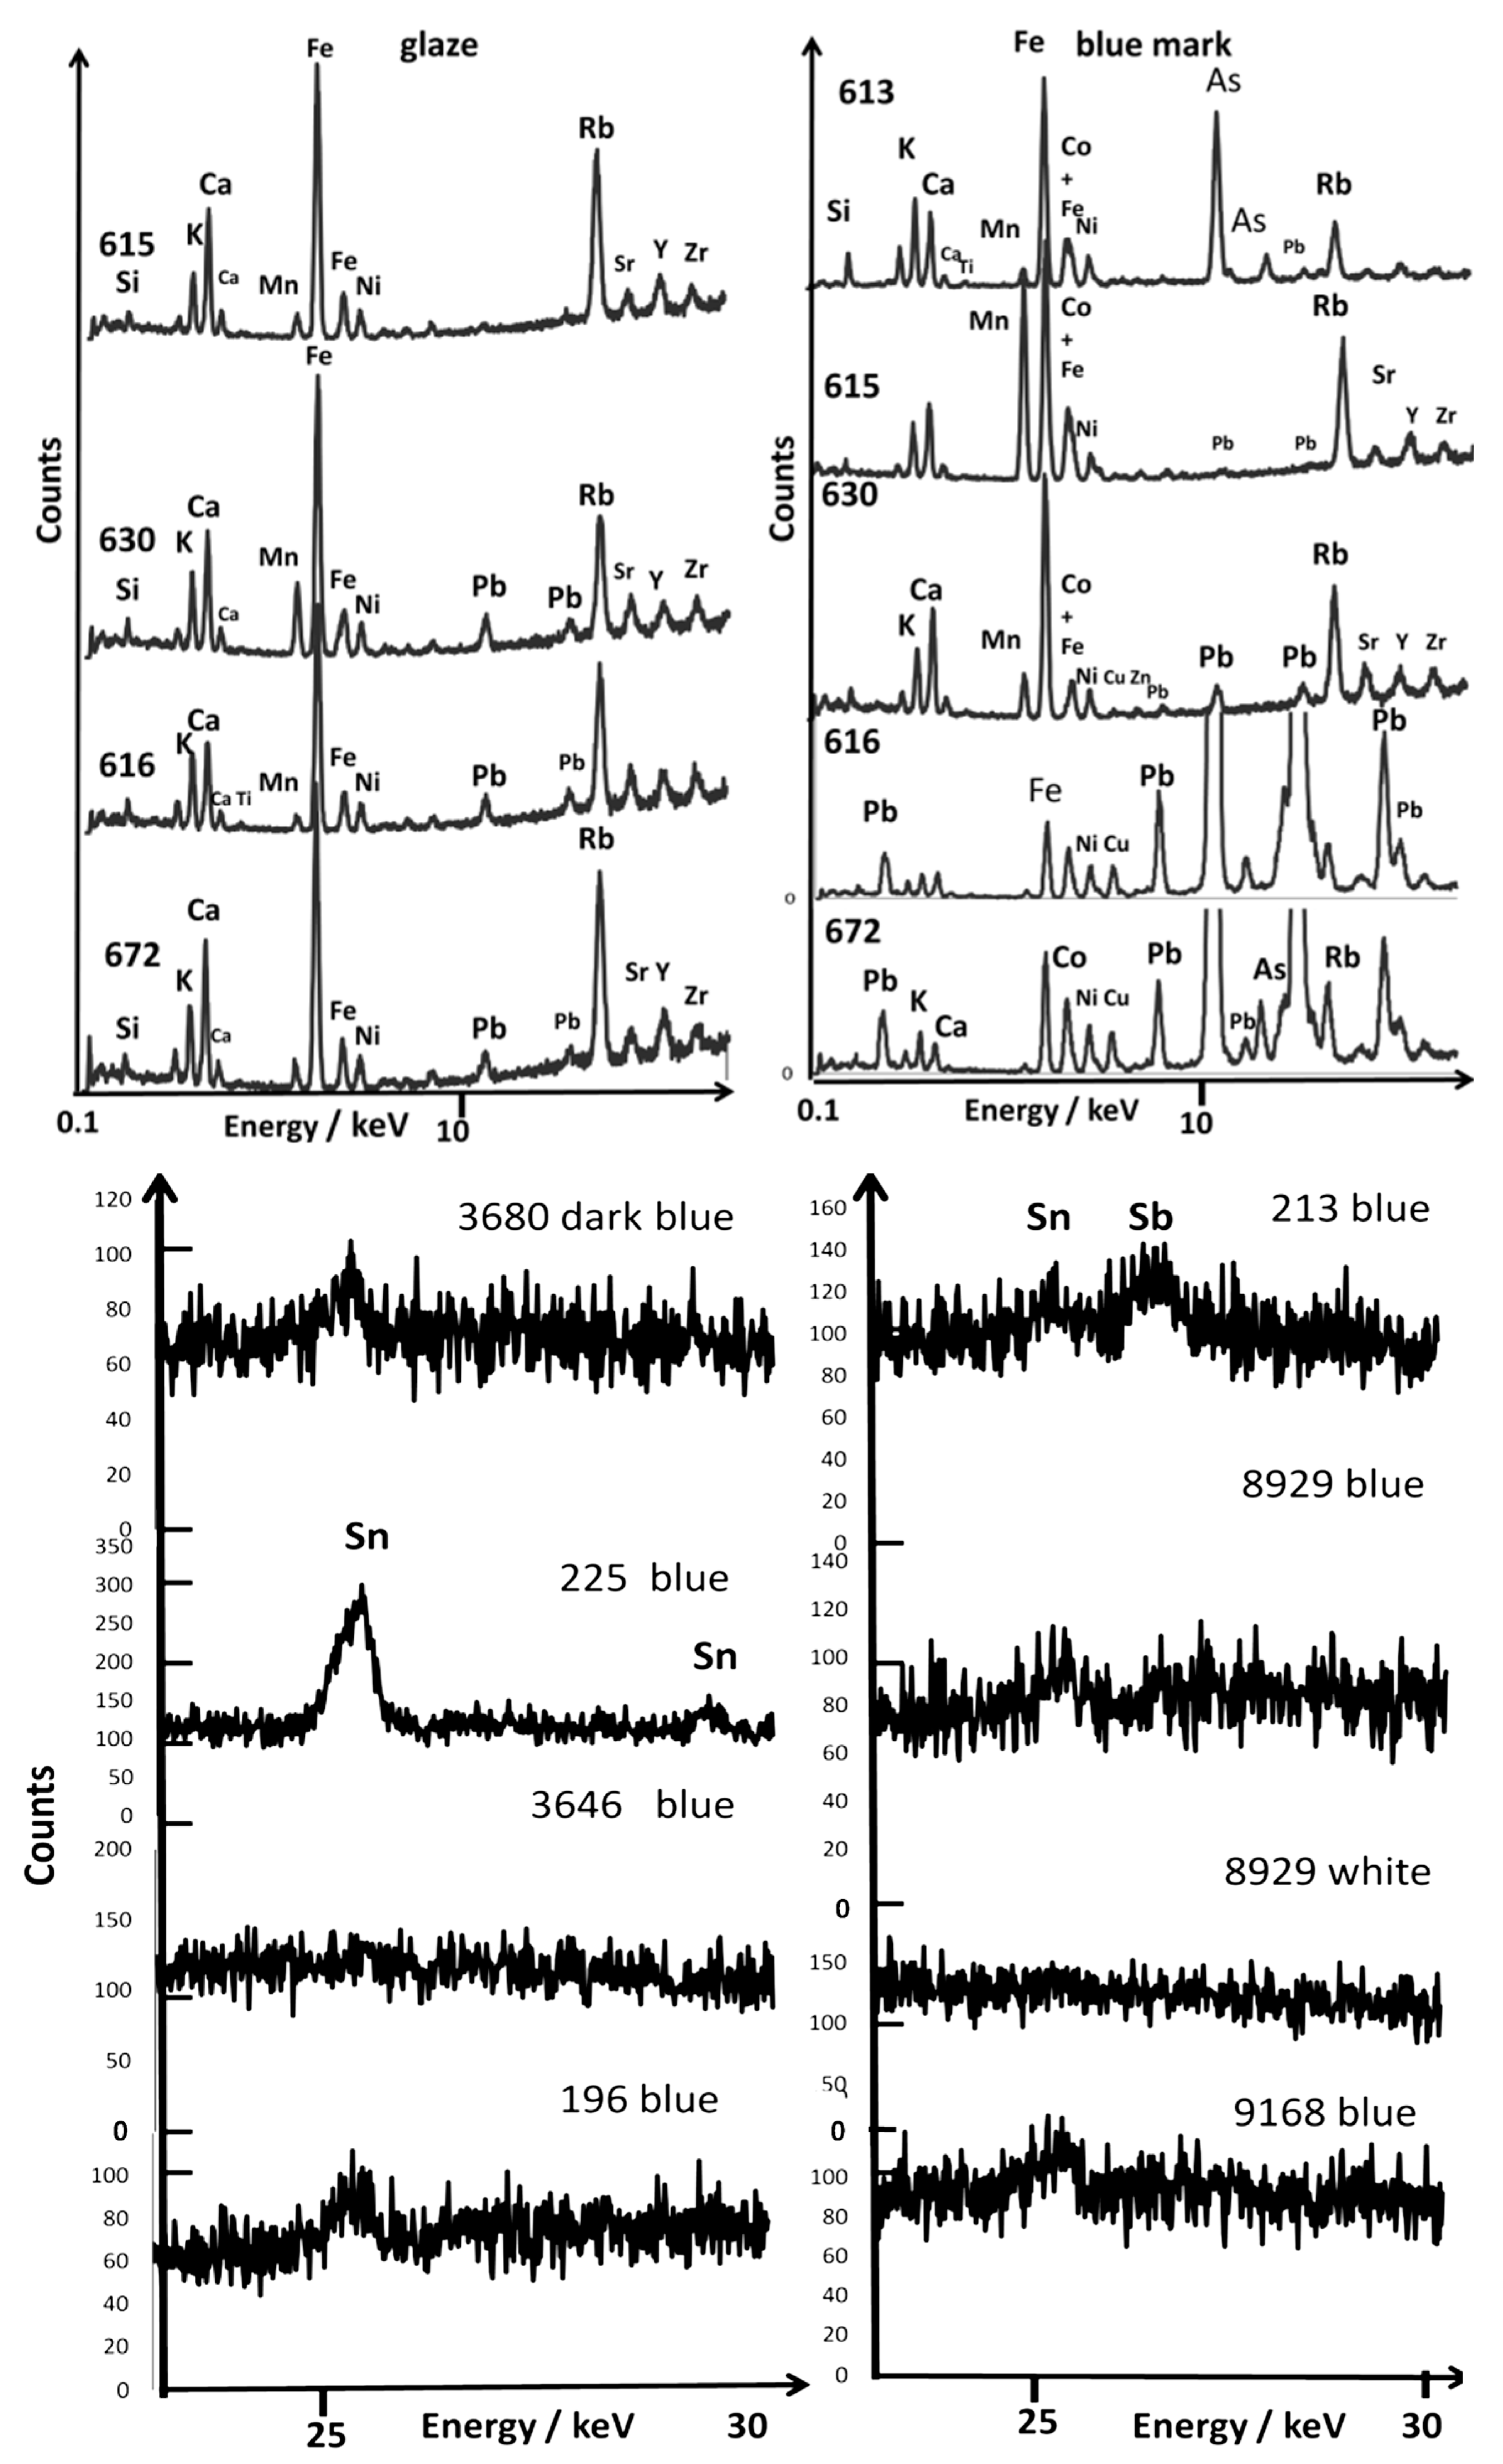
3.1. Comparison Paste–Glaze–Overglaze
3.2. European and Asian ‘Cobalt’
3.3. Comparison of Reign Marks
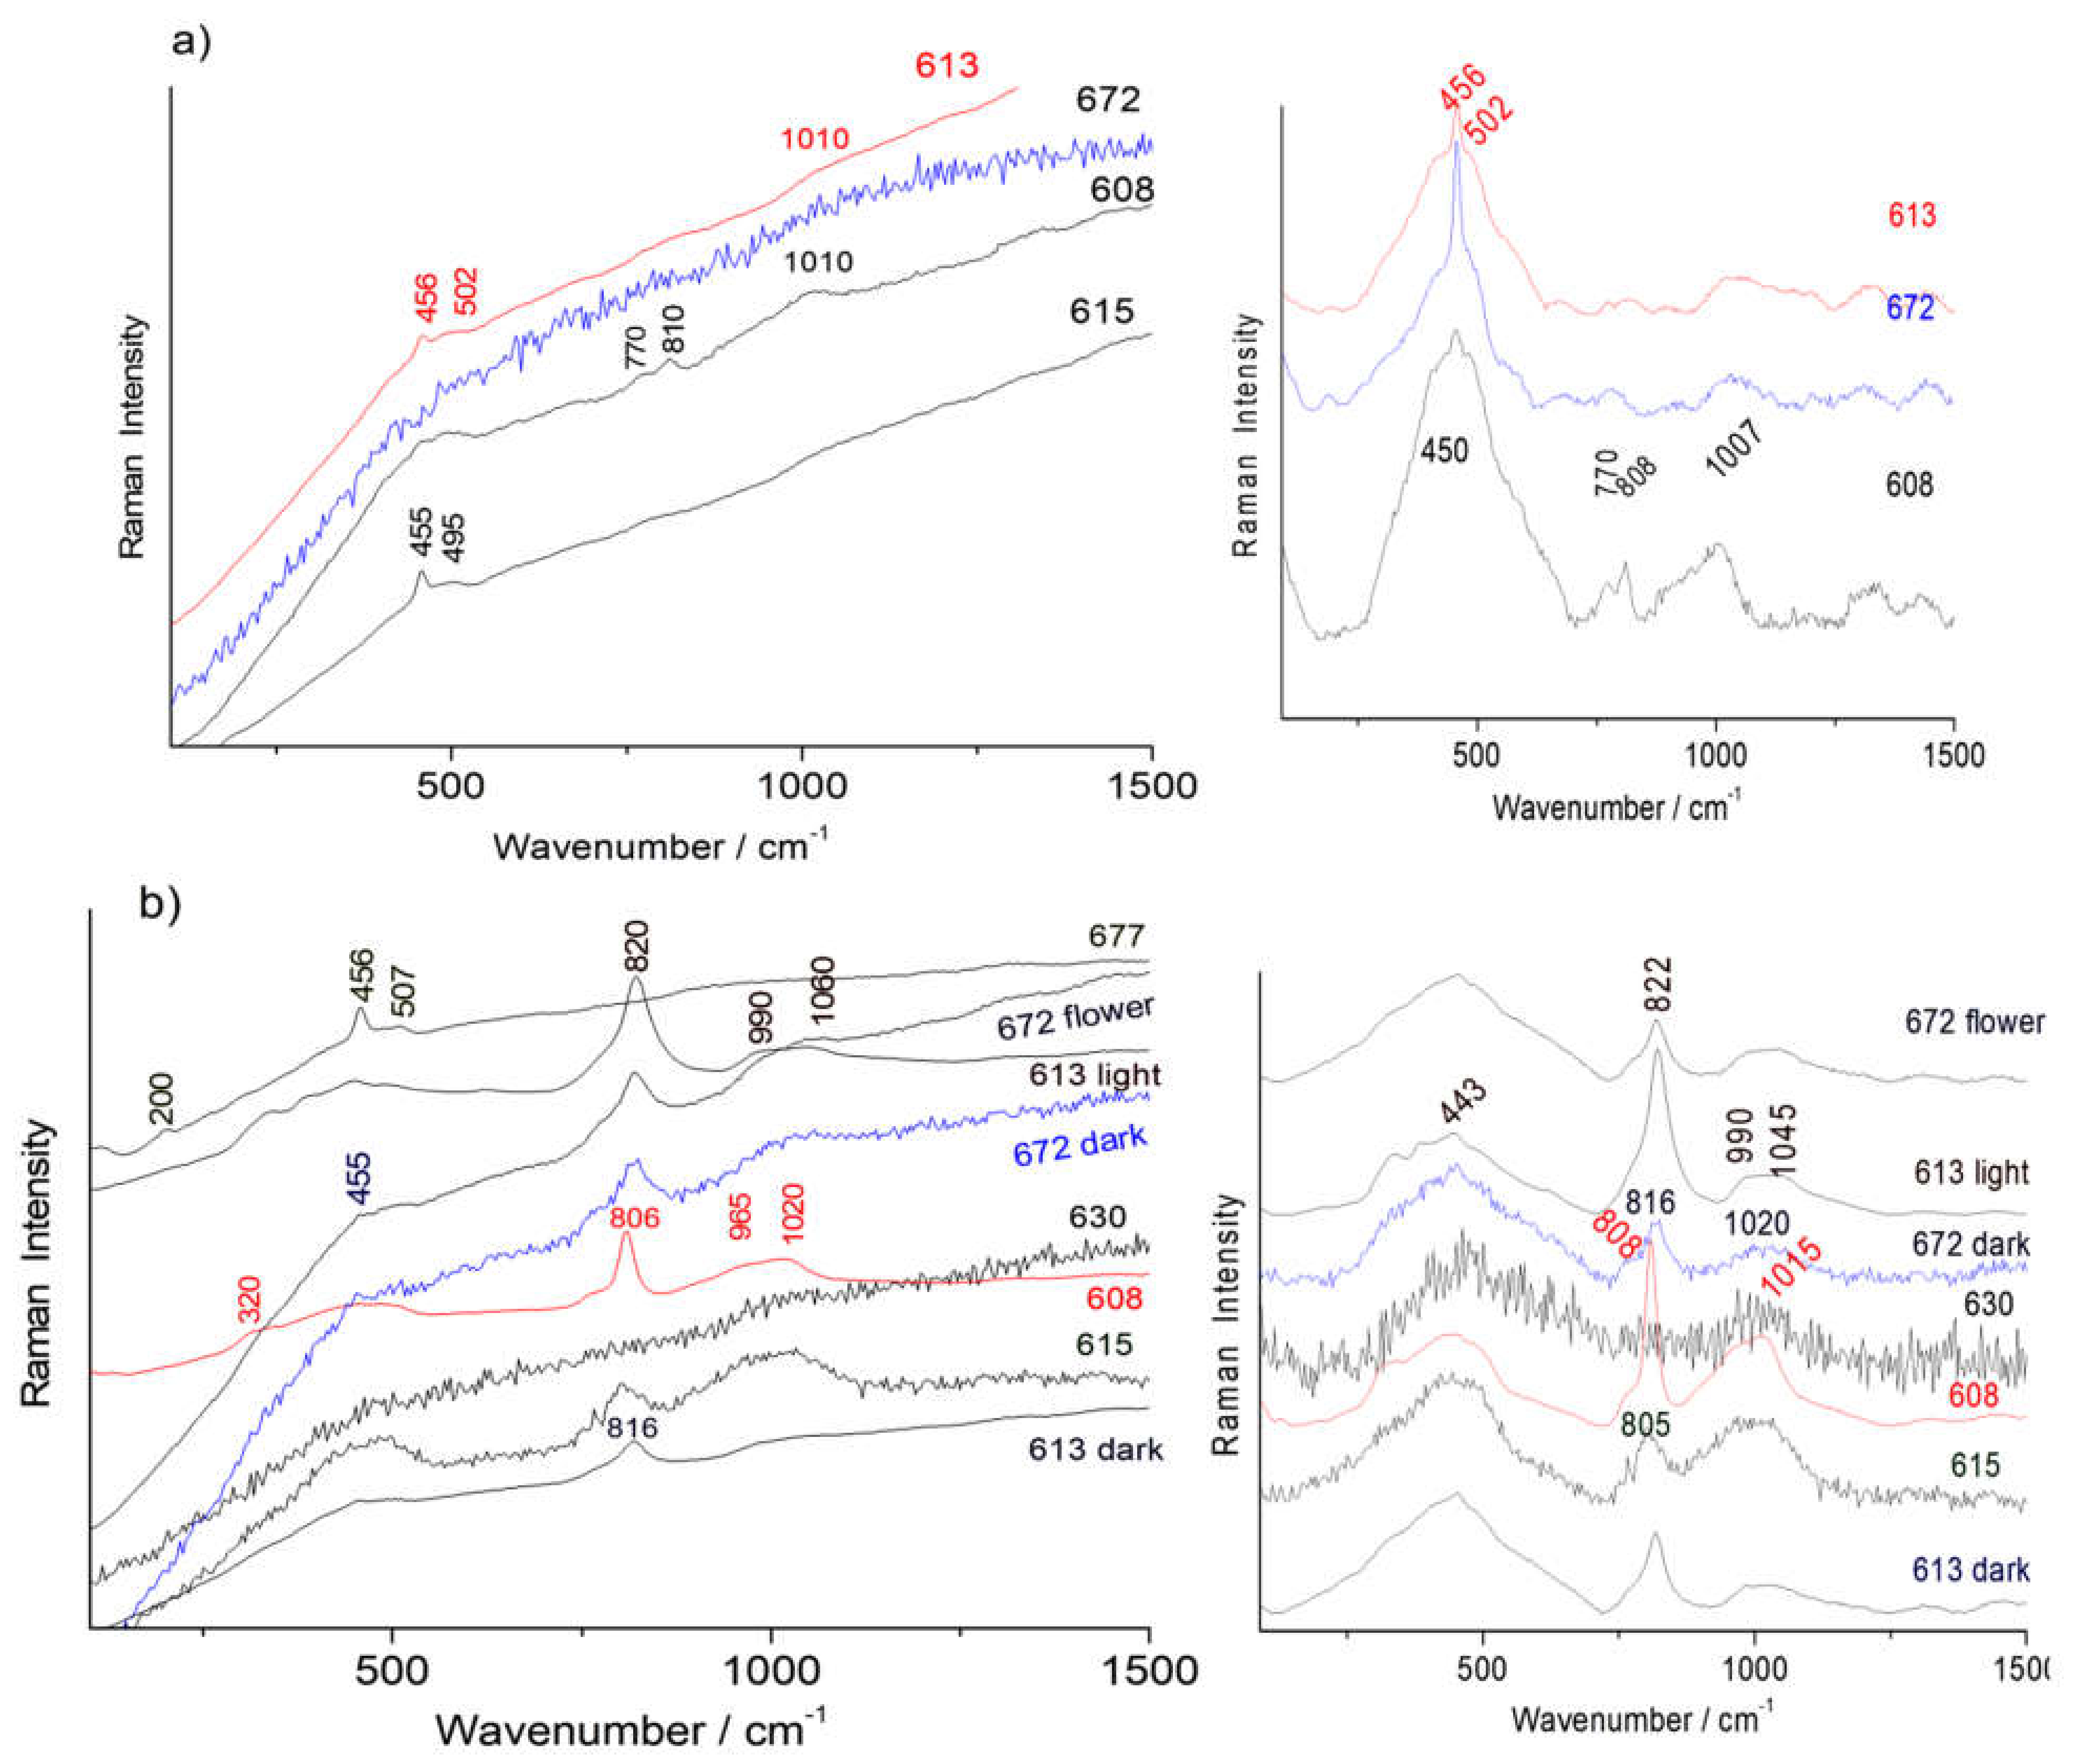
3.4. Phases with Raman Identification
- -
- (i) The spectra of blue-colored areas of bowl A 677 (background) and bowl A 630 (flower) are similar to those recorded on the blue marks (A 613, A 672, A 615 bowls) with the characteristic bending peak of quartz (~455 cm−1) and glassy phase (peak between 495 and 502 cm−1), representative of a glaze fired at a higher temperature with the porcelain paste. The coloring is hence obtained by dissolving the cobalt ions in the glaze, which is a traditional technique [23,33];
- -
- (ii) The spectra of A 608 (dish mark), A 613, A 615 and A 672 (bowls) show a stretching SiO4 mode around 1000–1020 cm−1 with a lower wavenumber component, characteristic of the addition of lead [30,31,32,91,92,93]. The modes at ~780 and 815 cm−1, which are characteristic of the As-O stretching mode of a lead arsenate [11,12,13,21,25,28,32,50], are simultaneously observed. This is consistent with a lead-based enamel promoting the precipitation of lead arsenate by the reaction between the enamel and cobalt source or a deliberate addition of arsenic to whiten the blue color, varying from dark blue to a ‘bleu celeste’ hue.
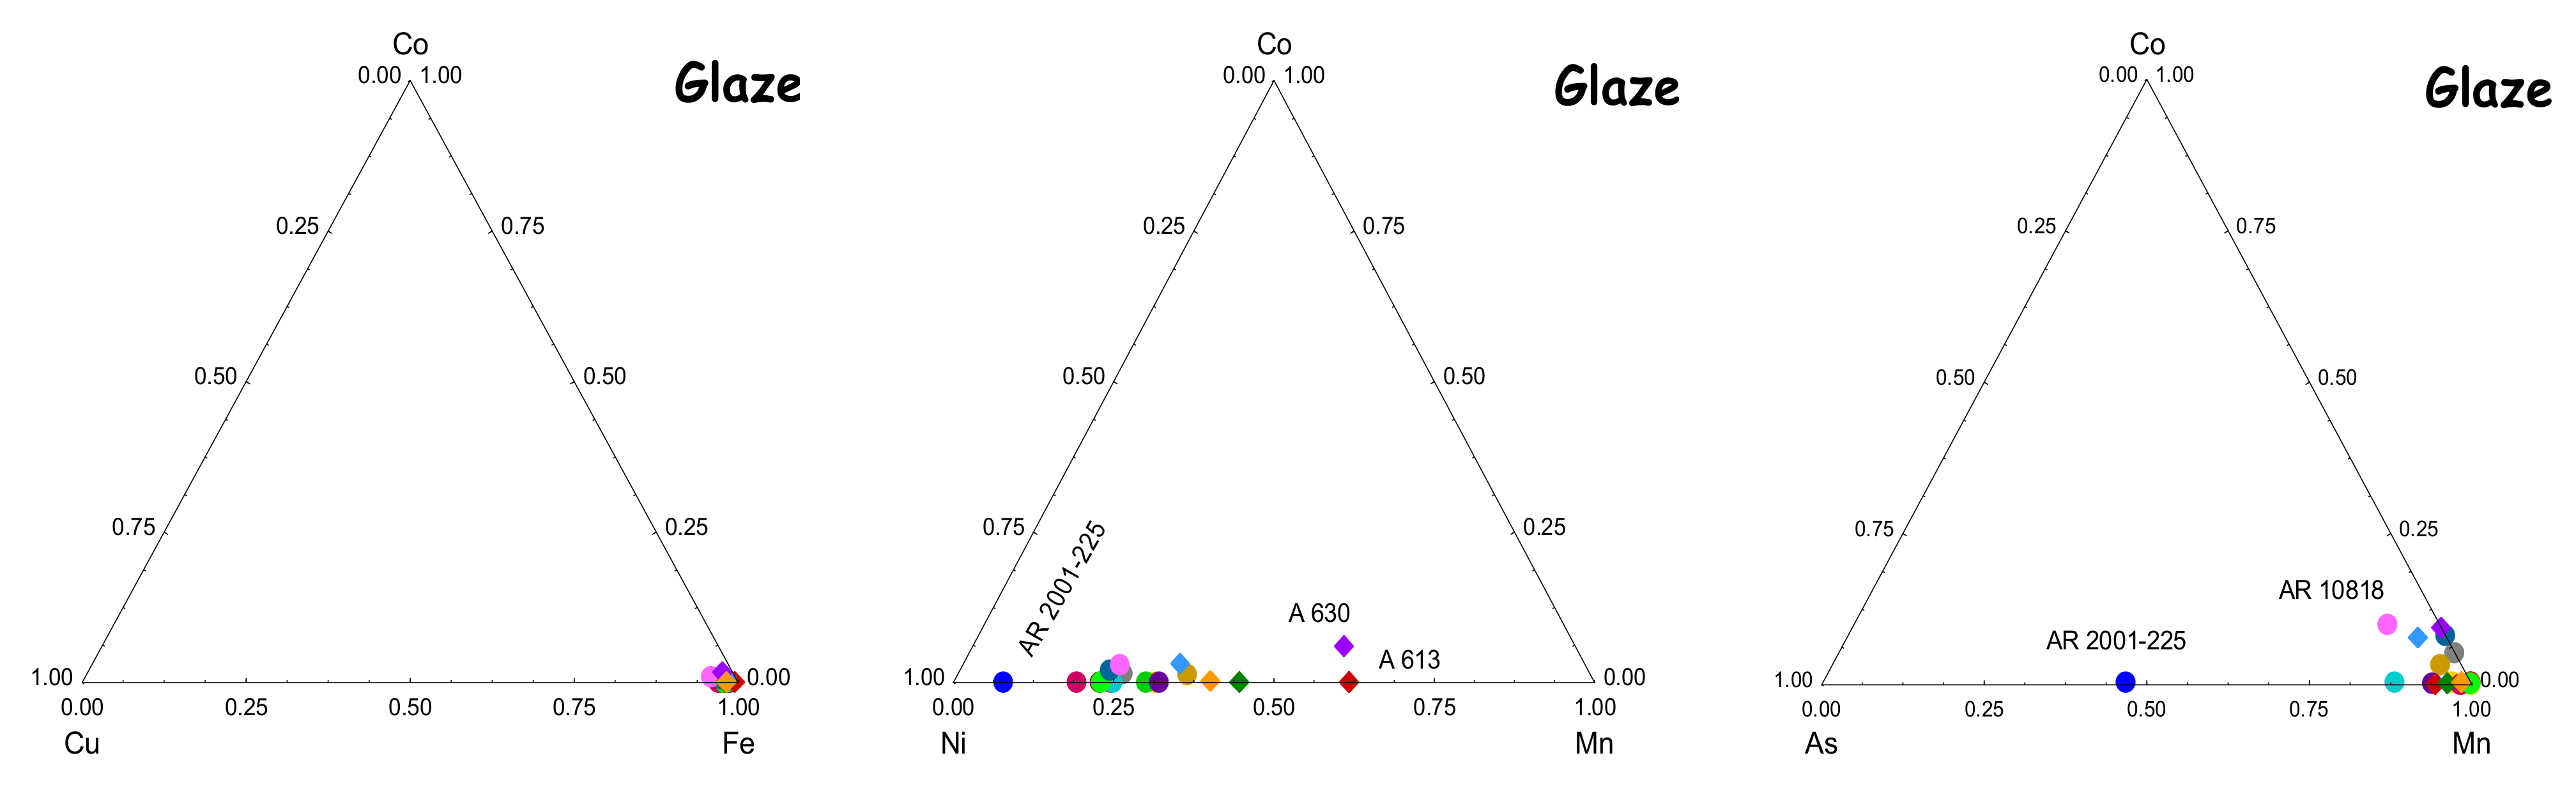
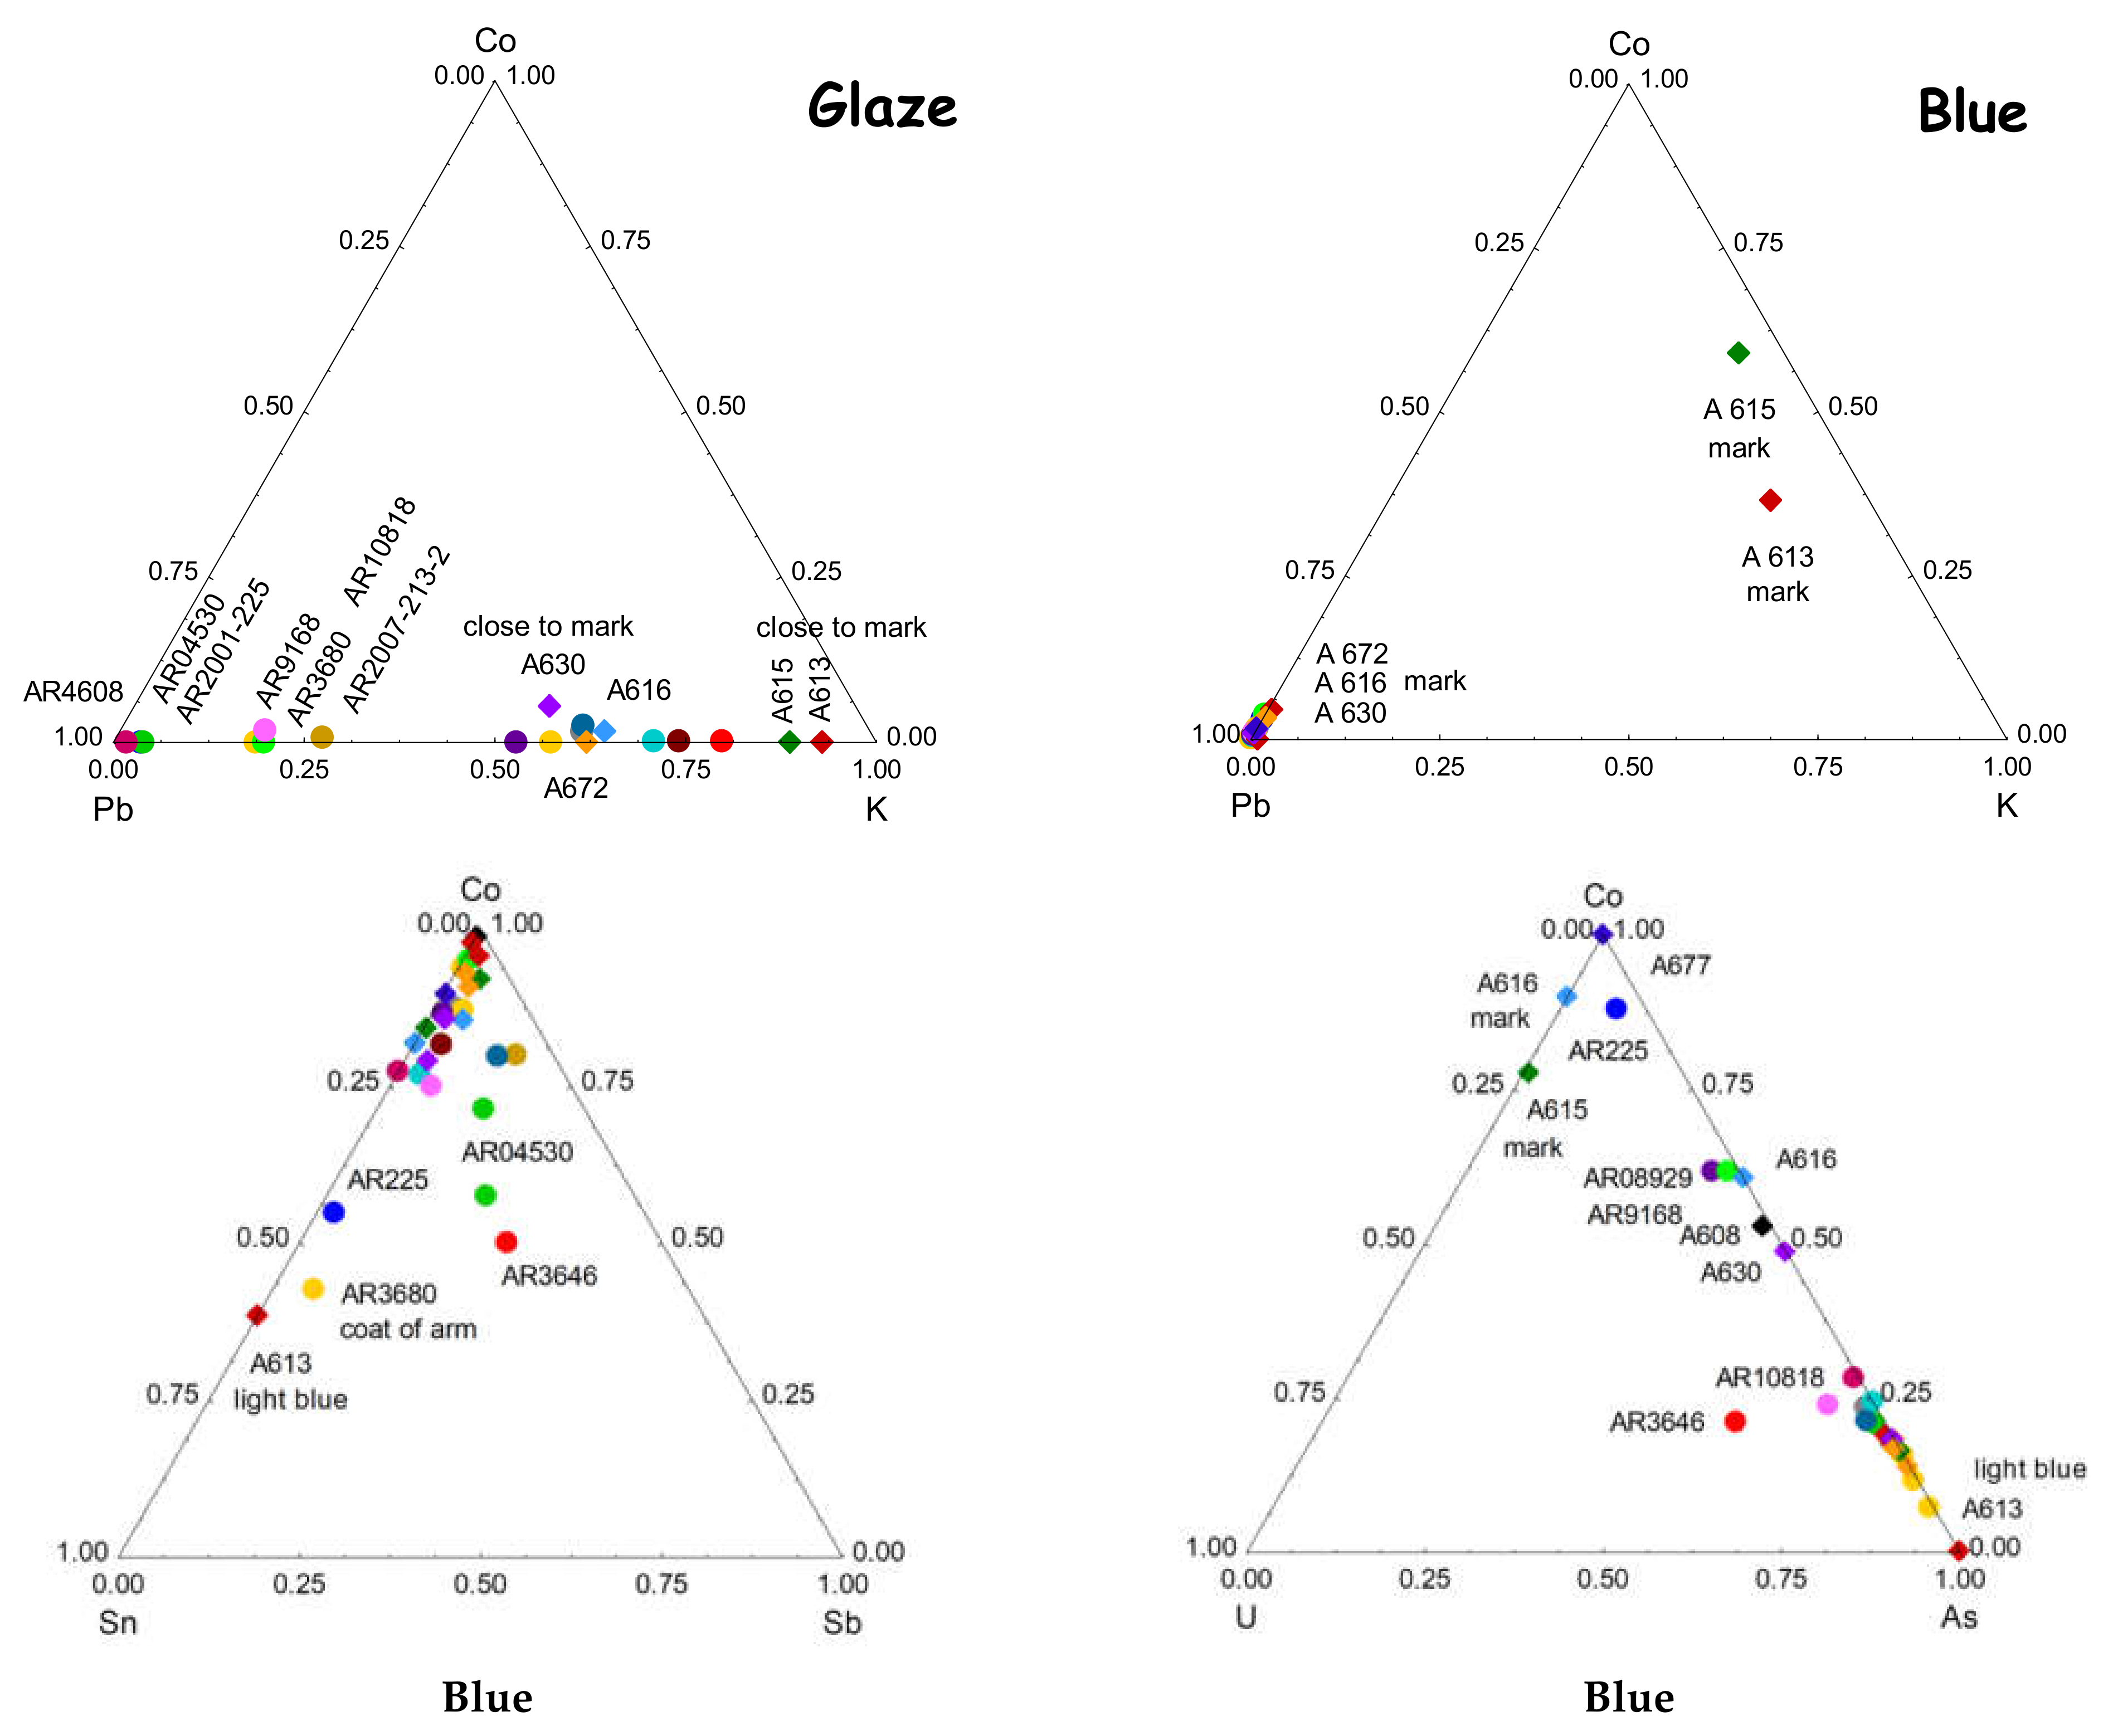
4. Elements Associated with Cobalt
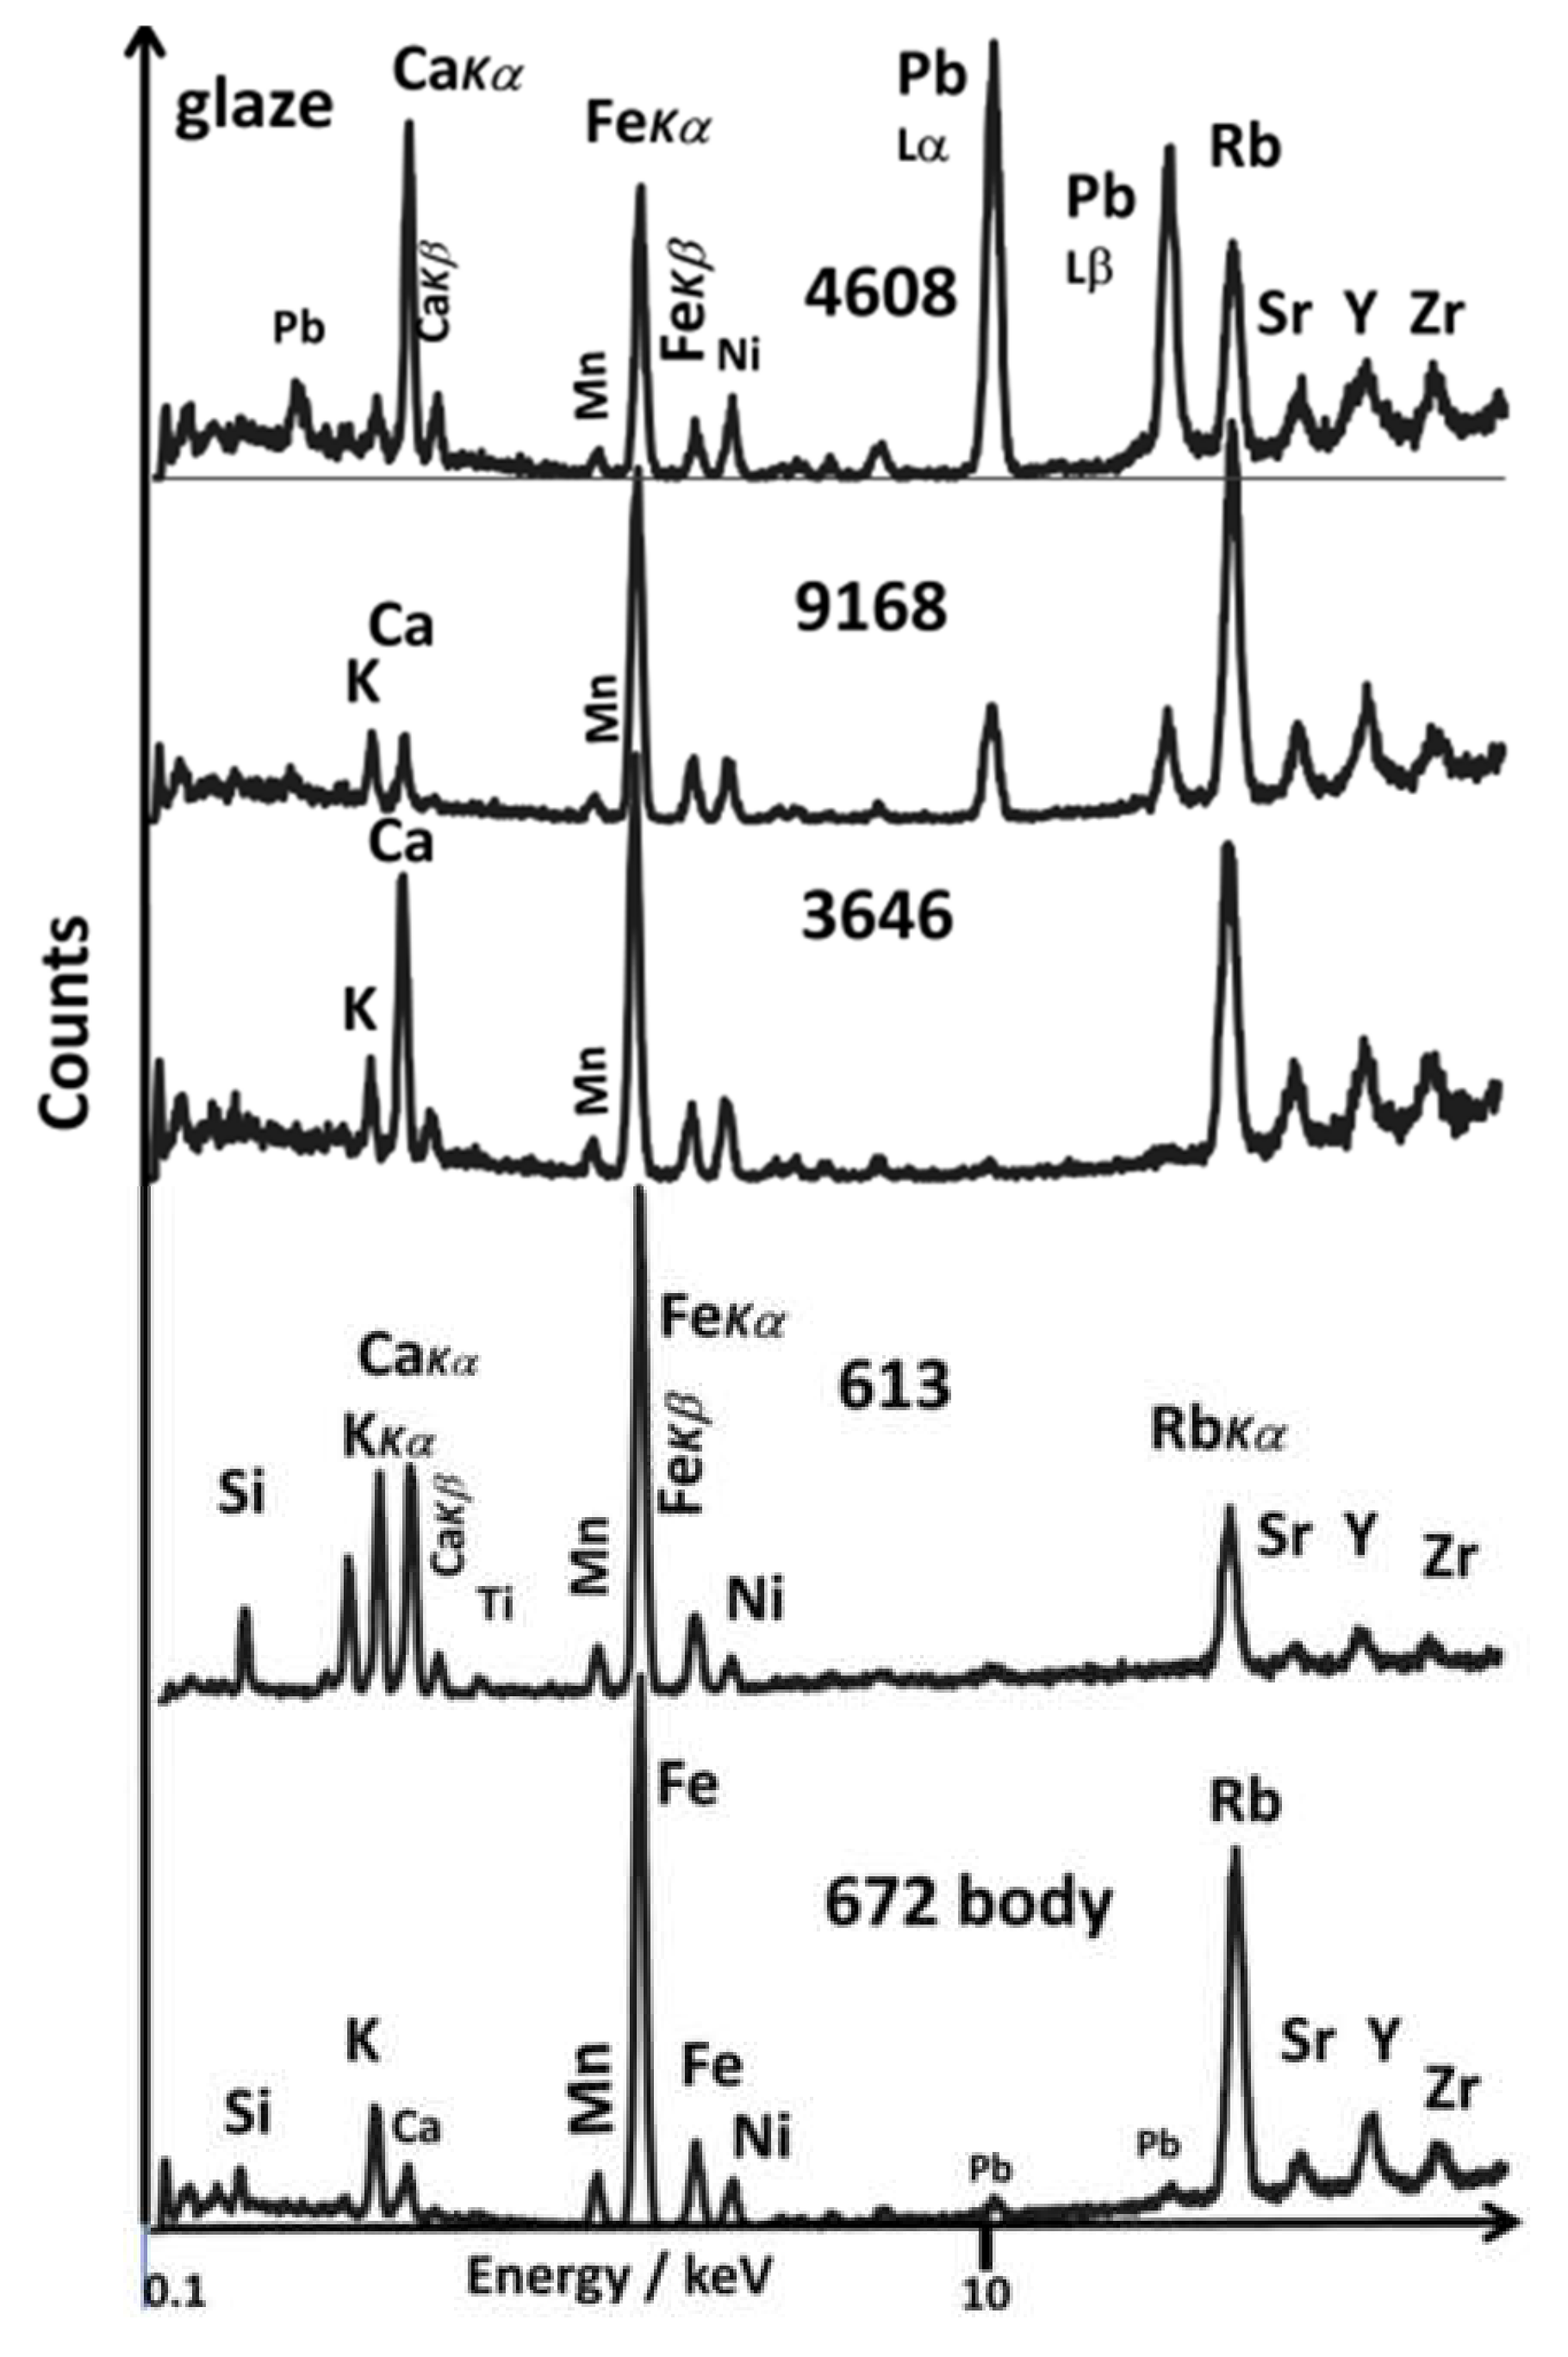
4.1. Glaze
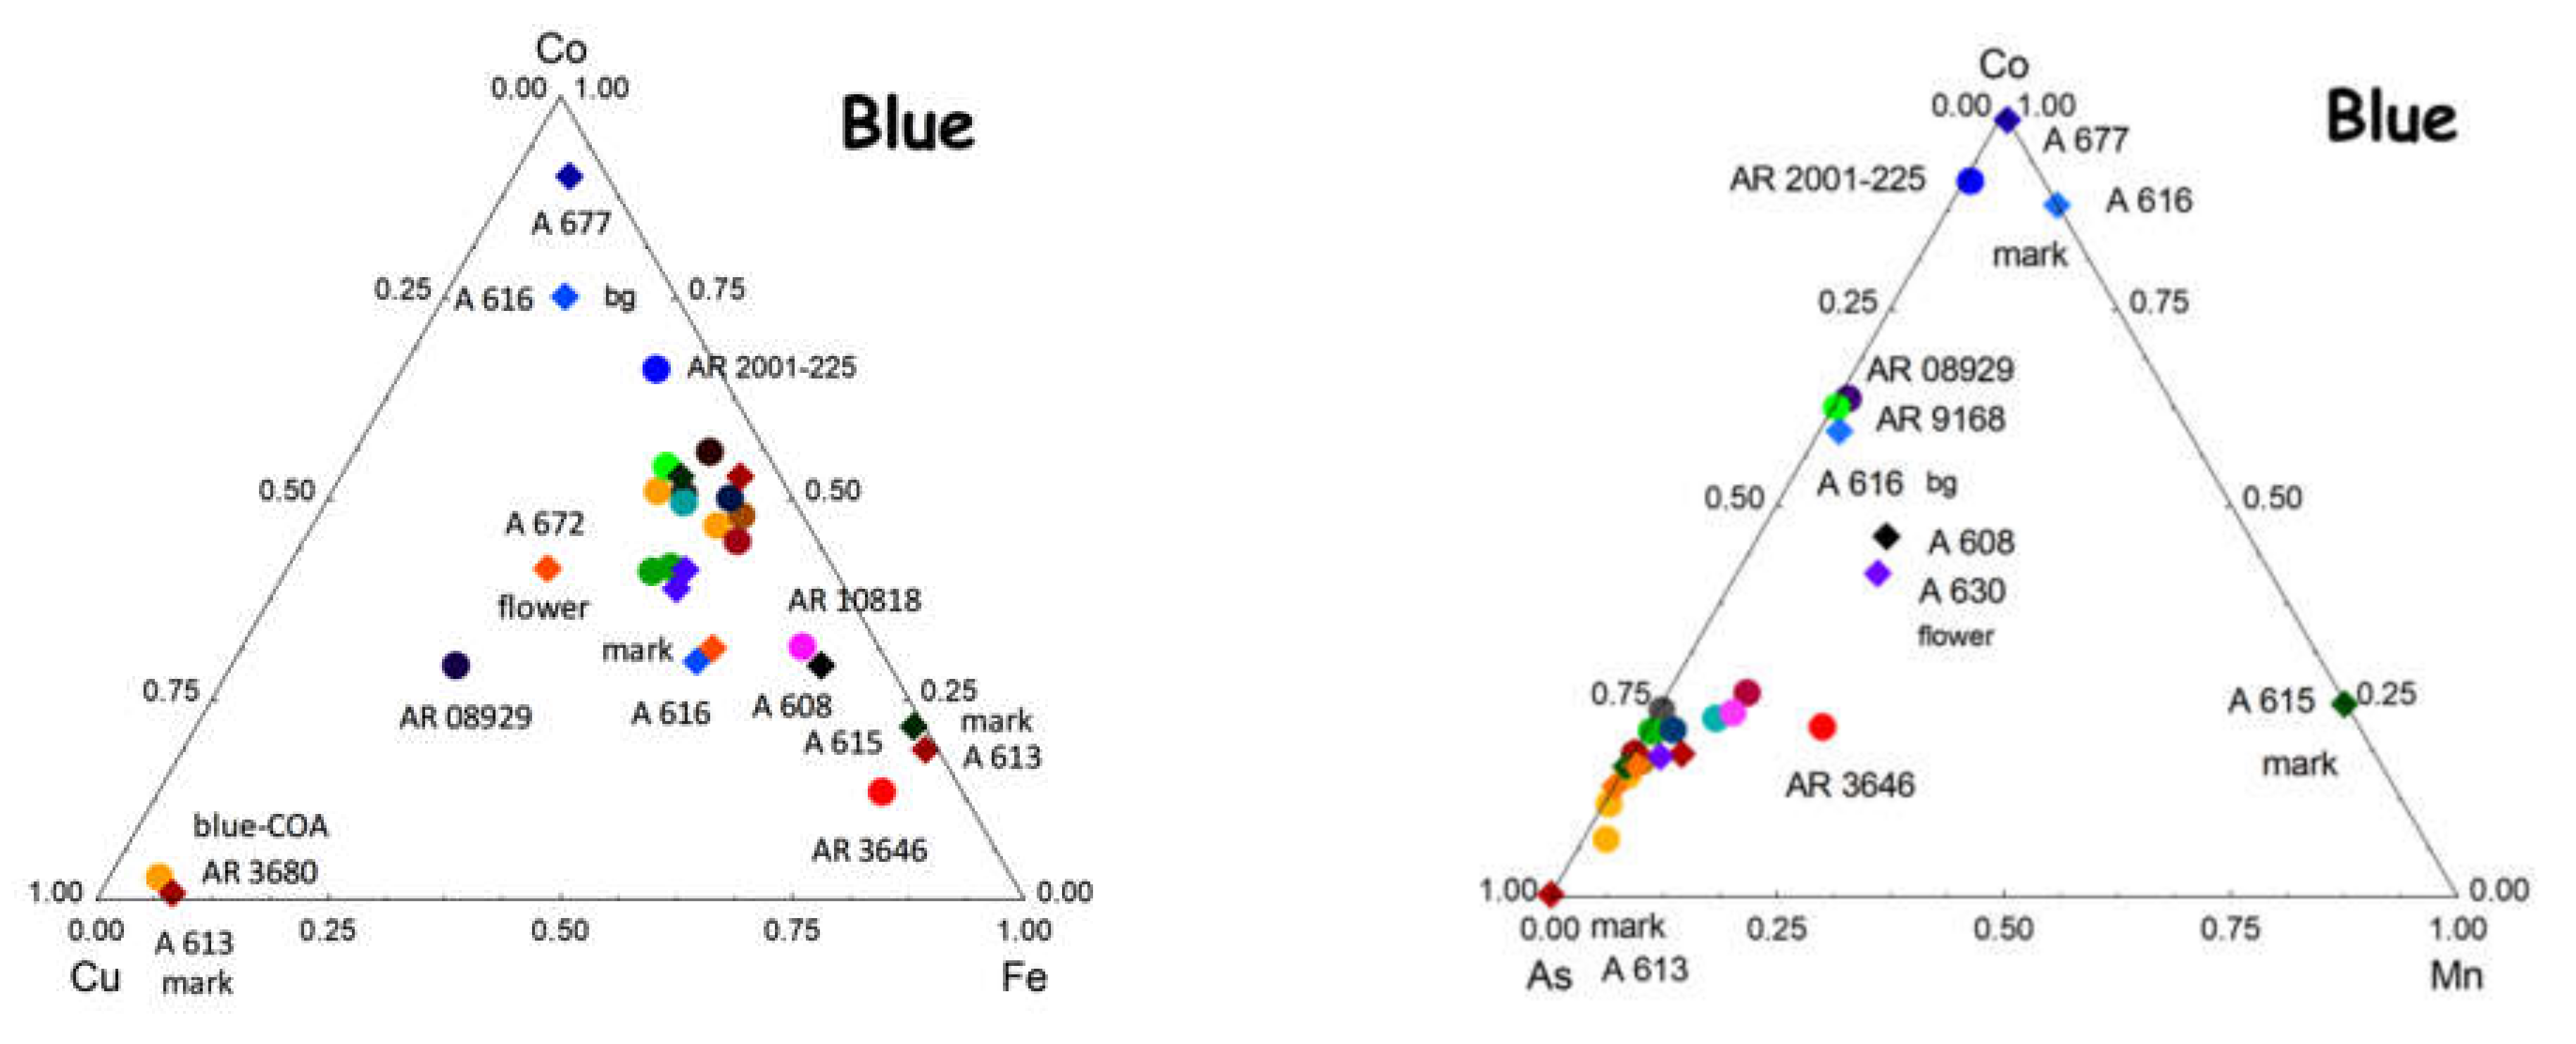
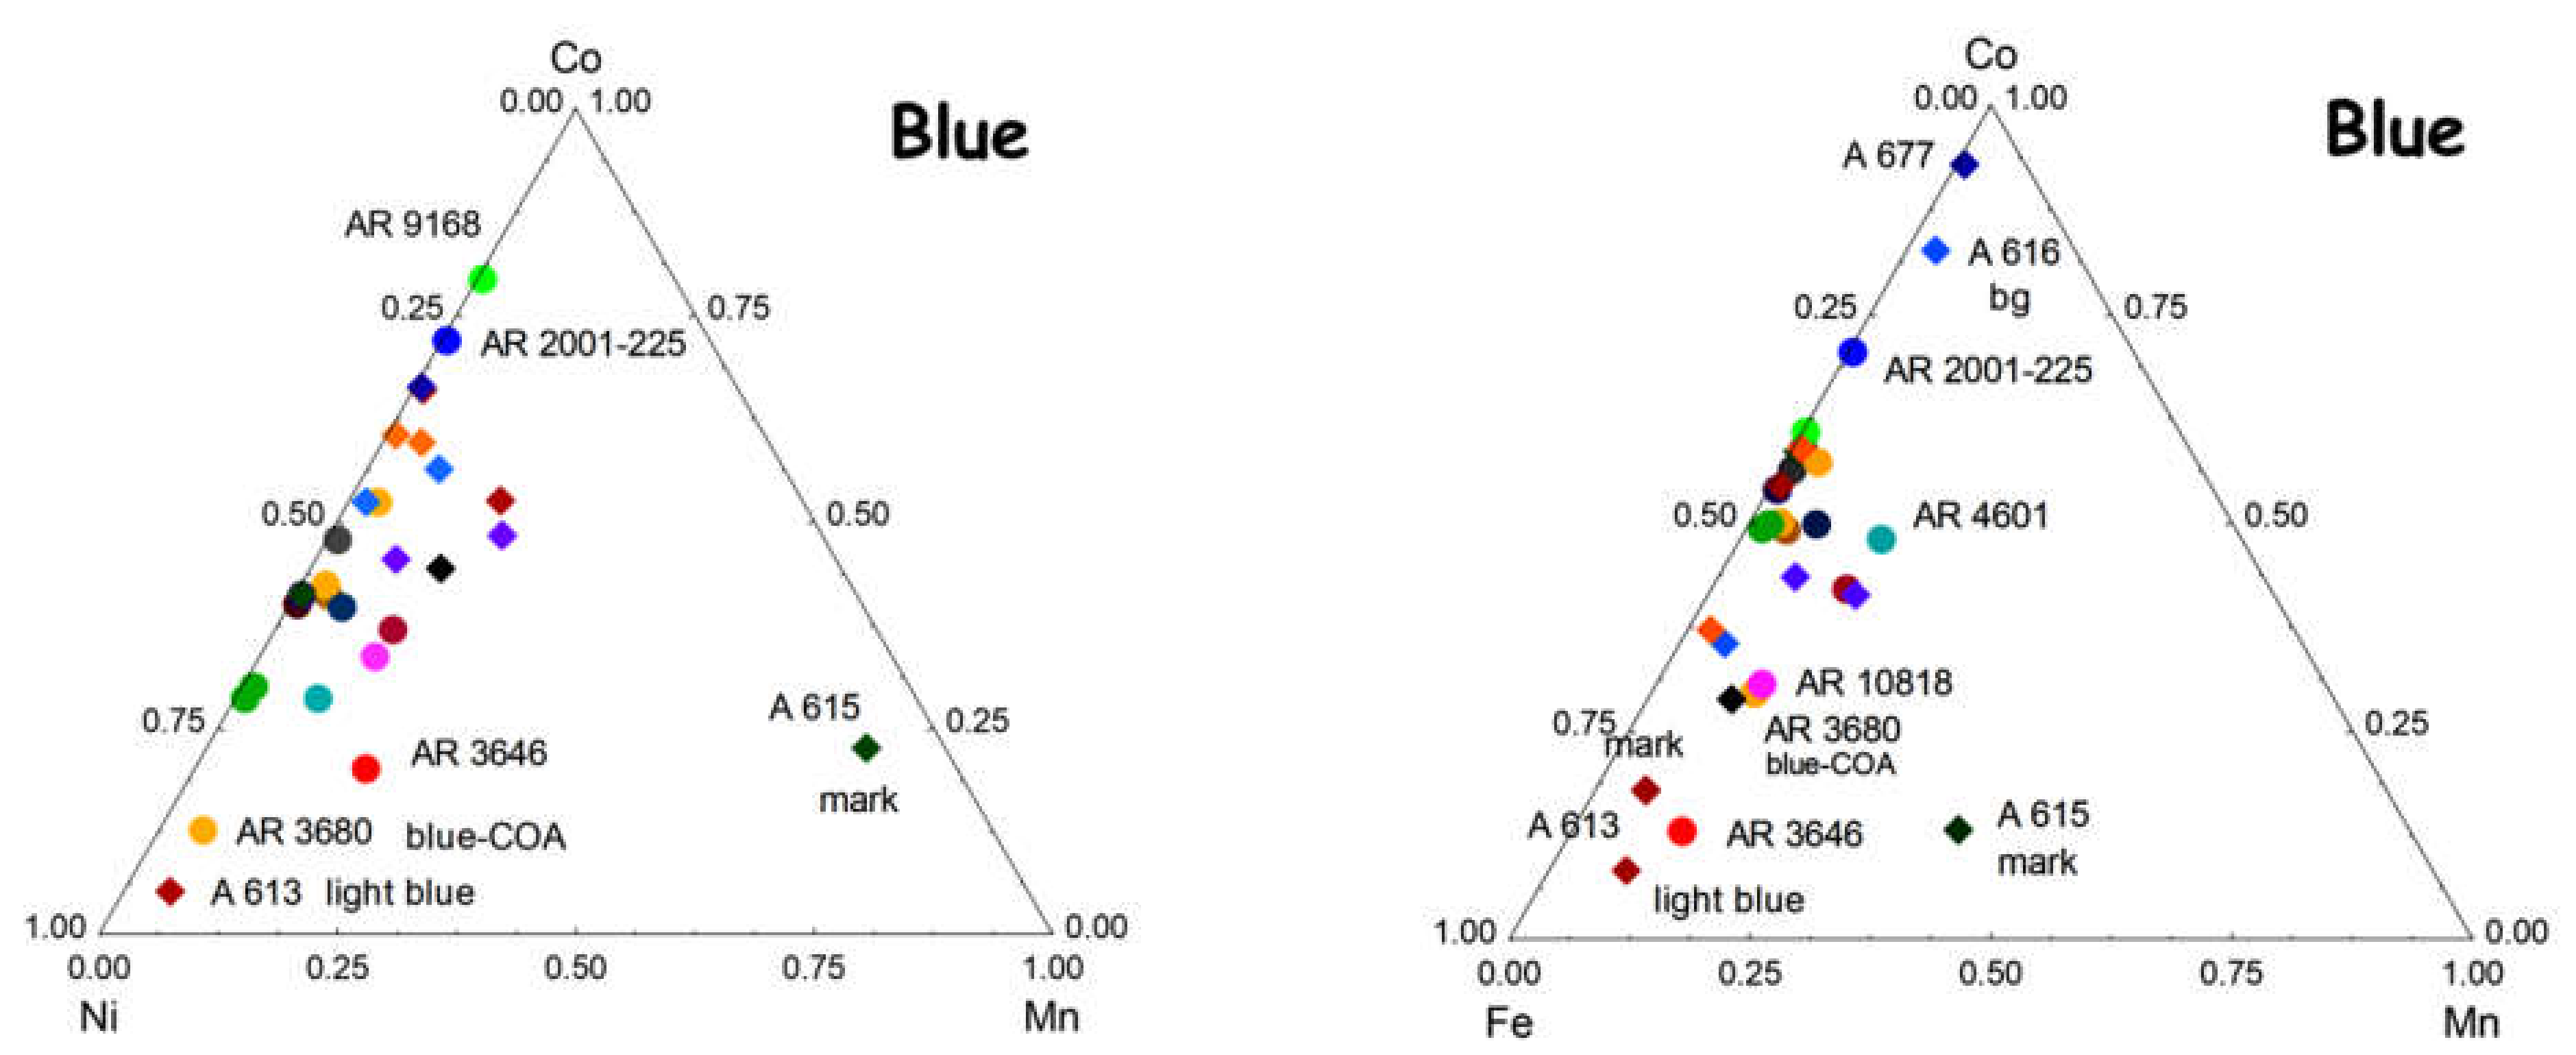
4.2. Blue Areas
- -
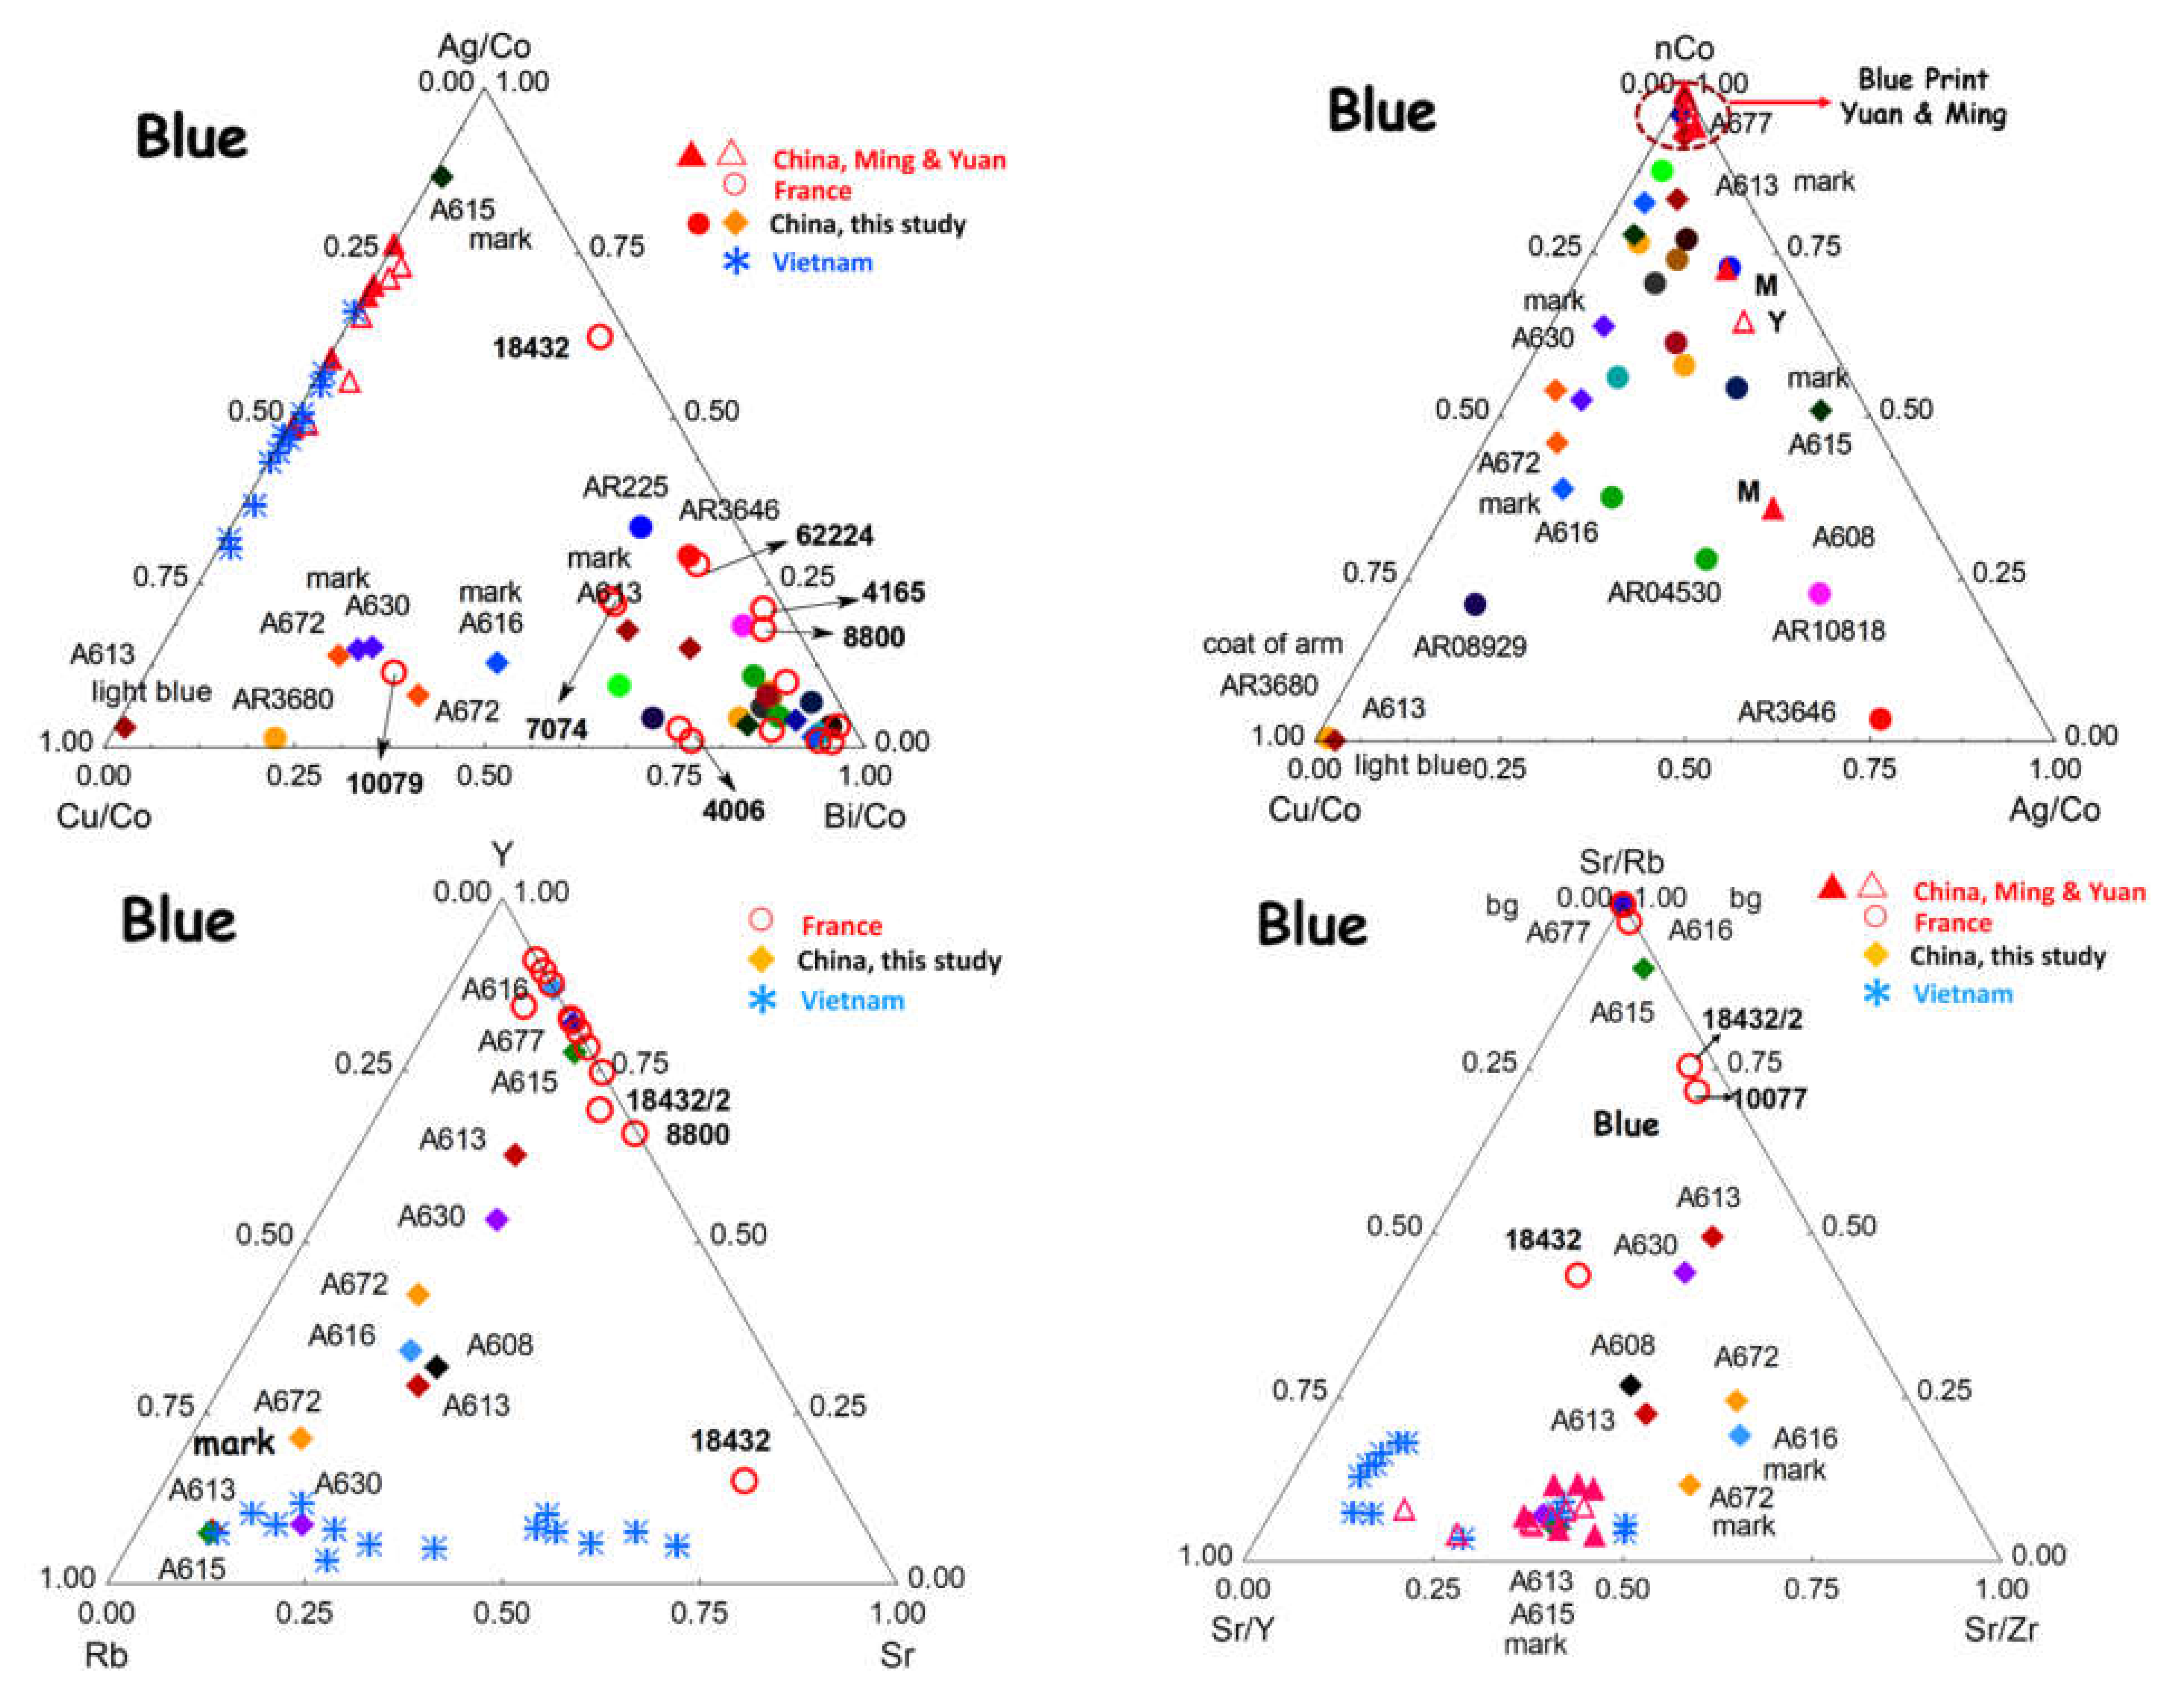
- Arita porcelain (AR 8929, Japan): The blue is almost free of Mn, low in As and Ag but with Cu and a remarkably large amount of Bi. The observation of a high level of copper is consistent with the very early date of production (before 1700); the presence of bismuth is also consistent with a 17th century European cobalt. Indeed, similar things have been observed for very rare French soft-paste porcelain of the same period [50]. Similar features are observed for the A 613 mark and the coat-of-arms of the armorial porcelain dish (AR 3680), but not for the other blue areas of this dish; this indicates that copper was added to adjust the hue. On the contrary, as for Arita porcelain, the Cu-rich A 613 mark is consistent with a production of this bowl with a Kangxi mark with the ingredients first imported by Jesuits around 1690. Bowl A 613 is potentially also due to the characteristics of its gold decoration, one of the first pieces made under Kangxi with European recipes.
- -
- The plate (AR 2001-225) is assigned to the Meissen factory (Saxony): The cobalt is quite pure, free of manganese and almost free of As, Ni and Fe, as are the A 677 decoration and the A 616 mark. Such a level of purity is strange, and the assignment of artifacts must be questioned. More artifacts assigned to the Meissen factory should be analyzed to draw a reasonable conclusion from these data.
- -
- Bowls A 677 (attributed with reserves to the reign of Kangxi) and A 616 (attributed to the reign of Yongzheng, also with reserves) show the use of rather pure cobalt for the background: a smaller Fe and Cu and no Mn content. Assignment of the A 677 decoration made after 1850 is thus reasonable. The mark of the A 616 bowl uses a rather pure cobalt, but some other characteristics come close to those ascertained in the main group. The question now arises: is that consistent with the addition of the overglazed mark perhaps made on the bowl many years after its production?
- -
- The 19th century box (AR 9168) is distinguished by its lower Mn content. A higher purification processing of cobalt ores was made after 1850 [23]. This is consistent with the stylistic assignment.
- -
- -
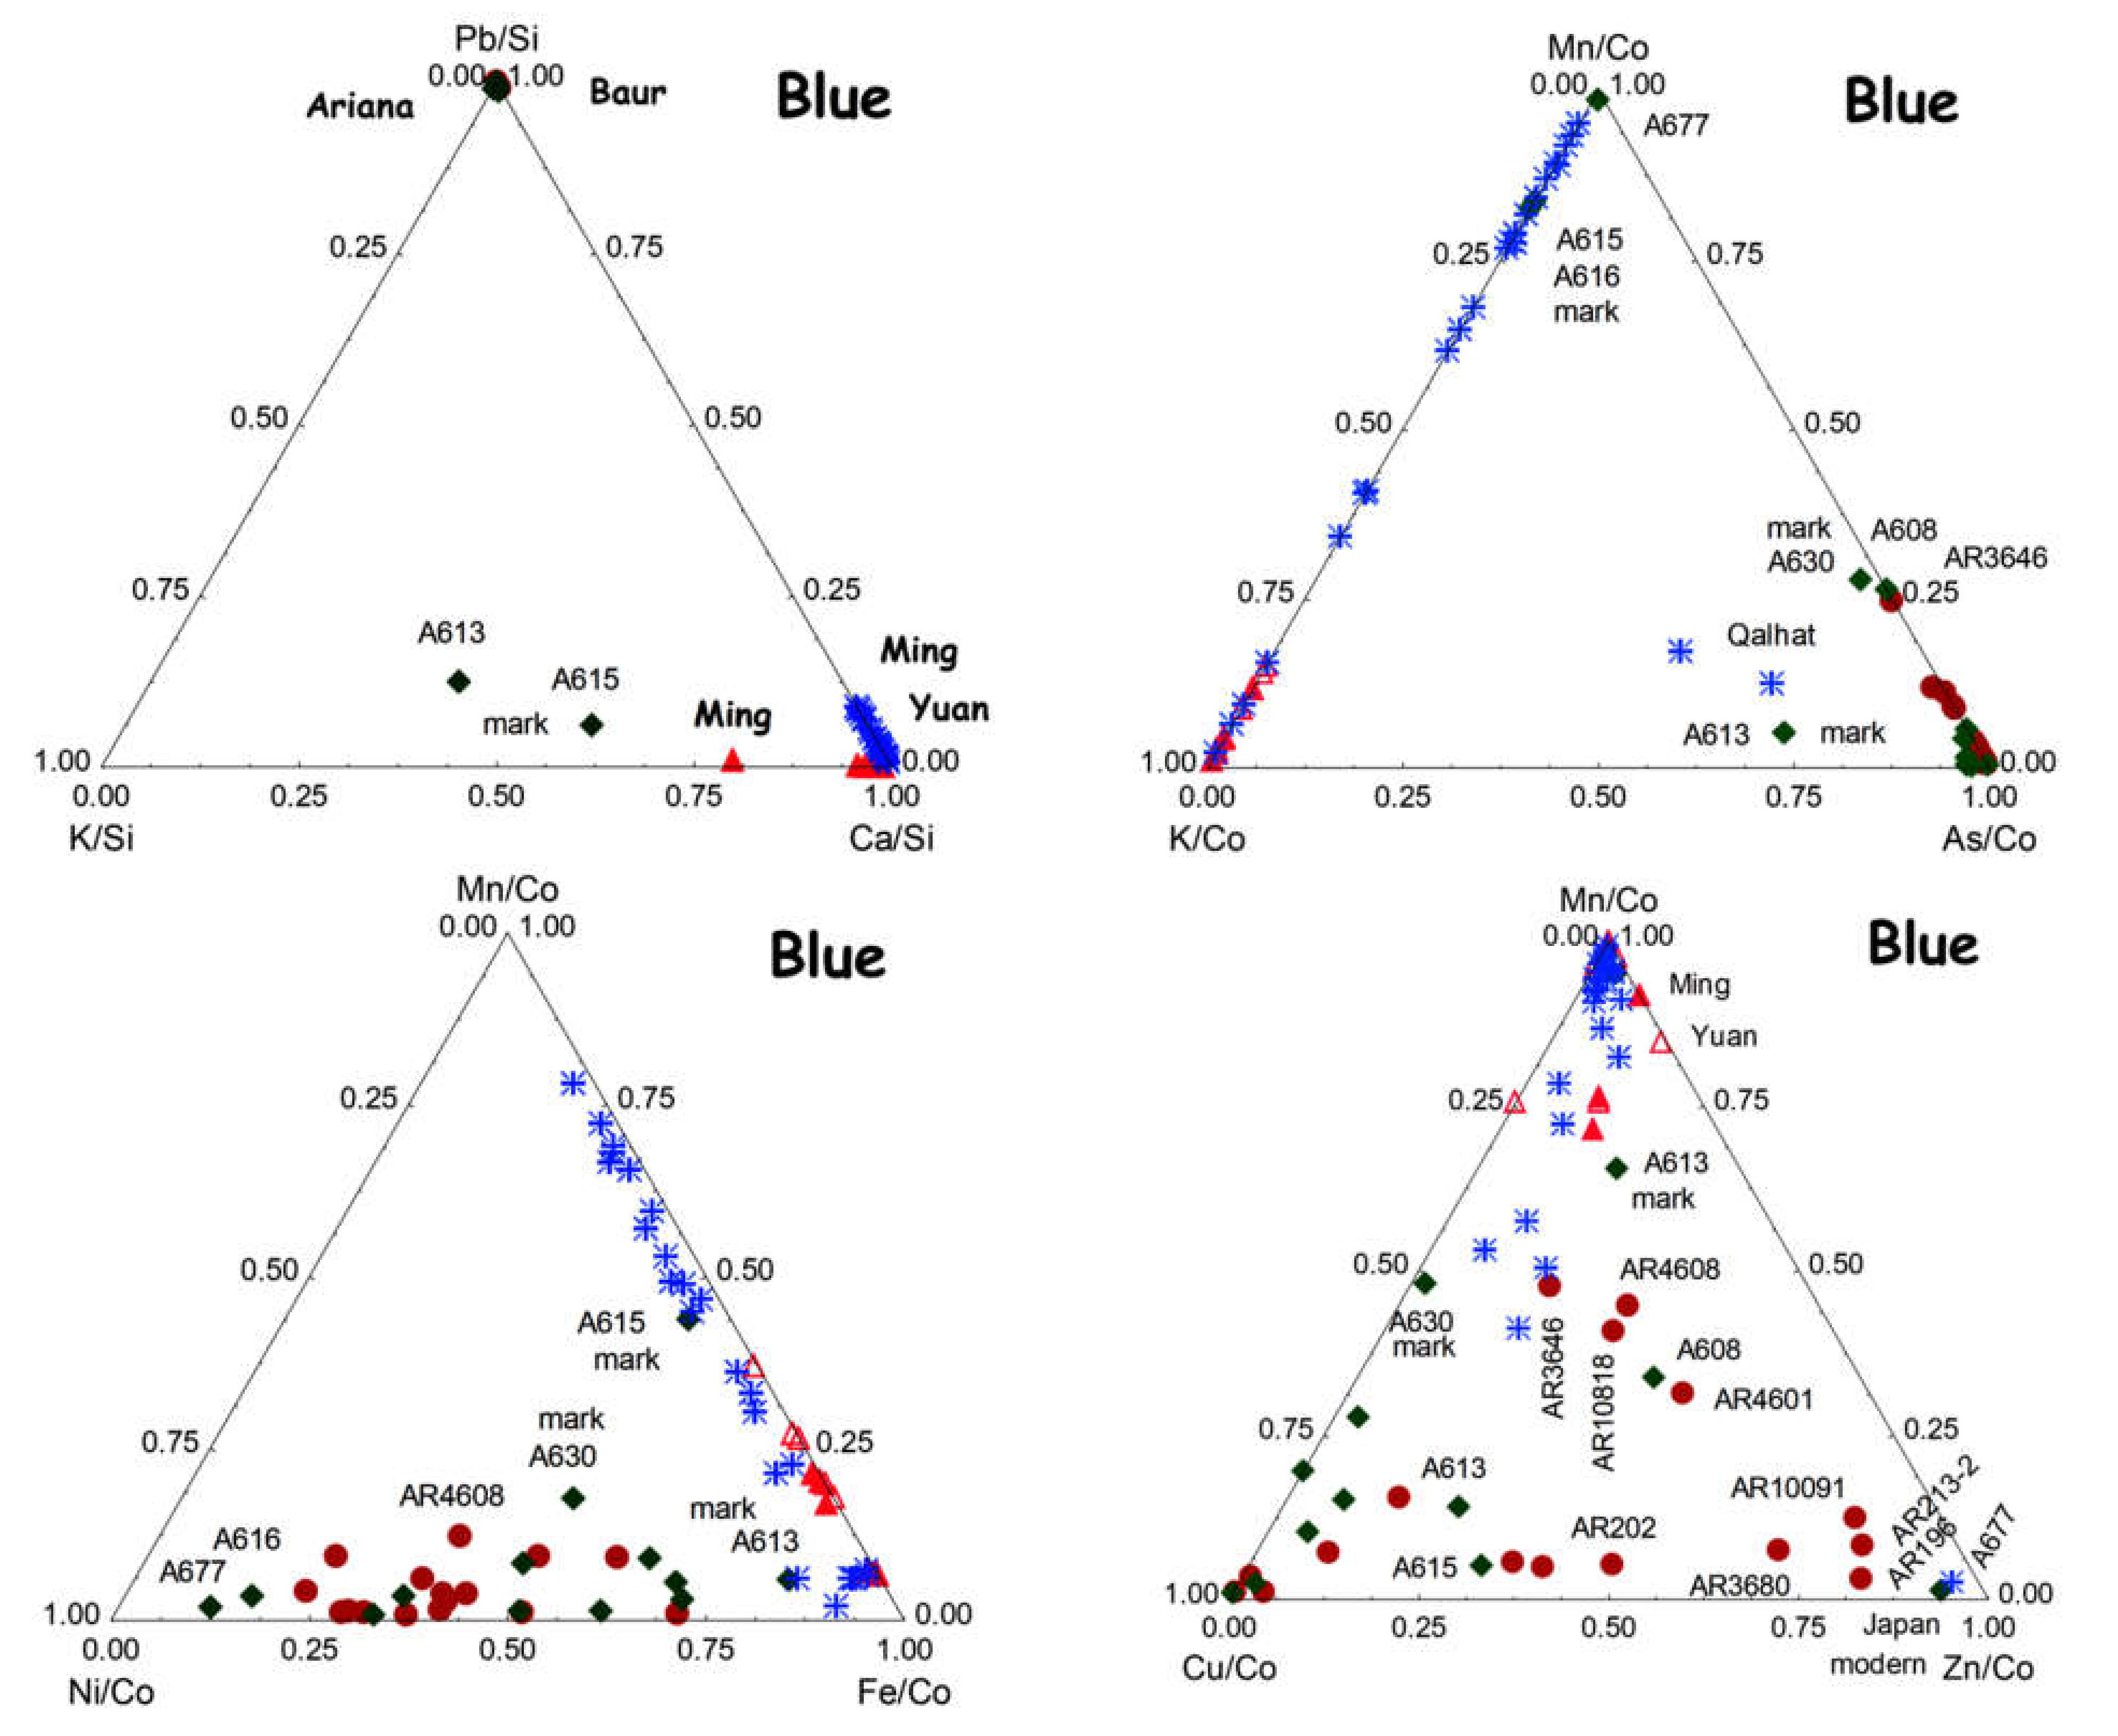
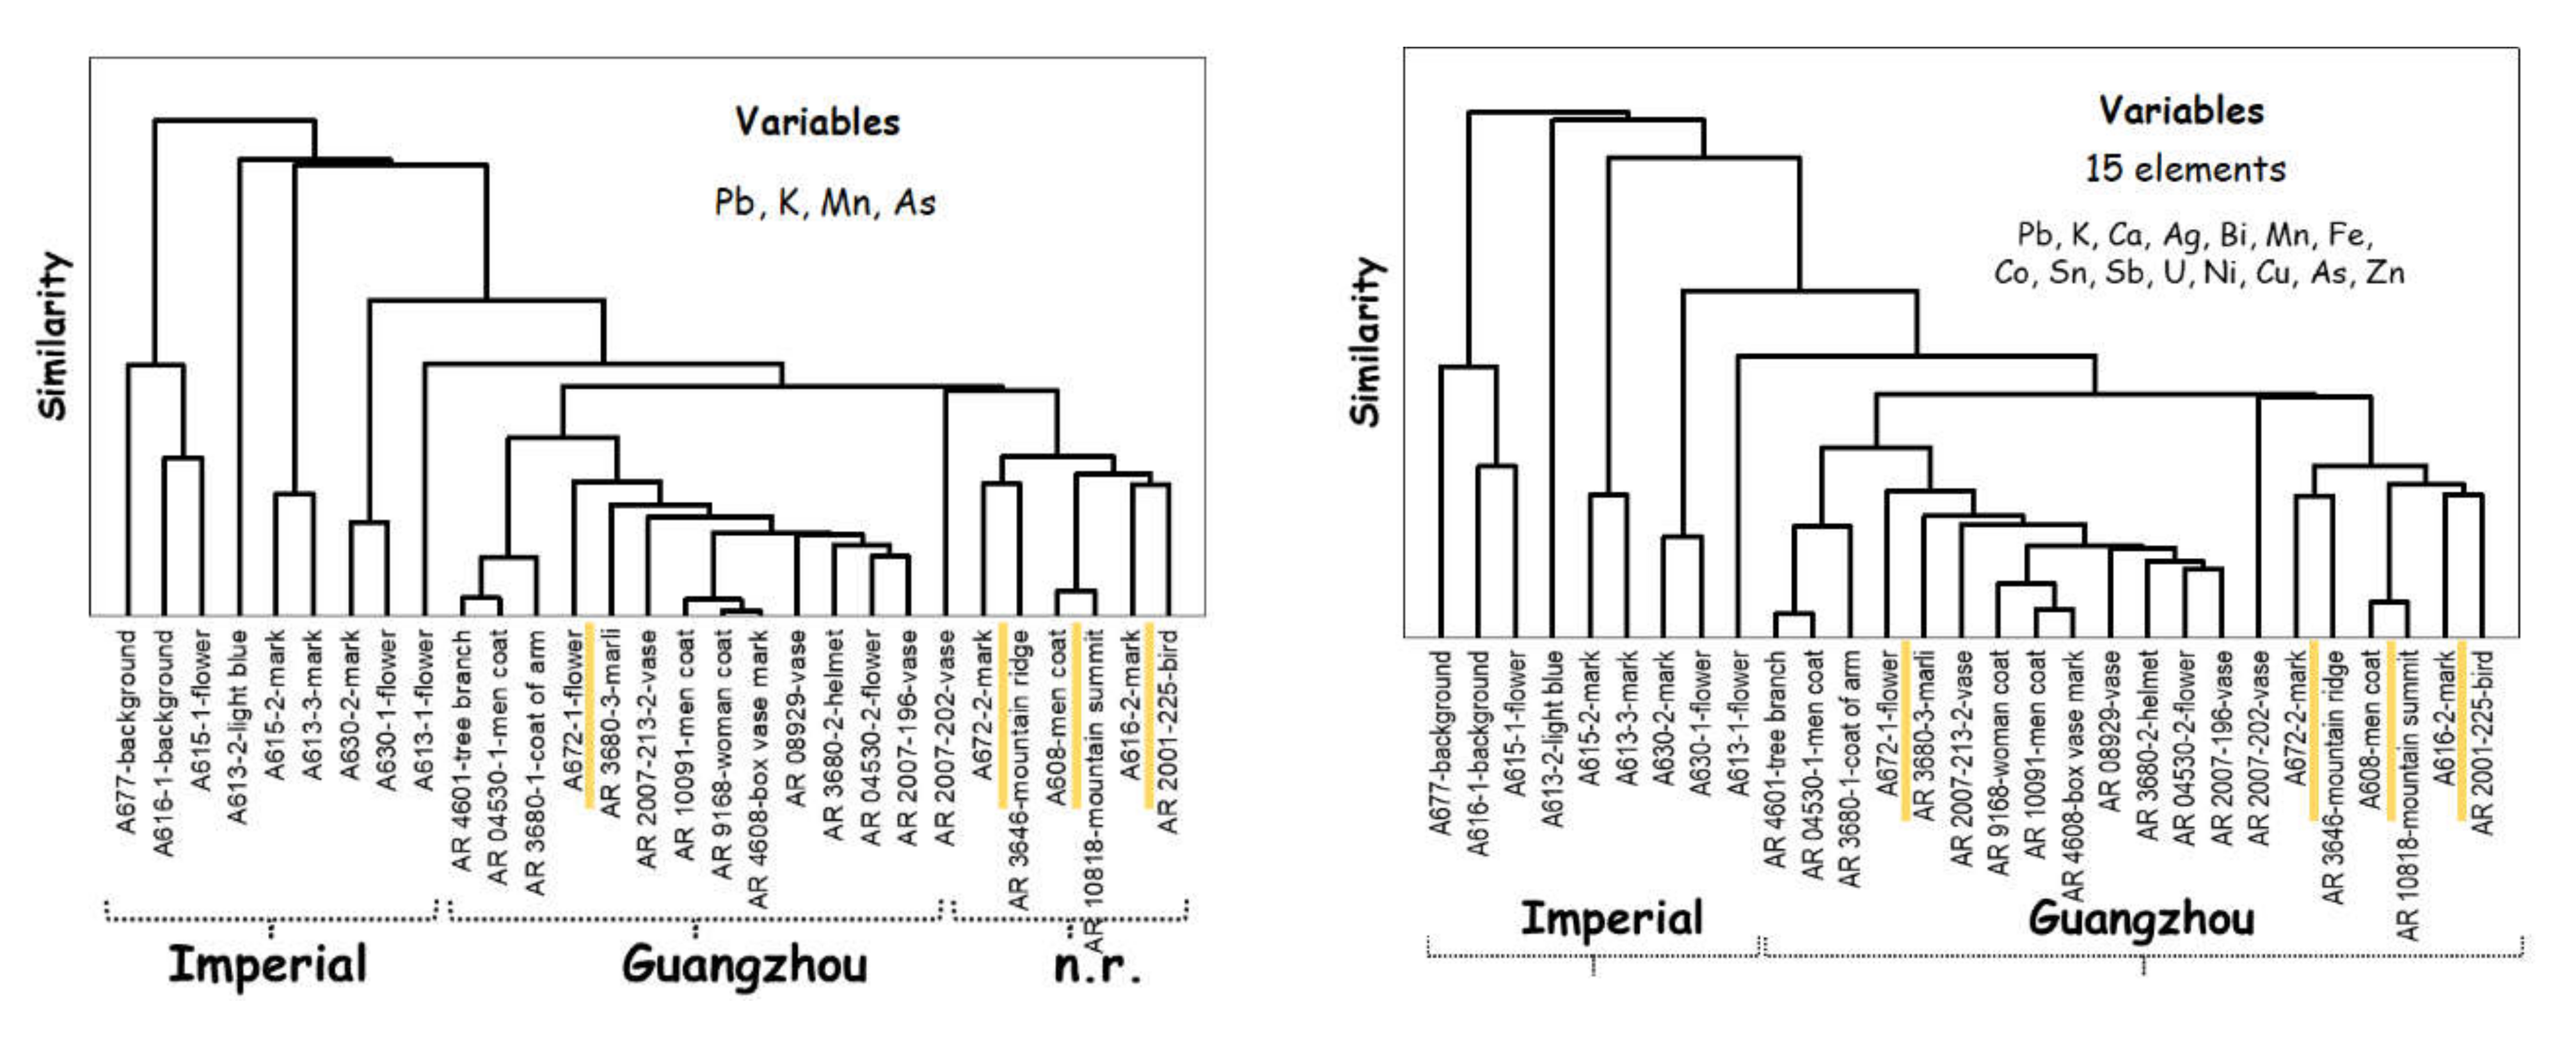
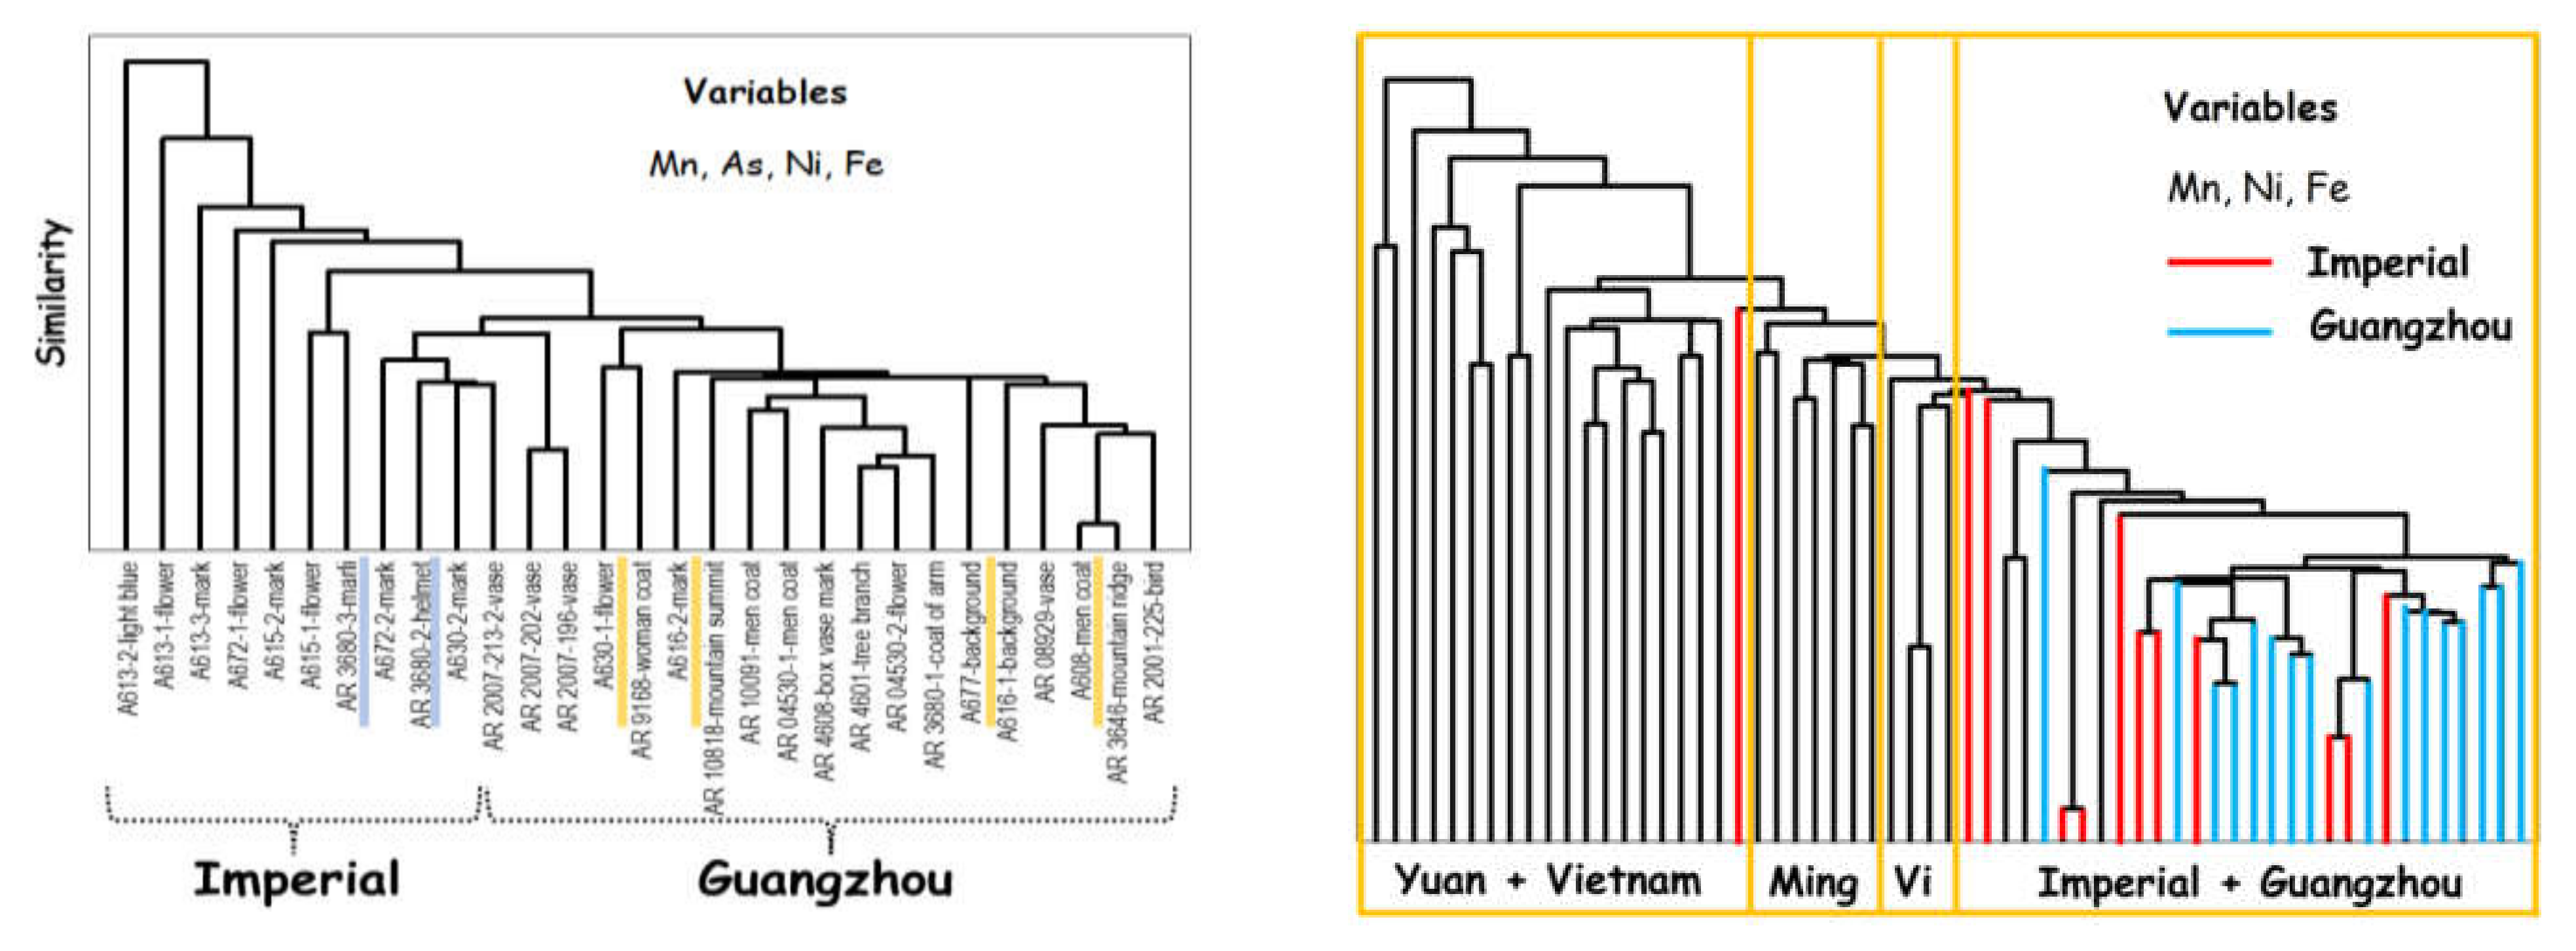
- Objects A 608, A 630, AR 3646, AR 4601, AR 10818, AR 3680 and AR 3646 have a similar and higher Mn/Fe ratio (Figure 8) and are attributed to the Qianlong period; this higher Mn level is consistent with the use of a mixture of European and Asian cobalt to reduce the cost of production. The mixing of different sources, either to optimize the hue or reduce the cost was already reported [23]; we also observe a lower As content, as expected for such a mixture.
4.3. Comparison with Previous (Yuan and Ming) Productions
5. Conclusions
Author Contributions
Funding
Institutional Review Board Statement
Data Availability Statement
Acknowledgments
Conflicts of Interest
References
- Curtis, E.B. European Contributions to the Chinese Glass of the Early Qing Period. J. Glass. Stud. 1993, 35, 91–101. [Google Scholar]
- Shih, C.F. Evidence of East-West exchange in the eighteenth century: The establishment of painted enamel art at the Qing Court in the reign of Emperor Kangxi. Natl. Palace Mus. Res. Q. 2007, 24, 45–94. [Google Scholar]
- Zhou, S.Z. Research on Painted Enamels Porcelain Ware from the Qing Court; Wenwu Chubanshe: Beijing, China, 2008. [Google Scholar]
- Curtis, E.B. Glass Exchange between Europe and China, 1550–1800; Ashgate: Farnham, UK, 2009. [Google Scholar]
- Lili, F. La Céramique Chinoise; China Intercontinental Press: Beijing, China, 2011. [Google Scholar]
- Shih, C.F. Radiant Luminance: The Painted Enamelware of the Qing Imperial Court; The National Palace Museum of Taipei: Taipei, Taiwan, 2012.
- Xu, X.D. Europe-China-Europe: The Transmission of the Craft of Painted Enamel in the Seventeenth and Eighteenth Centuries. In Goods from the East, 1600–1800 Trading Eurasia; Berg, M., Ed.; Palgrave Macmillan: London, UK, 2015; pp. 92–106. [Google Scholar]
- Zhao, B.; Wang, G.Y.; Biron, I.; Colomban, P.; Hilaire-Pérez, L. La Circulation des Techniques de l′émail Entre la France et la Chine du XVIIème au XIXème Siècle. CNRS Chine Bull. 2016, 21, 20–25. Available online: http://www.cnrs.fr/derci/IMG/pdf/cnrsenchine_21_fr_final_pour_le_site_cnrs.pdf (accessed on 15 December 2019).
- Tang, H. The Colours of Each Piece: Production and Consumption of Chinese Enamelled Porcelain, c.1728–c.1780. Ph.D. Thesis, University of Warwick, Warwick, UK, 2017. Available online: http://webcat.warwick.ac.uk/record=b3099976~S15 (accessed on 30 May 2022).
- Colomban, P.; Arberet, L.; Kırmızı, B. On-Site Raman Analysis of 17th and 18th Century Limoges Enamels: Implications on the European Cobalt Sources and the Technological Relationship between Limoges and Chinese Enamels. Ceram. Int. 2017, 43, 10158–10165. [Google Scholar] [CrossRef] [Green Version]
- Colomban, P.; Kırmızı, B.; Gougeon, C.; Gironda, M.; Cardinal, C. Pigments and glassy matrix of the 17th–18th century enamelled French watches: A non-invasive on-site Raman and pXRF study. J. Cult. Herit. 2020, 44, 1–14. [Google Scholar] [CrossRef]
- Colomban, P.; Zhang, Y.; Zhao, B. Non-invasive Raman analyses of huafalang and related porcelain wares. Searching for evidence for innovative pigment technologies. Ceram. Int. 2017, 43, 12079–12088. [Google Scholar] [CrossRef] [Green Version]
- Colomban, P.; Ambrosi, F.; Ngo, A.-T.; Lu, T.-A.; Feng, X.-L.; Chen, S.; Choi, C.-L. Comparative analysis of wucai Chinese porcelains using mobile and fixed Raman microspectrometers. Ceram. Int. 2017, 43, 14244–14256. [Google Scholar] [CrossRef] [Green Version]
- Ma, H.J.; Henderson, J.; Cui, J.F.; Chen, K.L. Glassmaking of the Qing Dynasty: A review, New Data and New Insights. Adv. Archaeom. 2020, 1, 27–35. [Google Scholar] [CrossRef]
- Howard, D. Chinese Armorial Porcelain; Faber & Faber: London, UK, 1952; Volume 1. [Google Scholar]
- Jourdain, M.; Soame, J. Chinese Export Art in the 18th Century; Spring Books: Feltham, UK, 1967. [Google Scholar]
- Le Corbeiller, C. China trade armorial porcelain in America. Antiques 1977, 12, 1124–1129. [Google Scholar]
- Godden, G.A. Oriental Export Market Porcelain and Its Influence on European Wares; Grenada: London, UK, 1979. [Google Scholar]
- Howard, D.S. Chinese Armorial Porcelain; Heirlomm & Howard: London, UK, 2003; Volume 2. [Google Scholar]
- Lebel, A. Armoiries Françaises et Suisses sur la Porcelaine de Chine au XVIIIe Siècle; Antoine Lebel: Bruxelles, Belgium, 2009. [Google Scholar]
- Colomban, P.; Ngo, A.-T.; Fournery, N. Non-invasive Raman Analysis of 18th Century Chinese Export/Armorial Overglazed Porcelain: Identification of the Different Enameling Technology. Heritage 2022, 5, 233–259. [Google Scholar] [CrossRef]
- Watt, J.C.Y. Notes on the Use of Cobalt in Later Chinese Ceramics. Ars Orient. 1979, 11, 63–85. [Google Scholar]
- Colomban, P.; Simsek Franci, G.; Kırmızı, B. Cobalt and Associated Impurities in Blue (and Green) Glass, Glaze and Enamel: Relationships between Raw Materials, Processing, Composition, Phases and International Trade. Minerals 2021, 11, 633. [Google Scholar] [CrossRef]
- Colomban, P.; Kırmızı, B.; Zhao, B.; Clais, J.-B.; Yang, Y.; Droguet, V. Non-invasive on-site Raman study of pigments and glassy matrix of the 17th–18th century painted enamelled Chinese metal wares: Comparison with French enamelling technology. Coatings 2020, 10, 471. [Google Scholar] [CrossRef]
- Colomban, P.; Gironda, M.; Vangu, D.; Kırmızı, B.; Zhao, B.; Cochet, V. The technology transfer from Europe to China in the 17th–18th centuries: Non-invasive on-site XRF and Raman analyses of Chinese Qing Dynasty enameled masterpieces made using European ingredients/recipes. Materials 2021, 14, 7434. [Google Scholar] [CrossRef]
- Colomban, P.; Sagon, G.; Huy, L.Q.; Liem, N.Q.; Mazerolles, L. Vietnamese (15th Century) lue-and-white tam thai and luster porcelains/stonwares: Glaze composition and decoration techniques. Archaeometry 2004, 46, 125–136. [Google Scholar] [CrossRef]
- Simsek, G.; Colomban, P.; Wong, S.; Zhao, B.; Rougeulle, A.; Liem, N.Q. Toward a fast non-destructive identification of pottery: The sourcing of 14th-16th century Vietnamese and Chinese ceramic shards. J. Cult. Herit. 2015, 16, 159–172. [Google Scholar] [CrossRef]
- Van Pevenage, J.; Lauwers, D.; Herremans, D.; Verhaeven, E.; Vekemans, B.; De Clercq, W.; Vincze, L.; Moens, L.; Vandenabeele, P. A Combined Spectroscopic Study on Chinese Porcelain Containing Ruan-Cai Colours. Anal. Methods 2014, 6, 387–394. [Google Scholar] [CrossRef]
- Giannini, R.; Freestone, I.; Shortland, A.J. European cobalt sources identified in the production of Chinese Famille rose porcelain. J. Archaeol. Sci. 2017, 80, 27–36. [Google Scholar] [CrossRef] [Green Version]
- Colomban, P.; Kırmızı, B. Non-invasive on-site Raman study of polychrome and white enamelled glass artefacts in imitation of porcelain assigned to Bernard Perrot and his followers. J. Raman Spectrosc. 2020, 51, 133–146. [Google Scholar] [CrossRef]
- Colomban, P.; Lu, T.-A.; Milande, V. Non-invasive on-site Raman study of blue-decorated early soft-paste porcelain: The use of arsenic-rich (European) cobalt ores—Comparison with huafalang Chinese porcelains. Ceram. Int. 2018, 44, 9018–9026. [Google Scholar] [CrossRef]
- Colomban, P.; Maggetti, M.; d’Albis, A. Non-invasive Raman identification of crystalline and glassy phases in a 1781 Sèvres Royal Factory soft paste porcelain plate. J. Eur. Ceram. Soc. 2018, 38, 5228–5233. [Google Scholar] [CrossRef]
- Colomban, P.; Sagon, G.; Faurel, X. Differentiation of antique ceramics from the Raman spectra of their coloured glazes and paintings. J. Raman Spectrosc. 2001, 32, 351–360. [Google Scholar] [CrossRef]
- Ricciardi, P.; Colomban, P.; Tournié, A.; Milande, V. Nondestructive on-site identification of ancient glasses: Genuine artefacts, embellished pieces or forgeries? J. Raman Spectrosc. 2009, 40, 604–617. [Google Scholar] [CrossRef]
- Zhou, Y.; Jin, Y.; Wang, K.; Sun, J.; Cui, Y.; Hu, D. Opaque ancient K2O-PbO-SiO2 glass of the Southern Song Dynasty with fluorite dendrite and its fabrication. Herit. Sci. 2019, 7, 56. [Google Scholar] [CrossRef] [Green Version]
- Colomban, P. Rocks as blue, green and black pigments/dyes of glazed pottery and enameled glass artefacts—A review. Eur. J. Miner. 2014, 25, 863–879. [Google Scholar] [CrossRef]
- Sakellariou, K.; Miliani, C.; Morresi, A.; Ombelli, M. Spectroscopic investigation of yellow majolica glazes. J. Raman Spectrosc. 2004, 35, 61–67. [Google Scholar] [CrossRef]
- Sandalinas, C.; Ruiz-Moreno, S.; Lopez-Gil, A.; Miralles, J. Experimental confirmation by Raman spectroscopy of a Pb-Sn-Sb triple oxide yellow pigment in sixteenth-century Italian pottery. J. Raman Spectrosc. 2006, 37, 1146–1153. [Google Scholar] [CrossRef]
- Rosi, F.; Manuali, V.; Miliani, C.; Brunetti, B.G.; Sgamellotti, A.; Grygar, T.; Hradil, D. Raman scattering features of lead pyroantimonate compounds. Part I: XRD and Raman characterization of Pb2Sb2O7 doped with tin and zinc. J. Raman Spectrosc. 2009, 40, 107–111. [Google Scholar] [CrossRef]
- Pereira, M.; de Lacerda-Aroso, T.; Gomes, M.J.M.; Mata, A.; Alves, L.C.; Colomban, P. Ancient Portuguese ceramic wall tiles (“Azulejos”): Characterization of the glaze and ceramic pigments. J. Nano Res. 2009, 8, 79–88. [Google Scholar] [CrossRef]
- Pelosi, C.; Agresti, G.; Santamaria, U.; Mattei, E. Artificial yellow pigments: Production and characterization through spectroscopic methods of analysis. e-Preserv. Sci. 2010, 7, 108–115. [Google Scholar]
- Rosi, F.; Manuali, V.; Grygar, T.; Bezdicka, P.; Brunetti, B.G.; Sgamellotti, A.; Burgio, L.; Seccaroni, C.; Miliani, C. Raman scattering features of lead pyroantimonate compounds: Implication for the non-invasive identification of yellow pigments on ancient ceramics. Part II. In situ characterisation of Renaissance plates by portable micro-Raman and XRF studies. J. Raman Spectrosc. 2011, 42, 407–414. [Google Scholar] [CrossRef]
- Cartechini, L.; Rosi, F.; Miliani, C.; d’Acapito, F.; Brunetti, G.; Sgamellotti, A.A. Modified Naples yellow in Renaissance majolica: Study of Pb-Sb-Zn and Pb-Sb-Fe ternary pyroantimonates by X-ray absorption spectroscopy. J. Anal. At. Spectrom. 2011, 26, 2500–2507. [Google Scholar] [CrossRef]
- Colomban, P. The Use of Metal Nanoparticles to Produce Yellow, Red and Iridescent Colour, from ronze Age to Present Times in Lustre Pottery and Glass: Solid State Chemistry, Spectroscopy and Nanostructure. J. Nano Res. 2009, 8, 109–132. [Google Scholar] [CrossRef] [Green Version]
- Geyssant, J. Secret du verre rouge transparent de Bernard Perrot et comparaison avec celui de Johann Kunckel. In Bernard Perrot (1640–1709), Secrets et Chefs-d’œuvre des Verreries Royales d’Orléans, Catalogue; Klinka Ballesteros, I., de Valence, C., Maitte, C., Ricke, H., Eds.; Musée des Beaux-Arts d’Orléans—SOMOGY Editions d’Arts: Paris, France, 2013; pp. 51–54. [Google Scholar]
- Colomban, P.; Liem, N.Q.; Sagon, G.; Tinh, H.X.; Hoành, T. Microstructure, composition and processing of 15th century Vietnamese porcelains and celadons. J. Cult. Herit. 2003, 4, 187–197. [Google Scholar] [CrossRef]
- Simsek Franci, G. Blue Print: Archaeometric Studies of Colored Glazed Chinese Ceramics and Production of Replica, Final Report, The Scientific and Research Council of Turkey, The Scientific and Technological Projects Funding Program. Unpublished Report, 3 January 2021. [Google Scholar]
- Simsek Franci, G. Handheld X-ray Fluorescence (XRF) versus wavelength dispersive XRF: Characterization of Chinese blue and white porcelain sherds using handheld and laboratory-type XRF instruments. Appl. Spectrosc. 2020, 74, 314–322. [Google Scholar] [CrossRef]
- Kissin, S.A. Five-element (Ni-Co-As-Ag-Bi) veins. Geosci. Can. 1992, 19, 113–124. [Google Scholar]
- Colomban, P.; Gironda, M.; Edwards, H.G.M.; Mesqui, V. The enamels of the first (softpaste) European blue-and-white porcelains: Rouen, Saint-Cloud and Paris factories: Complementarity of Raman and X-ray fluorescence analyses with mobile instruments to identify the cobalt ore. J. Raman Spectrosc. 2021, 52, 2246–2261. [Google Scholar] [CrossRef]
- Available online: https://xrfcheck.bruker.com/InfoDepth (accessed on 2 June 2022).
- Ayers, J. The Baur Collection, Geneva-Chinese Ceramics, Volume IV: Painted and Polychrome Porcelains of the Ch’ing Dynasty; Collection Baur: Genève, Switzerland, 1974. [Google Scholar]
- Garner, H. The Origins of Famille Rose. Trans. Orient. Ceram. Soc. 1967–1969, 37, 1–16. Available online: https://www.orientalceramicsociety.org.uk/publications/transactions/4 (accessed on 2 June 2022).
- Loehr, G. Missionary-artists at the Manchu Court. Trans. Orient. Ceram. Soc. 1962–1963, 34, 51–67. Available online: https://www.orientalceramicsociety.org.uk/publications/transactions/4 (accessed on 2 June 2022).
- Ayers, J. Chinese Ceramics in the Baur Collection; Collection Baur: Genève, Switzerland, 1999; Volume 2. [Google Scholar]
- Shih, C.F. Cultural Contending: Kangxi Painted Enamelware as Global Competitor. Minsu Quyi 2013, 182, 149–219. (In Chinese) [Google Scholar]
- Pierson, S. True or False? Defining the Fake in Chinese porcelain. Cah. Fram. 2019, 31, 6168. [Google Scholar] [CrossRef]
- Qintero Pérez, A.; Anthonioz, S. Chrysanthèmes, Dragons et Samourais. La Céramique Japonaise du Musée Ariana. L’Ariana Sort de Ses Réserves IV; Catalogue, Georg Editeur: Geneva, Switzerland, 2020. [Google Scholar]
- Guo, X.L. Guangcai qiyuan ji qi zaoqi mianmao [Origin and appearance of early Guangcai wares]. Orient. Collect. 2018, 12, 5–22. [Google Scholar]
- Yang, G. A Pair of Canton Enamel Porcelain Masterpieces in the Rijksmuseum. Aziat. Kunst 2018, 48, 54–59. [Google Scholar] [CrossRef]
- Schumacher, A.-C. (Ed.) La Donation Clare van Beusekon-Hamburger: Faïence et Porcelaines des XVIe-XVIIIe Siècles; Skira: Genève, Switzerland, 2010. [Google Scholar]
- Available online: https://www.musee-ariana.ch/collections/search?f%5B0%5D=lieux_de_creation%3A1691&date_end=1780&date_start=1700&material=porcelaine&decor_and_iconography=famille%20rose&tab=vdg_artwork (accessed on 30 May 2022).
- Impey, O. The Early Porcelain Kilns of Japan; Clarendon Press: Oxford, UK, 1996. [Google Scholar]
- Nagatake, T. Classic Japanese Porcelain—Imari and Kakiemon; Kodansha International: Tokyo, Japan, 2003. [Google Scholar]
- Murakami, N. The Origin of Imari Porcelain—Excavated Shards from Komizo Kiln; Sojusha Art Publishing: Tokyo, Japan, 2020. (In Japanese) [Google Scholar]
- Montanari, R.; Murakami, N.; Alberghina, M.F.; Pelosi, C.; Schiavone, S. The Origin of overglaze-blue enameling in Japan: New discoveries and a reassessment. J. Cult. Herit. 2019, 37, 94–102. [Google Scholar] [CrossRef]
- Fitski, M. Kakiemon Porcelain—Handbook; Leiden University Press: Leiden, The Netherlands, 2011. [Google Scholar]
- Kysuhu Ceramic Museum (Ed.) Kakiemon—The Whole Aspect of the Kakiemon Style—Special Exhibition Catalog; Kysuhu Ceramic Museum: Kysuhu, Japan, 1999. (In Japanese) [Google Scholar]
- Montanari, R.; Murakami, N.; de Bonis, A.; Colomban, P.; Alerghina, M.F.; Grifa, C.; Izzo, F.; Morra, V.; Pelosi, C.; Schiavone, S. The early porcelain kilns of Arita: Identification of raw materials and their use from the 17th to the 19th century. Open Ceram. 2022, 9, 100217. [Google Scholar] [CrossRef]
- Manoun, B.; Azdouz, M.; Azrour, M.; Essehli, R.; Benmokhtar, S.; El Ammari, L.; Ezzahi, A.; Ider, A.; Lazor, P. Synthesis, Rietveld refinements and Raman spectroscopic studies of tricationic lacunar apatites Na1−xKxPb4(AsO4)3 (0 < x < 1). J. Mol. Struct. 2011, 986, 1–9. [Google Scholar] [CrossRef]
- Colomban, P.; Ngo, A.-T.; Edwards, H.G.M.; Prinsloo, L.C.; Esterhuizen, L.V. Raman identification of the different glazing technologies of Blue-and-White Ming porcelains. Ceram. Int. 2021, 48, 1673–1681. [Google Scholar] [CrossRef]
- Colomban, P. Full Spectral Range Raman Signatures Related to Changes in Enameling Technologies from the 18th to the 20th Century: Guidelines, Effectiveness and Limitations of the Raman Analysis of the Raman Analysis. Materials 2022, 15, 3158. [Google Scholar] [CrossRef]
- Gratuze, B.; Soulier, I.; Barrandon, J.N.; Foy, D. De l’origine du cobalt dans les verres. Rev. d’Archéom. 1992, 16, 97–108. Available online: https://www.persee.fr/doc/arsci_0399-1237_1992_num_16_1_895 (accessed on 2 June 2022). [CrossRef]
- Gratuze, B.; Soulier, I.; Blet, M.; Vallauri, L. De l’origine du cobalt: Du verre à la céramique. Revue d’Archéom. 1996, 20, 77–94. Available online: https://www.persee.fr/doc/arsci_0399-1237_1996_num_20_1_939 (accessed on 2 June 2022). [CrossRef]
- Porter, Y. Le cobalt dans le monde Iranien (IXe-XVIe siècles). Taoci 2000, 1, 5–14. [Google Scholar]
- Matin, M.; Pollard, A.M. From ore to pigment: A description of the minerals and experimental study of cobalt ore processing from the Kâshân mine, Iran. Archaeometry 2017, 59, 731–746. [Google Scholar] [CrossRef]
- Wen, J.X.; Chen, Z.K.; Zeng, Q.G.; Hu, L.S.; Wang, B.; Shi, J.P.; Zhang, G.X. Multi-micro analytical studies of blue-and-white porcelain (Ming dynasty) excavated from Shuangchuan island. Ceram. Int. 2019, 45, 13362–13368. [Google Scholar] [CrossRef]
- Jiang, X.; Ma, Y.; Chen, Y.; Li, Y.; Ma, Q.; Zhang, Z.; Wang, C.; Yang, Y. Raman analysis of cobalt blue pigment in blue and white porcelain: A reassessment. Spectrochim. Acta Part A Mol. Biomol. Spectrosc. 2018, 190, 61–67. [Google Scholar] [CrossRef] [PubMed]
- Wang, T.; Zhu, T.Q.; Feng, Z.Y.; Fayard, B.; Pouyet, E.; Cotte, M.; De Nolf, W.; Sciau, P. Synchrotron radiation-based multi-analytical approach for studying underglaze color: The microstructure of Chinese Qinghua blue decors (Ming dynasty). Anal. Chim. Acta 2016, 928, 20–31. [Google Scholar] [CrossRef] [Green Version]
- Wen, R.; Wang, C.S.; Mao, Z.W.; Huang, Y.Y.; Pollard, A.M. The chemical composition of blue pigment on Chinese blue-and-white porcelain of the Yuan and Ming Dynasties (AD 1271–1644). Archaeometry 2007, 49, 101–115. [Google Scholar] [CrossRef]
- Zhou, Y.H.; Hu, Y.J.; Tao, Y.; Sun, J.; Cui, Y.; Wang, K.; Hu, D.B. Study on the microstructure of the multilayer glaze of the 16th–17th century export blue-and-white porcelain excavated from Nan’ao Shipwreck. Ceram. Int. 2016, 42, 17456–17465. [Google Scholar] [CrossRef]
- Zhang, R.; Garachon, I.; Gethin, P.; van Campen, J. Double layers glaze analysis of the Fujian export blue-and-white porcelain from the Witte Leeuw shipwreck (1613). Ceram. Int. 2020, 46, 13474–13481. [Google Scholar] [CrossRef]
- De Pauw, E.; Track, P.; Verhaeven, E.; Bauters, S.; Acke, L.; Vekemans, B.; Vincze, L. Microbeam X-ray fluorescence and X-ray absorption spectroscopic analysis of Chinese blue-and-white porcelain dating from the Ming dynasty. Spectrochim. Acta Part B 2018, 149, 190–196. [Google Scholar] [CrossRef]
- Duan, H.; Zhang, X.; Kang, B.; Wang, G.; Qu, L.; Lei, Y. Non-destructive Analysis and Deterioration Study of a Decorated Famille Rose Porcelain Bowl of Qianlong Reign from the Forbidden City. Stud. Conserv. 2019, 64, 311–322. [Google Scholar] [CrossRef]
- Molera, J.; Climent-Font, A.; Garcia, G.; Pradell, T.; Vallcorba, O.; Zucchiatti, A. A study of historical processing of cobalt arsenides in XV–XVI century Europe. J. Archaeol. Sci. Rep. 2021, 36, 102797. [Google Scholar] [CrossRef]
- Zlamalova Cilova, Z.; Gelnar, M.; Randakova, S. Smalt production in the ore mountains: Characterization of samples related to the production of blue pigment in Bohemia. Archaeometry 2020, 62, 1202–1215. [Google Scholar] [CrossRef]
- Mimoso, J.M. Origin, early history and technology of the blue pigment in azulejos. In Proceedings of the GlazeArch2015, Lisbon, Portugal, 2–3 July 2015; pp. 357–376. Available online: http://azulejos.lnec.pt/AzuRe/links/07%20Origin_of_blue_pigment.pdf (accessed on 20 January 2021).
- Bunney, M. A new Technique to Help Identify Chinese Ceramic Fakes: Shirley, M. Mueller Interviews. Am. Ceram. Circ. Spring Newlett. 2016, 25–26. [Google Scholar]
- Wallace, S.C.; Kenney-Wallace, G. Bubble signatures revealed in antique artefacts. Phys. World 2016, 29, 34. [Google Scholar] [CrossRef]
- Kırmızı, B.; Chen, S.; Colomban, P. The Raman signature of protonic species as a potential tool for dating or authentication of glazed pottery. J. Raman Spectrosc. 2019, 50, 696–710. [Google Scholar] [CrossRef]
- Colomban, P.; Treppoz, F. Identification and Differentiation of Ancient and Modern European Porcelains by Raman Macro- and Microspectroscopy. J. Raman Spectrosc. 2001, 32, 93–102. [Google Scholar] [CrossRef]
- Colomban, P. Polymerization degree and Raman identification of ancient glasses used for jewellery, ceramic enamels and mosaics. J. Non-Cryst. Solids 2003, 323, 180–187. [Google Scholar] [CrossRef]
- Colomban, P.; Tournié, A.; Bellot-Gurlet, L. Raman identification of glassy silicates used in ceramic, glass and jewellery: A tentative differentiation guide. J. Raman Spectrosc. 2006, 37, 841–852. [Google Scholar] [CrossRef] [Green Version]
- Yap, C.T.; Tang, S.M. X-ray fluorescence analysis of modern and recent Chinese porcelains. Archaeometry 1984, 26, 78–81. [Google Scholar] [CrossRef]
- Yap, C.T. A quantitative spectrometric analysis of trace concentrations of manganese and cobalt in ceramics and the significance of As/Co and Mn/Co ratios. J. Archaeol. Sci. 1988, 15, 173–177. [Google Scholar] [CrossRef]
- Yu, K.N.; Miao, J.M. Locating the origins of blue and white porcelains using EDXRF. Appl. Radiat. Isot. 1997, 48, 959–963. [Google Scholar] [CrossRef]
- Yu, K.N.; Miao, J.M. Multivariate analysis of the energy dispersive X-ray fluorescence results from blue and white Chinese porcelains. Archaeometry 1998, 40, 331–339. [Google Scholar] [CrossRef]
- Yu, K.N.; Miao, J.M. Characterization of blue and white porcelains using Mn/Fe ratio from EDXRF, with particular reference to porcelains of the Xuande period (1426 to 1435 A.D.). Appl. Radiat. Isot. 1999, 51, 279–283. [Google Scholar] [CrossRef]
- Morimoto, A.; Yamasaki, K. Technical Studies on Ancient Ceramics Found in North and Central Vietnam; Fukuoka Museum: Fukuoka, Japan, 2001. [Google Scholar]
- Cheng, H.S.; Zhang, B.; Xia, H.N.; Jiang, J.C.; Yang, F.J. Non-destructive analysis and appraisal of ancient Chinese porcelain by PIXE. Nucl. Instr. Meth. Phys. Res. Sect. B 2002, 190, 488–491. [Google Scholar] [CrossRef]
- Zhang, F. The origin and development of traditional Chinese glazes and decorative ceramics color. In Ancient Technology to Modern Science; Kingery, W.D., Ed.; The American Ceramic Society: Colombus, OH, USA, 1985; Volume 1, pp. 163–180. [Google Scholar]
- Aimé-Martin, M.L. (Ed.) Letter of the Father Dentrecolles, Dated 1 September 1712 + Letter of Father Dentrecolles Dated 25 January 1722. In Lettres Édifiantes et Curieuses Concernant l’Asie, l’Afrique et l’Amérique, Avec Quelques Relations Nouvelles de Missions et des Notes Géographiques et Historiques; T. III Chine; Société du Panthéon Littéraire: Paris, France, 1843; pp. 216–233+318–325.s. [Google Scholar]


| Artefact | Inventory Number | Period | Dimension (cm) | Expected Place of Enameling (characteristics) | Analyzed Area |
|---|---|---|---|---|---|
| Soap box | AR 9168 | 19th century | H: 8 L: 13.8 l: 10.5 | Canton? | Women coats |
| Plate | AR 4530 | Yongzheng, ca. 1730 | H: 2.8 D: 22.5 | Canton? | Flower, men coats |
| Plate | AR 4608 | Yongzheng, ca. 1730 | H: 5 D: 35.3 | Canton or Jingdezhen? | Box close to yellow vase mark |
| Cup saucer | AR 10091 | Yongzheng, 1723–1735 | H. 4,5 D: 11.7 | Canton? | Men coats |
| Plate | AR 2007-196 | Yongzheng, 1723–1735 | H:3.2 D: 20.7 | Canton or Jungdezhen? (Ruby-back) | Vase |
| Plate | AR 2007-213–2 | Yongzheng, 1723–1735 | H:3.7 D: 21 | Canton? | Vase |
| Plate | AR 2007-202 | Yongzheng, 1723–1735 | H: 3.3 D: 21 | Canton or Jingdezhen? 7 borders decor, ruby back | Vase |
| Plate | AR 3646 | Qianlong, ca. 1745 | H:4 D: 22.8 | Canton? Pierre-Paul Rubens inspired decor | Mountain ridge |
| Plate | AR 4601 | Qianlong, ca. 1740 | H: 2.5 D: 22.3 | Canton? (‘Xixiang ji’ story décor) | Tree branch |
| Plate | AR 10818 | Qianlong, ca. 1735–1740 | H: 4.5 D: 36 | Meissen style | Mountain summit |
| Dish | AR 3680 | Qianlong, ca. 1740–1743 | H: 2.8 D: 22.8 | Armorial decoration (Elias Guillot coat-of-arms, Holland), Canton? | Marli, Coat-of-arms, Helmet |
| Artifact | Inventory Number | Period | Reign Mark | Dimension | Analyzed Blue Spot | Analyzed Glaze | Analyzed Body |
|---|---|---|---|---|---|---|---|
| bowl | CB.CC.1936.677 | but probably later period | Kangxi reign mark in red | D. 14.5; H. 7.4 | background | yes | no |
| bowl | CB.CC.1932.613 | Kangxi | Kangxi reign mark in cobalt blue | D. 12.5 | flower, light blue, mark | close to flower close to mark | yes |
| bowl | CB.CC.1950.672 | Kangxi | Kangxi reign mark in cobalt blue | D. 12.5; H. 6.5 | flower mark | close to mark | yes |
| bowl | CB.CC.1937.615 | Yongzheng | Yongzheng reign mark in cobalt | D. 11 | flower, mark | close to mark | yes |
| bowl | CB.CC.1930.616 | maybe later date | Yongzheng reign mark | D. 9.3 | blue (background), mark | close to mark | no |
| bowl | CB.CC.1930.630 | Daoguang 1821–1850 | Daoguang reign mark in cobalt blue | D.18.5 | flower, mark | close to mark | no |
| dish | CB.CC.1935.608 | Qianlong 1736–1795 | Qianlong reign mark in cobalt blue | D. 17.4 | Men coats (XRF mapping) | yes | no |
| Artifact | Inventory Number | Assignment (Stylistic Criteria) | Analyzed Blue Spot | Phases in Glaze | Phases in Blue Area | Mark | Expected Recipes |
|---|---|---|---|---|---|---|---|
| bowl | A 677 | Kangxi mark but probably later period | background | quartz vitreous silicate | quartz vitreous silicate | - (red mark) | Overglaze mark |
| bowl | A 613 | Kangxi | flower, light blue, mark | quartz vitreous silicate lead arsenate | quartz vitreous silicate lead arsenate | quartz vitreous silicate | European-like? underglaze(?) mark |
| bowl | A 672 | Kangxi | flower mark | quartz vitreous silicate | quartz vitreous silicate lead arsenate | quartz vitreous silicate | European? Overglaze mark |
| bowl | A 615 | Yongzheng | flower mark | quartz vitreous silicate | quartz vitreous silicate lead arsenate | quartz vitreous silicate | Ming-like Underglaze mark |
| bowl | A 616 | Yongzheng mark but maybe later date | blue (background) mark | not measured | not measured | not analyzed | Overglaze mark |
| bowl | A 630 | Daoguang 1825–1850 | flower mark | see for blue area | quartz vitreous silicate | quartz vitreous silicate | Ming-like Underglaze mark |
| dish | A 608 | Qianlong | Men coat (mapping) | quartz vitreous silicate | quartz vitreous silicate lead arsenate | As traces | European? Overglaze mark |
Publisher’s Note: MDPI stays neutral with regard to jurisdictional claims in published maps and institutional affiliations. |
© 2022 by the authors. Licensee MDPI, Basel, Switzerland. This article is an open access article distributed under the terms and conditions of the Creative Commons Attribution (CC BY) license (https://creativecommons.org/licenses/by/4.0/).
Share and Cite
Colomban, P.; Simsek Franci, G.; Gironda, M.; d’Abrigeon, P.; Schumacher, A.-C. pXRF Data Evaluation Methodology for On-Site Analysis of Precious Artifacts: Cobalt Used in the Blue Decoration of Qing Dynasty Overglazed Porcelain Enameled at Customs District (Guangzhou), Jingdezhen and Zaobanchu (Beijing) Workshops. Heritage 2022, 5, 1752-1778. https://doi.org/10.3390/heritage5030091
Colomban P, Simsek Franci G, Gironda M, d’Abrigeon P, Schumacher A-C. pXRF Data Evaluation Methodology for On-Site Analysis of Precious Artifacts: Cobalt Used in the Blue Decoration of Qing Dynasty Overglazed Porcelain Enameled at Customs District (Guangzhou), Jingdezhen and Zaobanchu (Beijing) Workshops. Heritage. 2022; 5(3):1752-1778. https://doi.org/10.3390/heritage5030091
Chicago/Turabian StyleColomban, Philippe, Gulsu Simsek Franci, Michele Gironda, Pauline d’Abrigeon, and Anne-Claire Schumacher. 2022. "pXRF Data Evaluation Methodology for On-Site Analysis of Precious Artifacts: Cobalt Used in the Blue Decoration of Qing Dynasty Overglazed Porcelain Enameled at Customs District (Guangzhou), Jingdezhen and Zaobanchu (Beijing) Workshops" Heritage 5, no. 3: 1752-1778. https://doi.org/10.3390/heritage5030091