
Correlation between Psoas Muscle Index and Degeneration of Spinal Back Muscle in Patients with Back Pain


Department of Physical Medicine and Rehabilitation, College of Medicine, Yeungnam University, Daegu 42415, Korea
*
Author to whom correspondence should be addressed.
Healthcare 2021, 9(9), 1189; https://doi.org/10.3390/healthcare9091189
Submission received: 12 August 2021
/
Revised: 2 September 2021
/
Accepted: 8 September 2021
/
Published: 9 September 2021
(This article belongs to the Collection Aging and Chronic Disease: Experiences, Holisitic Care and Quality of Life)
Abstract
:Sarcopenia is characterized by a decline in systemic muscle mass and physical performance. Disc degeneration also causes back muscle atrophy. Therefore, we aimed to evaluate the influence of systemic muscle mass decline on back muscle atrophy and fatty infiltration compared to disc degeneration. We included 127 patients (65.54 ± 14.93 years) with back pain who underwent lumbar spine magnetic resonance imaging (MRI). Axial T2-weighted MRI data of the L4–5 and L5-S1 levels were used to measure the cross-sectional area (CSA) of the psoas and spinal muscles. The psoas index (cm2/m2) was used as a surrogate for systemic muscle mass. The Pfirrmann grading system was used to evaluate intervertebral disc degeneration. The functional area of the back muscles was calculated by subtracting the fat infiltration area from the CSA; the functional CSA ratio was calculated by dividing the functional CSA by the CSA. Image-processing software (ImageJ; National Institutes of Health, Bethesda, MD, USA) was used for analysis. Psoas index and aging significantly affected CSA and the ratio of functional CSA of the back muscles and multifidi. Disc degeneration did not significantly affect the back muscles beyond aging in patients with back pain. Males showed substantially higher CSA of the back muscles and multifidi than females; however, sex did not affect the functional CSA ratio of these muscles. Systemic muscle mass decline showed a more powerful influence on back muscle atrophy and fatty infiltration than disc degeneration. Therefore, proper evaluation of sarcopenia is needed for patients with chronic back pain and back muscle degeneration.
1. Introduction
Core stability is the principal factor in spinal stability and skeletal muscle activation. The muscles involved in core stability are activated before those of the extremities. Moreover, these muscles support the activities of the extremities [1]. The back muscles play a role in core stability. Disc degeneration was positively correlated with multifidus atrophy or fatty infiltration [2]. Furthermore, disc degeneration and spinal stenosis can injure the spinal nerves, which innervate the multifidi [3]. Consequently, patients with back pain show paraspinal muscle atrophy [4,5]. Activation patterns in the back and extremity muscles change in back pain patients [1]. Based on this notion, researchers have regarded back muscles as a key factor in chronic back pain. Core muscle strength training has been the focus of exercise treatment for patients with back pain. However, conflicting data reported that the cross-sectional area (CSA) of the back muscles was not significantly different between patients with LBP and healthy controls [5]. Sarcopenia is defined as low skeletal muscle mass and reduced muscle strength and physical performance in old age [6]. Sarcopenia and back muscle atrophy are closely associated with regard to general muscle atrophy. Moreover, most disc pathologies result from degenerative changes associated with aging. Accordingly, back muscle atrophy or fatty infiltration can also be a component of sarcopenia, similar to appendicular skeletal muscle atrophy.
There are many tools and patterns available for the measurement of appendicular skeletal muscle mass (ASM) or CSA of specific muscle groups [6]. Dual-energy X-ray absorptiometry (DXA) and bioelectrical impedance analyses are some examples. Alternative measurement methods have also been used to determine muscle quantity. The lumbar L3 CSA, mid-thigh muscle, and psoas muscle index can be used as surrogates for ASM. Although there are limitations of single muscle measurement in the assessment of muscle quantity, it is a simple and convenient method to measure increased usage in sarcopenia studies [7]. The psoas is located around the lumbar spine and innervated by the upper part of the L1-L3 spinal nerves. Thus, we used the psoas index (psoas muscle CSA/height2) as a surrogate for ASM in this study.
In this study, we aimed to determine the components of disc degeneration and sarcopenia. Loss of systemic muscle mass was hypothesized to be associated with back muscle atrophy and fatty infiltration in patients with chronic back pain.
2. Materials and Methods
2.1. Subjects
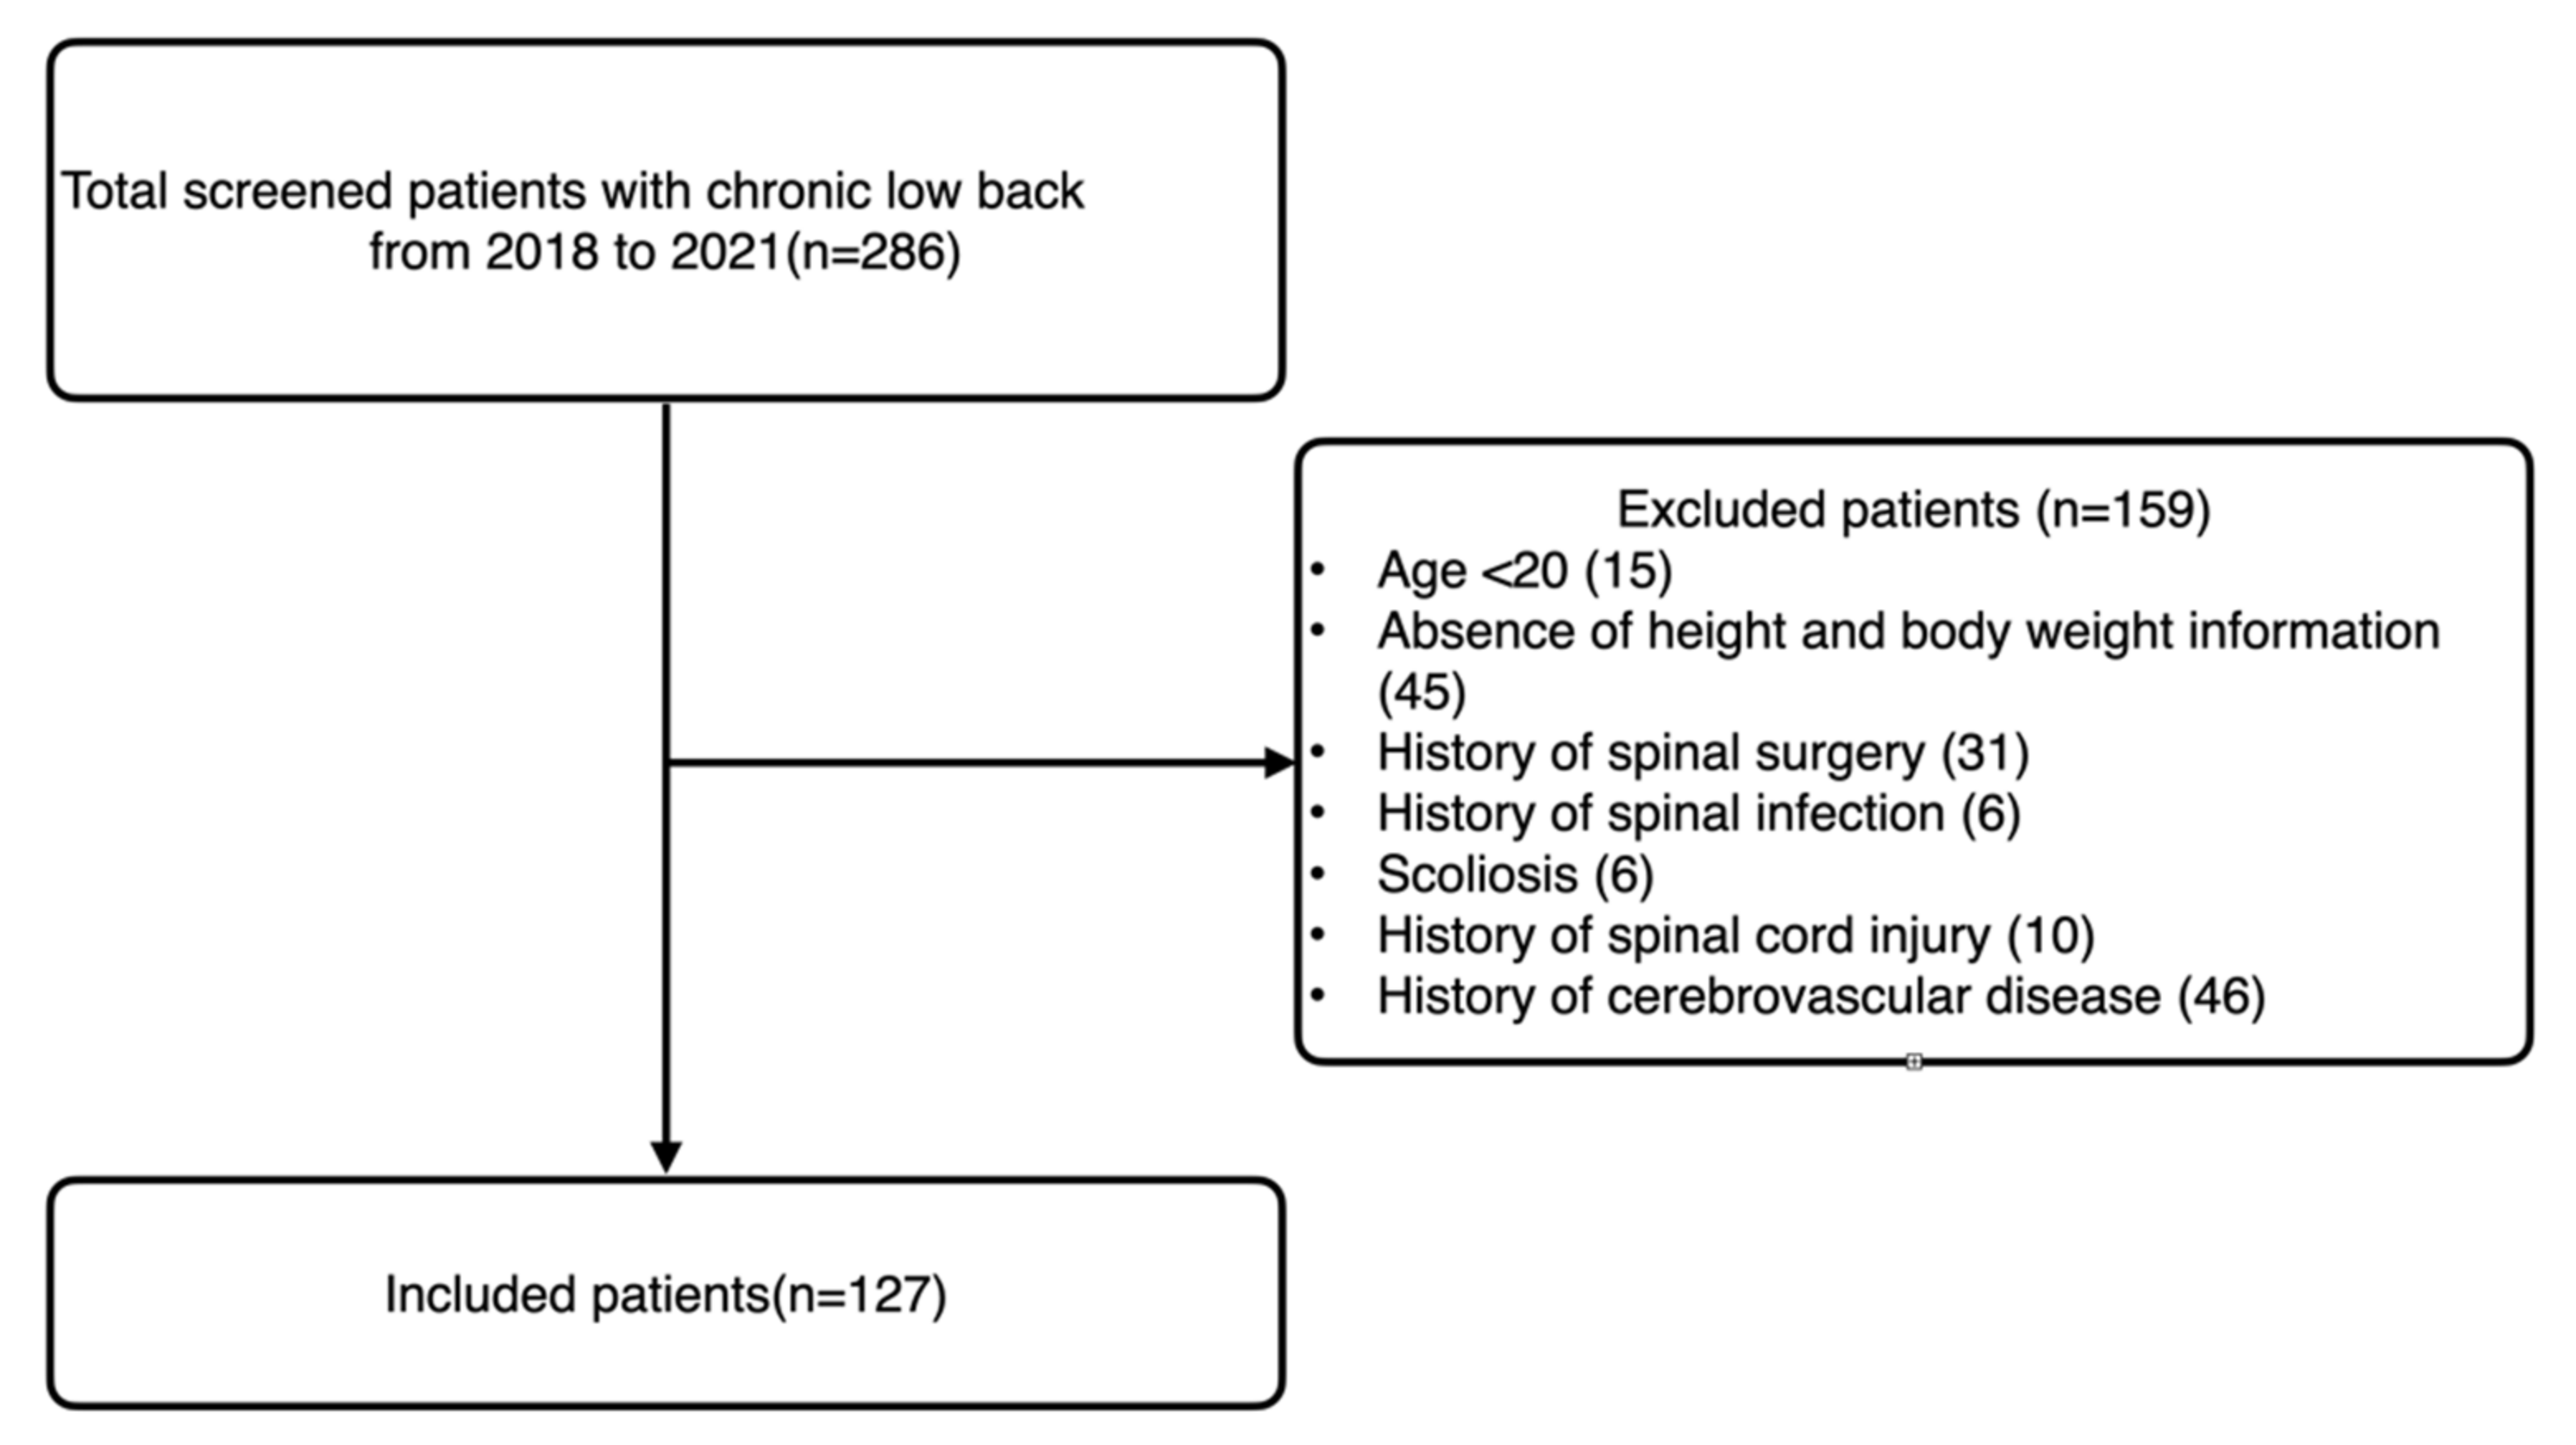
We performed a retrospective study of patients who visited our university hospital spine center for low back and/or radicular pain from 2018 to 2021. This study was approved by the institutional review board (YUMC 2021–07-042). The requirement for informed consent was waived. Patients aged ≥20 years who underwent lumbar spine magnetic resonance imaging (MRI) were included in the study. The exclusion criteria were as follows: (1) absence of height and body weight information, (2) history of spinal surgery, (3) history of spinal infection, (4) scoliosis, (5) history of spinal cord injury and subsequent inability to walk independently, and (6) history of cerebrovascular disease.
2.2. Measurements
All included patients underwent spinal MRI (1.5T MRI scanner, Siemens, Germany). A total of 127 patients with back pain were included (Figure 1). The mean age was 65.54 ± 14.93 years. Sagittal T2-weighted MRI was used to evaluate the disc degeneration. Axial T2-weighted MRI (repetition time/echo time, 3400/111; field of view, 157 × 180; and matrix size, 384 × 235) was used to measure the CSA of the psoas and spinal muscles. Fatty infiltration in the back muscles was also evaluated based on the axial T2-weighted images.
2.3. Pfirrmann Grading System
The Pfirrmann grading system was used to evaluate intervertebral disc (IVD) degeneration at the L4–5 and L5–S1 IVD levels [8]. This system is based on the disc signal intensity, the distinction between the annulus and nucleus, and the disc height. The grading system is defined as follows: Grade I: the structure of the disc is homogeneous, with a bright hyperintense white signal intensity and a normal disc height; Grade II: the structure of the disc is inhomogeneous but maintains a hyperintense white signal, and a horizontal margin may be present. The nucleus and annulus have distinct margins, and the disc height is normal; Grade III: the disc is inhomogeneous with intermediate gray signal intensity. The distinction between the nucleus and annulus is unclear, and the disc height is normal or slightly decreased; Grade IV: The structure of the disc is inhomogeneous with a hypointense dark gray signal intensity. There is no distinction between the nucleus and annulus, and the disc height is normal or moderately decreased; Grade V: the disc is inhomogeneous with hypointense black signal intensity. There is no distinction between the nucleus and annulus, and the disc space is collapsed.
2.4. CSA and Fatty Infiltration Measurement
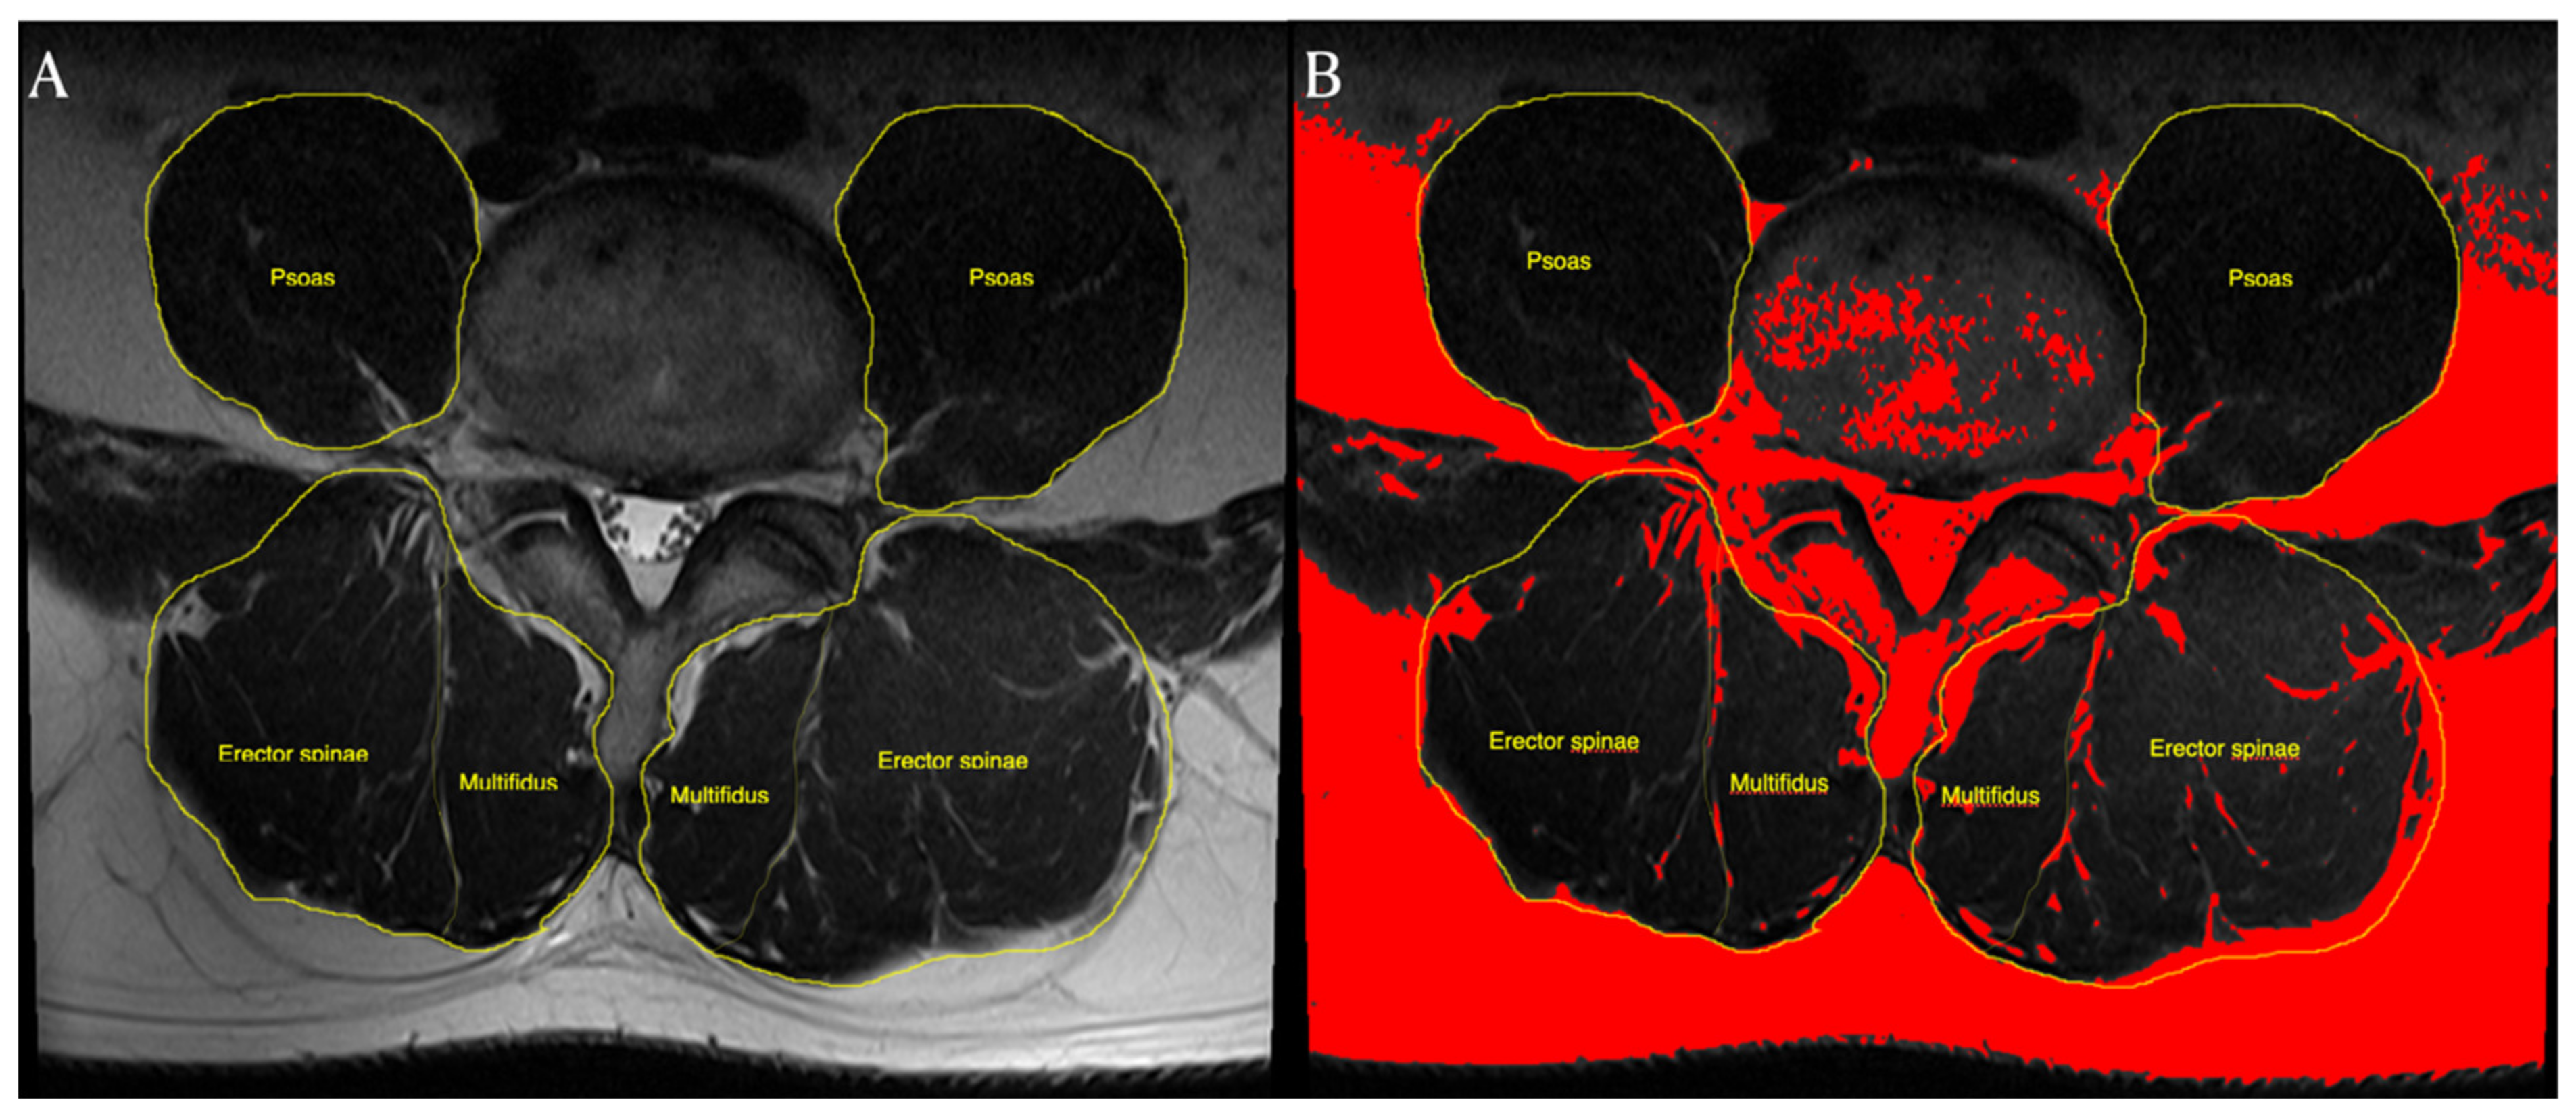
CSA measurement was performed using axial T2-weighted images at the L4–5, and L5–S1 levels. We used image-processing software (Image J; National Institutes of Health, Bethesda, MD, USA) to measure the CSA and fatty infiltration of muscles. DICOM files from the MRI were mounted using the Image J program. Subsequently, CSA measurements were performed by manually tracing the boundaries of each muscle. The CSA of the psoas muscle was measured at the L4–5 level. The psoas index (cm2/m2) was calculated (psoas index: bilateral psoas muscle CSA/height2) to evaluate potential sarcopenia [9]. In this study, we defined the back muscles as consisting of the multifidi and erector spinae muscles. This region was manually traced by following the thoracolumbar fascia, lateral margin of the spinous processes, posterior facets, cortical margin of the laminae, and dorsal side of the quadratus lumborum. The CSAs of the erector spinae (back muscles) and multifidi were measured separately (Figure 2A).
The rate of fat infiltration was measured using a pseudocoloring technique. We converted the 16-bit image to a pseudocolor 8-bit image. We then adjusted the threshold to assess fat infiltration. The fat tissue on the axial T2-weighted MR images was converted to a red color. We calculated the portion of the red area among the CSAs of the back muscles (Figure 2B). The functional area of the muscle was calculated by subtracting the fat infiltration area from the CSA of the back muscles [10]. The ratio of functional CSA of the back muscles and multifidi was calculated by dividing the functional CSA by the CSA.
2.5. Statistical Analysis
Statistical analysis was performed using SPSS (version 22.0; SPSS Inc., Chicago, IL, USA), and continuous variables are presented as mean ± standard deviation. A standard t-test was used to estimate differences between the sexes. Multivariate regression analysis was used to estimate the factors that significantly influenced the CSA and functional CSA of the back muscle and multifidus. Statistical significance was set at p < 0.05.
3. Results
The demographic data are summarized in Table 1. Males showed significantly higher CSA and ratio of functional CSA at the L4–5 and L5–S1 levels than females. Moreover, males had a significantly higher psoas index. Hence, male subjects showed preserved functional muscle mass, compared to female subjects. The back muscles at the L4–5 level showed a larger CSA than those at the L5–S1 level, whereas the multifidus at the L5–S1 level showed a larger CSA than that at the L4–5 level.
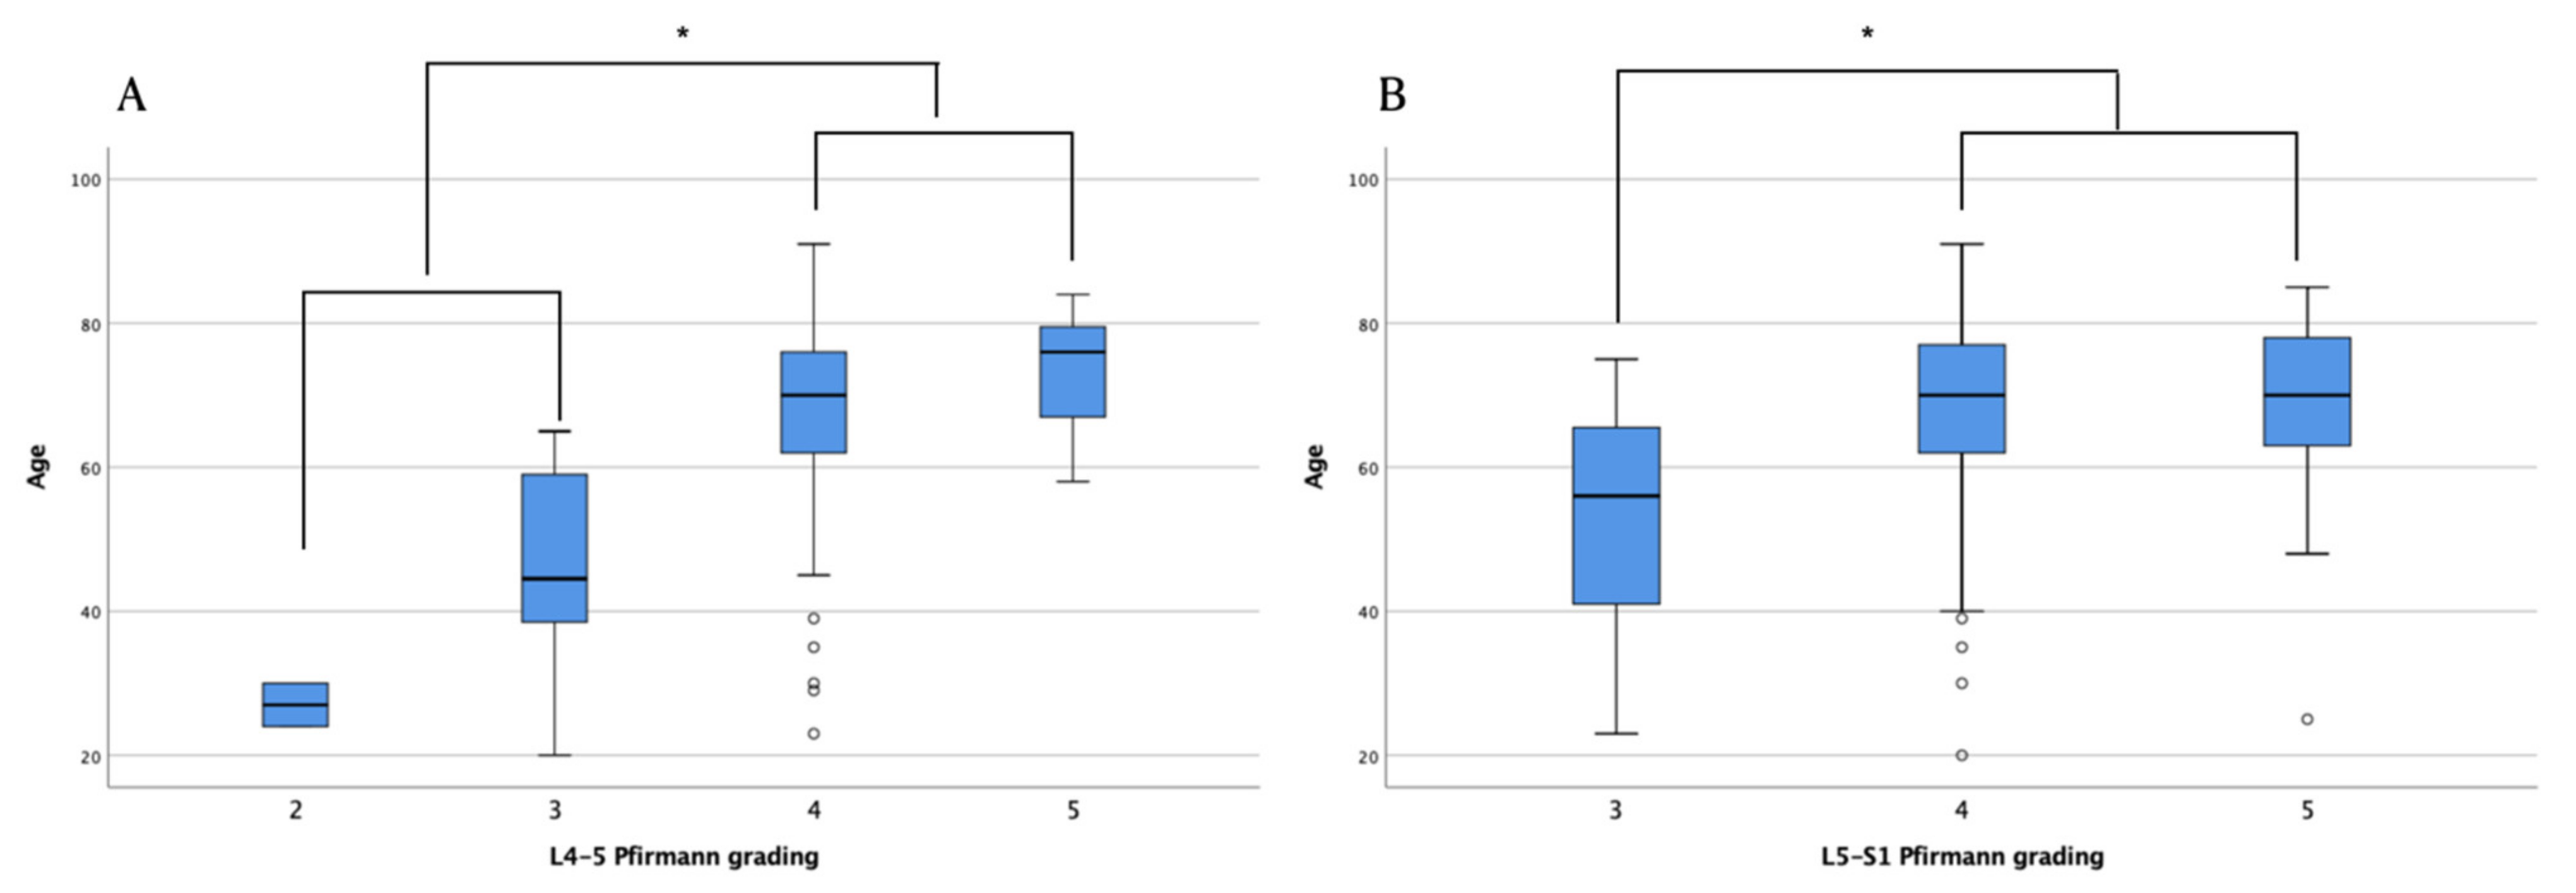
An association between the psoas index, sex, and CSA was found (Table 2). However, the Pfirrmann classification did not significantly affect the CSA of the back muscles, except for the multifidus at the L5–S1 level. Grades 4 and 5 Pfirrmann classifications were higher in older age groups than in relatively younger age groups (Figure 3). Although the Pfirrmann classification was shown to be associated with age, it did not have a significant relationship with CSA or the ratio of functional CSA (Table 3).
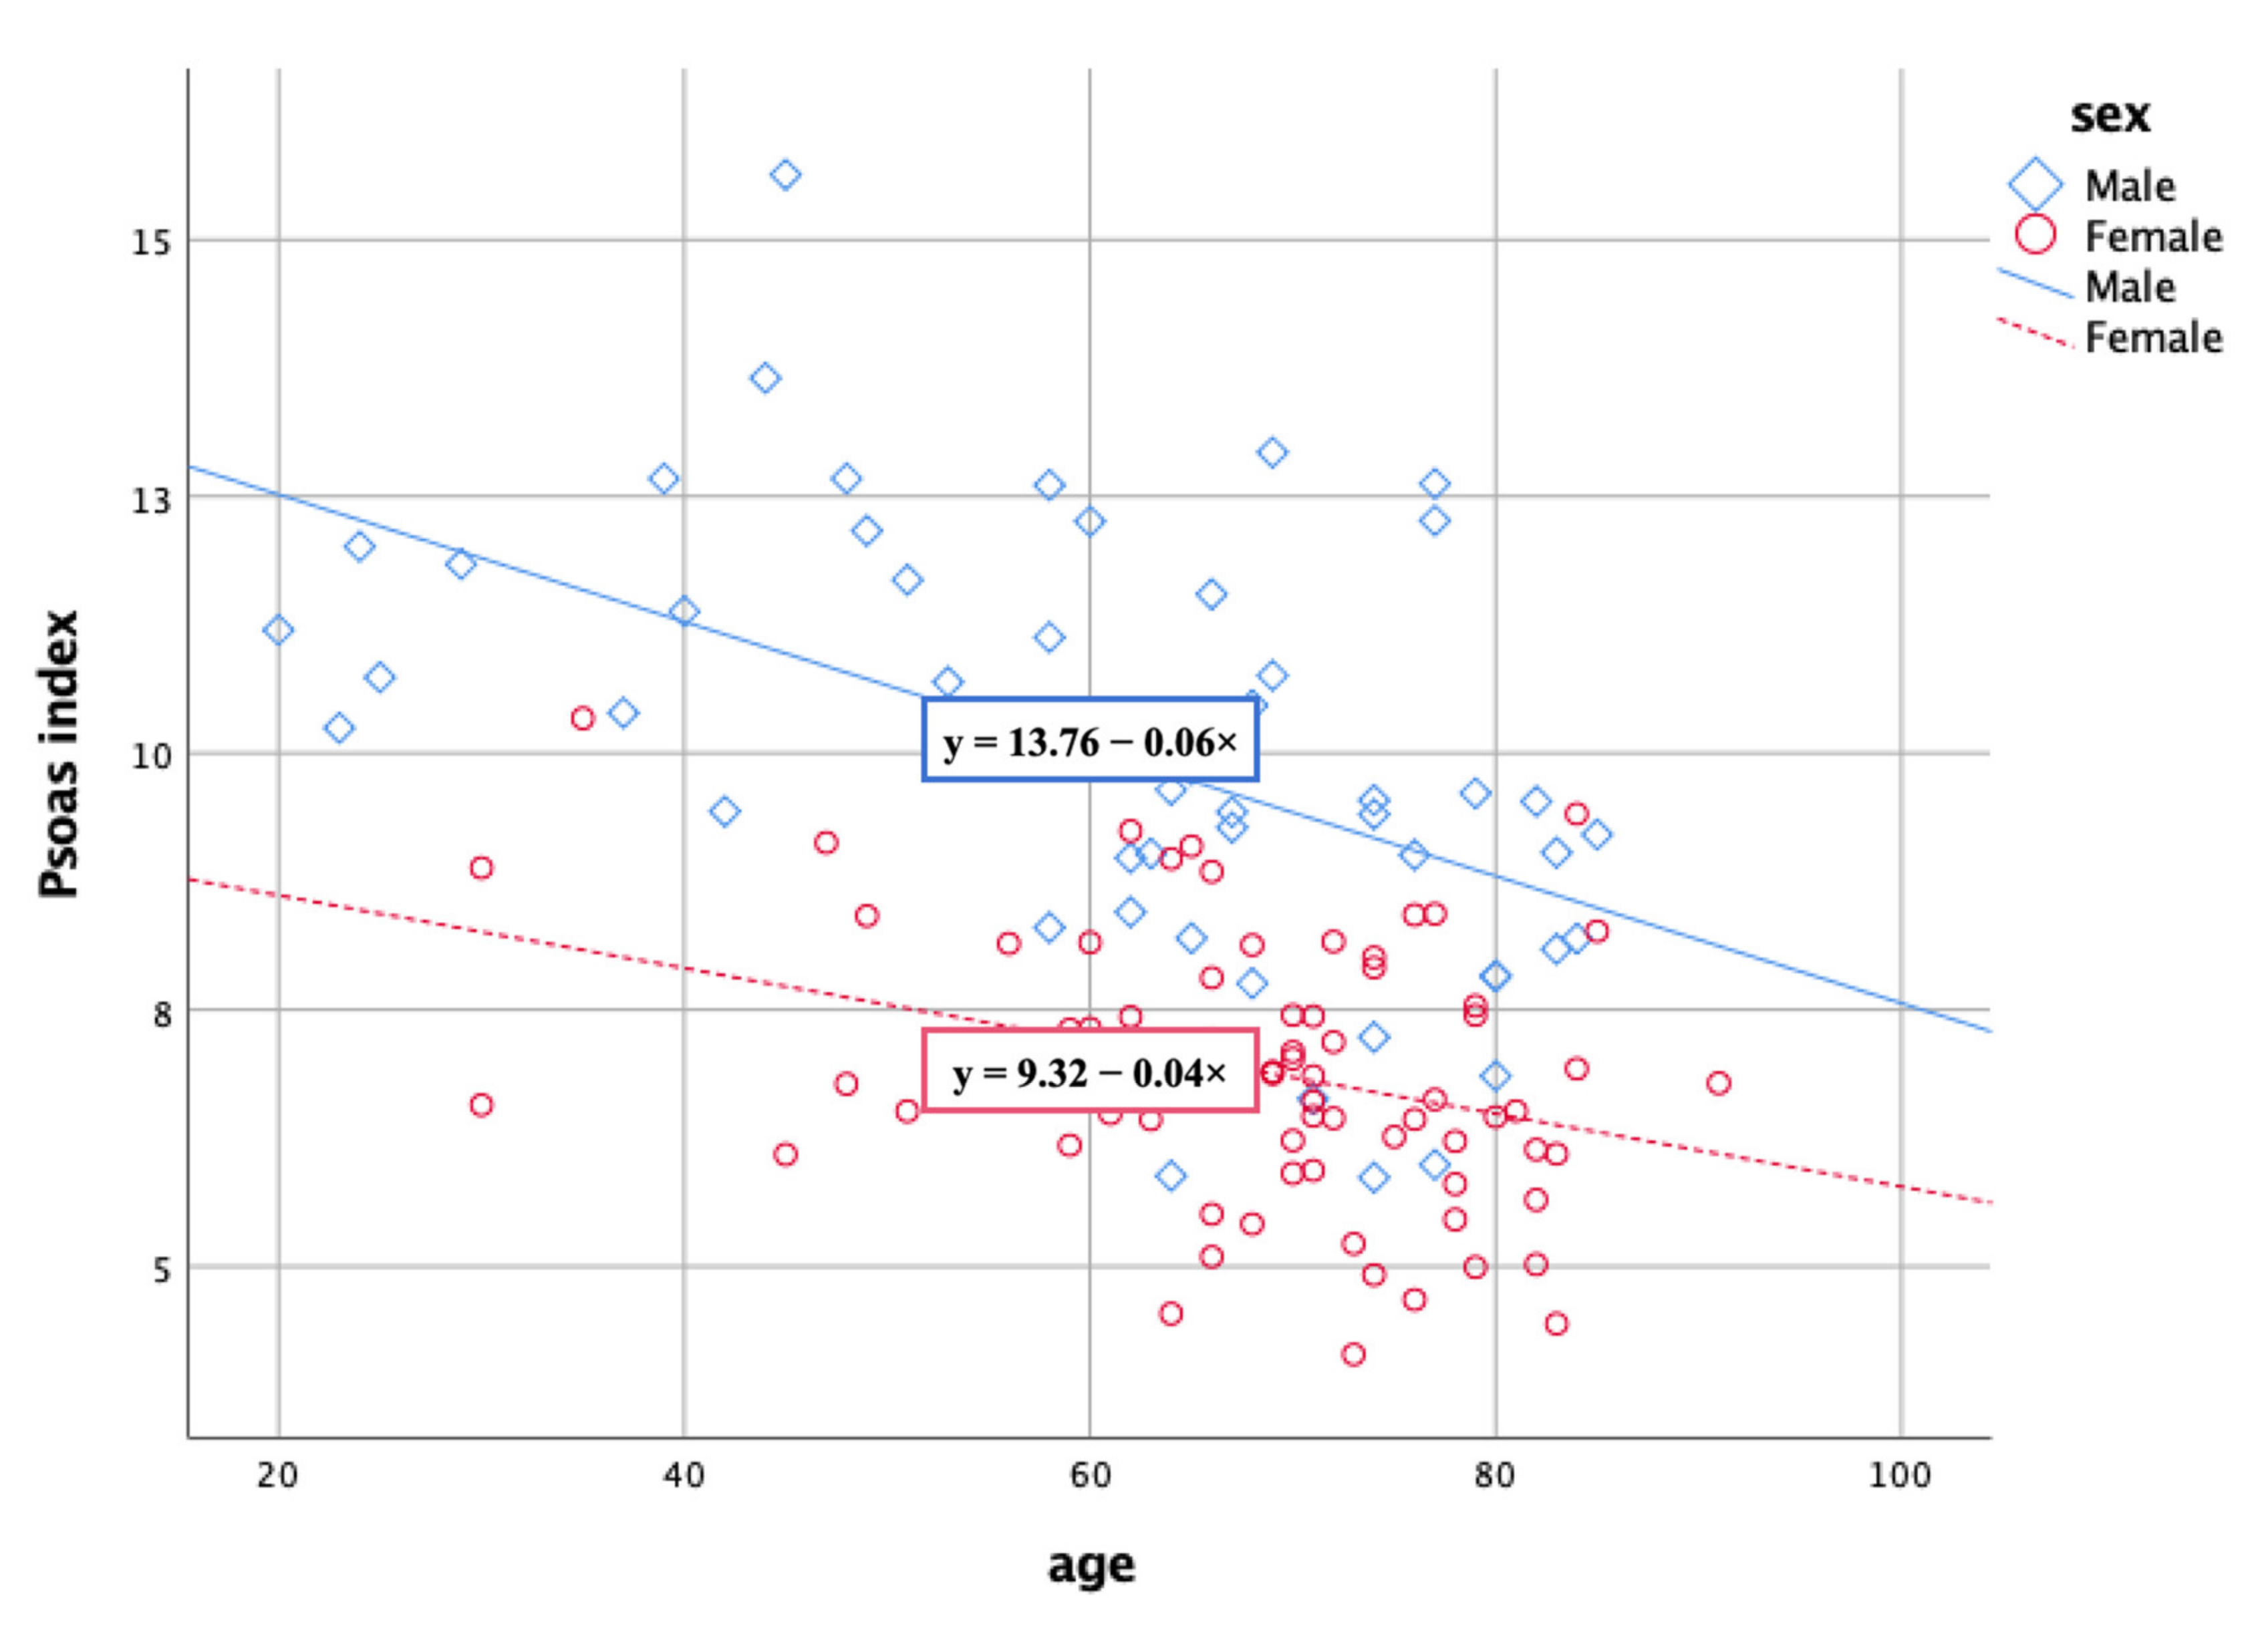
The Psoas index was found to be associated with the CSA and ratio of functional CSA of the back muscles and multifidi at the L4–5 and L5–S1 levels. Furthermore, the Psoas index decreased with increasing age (Figure 4). Generalized muscle atrophy and the psoas index were closely associated with back muscle atrophy. Male subjects showed significantly higher CSAs of the back muscles and multifidi than female subjects. However, sex did not affect the functional CSA ratio of these muscles.
4. Discussion
Disc degeneration affects back muscle atrophy. However, in our study, the psoas index and aging significantly influenced the CSA and ratio of functional CSA of the back muscles and multifidi, and disc degeneration did not significantly affect the back muscles beyond aging in patients with back pain. These results showed that disc degeneration and generalized muscle atrophy significantly affected back muscle atrophy and fatty infiltration.
Disc degeneration increases the possibility of injury to nerves innervating the back muscles. Moreover, disc herniation produces inflammation that damages the nerve roots, resulting in the denervation of the back muscles [11,12]. Furthermore, in addition to ligament and bony hypertrophy, decreased disc height following disc degeneration causes foraminal and central stenosis [13]. Spinal stenosis also damages nerves innervating the back muscles [14]. Thus, disc degeneration is known to be closely related to injury of spinal nerves innervating the back muscles.
Studies have investigated the relationship between disc degeneration and back muscle atrophy based on the notion that disc degeneration may induce back muscle functional deterioration. Disc degeneration was correlated with multifidus atrophy [8]; however, the relationship was weak. In the previous study, the mean age was 47.22 ± 15.08 years. Moreover, the sample size of 35 patients was small. The younger age and small sample size could have limited the investigation of the influence of age on back muscle atrophy. Disc herniation increased fat infiltration on the ipsilateral side compared to that on the contralateral side [15]. Moreover, ipsilateral injury of the spinal nerve increased fatty infiltration of the ipsilateral multifidus. However, we did not compare both sides of the back muscles and multifidi. Although we did not investigate the asymmetry of back muscles, the clinical significance of this study was the comparison of back muscle atrophy and fatty infiltration with aging and disc degeneration.
Sarcopenia is defined as the loss of generalized skeletal muscle mass and function. Evaluation tools for sarcopenia measured muscle strength and quality, as well as physical performance [6]. Tool selection depends on the technical equipment, the purpose of evaluation, and patients’ clinical situations. Our subjects presented with back pain; therefore, we used MRI to evaluate sarcopenia. The psoas index correlated with skeletal muscle index and skeletal muscle mass adjusted for individual patient heights [16]. Moreover, its cut-off value for sarcopenia correlated well with the skeletal muscle index [17]. Therefore, we used the psoas index for sarcopenia to evaluate the relationship between back muscle atrophy and fatty infiltration.
Various clinical factors, including obesity, diabetes mellitus, myopathy, and peripheral neuropathy, yield intramuscular adipose tissue infiltration [18,19]. Fatty infiltration has also been shown to decrease physical function. Moreover, a decrease in skeletal muscle mass and an increase in intramuscular adipose tissue were found to be associated with aging [20]. Consequently, it can be surmised that the degree of intramuscular fatty infiltration in older individuals lowers physical performance [21].
Patients with lumbar degenerative spondylolisthesis showed multifidus muscle atrophy with erector spinae hypertrophy [22]. The multifidi actively stabilize the lumbar spine [23]. Atrophy or decreased function of these muscles could decrease lumbar spine stability. Therefore, in clinical practice, proper evaluation of the back muscles is essential to improve the stability of the spine. This study showed that aging, particularly sarcopenia, profoundly affects muscle degeneration and fatty infiltration of the lumbar spine. Therefore, generalized muscle atrophy can also influence fatty infiltration of the back muscles.
The prevalence of benign low back pain was shown to increase until the sixth decade of life and decrease thereafter [24]; however, the incidence of severe back pain continued to rise after the sixth decade. Elderly patients with chronic back pain for over 65 years had lower skeletal muscle mass than those without chronic back pain [25]. Body fat composition was higher in patients with chronic back pain. Therefore, fat infiltration of multifidi correlated with aging [26]. Our study also showed that the psoas index, a surrogate of generalized muscle atrophy, can profoundly influence back muscle atrophy and fatty infiltration beyond disc degeneration.
Exercise has been the treatment of choice for chronic back pain [27]. Resistance exercise has been shown to decrease intramuscular fatty infiltration in older individuals [28]. Therefore, considering that sarcopenia decreases back muscle mass and quality, exercise should be considered as a treatment strategy. Furthermore, physicians should pay attention to back muscles, as sarcopenia is associated with back pain.
Differences in total body mass between the sexes have been observed. Furthermore, trunk muscle mass showed a much larger difference between sexes than in other body regions [29]. Similarly, our data also showed that males had a larger back muscle CSA than females. Estrogen regulates muscular metabolism and maintains muscle mass [30,31]. However, sex hormones in females significantly decline during menopause. Thus, menopause induces remarkable functional and physiological changes in women, such as diminished muscle mass. The rapid decline in sex hormones has been shown to accelerate muscle atrophy in postmenopausal females [32]. Nonetheless, high-level physical activity in late perimenopausal females increased the appendicular lean muscle mass. Therefore, to decrease the risk of sarcopenia, physical activity and exercise should be actively considered in postmenopausal women with chronic back pain.
Our study has several limitations. First, we did not have any physical performance data of the subjects. Sarcopenia is defined as low muscular strength, muscle quantity, and physical performance. Therefore, it is necessary to evaluate the relationship between back muscles and physical performance. The second is the measurement of slice variability. Although we chose the bony landmark for measurement, the slice of the spine MRI was already manually adopted as an MRI scanner. Subsequently, we selected the optimal slice. However, all spine MRIs were conducted in a single medical center using the same MRI scan technique.
5. Conclusions
In conclusion, a systemic muscular decline is correlated with back muscle atrophy and fatty infiltration rather than disc degeneration. Therefore, a strategy for maintaining muscle mass is needed for older patients with chronic back pain.
Author Contributions
Conceptualization, M.K.; methodology, M.K. and D.L.; validation, D.L.; formal analysis, D.L.; investigation, M.K.; data curation, D.L.; writing—original draft preparation, D.L.; writing—review and editing, M.K. All authors have read and agreed to the published version of the manuscript.
Funding
This work was supported by a grant from the Chunma Medical Research Foundation, Korea, 2021.
Institutional Review Board Statement
The study was conducted according to the guidelines of the Declaration of Helsinki and approved by the Institutional Review Board of YEUNGNAM UNIVERSITY HOSPITAL (YUMC 2021-07-042 and dated 30 August 2021).
Informed Consent Statement
The need for patient consent was waived due to the retrospective nature of this study.
Data Availability Statement
The datasets used and/or analyzed during the current study are available from the corresponding author upon reasonable request.
Conflicts of Interest
The authors declare no conflict of interest. No commercial party having a direct financial interest in the results of the research supporting this article has or will confer a benefit on the authors or on any organization with which the authors are associated.
References
- MacDonald, D.; Moseley, L.G.; Hodges, P.W. Why do some patients keep hurting their back? Evidence of ongoing back muscle dysfunction during remission from recurrent back pain. Pain 2009, 142, 183–188. [Google Scholar] [CrossRef]
- Sun, D.; Liu, P.; Cheng, J.; Ma, Z.; Liu, J.; Qin, T. Correlation between intervertebral disc degeneration, paraspinal muscle atrophy, and lumbar facet joints degeneration in patients with lumbar disc herniation. BMC Musculoskelet. Disord. 2017, 18, 167. [Google Scholar] [CrossRef] [Green Version]
- Huppertz, H.J.; Disselhorst-klug, C.; Silny, J.; Rau, G.; Heimann, G. Diagnostic yield of noninvasive high spatial resolution electromyography in neuromuscular diseases. Muscle Nerve Off. J. Am. Assoc. Electrodiagn. Med. 1997, 20, 1360–1370. [Google Scholar] [CrossRef]
- Paalanne, N.; Niinimäki, J.; Karppinen, J.; Taimela, S.; Mutanen, P.; Takatalo, J.; Korpelainen, R.; Tervonen, O. Assessment of association between low back pain and paraspinal muscle atrophy using opposed-phase magnetic resonance imaging: A population-based study among young adults. Spine 2011, 36, 1961–1968. [Google Scholar] [CrossRef] [PubMed]
- D’Hooge, R.; Cagnie, B.; Crombez, G.; Vanderstraeten, G.; Dolphens, M.; Danneels, L. Increased intramuscular fatty infiltration without differences in lumbar muscle cross-sectional area during remission of unilateral recurrent low back pain. Man. Ther. 2012, 17, 584–588. [Google Scholar] [CrossRef] [Green Version]
- Cruz-Jentoft, A.J.; Bahat, G.; Bauer, J.; Boirie, Y.; Bruyère, O.; Cederholm, T.; Cooper, C.; Landi, F.; Rolland, Y.; Sayer, A.A.; et al. Writing group for the European working group on Sarcopenia in older people 2 (EWGSOP2), and the extended group for EWGSOP2. Sarcopenia: Revised European consensus on definition and diagnosis. Age Ageing 2019, 48, 16–31. [Google Scholar] [CrossRef] [PubMed] [Green Version]
- Hanaoka, M.; Yasuno, M.; Ishiguro, M.; Yamauchi, S.; Kikuchi, A.; Tokura, M.; Ishikawa, T.; Nakatani, E.; Uetake, H. Morphologic change of the psoas muscle as a surrogate marker of sarcopenia and predictor of complications after colorectal cancer surgery. Int. J. Color. Dis. 2017, 32, 847–856. [Google Scholar] [CrossRef]
- Faur, C.; Patrascu, J.M.; Haragus, H.; Anglitoiu, B. Correlation between multifidus fatty atrophy and lumbar disc degeneration in low back pain. BMC Musculoskelet. Disord. 2019, 20, 1–6. [Google Scholar] [CrossRef] [PubMed] [Green Version]
- Prashanthi, P.L.; Ramachandran, R.; Adhilakshmi, A.; Radhan, P.; Sai, V. Standardization of PSOAS muscle index measurements using computed tomography. Int. J. Contemp. Med. Surg. Radiol. 2020, 5. [Google Scholar] [CrossRef]
- Park, W.; Kim, J.; Kim, M.; Min, K. Asymmetric atrophy of the multifidus in persons with hemiplegic presentation post-stroke. Top. Stroke Rehabil. 2020, 28, 519–530. [Google Scholar] [CrossRef] [PubMed]
- Matsui, Y.; Maeda, M.; Nakagami, W.; Iwata, H. The involvement of matrix metalloproteinases and inflammation in lumbar disc herniation. Spine 1998, 23, 863–868. [Google Scholar] [CrossRef] [PubMed]
- Takahashi, N.; Yabuki, S.; Aoki, Y.; Kikuchi, S. Pathomechanisms of nerve root injury caused by disc herniation: An experimental study of mechanical compression and chemical irritation. Spine 2003, 28, 435–441. [Google Scholar] [CrossRef] [PubMed]
- Szpalski, M.; Gunzburg, R. Lumbar spinal stenosis in the elderly: An overview. Eur. Spine J. 2003, 12, S170–S175. [Google Scholar] [CrossRef] [Green Version]
- Haig, A.J.; Tong, H.C.; Yamakawa, K.S.J.; Quint, D.J.; Hoff, J.T.; Chiodo, A.; Miner, J.A.; Choksi, V.R.; Geisser, M.E. The sensitivity and specificity of electrodiagnostic testing for the clinical syndrome of lumbar spinal stenosis. Spine 2005, 30, 2667–2676. [Google Scholar] [CrossRef] [PubMed]
- Colakoglu, B.; Alis, D. Evaluation of lumbar multifidus muscle in patients with lumbar disc herniation: Are complex quantitative MRI measurements needed? J. Int. Med Res. 2019, 47, 3590–3600. [Google Scholar] [CrossRef] [PubMed] [Green Version]
- Kim, J.S.; Kim, W.Y.; Park, H.K.; Kim, M.C.; Jung, W.; Ko, B.S. Simple age specific cutoff value for sarcopenia evaluated by computed tomography. Ann. Nutr. Metab. 2017, 71, 157–163. [Google Scholar] [CrossRef] [PubMed]
- Ohara, M.; Suda, G.; Kimura, M.; Maehara, O.; Shimazaki, T.; Shigesawa, T.; Suzuki, K.; Nakamura, A.; Kawagishi, N.; Nakai, M.; et al. Analysis of the optimal psoas muscle mass index cut-off values, as measured by computed tomography, for the diagnosis of loss of skeletal muscle mass in Japanese people. Hepatol. Res. 2020, 50, 715–725. [Google Scholar] [CrossRef]
- Hilton, T.N.; Tuttle, L.J.; Bohnert, K.L.; Mueller, M.J.; Sinacore, D.R. Excessive adipose tissue infiltration in skeletal muscle in individuals with obesity, diabetes mellitus, and peripheral neuropathy: Association with performance and function. Phys. Ther. 2008, 88, 1336–1344. [Google Scholar] [CrossRef] [Green Version]
- Ansari, B.; Salort-Campana, E.; Ogier, A.; le Troter, A.; de Sainte Marie, B.; Guye, M.; Delmont, E.; Grapperon, A.M.; Verschueren, A.; Bendahan, D.; et al. Quantitative muscle MRI study of patients with sporadic inclusion body myositis. Muscle Nerve 2020, 61, 496–503. [Google Scholar] [CrossRef]
- Song, M.-Y.; Ruts, E.; Kim, J.; Janumala, I.; Heymsfield, S.; Gallagher, D. Sarcopenia and increased adipose tissue infiltration of muscle in elderly African American women. Am. J. Clin. Nutr. 2004, 79, 874–880. [Google Scholar] [CrossRef]
- Marcus, R.L.; Addison, O.; Dibble, L.E.; Foreman, K.B.; Morrell, G.; LaStayo, P. Intramuscular adipose tissue, sarcopenia, and mobility function in older individuals. J. Aging Res. 2012, 2012, 1–6. [Google Scholar] [CrossRef] [PubMed]
- Wang, G.; Karki, S.B.; Xu, S.; Hu, Z.; Chen, J.; Zhou, Z.; Fan, S. Quantitative MRI and X-ray analysis of disc degeneration and paraspinal muscle changes in degenerative spondylolisthesis. J. Back Musculoskelet. Rehabil. 2015, 28, 277–285. [Google Scholar] [CrossRef] [PubMed]
- Freeman, M.D.; Woodham, M.A.; Woodham, A.W. The role of the lumbar multifidus in chronic low back pain: A review. PM&R 2010, 2, 142–146. [Google Scholar] [CrossRef]
- Dionne, C.E.; Dunn, K.M.; Croft, P.R. Does back pain prevalence really decrease with increasing age? A systematic review. Age Ageing 2006, 35, 229–234. [Google Scholar] [CrossRef] [PubMed] [Green Version]
- Sakai, Y.; Matsui, H.; Ito, S.; Hida, T.; Ito, K.; Koshimizu, H.; Harada, A. Sarcopenia in elderly patients with chronic low back pain. Osteoporos. Sarcopenia 2017, 3, 195–200. [Google Scholar] [CrossRef]
- Ogon, I.; Takebayashi, T.; Takashima, H.; Morita, T.; Yoshimoto, M.; Terashima, Y.; Yamashita, T. Quantitative analysis concerning atrophy and fat infiltration of the multifidus muscle with magnetic resonance spectroscopy in chronic low back pain. Spine Surg. Relat. Res. 2019, 3, 163–170. [Google Scholar] [CrossRef] [Green Version]
- Liddle, S.D.; Baxter, D.; Gracey, J.H. Exercise and chronic low back pain: What works? Pain 2004, 107, 176–190. [Google Scholar] [CrossRef]
- Marcus, R.; Addison, O.; Kidde, J.; Dibble, L.; Lastayo, P. Skeletal muscle fat infiltration: Impact of age, inactivity, and exercise. J. Nutr. Health Aging 2010, 14, 362–366. [Google Scholar] [CrossRef] [Green Version]
- Abe, T.; Kearns, C.F.; Fukunaga, T. Sex differences in whole body skeletal muscle mass measured by magnetic resonance imaging and its distribution in young Japanese adults. Br. J. Sports Med. 2003, 37, 436–440. [Google Scholar] [CrossRef] [Green Version]
- Kim, Y.J.; Tamadon, A.; Park, H.T.; Kim, H.; Ku, S.-Y. The role of sex steroid hormones in the pathophysiology and treatment of sarcopenia. Osteoporos. Sarcopenia 2016, 2, 140–155. [Google Scholar] [CrossRef] [Green Version]
- Choi, K.H.; Lee, J.H.; Lee, D.G. Sex-related differences in bone metabolism in osteoporosis observational study. Medicine 2021, 100, e26153. [Google Scholar] [CrossRef] [PubMed]
- Sipilä, S.; Törmäkangas, T.; Sillanpää, E.; Aukee, P.; Kujala, U.M.; Kovanen, V.; Laakkonen, E.K. Muscle and bone mass in middle-aged women: Role of menopausal status and physical activity. J. Cachexia Sarcopenia Muscle 2020, 11, 698–709. [Google Scholar] [CrossRef] [PubMed]
Figure 1.
Flowchart of patient inclusion and exclusion.

Figure 2.
We defined the back muscles as consisting of the multifidi and erector spinae muscles. This region was manually traced. The CSA of the back muscles and multifidi were measured separately: (A) the rate of fat infiltration was measured using the pseudocoloring technique in the software. Fat tissue on axial T2-weighted MR image was converted to red. We calculated the portion of red area among the CSA of back muscles (B).

Figure 3.
Distribution of age according to the Pfirrmann grading system. Pfirrmann grades 4 and 5 had a higher age than Pfirrmann grades 2 and 3 at L4–5 level (A), and Pfirrmann grade 3 at L5–S1 level (B), respectively. Older ages showed higher disc degeneration grading. Box and whisker plot present the median (middle line), the 25th and 75th percentiles (box limits). The circles are below 5th percentile of the distribution. * p < 0.05.

Figure 4.
Psoas index and age showing a negative correlation. Age and sex affected psoas index.


Table 1.
Demographic data.
| Total | Male | Female | p-Value | |||
|---|---|---|---|---|---|---|
| Sex (male: female) | 127 | 51 | 76 | |||
| Age | 65.54 ± 14.93 | 61.41 ± 17.77 | 68.32 ± 12.03 | 0.01 * | ||
| Psoas CSA (cm2) | 21.39 ± 8.19 | 28.61 ± 7.77 | 16.54 ± 3.63 | 0.00 * | ||
| Psoas index | 8.13 ± 2.25 | 9.95 ± 2.15 | 6.90 ± 1.28 | 0.00 * | ||
| Back muscles (cm2) | L4–5 | CSA (cm2) | 43.77 ± 9.50 | 49.90 ± 9.32 | 39.65 ± 7.15 | 0.00 * |
| Ratio of functional CSA | 0.73 ± 0.12 | 0.78 ± 0.12 | 0.69 ± 0.11 | 0.00 * | ||
| L5–S1 | CSA (cm2) | 33.57 ± 9.31 | 38.92 ± 9.70 | 29.98 ± 7.12 | 0.00 * | |
| Ratio of functional CSA | 0.67 ± 0.13 | 0.73 ± 0.12 | 0.63 ± 0.12 | 0.00 * | ||
| Multifidus muscle (cm2) | L4–5 | CSA (cm2) | 16.14 ± 4.43 | 18.93 ± 4.71 | 14.27 ± 3.05 | 0.00 * |
| Ratio of functional CSA | 0.67 ± 0.16 | 0.74 ± 0.16 | 062 ± 0.15 | 0.00 * | ||
| L5–S1 | CSA (cm2) | 18.04 ± 4.47 | 20.68 ± 4.26 | 16.27 ± 3.69 | 0.00 * | |
| Ratio of functional CSA | 0.65 ± 0.16 | 0.72 ± 0.15 | 0.60 ± 0.16 | 0.00 * | ||
| Pfirmann classification | ||||||
| L4–5 | 1 2 3 4 5 | 0 2 12 98 15 | 0 1 11 33 6 | 0 1 1 65 9 | ||
| L5–S1 | 1 2 3 4 5 | 0 1 18 91 17 | 0 0 11 34 6 | 0 1 7 57 11 | ||
CSA: cross-sectional area, * p < 0.05.
Table 2.
Multivariant regression analysis of psoas index, age, Pfirrmann classification, and sex according to the ratio of functional CSA and CSA of back muscles.
Table 2.
Multivariant regression analysis of psoas index, age, Pfirrmann classification, and sex according to the ratio of functional CSA and CSA of back muscles.
| Ratio of Functional CSA | CSA of Back Muscles | ||||
|---|---|---|---|---|---|
| Factors | L4–5 | L5–S1 | L4–5 | L5–S1 | |
| Psoas index | Mean ± SD (cm2) | 8.13 ± 2.25 | |||
| B | 0.02 | 0.02 | 1.61 | 1.12 | |
| SE | 0.006 | 0.00 | 0.42 | 0.44 | |
| β | 0.49 | 0.49 | 0.38 | 0.27 | |
| p | 0.00 * | 0.00 * | 0.00 * | 0.01 * | |
| Age | Mean ± SD (cm2) | 65.54 ± 14.93 | |||
| B | −0.03 | −0.00 | −0.10 | −0.10 | |
| SE | 0.00 | 0.00 | 0.05 | 0.05 | |
| β | −0.30 | −0.27 | −0.16 | −0.16 | |
| p | 0.00 * | 0.00 * | 0.06 | 0.07 | |
| Pfirmann classification | B | −0.02 | −0.01 | −1.92 | −2.68 |
| SE | 0.01 | 0.01 | 1.40 | 1.48 | |
| β | −0.08 | −0.06 | −0.10 | −0.15 | |
| p | 0.28 | 0.38 | 0.17 | 0.07 | |
| Sex | B | 0.01 | 0.00 | −4.22 | −4.21 |
| SE | 0.02 | 0.02 | 1.74 | 1.84 | |
| β | 0.07 | 0.03 | −0.21 | −0.22 | |
| p | 0.43 | 0.71 | 0.01 * | 0.02 * | |
| Adj R2 | 0.47 | 0.44 | 0.42 | 0.35 | |
| p | 0.00 * | 0.00 * | 0.00 * | 0.00 * | |
CSA: cross-sectional area, * p < 0.05.
Table 3.
Multivariant regression analysis of psoas index, age, Pfirrmann classification, and sex according to the ratio of functional CSA and CSA of multifidus muscle.
Table 3.
Multivariant regression analysis of psoas index, age, Pfirrmann classification, and sex according to the ratio of functional CSA and CSA of multifidus muscle.
| Ratio of Functional CSA | CSA of Multifidus | ||||
|---|---|---|---|---|---|
| Factors | L4–5 | L5–S1 | L4–5 | L5–S1 | |
| Psoas index | Mean ± SD (cm2) | 8.13 ± 2.25 | |||
| B | 0.02 | 0.03 | 75.34 | 92.33 | |
| SE | 0.00 | 0.00 | 18.26 | 20.19 | |
| β | 0.38 | 0.40 | 0.36 | 0.40 | |
| p | 0.00 * | 0.00 * | 0.00 * | 0.00 * | |
| Age | Mean ± SD (cm2) | 65.54 ± 14.93 | |||
| B | −0.00 | −0.00 | −10.26 | −10.93 | |
| SE | 0.00 | 0.00 | 2.36 | 2.41 | |
| β | −0.40 | −0.33 | −0.33 | −0.31 | |
| p | 0.00 * | 0.00 * | 0.00 * | 0.00 * | |
| Pfirmann classification | B | −0.01 | −0.04 | −36.59 | −132.51 |
| SE | 0.02 | 0.02 | 60.95 | 57.65 | |
| β | −0.03 | −0.13 | −0.04 | −0.14 | |
| p | 0.61 | 0.05 | 0.54 | 0.02 * | |
| Sex | B | −0.00 | −0.00 | −208.20 | −151.88 |
| SE | 0.03 | 0.03 | 75.94 | 83.63 | |
| β | −0.01 | −0.00 | −0.22 | −0.14 | |
| p | 0.89 | 0.97 | 0.00 * | 0.02 * | |
| Adj R2 | 0.49 | 0.46 | 0.55 | 0.57 | |
| p | 0.00 * | 0.00 * | 0.00 * | 0.00 * | |
CSA: cross-sectional area, * p < 0.05.
Publisher’s Note: MDPI stays neutral with regard to jurisdictional claims in published maps and institutional affiliations. |
© 2021 by the authors. Licensee MDPI, Basel, Switzerland. This article is an open access article distributed under the terms and conditions of the Creative Commons Attribution (CC BY) license (https://creativecommons.org/licenses/by/4.0/).
Share and Cite
MDPI and ACS Style
Lee, D.; Kang, M. Correlation between Psoas Muscle Index and Degeneration of Spinal Back Muscle in Patients with Back Pain. Healthcare 2021, 9, 1189. https://doi.org/10.3390/healthcare9091189
AMA Style
Lee D, Kang M. Correlation between Psoas Muscle Index and Degeneration of Spinal Back Muscle in Patients with Back Pain. Healthcare. 2021; 9(9):1189. https://doi.org/10.3390/healthcare9091189
Chicago/Turabian StyleLee, Donggyu, and Minsoo Kang. 2021. "Correlation between Psoas Muscle Index and Degeneration of Spinal Back Muscle in Patients with Back Pain" Healthcare 9, no. 9: 1189. https://doi.org/10.3390/healthcare9091189
Note that from the first issue of 2016, this journal uses article numbers instead of page numbers. See further details here.