
Effect of Water Content on Apparent Cohesion of Soils from Landslide Sites


School of Engineering & Built Environment, Griffith University, Gold Coast, QLD 4222, Australia
*
Author to whom correspondence should be addressed.
Geotechnics 2022, 2(2), 385-394; https://doi.org/10.3390/geotechnics2020017
Submission received: 18 January 2022
/
Revised: 27 April 2022
/
Accepted: 28 April 2022
/
Published: 29 April 2022
(This article belongs to the Special Issue Recent Advances in Geotechnical Engineering)
Abstract
:There are many empirical equations published for unsaturated fine-grained soils. However, there is only one empirical equation established for silty sand using the shear-box test and filter-paper-based suction test, but with the suction range of 0 to 200 kPa. It is reported that there is a significant discrepancy between the predicted values and test results of apparent cohesion within the range of 0 to 100 kPa for unsaturated coarse-grained soils. The purpose of this research is to study the effect of water content on apparent cohesion and predict apparent cohesion for coarse-grained soils within the range of 0 to 100 kPa using shear-box test and suction test results without much inconsistency. In this research, soil samples from the rainfall-induced landslide sites were obtained; laboratory tests such as soil-classification tests, shear-box tests and consolidated undrained triaxial tests were carried out. Test results were analyzed, and the findings are presented. When the water content is increased from 0% to 30%, there is a reduction of 89% in apparent cohesion on average. A newly developed prediction model for apparent cohesion based on the low range of matric suction from 0 to 100 kPa for unsaturated coarse-grained soils is introduced in this paper and compared with published models.
1. Introduction
Rainfall-induced landslides are common natural disasters in northern New South Wales (NSW) [1] and Southeast Queensland [2], Australia, which are expected to increase in numbers due to climate change and increases in anthropogenic activities in the future [3]. It is a complex phenomenon and rather challenging to deal with because there are several factors such as rainfall intensity and duration, geology and slope geomorphology, as well as soil conditions that can affect the slope stability [4,5]. The mechanism of such landslides is related to the rainfall water infiltration in the slope, leading to an increase in moisture content and reduction in shear strength [6]. This process was observed in a recent study [7] that involved a series of flume tests on sandy soil that simulated different rainfall patterns. It was found that the major factor causing slope instability was a drastic reduction in shear strength of soil caused by the water infiltration in the soil mass.
Several studies [2,8,9,10,11,12,13,14,15] have been conducted in the past decades to study the relationship between shear strength of soil and moisture content. It was shown that soil strength tends to decrease with increasing moisture content. The relationships between soil moisture content, the soil–water characteristics curve (SWCC) and suction have been established for different soils and linked to soil’s apparent cohesion that contributes to the overall shear strength of unsaturated soil [16,17,18]. As a result, a number of empirical correlations to predict shear strength of soil have been proposed in the literature and summarized in [19,20]. However, as reported in [21,22,23,24,25,26,27] most of these empirical equations fail to accurately predict the apparent cohesion of soil at a low range of suction (<100 kPa).
This study aims to investigate the shear strength of several coarse-grained soils collected from landslide sites in northern NSW, with a focus on changes in the apparent cohesion at a low range of matric suction (0 to 100 kPa). A series of triaxial and shear-box tests were performed to better understand the landside mechanism and behavior of soil at a range of moisture content. Using the obtained results, a new model was proposed to estimate the apparent cohesion of soil at different moisture content and compared with the existing models, which are commonly used in the literature. It was found that the proposed model tends to provide more accurate predictions of soil strength, and due to its simplicity, it can be effectively used by engineers and researchers to quickly estimate changes in soil strength with moisture content.
2. Materials and Methods
Soil samples were collected from eighteen landslide sites in northern NSW [1]. All geotechnical tests were conducted at Geotechnical Laboratory, Griffith University, Gold Coast, Australia. The experimental program included soil classification, direct shear-box tests, a series of suction tests, and consolidated undrained triaxial tests for three soil samples. The shear strength of soil was tested using the shear-box test, whereas consolidated undrained triaxial tests were utilized to estimate the undrained behavior of saturated soil samples and the generation of excess pore-water pressures at different loads. As remolded soil samples were used for shear strength test, it may not reflect in situ shear strength for slope stability assessment.
2.1. Direct Shear Test
For shear-box tests, oven-dried soil samples were first sieved through the 4.75 mm sieve following Australian Standard (AS 1289 6.2.2–1998). To prepare moist samples, the oven-dried soil was mixed with distilled water and kept for 24 h in a sealed bag for better moisture distribution. The water content from 10% to 30% was targeted for most of soils to provide a larger range of water content. The same procedure was used to prepare all shear box specimens; that is, the soil sample was placed in the shear box in 6 layers, and each layer was gently compacted up to 30 times to assure the specimen uniformity. Before the shearing stage, all specimens were consolidated to a vertical stress of either 28.50 kPa, 55.70 kPa or 83.02 kPa. The shearing rate was set at 0.05 mm/min at the shear-box testing equipment.
2.2. Suction Test Using Filter Paper
The suction tests were carried out in accordance with ASTM Standard (ASTM D 5298–2003) using a plastic O-ring, airtight container and cling wrap. Special hand gloves were used to prepare the specimen to avoid oils from the hand to the filter paper. The soil used for suction tests was first sieved through the 2.36 mm sieve to meet the standard requirement. The moist samples were prepared by adding 10%, 20% and 30% of distilled water by weight. A set of 4 larger-size filter papers and a smaller-size filter paper were dried for 16 h in the oven prior to testing. A sensitive balance (that can measure up to four decimals) was used to measure the weight of the filter paper. The O-ring was placed on top of a cling wrap and sample was hand-compacted up to the middle of O-ring. Two large filter papers were placed on the top and bottom to measure total suction, while a smaller-sized filter paper was placed in between the soil sample to measure the matric suction. The sample with the O-ring was placed in an airtight container, which was kept in a cooler box for a week. After 7 days, the weight of wet filter papers was measured. They were placed in the oven at 105 °C for 2 h, and the weight of dried filter papers was measured after drying. This process was made as quickly as possible to avoid any change in moisture of the filter paper that could occur when the filter paper was exposed to air. The filter-paper water content was converted to suction using Whatman No. 42 Calibration Curve, as specified in ASTM D 5298–2003.
2.3. Consolidated Undrained Triaxial Tests
Triaxial tests were carried out on specimens from three landslide sites. The triaxial tests were carried out using GDS Triaxial Automated System, which has a load frame, a triaxial cell, pressure controllers and a computer with specialized software. The test was conducted according to ASTM D 4767–1995. Soil samples passing 2.36 mm sieve were dried in the oven for at least 24 h, then mixed with distilled water to achieve 10% moisture content and left in a sealed bag for 24 h. This was performed for better moisture distribution in the soil. The cylindrical soil specimen (100 mm height and 50 mm diameter) was prepared using a membrane tube, which was placed at the base of the triaxial chamber with a filter paper and a porous stone. The soil specimen was gently compacted in 3 layers. The triaxial chamber was filled with distilled water, placed on axial loading device with computer-based pressure controllers for cell pressure and back pressure. The triaxial tests were carried out on the specimen consolidated to a confining pressure of either 28.52, 55.77 or 83.02 kPa. The maximum strain during the test was set to 10%. The axial strain rate of 0.05%/min was used in this triaxial test. The test control and data recording were performed by means of a computer.
3. Results
Table 1 summarizes all experimental data, such as grading for eighteen soil samples and shear-box and suction test results for nine soil samples obtained from the past landslide sites. In accordance with soil-classification results, most soils were coarse-grained material.
3.1. Analysis of Consolidated Undrained Triaxial Test Results
Several triaxial tests on saturated soil specimens were conducted to estimate the undrained strength of soil under loads. Figure 1 presents the results of undrained triaxial tests conducted on coarse-grained soil specimens plotted as the effective stress path. It is clear from these stress path graphs that the excess pore-water pressure was generated in the specimens under loads (i.e., a decrease in p’); However, the amount of excess pore water pressure was not sufficient to cause liquefaction (note that the liquefaction conditions would likely occur when p’ drops to almost 0). These typical results suggest that the failure in shallow landslides may not be triggered by the extremely large values of pore-water pressure. In fact, as suggested by Yoshida et al. [8], Ching-Chuan et al. [9] and Suradi et al. [10], shallow-slope failures generally occur during rainfall due to the loss of suction.
The triaxial tests demonstrate that there is some pore-water-pressure generation in undrained tests, but the amount of excess pore-water pressure is not sufficient to significantly reduce the effective stress acting on soil mass. This means that there may be some other mechanism that affects the slope stability, and that is the change in shear strength with water content.
3.2. Analysis of Shear-Box Test Results
Shear-box test results indicate that there is drastic change in shear strength with varying water content. Figure 2 demonstrates the reduction in apparent cohesion of coarse-grained soils obtained from nine shallow landslide sites with changing degree of saturation (S). It is evident from Figure 2 that when the degree of saturation increases, the apparent cohesion drops drastically.
The results of the shear-box test and consolidated undrained test are compared in Table 2. It is evident from Table 2 that although different testing procedures were used, the shear strength characteristics such as the friction angle and cohesion were similar. The results of undrained triaxial tests such as effective friction angle (ϕ’) and effective cohesion (c’) support the data produced by a series of shear-box tests and suggest that at a high range of moisture content, the apparent cohesion of soil drops to a very low value.
Based on the shear test results, Equations (1) and (2) are obtained when water content is within the range of 0 to 0.25 and effective vertical stress is 28.5 kPa. These equations established using Excel show the relationship for the cohesion ratio (c/c0) and the friction angle ratio (ϕ/ϕ0) with the moisture content, respectively:
where c is the apparent cohesion at any water content between 0 and 0.3; c0 is the apparent cohesion at zero water content; and θ is the water content. The coefficient of determination, r2 = 0.65 for Equation (1).
where ϕ is the angle of internal friction at any water content between 0 and 0.3; ϕ0 is the angle of internal friction at zero water content. Equation (2) has r2 of 0.44. Equations (1) and (2) provide the relationship between the shear strength parameters of coarse-grained soils and water content that can be used to estimate the change of shear strength for similar types of coarse-grained soils from shallow landslides (depth < 3 m) as the vertical stress is 28.5 kPa. Similar equations are presented using volumetric moisture contents [28].
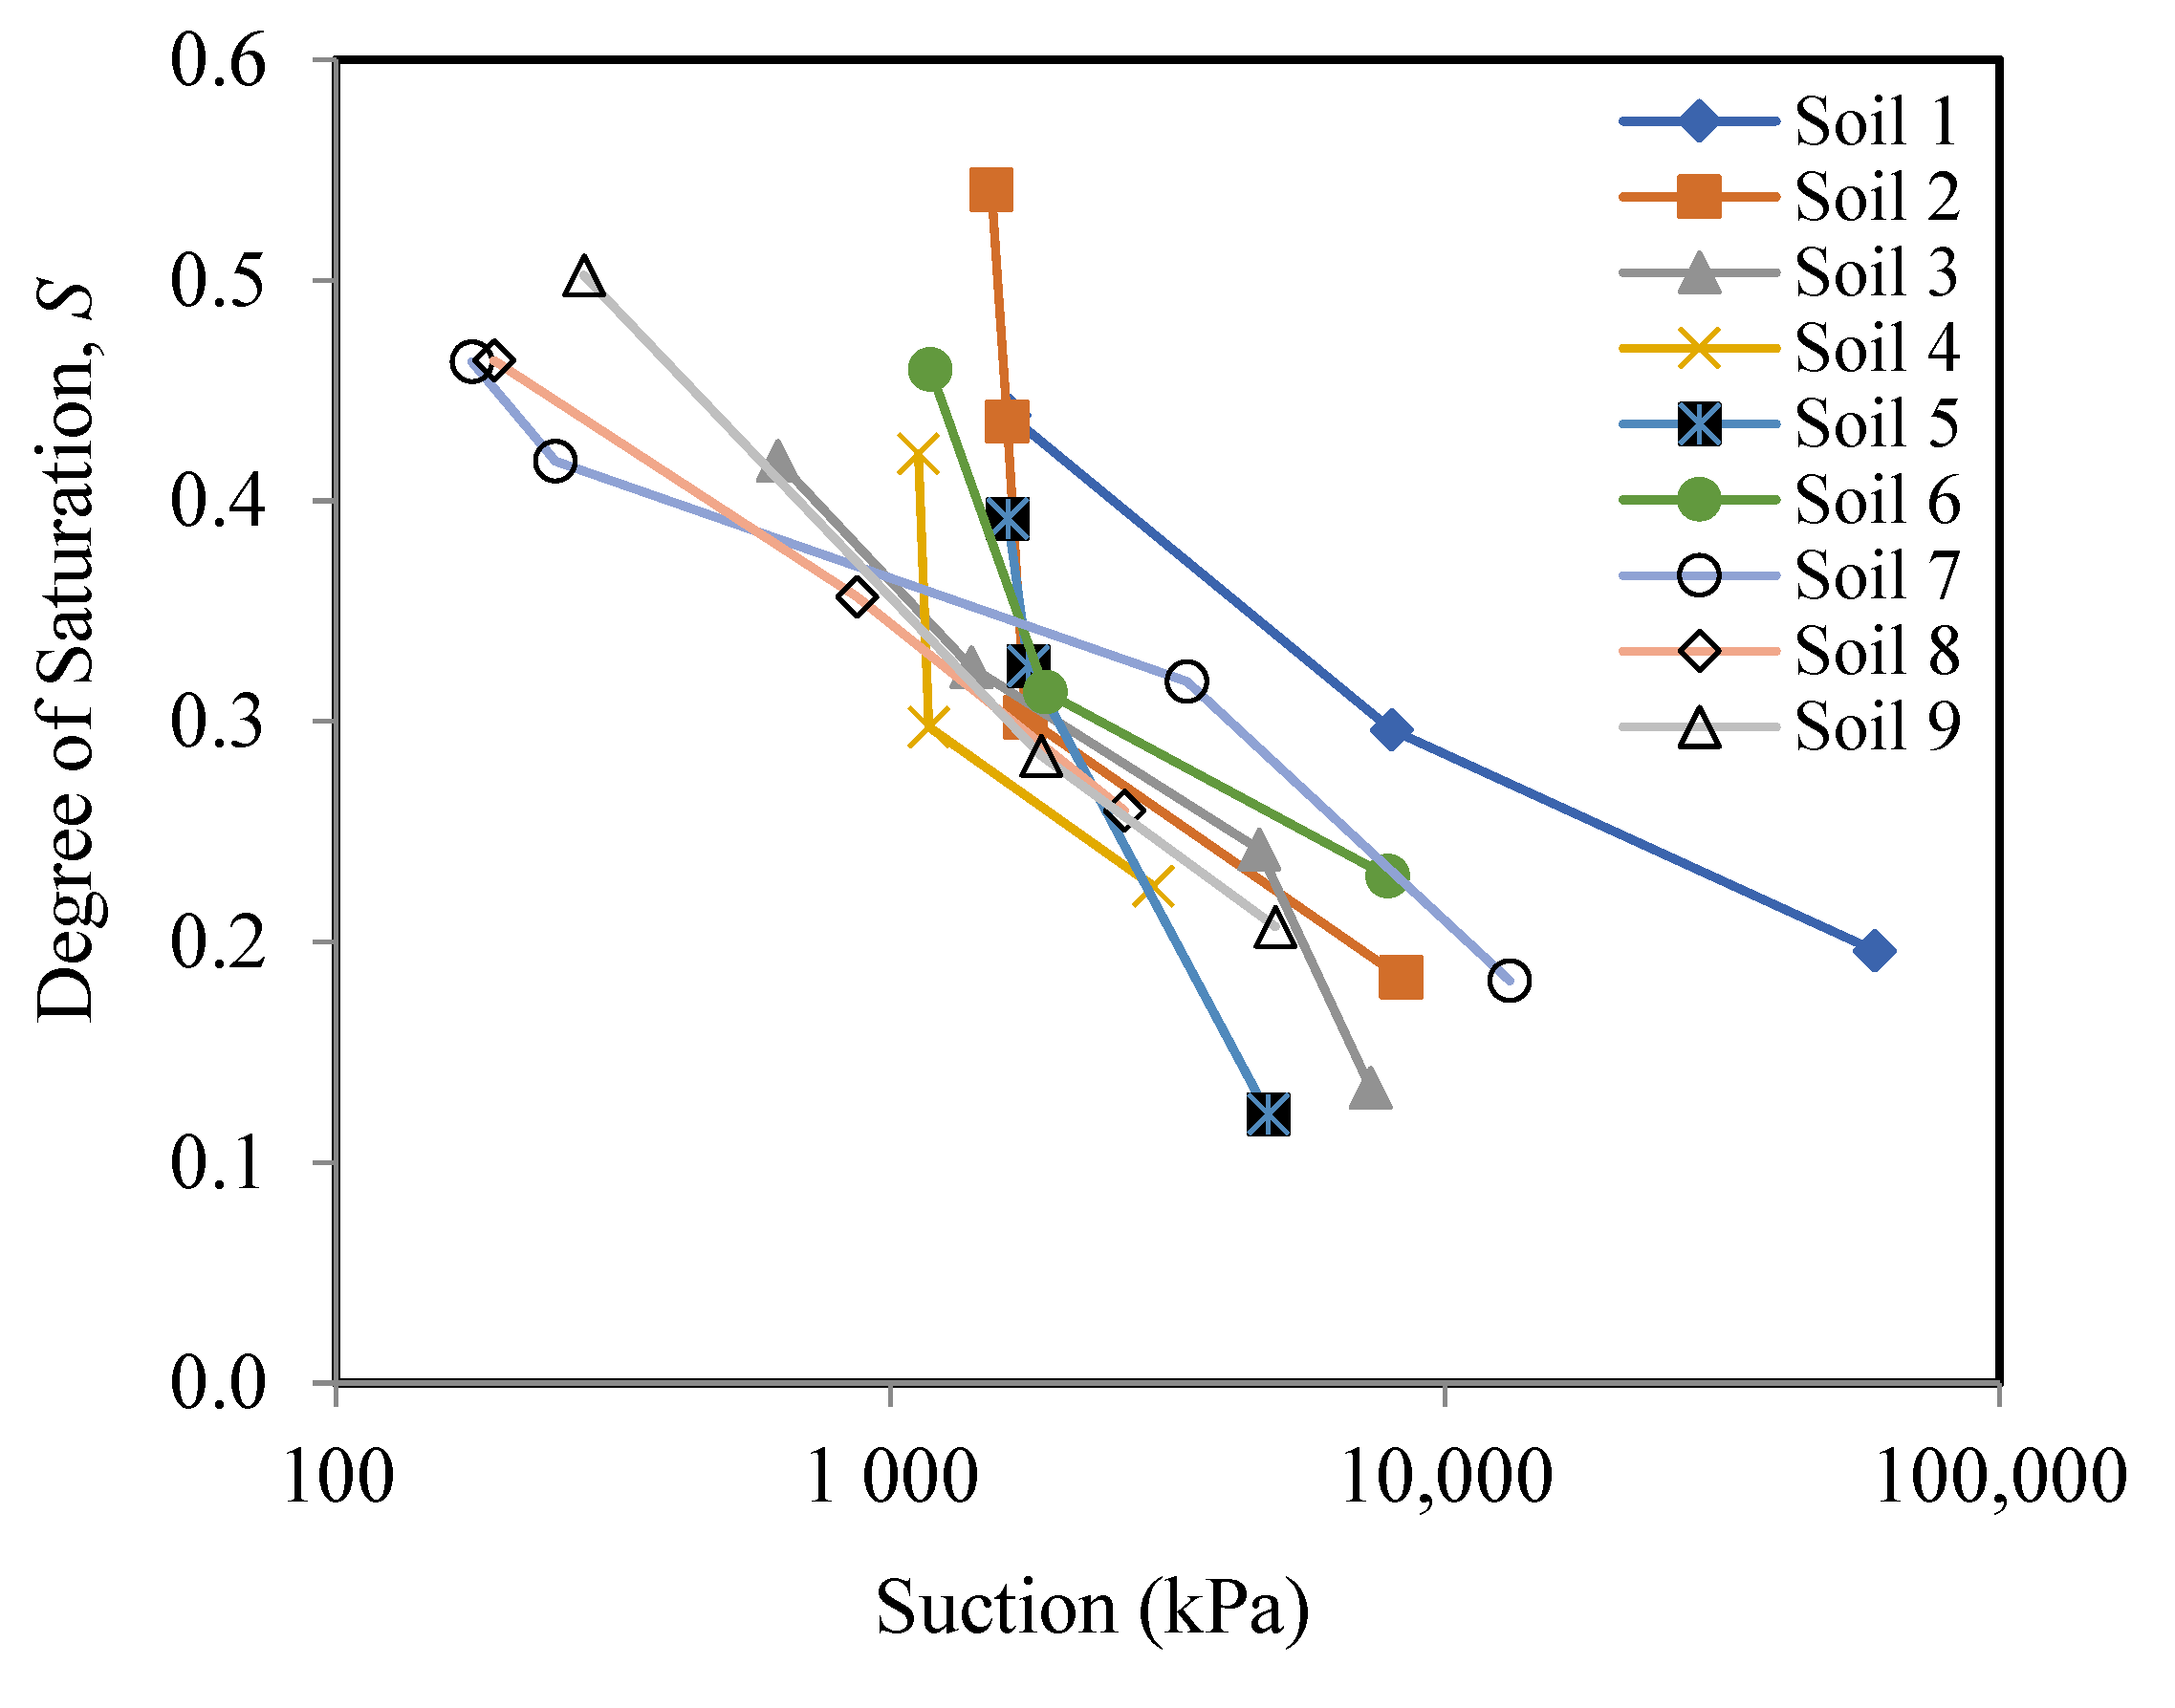
3.3. SWCC and Shear Strength Reduction
In this research, shear-box test results for coarse-grained soils at vertical stress of 28.5 kPa and suction test results are compared using water content as reference. Vanapalli et al. [29] and Kim et al. [30] reported that the effect of vertical stress on SWCC is minimal under low confining-pressure conditions. Therefore, the shear-box test results for soils at vertical stress of 28.5 kPa and suction test results are compared using water content as reference in this research. To prepare SWCC, gravimetric water content was converted to volumetric water content. However, as the degree of saturation is a better predictor than volumetric content, SWCC was prepared using the degree of saturation, S.
3.4. Relationship between Apparent Cohesion and Matric Suction
A new relationship between low matric suction (0 to 100 kPa) and the apparent cohesion (c) for coarse-grained soils is proposed in the paper, based on the concept of dual porosity developed by Zhao [20] highlighting interaggregate pores and intra-aggregate pores.
Among the coarser particles and between the coarser particles and clay aggregates, there are interaggregate pores. Within the clay aggregates, there are intra-aggregate pores. First, drainage occurs through interaggregate pores mainly within the boundary-effects zone and transition zones of SWCC. Finally, when matric suction increases to higher level, drainage occurs through interaggregate pores, which normally happens in the residual zone of SWCC. The typical low suction range (0 to 100 kPa) falls within the boundary-effects zone and transition zone of SWCC where drainage movement occurs through interaggregate pores [20].
Drainage movement depends on hydraulic conductivity. Budhu [31] reported that the hydraulic conductivity of coarse-grained soils relied on (D10)2 where D10 is the diameter of the particles, of which 10% of the soil is finer and the unit is in mm.
Based on the above theory, the following relationship, Equation (3), is developed for the prediction of apparent cohesion, using matric suction , within the range of 0 kPa to 100 kPa; effective friction angle, degree of saturation, S, and the factor related to the hydraulic conductivity, (D10)2, assuming that the fine component of soils is defined as the soil particles smaller than 0.075 mm (passing Sieve No. 200):
The proposed model is developed using an optimization technique in Excel Solver by minimizing the squared sum of the normalized residuals (SSNR) between measured apparent cohesion and estimated apparent cohesion. The proposed model for the prediction of the apparent cohesion for the low matric suction range (0 to 100 kPa), which is Equation (3) and the published models by Fredlund et al. [23]; Oberg and Sallfors [24] and Matsushi and Matsukura [27] are compared with the measured apparent cohesion and plotted in Figure 4. At the lower end of spectrum, the proposed model and the published models predict closer to the measured apparent cohesion. On the other hand, the proposed model and the model by Matsushi and Matsukura [27] predict better than the other two models at the higher end of the spectrum of matric suction range, as shown in Figure 4. However, the proposed model predicts much closer to the measured apparent cohesion as opposed to the Matsushi and Matsukura [27]. In addition, the proposed model used both shear-box and suction test results, whereas Matsushi and Matsukura [27] used shear-box test results only to develop the equation for predicting apparent cohesion.
4. Conclusions
A series of soil tests such as grading test, shear-box test, suction test and triaxial test were conducted on the soil samples obtained from the shallow-landslide sites to understand the soil characteristics. These soils are mainly coarse-grained soils, as the fine component (passing 0.075 mm sieve) is less than or around 10%. The difference between unsaturated shear strength obtained from the shear-box test and saturated shear strength obtained from the triaxial test highlights the role of apparent cohesion, which varies with water content. Based on the obtained results, the following conclusions can be drawn:
- Results of the triaxial and shear-box tests indicated that increases in water content can drastically reduce the apparent cohesion of soil (for some soils, a reduction of 89% on the average was observed).
- A new relationship between the apparent cohesion and water content of coarse-grained soils was proposed, = . This relationship can be used to estimate the apparent cohesion from shallow landslides.
- A new relationship between the apparent cohesion and matric suction, c was proposed to estimate the apparent cohesion for coarse-grained soils when the matric suction is between 0 to 100 kPa. This new model tends to predict the apparent cohesion of coarse-grained soils much better than the existing models by Fredlund et al. [23]; Oberg and Sallfors [24] and Matsushi and Matsukura [27].
Author Contributions
Methodology, software, validation, formal analysis, investigation, resources, data curation, writing—original draft preparation, visualization, S.R.; Conceptualization, writing—review and editing, supervision and project administration, I.G. All authors have read and agreed to the published version of the manuscript.
Funding
No external funding is received.
Institutional Review Board Statement
Not applicable.
Informed Consent Statement
Not applicable.
Data Availability Statement
Data is available on request.
Conflicts of Interest
The authors declare no conflict of interest.
References
- Ravindran, S.; Gratchev, I.; Jeng, D.-S. Analysis of rainfall-induced landslides in northern New South Wales, Australia. Aust. Geomech. 2019, 54, 83–97. [Google Scholar]
- Cogan, J.; Gratchev, I.; Wang, G. Rainfall-induced shallow landslides caused by ex-tropical cyclone Debbie, 31st March 2017. Landslides 2018, 15, 1215–1221. [Google Scholar] [CrossRef]
- Dikshit, A.; Pradhan, B.; Alamri, A.M. Pathways and challenges of the applications of artificial intelligence to geohazards modelling. Gondwana Res. 2021, 100, 290–301. [Google Scholar] [CrossRef]
- Cuomo, S.; Della Sala, M. Large-area analysis of soil erosion and landslides induced by rainfall: A case of unsaturated shallow deposits. J. Mt. Sci. 2015, 12, 783–796. [Google Scholar] [CrossRef]
- Maturidi, A.M.A.M.; Kasim, N.; Taib, K.A.; Azahar, W.N.A.W. Rainfall-induced landslide thresholds development by considering different rainfall parameters: A Review. J. Ecol. Eng. 2021, 22, 85–97. [Google Scholar] [CrossRef]
- Tohari, A. Study of rainfall-induced landslide: A review. In Proceedings of the Global Colloquium on Geosciences and Engineering 2017, Bandung, Indonesia, 18–19 October 2017. [Google Scholar]
- Cogan, J.; Gratchev, I. A study on the effect of rainfall and slope characteristics on landslide initiation by means of flume tests. Landslides 2019, 16, 2369–2379. [Google Scholar] [CrossRef]
- Yoshida, Y.; Kuwano, J.; Kuwano, R. Rain-induced slope failures caused by reduction in soil strength. Soils Found. 1991, 31, 187–193. [Google Scholar] [CrossRef] [Green Version]
- Ching-Chuan, H.; Yih-Jang, J.; Lih-Kang, H.; Jin-Long, L. Internal soil moisture and piezometric responses to rainfall-induced shallow slope failures. J. Hydrol. 2009, 370, 39–51. [Google Scholar] [CrossRef]
- Suradi, M.; Fourie, A.; Beckett, C.; Buzzi, O. Rainfall-induced landslides: Development of a simple screening tool based on rainfall data and unsaturated soil mechanics principles. In Proceedings of the 6th International Conference on Unsaturated Soils, UNSAT 2014, Sydney, Australia, 2–5 July 2014. [Google Scholar]
- Tsai, T.-L.; Chen, H.-E.; Yang, J.-C. Numerical modelling of rainstorm-induced shallow landslides in saturated and unsaturated soils. Environ. Geol. 2008, 55, 1269–1277. [Google Scholar] [CrossRef]
- Tsai, T.-L.; Chen, H.-F. Effects of degree of saturation on shallow landslides triggered by rainfall. Environ. Earth Sci. 2010, 59, 1285–1295. [Google Scholar] [CrossRef]
- Tsai, T.-L. Influences of soil water characteristics curve on rainfall-induced shallow landslides. Environ. Earth Sci. 2010, 64, 449–459. [Google Scholar] [CrossRef]
- Farooq, K.; Rogers, J.D.; Ahmed, M.F. Effect of densification on the shear strength of landslide material: A case study from Salt Range, Pakistan. Earth Sci. Res. 2015, 4, 113–125. [Google Scholar] [CrossRef]
- Fredlund, D.G.; Rahardjo, H.; Fredlund, M.D. Unsaturated Soil Mechanics in Engineering Practice; John Wiley & Sons, Inc.: Hoboken, NJ, USA; Toronto, ON, Canada, 2012; pp. 1–28. [Google Scholar]
- Ahmadi-Adli, M.; Huvaj, N.; Toker, N.K. Effects of the size of particles on rainfall-induced slope instability in granular soils. In Proceedings of the Geo-Congress 2014, Altanta, GA, USA, 23–26 February 2014. [Google Scholar]
- Lin, H.-D.; Jiang, Y.-S.; Wang, C.-C.; Chen, H.-Y. Assessment of apparent cohesion of unsaturated lateritic soil using an unconfined compression test. In Proceedings of the 2016 World Congress on Advances in Civil, Environmental, and Materials Research (ACEM16), Jeju, Korea, 28 August–1 September 2016. [Google Scholar]
- Jotisankasa, A.; Mairaing, W. Suction-monitored direct shear testing of residual soils from landslide-prone areas. J. Geotech. Geoenviron. Eng. 2010, 136, 533–537. [Google Scholar] [CrossRef]
- Garven, E.A. Review of the Empirical Equations for Predicting the Shear Strength of Unsaturated Soils. Master’s Thesis, University of Ottawa, Ottawa, ON, Canada, 2009. [Google Scholar]
- Zhao, H.F.; Zhang, L.M.; Fredlund, D.G. Bimodal shear-strength behaviour of unsaturated coarse-grained soils. J. Geotech. Geoenviron. Eng. 2013, 139, 2070–2081. [Google Scholar] [CrossRef]
- Zhou, A.; Huang, R.; Sheng, D. Capillary water retention curve and shear strength of unsaturated soils. Can. Geotech. J. 2016, 53, 974–987. [Google Scholar] [CrossRef] [Green Version]
- Pham, T.A.; Sutman, M. An analytical model for predicting the shear strength of unsaturated soils. In Proceedings of the Institution of Civil Engineers—Geotechnical Engineering; ICE Publishing: London, UK, 2022. [Google Scholar] [CrossRef]
- Fredlund, D.G.; Morgenstern, N.R.; Widger, R.A. Shear strength of unsaturated soils. Can. Geotech. J. 1978, 15, 313–321. [Google Scholar] [CrossRef]
- Oberg, A.; Sallfors, G. Determination of shear strength parameters of unsaturated silts and sands based on the water retention curve. ASTM Geotech. Test. J. 1997, 20, 40–48. [Google Scholar]
- Vanapalli, S.K.; Fredlund, D.G.; Pufahl, D.E.; Clifton, A.W. Model for the prediction of shear strength with soil suction. Can. Geotech. J. 1996, 33, 379–392. [Google Scholar] [CrossRef]
- Khalili, N.; Khabbaz, M.H. A unique relationship for the determination of the shear strength of unsaturated soils. Geotechnique 1998, 48, 681–687. [Google Scholar] [CrossRef]
- Matsushi, Y.; Matsukura, Y. Cohesion of unsaturated residual soils as a function of volumetric water content. Bull. Eng. Geol. Environ. 2006, 65, 449–455. [Google Scholar] [CrossRef]
- Ravindran, S.; Gratchev, I. Estimation of shear strength of gravelly and sandy soils from shallow landslides. Int. J. GEOMATE 2020, 18, 130–137. [Google Scholar] [CrossRef]
- Vanapalli, S.K.; Fredlund, D.G.; Pufahl, D.E. The influence of soil structure and stress history on the soil-water characteristics of a compacted till. Geotechnique 1999, 49, 143–159. [Google Scholar] [CrossRef] [Green Version]
- Kim, B.S.; Shibuya, S.; Park, S.W.; Kato, S. Application of suction stress for estimating unsaturated shear strength of soils using direct shear testing under low confining pressure. Can. Geotech. J. 2010, 47, 955–970. [Google Scholar] [CrossRef]
- Budhu, M. Soil Mechanics and Foundations, 2nd ed.; John Wiley and Sons: Hoboken, NJ, USA, 2007; pp. 46–82. [Google Scholar]
Figure 1.
Stress-path plot of Soil 1 (a), Soil 2 (b) and Soil 6 (c).


Figure 2.
Reduction of apparent cohesion vs. degree of saturation.

Figure 3.
SWCC of soils from 9 landslide sites.


Table 1.
Summary of properties of soils from landslide sites.
| Soil No. | Gravel (%) | Sand (%) | Fines (%) | Shear-Box Test Results | ||
|---|---|---|---|---|---|---|
| Degree of Saturation | Friction Angle ( | |||||
| 1 | 31.1 | 66.5 | 2.4 | 0.00 | 25 | 38 |
| 0.20 | 16 | 38 | ||||
| 0.35 | 9 | 38 | ||||
| 0.46 | 0 | 35 | ||||
| 2 | 52.3 | 42.1 | 5.6 | 0.00 | 24 | 37 |
| 0.20 | 16 | 37 | ||||
| 0.35 | 11 | 36 | ||||
| 0.40 | 0 | 33 | ||||
| 3 | 38.6 | 57.6 | 3.7 | 0.00 | 18 | 39 |
| 0.15 | 13 | 36 | ||||
| 0.26 | 12 | 31 | ||||
| 0.35 | 10 | 27 | ||||
| 0.42 | 5 | 26 | ||||
| 4 | 6.9 | 89.3 | 3.8 | 0.00 | 11 | 37 |
| 0.20 | 7 | 34 | ||||
| 0.28 | 4 | 31 | ||||
| 0.35 | 0 | 29 | ||||
| 5 | 23.8 | 64.5 | 11.6 | 0.00 | 26 | 39 |
| 0.17 | 16 | 39 | ||||
| 0.29 | 5 | 36 | ||||
| 0.39 | 0 | 34 | ||||
| 6 | 66.1 | 31.6 | 2.3 | 0.00 | 26 | 34 |
| 0.22 | 21 | 34 | ||||
| 0.31 | 12 | 33 | ||||
| 0.39 | 0 | 30 | ||||
| 7 | 50.2 | 46.8 | 3 | 0.00 | 13 | 40 |
| 0.18 | 10 | 38 | ||||
| 0.32 | 9 | 31 | ||||
| 0.38 | 5 | 28 | ||||
| 8 | 70.5 | 25.7 | 3.8 | 0.00 | 21 | 40 |
| 0.23 | 11 | 38 | ||||
| 0.40 | 6 | 33 | ||||
| 0.46 | 1 | 25 | ||||
| 9 | 85.8 | 13 | 1.2 | 0.00 | 18 | 40 |
| 0.22 | 8 | 40 | ||||
| 0.37 | 6 | 35 | ||||
| 0.43 | 4 | 29 | ||||
Table 2.
Comparison of shear strength parameters.
| Soil No. | From Shear-Box Test | From Consolidated Undrained Triaxial Test | ||
|---|---|---|---|---|
| c (kPa) | ϕ (Degrees) | c’ (kPa) | ϕ’ (Degrees) | |
| 1 | 0.1 | 34.9 | 1 | 34.6 |
| 2 | 0.2 | 32.7 | 2 | 30.1 |
| 6 | 0.3 | 29.6 | 1 | 29.2 |
Publisher’s Note: MDPI stays neutral with regard to jurisdictional claims in published maps and institutional affiliations. |
© 2022 by the authors. Licensee MDPI, Basel, Switzerland. This article is an open access article distributed under the terms and conditions of the Creative Commons Attribution (CC BY) license (https://creativecommons.org/licenses/by/4.0/).
Share and Cite
MDPI and ACS Style
Ravindran, S.; Gratchev, I. Effect of Water Content on Apparent Cohesion of Soils from Landslide Sites. Geotechnics 2022, 2, 385-394. https://doi.org/10.3390/geotechnics2020017
AMA Style
Ravindran S, Gratchev I. Effect of Water Content on Apparent Cohesion of Soils from Landslide Sites. Geotechnics. 2022; 2(2):385-394. https://doi.org/10.3390/geotechnics2020017
Chicago/Turabian StyleRavindran, Sinnappoo, and Ivan Gratchev. 2022. "Effect of Water Content on Apparent Cohesion of Soils from Landslide Sites" Geotechnics 2, no. 2: 385-394. https://doi.org/10.3390/geotechnics2020017