SAR Imaging of Archaeological Sites on Intertidal Flats in the German Wadden Sea


1
Universität Hamburg, Institut für Meereskunde, Bundesstraße 53, 20146 Hamburg, Germany
2
Landesbetrieb für Küstenschutz, Nationalpark und Meeresschutz Schleswig-Holstein (LKN), Nationalparkverwaltung, 25832 Tönning, Germany
3
Wördemanns Weg 23a, 22527 Hamburg, Germany
*
Author to whom correspondence should be addressed.
Geosciences 2017, 7(4), 105; https://doi.org/10.3390/geosciences7040105
Submission received: 4 August 2017
/
Revised: 2 October 2017
/
Accepted: 2 October 2017
/
Published: 13 October 2017
(This article belongs to the Special Issue Remote Sensing and Geosciences for Archaeology)
Abstract
:We show that high-resolution space-borne synthetic aperture radar (SAR) imagery with pixel sizes smaller than 1 m2 can be used to complement archaeological surveys on intertidal flats. After major storm surges in the 14th and 17th centuries (“Grote Mandrenke”), vast areas on the German North Sea coast were lost to the sea. Areas of settlements and historical farmland were buried under sediments for centuries, but when the surface layer is driven away under the action of wind, currents, and waves, they appear again on the Wadden Sea surface. However, frequent flooding and erosion of the intertidal flats make any archaeological monitoring a difficult task, so that remote sensing techniques appear to be an efficient and cost-effective instrument for any archaeological surveillance of that area. Space-borne SAR images clearly show remains of farmhouse foundations and of former systems of ditches, dating back to the times before the “Grote Mandrenke”. In particular, the very high-resolution acquisition (“staring spotlight”) mode of the TerraSAR/TanDEM-X satellites allows detecting various kinds of remains of historical land use at high precision. Moreover, SARs working at lower microwave frequencies (e.g., that on Radarsat-2) may complement archaeological surveys of historical cultural traces, some of which have been unknown so far.
1. Introduction
In the Medieval Period, the German North Sea coastline looked very different from how it looks today: the North Frisian Islands did not yet exist, but were part of the so-called “Uthlande” (outer lands) that belonged to, or were connected with, the mainland [1]. Vast areas along the coast were dominated by swamps, marshes, and swamp forests, which often made any settlements difficult or impossible. From the 11th and 12th centuries on, however, many settlements on the German North Sea coast appeared. In those settlements houses were often built on dwelling mounds and were protected by small “summer dikes”, which could provide protection against high water only during summer, when storms are rare. Later on, coastal protection was improved through a system of “winter dikes” that were strong enough to prevent the marsh lands from frequent flooding [2]. Systems of drainage ditches were built to remove the water from the farmlands, thereby allowing for any kind of agriculture.
Salt extraction from salty peat, which was found and mined all along the North Sea coast, became an important economical factor, but the peat mining also caused a decrease in surface level in the protected (diked) areas [2,3]. Together with the draining the extensive land use caused the land surface to be below the mean high tide level at many places.
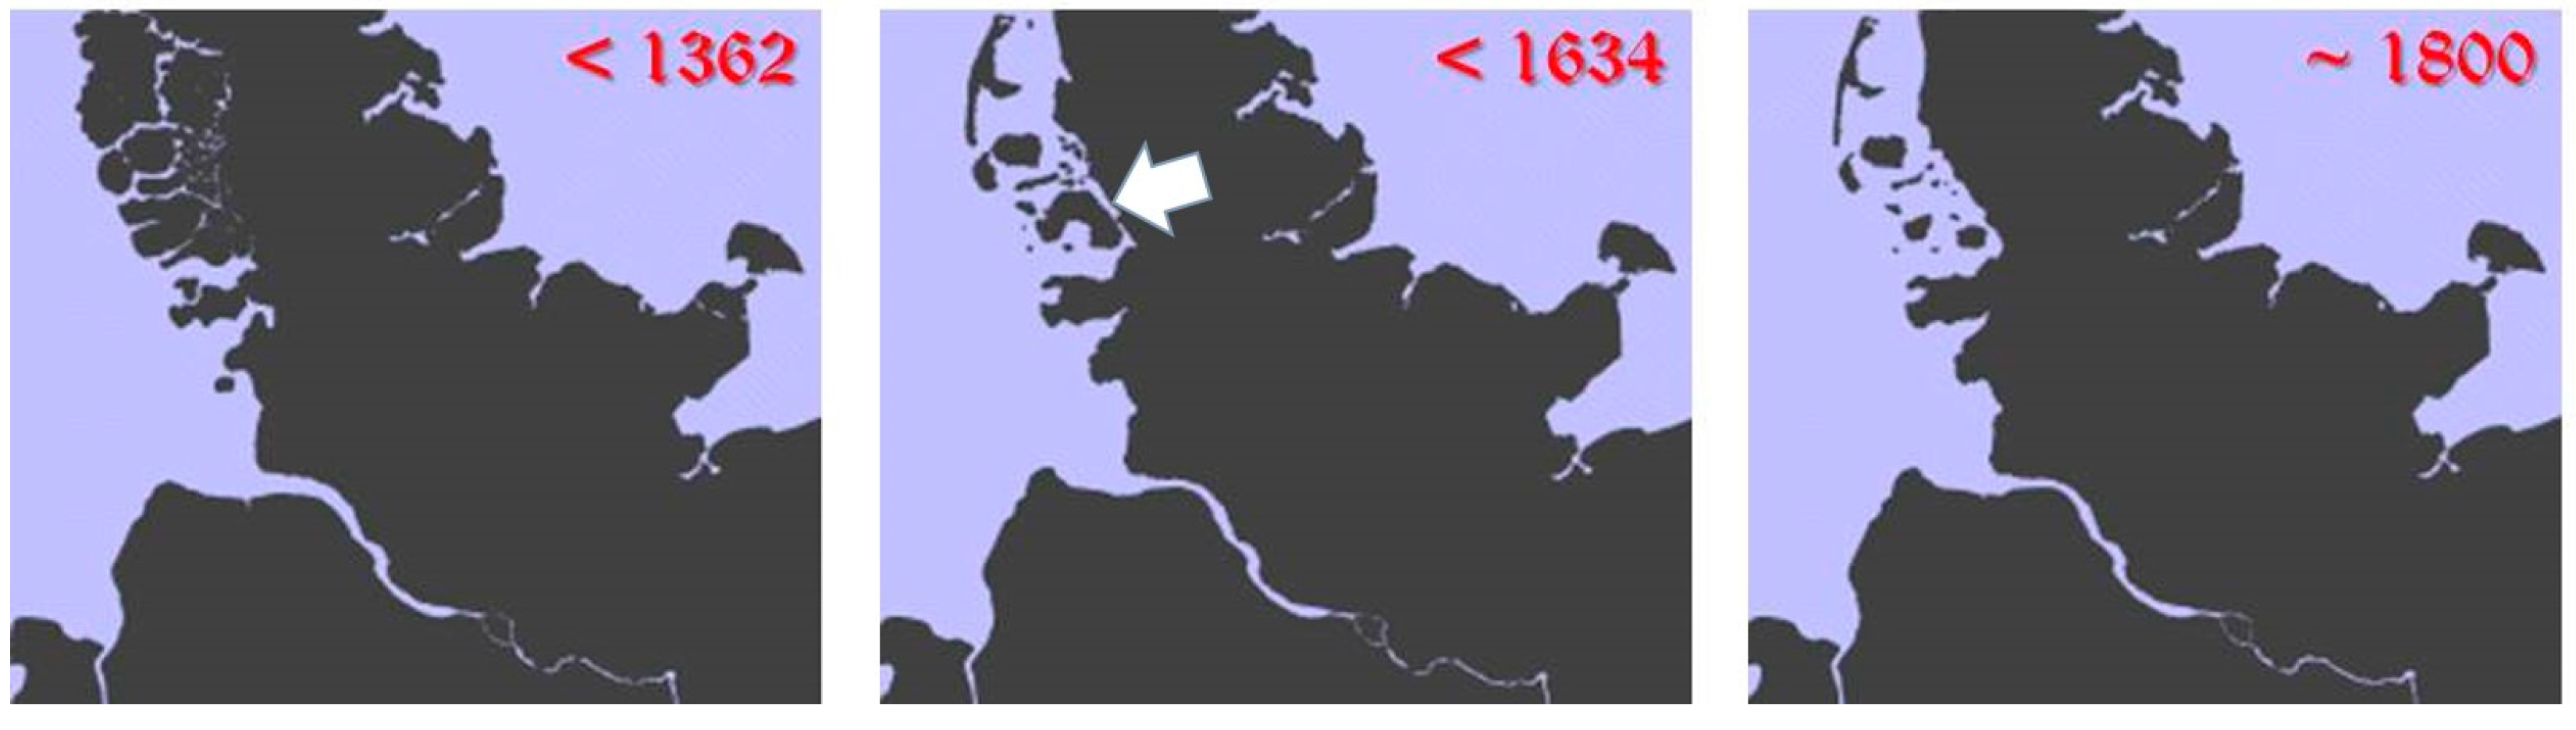
In mid-January 1362, severe westerly storms hit the Northern German coast, and on January 16 an immense storm tide flooded the coast, causing the small dikes to break at many places and killing a great number of people and cattle. This major storm surge is known in history as the Saint Marcellus’ Flood or “Grote Mandrenke” (“great drowning of men”) and caused that vast areas were lost to the sea. Those areas haven’t been diked since then (compare the left and middle panels of Figure 1). Thereafter, it took a long time until new dikes were built to protect the remaining marsh land. The new farmland was characterized by wider plots of land, the dikes enclosed larger polders than in the centuries before, and farmhouses on terps were connected by narrow lanes.
Another major storm surge occurred on 11 October 1634, again, causing death of people and cattle, after the dikes had broken at several places. This second “Grote Mandrenke” (also known as Burchardi Flood) hit the area of North Frisia in an economically weak period, after the plague had caused many deaths only about 30 years before. The island of Strand, a horseshoe-shaped island in the center of the North Frisian coast (see the white arrow in the middle panel of Figure 1), was flooded and eventually broke up into pieces (compare the middle and right panels of Figure 1) and farmland, farms, and whole villages were destroyed. Consequently, the Burchardi Flood is still the most-known storm surge in history in the area of the North Frisian Wadden Sea.
Over the following centuries, great parts of this former agricultural area have been buried under muddy and sandy sediments, which nowadays form the German Wadden Sea. This area is being flooded, and falls dry, once during each tidal cycle, thereby making archaeological excavations very difficult. However, under the permanent action of the tidal forces the muddy and sandy marine sediments are partly driven away, and traces of former peat digging, drainage systems, and settlements appear again on the surface of the intertidal flats [3]. Since those areas are difficult to reach, and thus to observe from ground, airborne sensors have proven to be advantageous for a systematic observation of those historic places [4,5]. Airborne surveillance, however, is cost-intensive and the use of unmanned aerial vehicles (UAV) is prohibited in the National Park (to which the study area belongs). Therefore, high-resolution space-borne sensors are an alternative source of data that can be used by archaeologists for their frequent surveillance of that area [6,7].
Spaceborne synthetic aperture radar (SAR) imagery has been used for archaeological studies at various places worldwide since the 1980s [8,9]. SAR sensors image the Earth’s surface at high spatial resolution and independent of daylight and weather conditions, thereby making dedicated acquisitions easier. Particularly their all-weather capabilities can make them advantageous over optical sensors in areas where those do not perform effectively [10]. In this respect, SAR-based archaeological studies have been focusing mainly on mountainous, arid, and forested regions [11,12,13,14], partly using SAR data of very high resolution [15,16]. In order to complement those studies, here, we introduce a new domain for SAR-driven archaeology.
2. Materials and Methods
We already used SAR images to derive surface characteristics of exposed intertidal flats and to detect bivalve beds [17]. During our analyses of SAR imagery of intertidal flats north of Pellworm we discovered bright and dark linear features that could not be of natural origin, but rather be manifestations of anthropogenic structures dating back to the times before the “Grote Mandrenke”. These findings called for further studies that were based on high-resolution SAR imagery.
2.1. Region of Interest
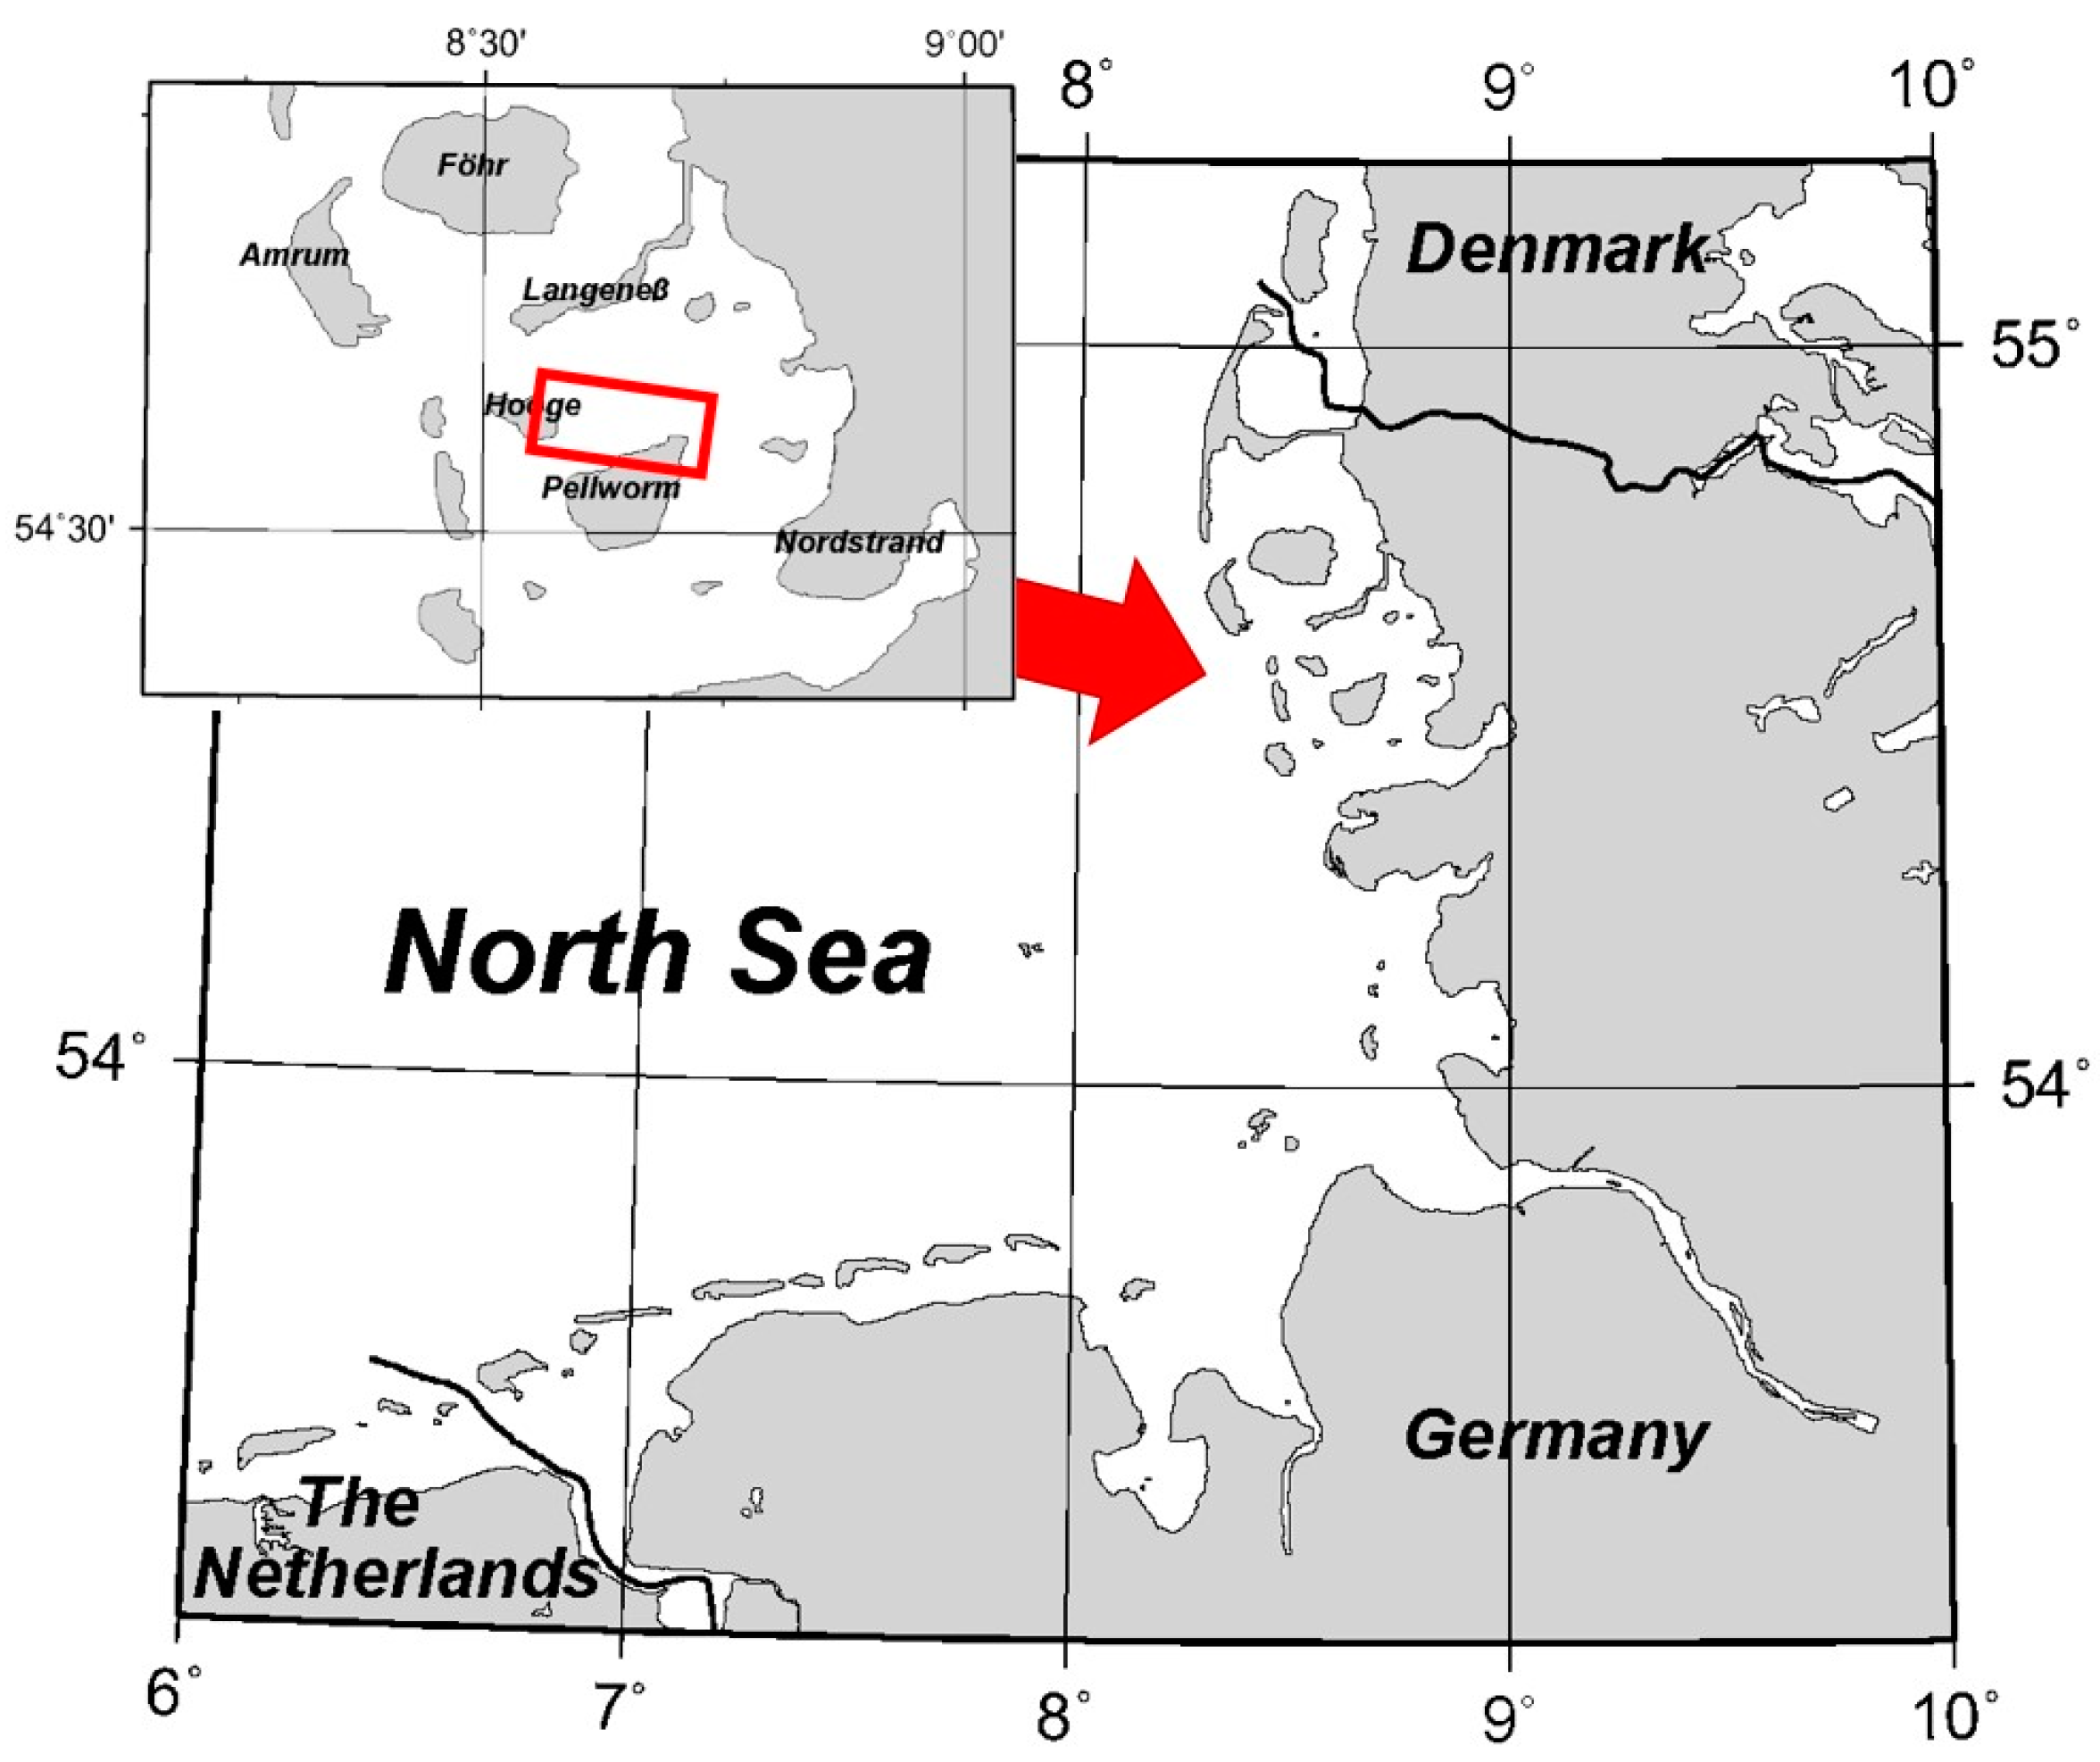
A map of the study area is shown in Figure 2, with the location of the SAR image of Figure 3 inserted. This area lies in the center of the North Frisian Wadden Sea, i.e., in an area that was most affected by the major storm surges in the 14th and 17th centuries (Figure 1). Remains of the former island of Strand are Pellworm and Nordstrand, the latter meanwhile being attached to the mainland after long-standing land reclamation. In the area of interest traces of former land use have been observed for some decades [3,18].
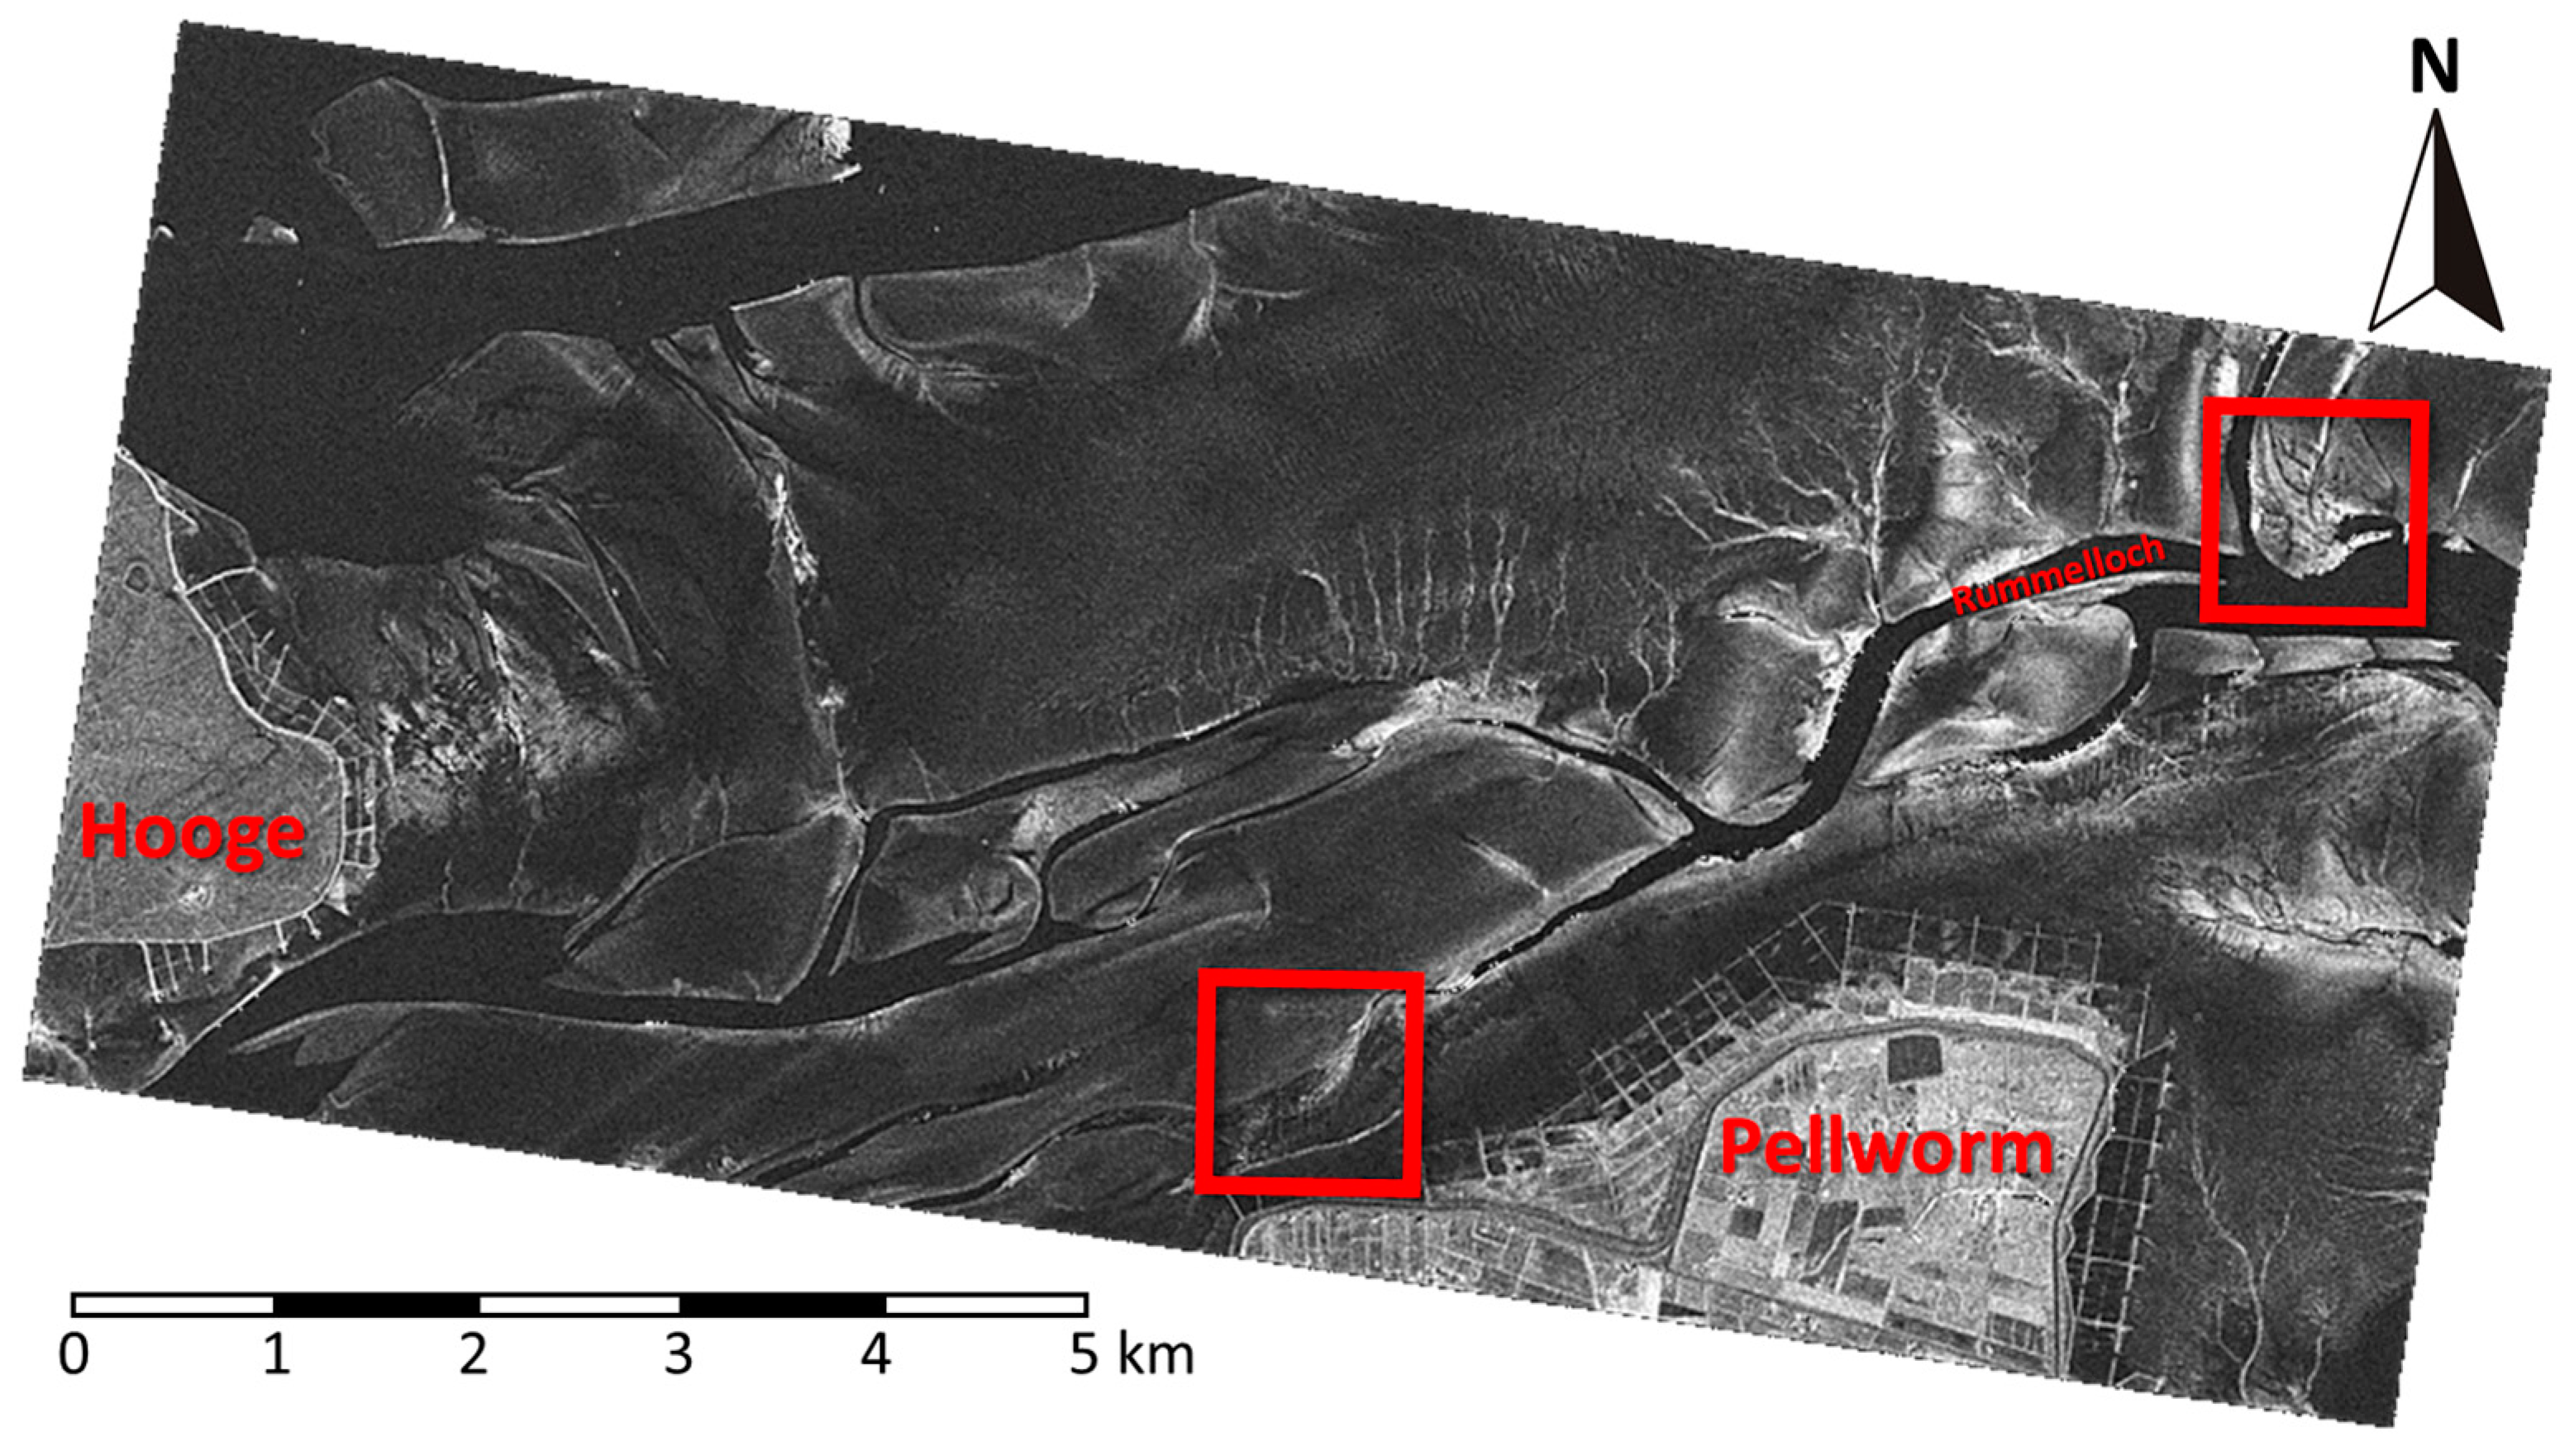
A TerraSAR-X image (11.6 km × 5.2 km) of the area of interest, acquired on 12 December 2012 (at 05:33 UTC, 18 minutes after low tide), is shown in Figure 3. The islands of Pellworm and Hooge can be seen in the lower and left parts of the image, respectively. Two red squares mark (1.0 km × 1.0 km) areas, in which remains of former land use were found.
Because of the low wind speed during that image acquisition (4 m/s), tidal channels and creeks show up dark: the radar backscattering from the water surface and moist soil mainly depends on its surface roughness; therefore, a flat water surface at low wind speeds causes low radar backscatter and, thus, dark image areas. Bright features in the right image half mark the rough edges of tidal creeks and dry, sandy sediments [19]; however, they are not of interest herein.
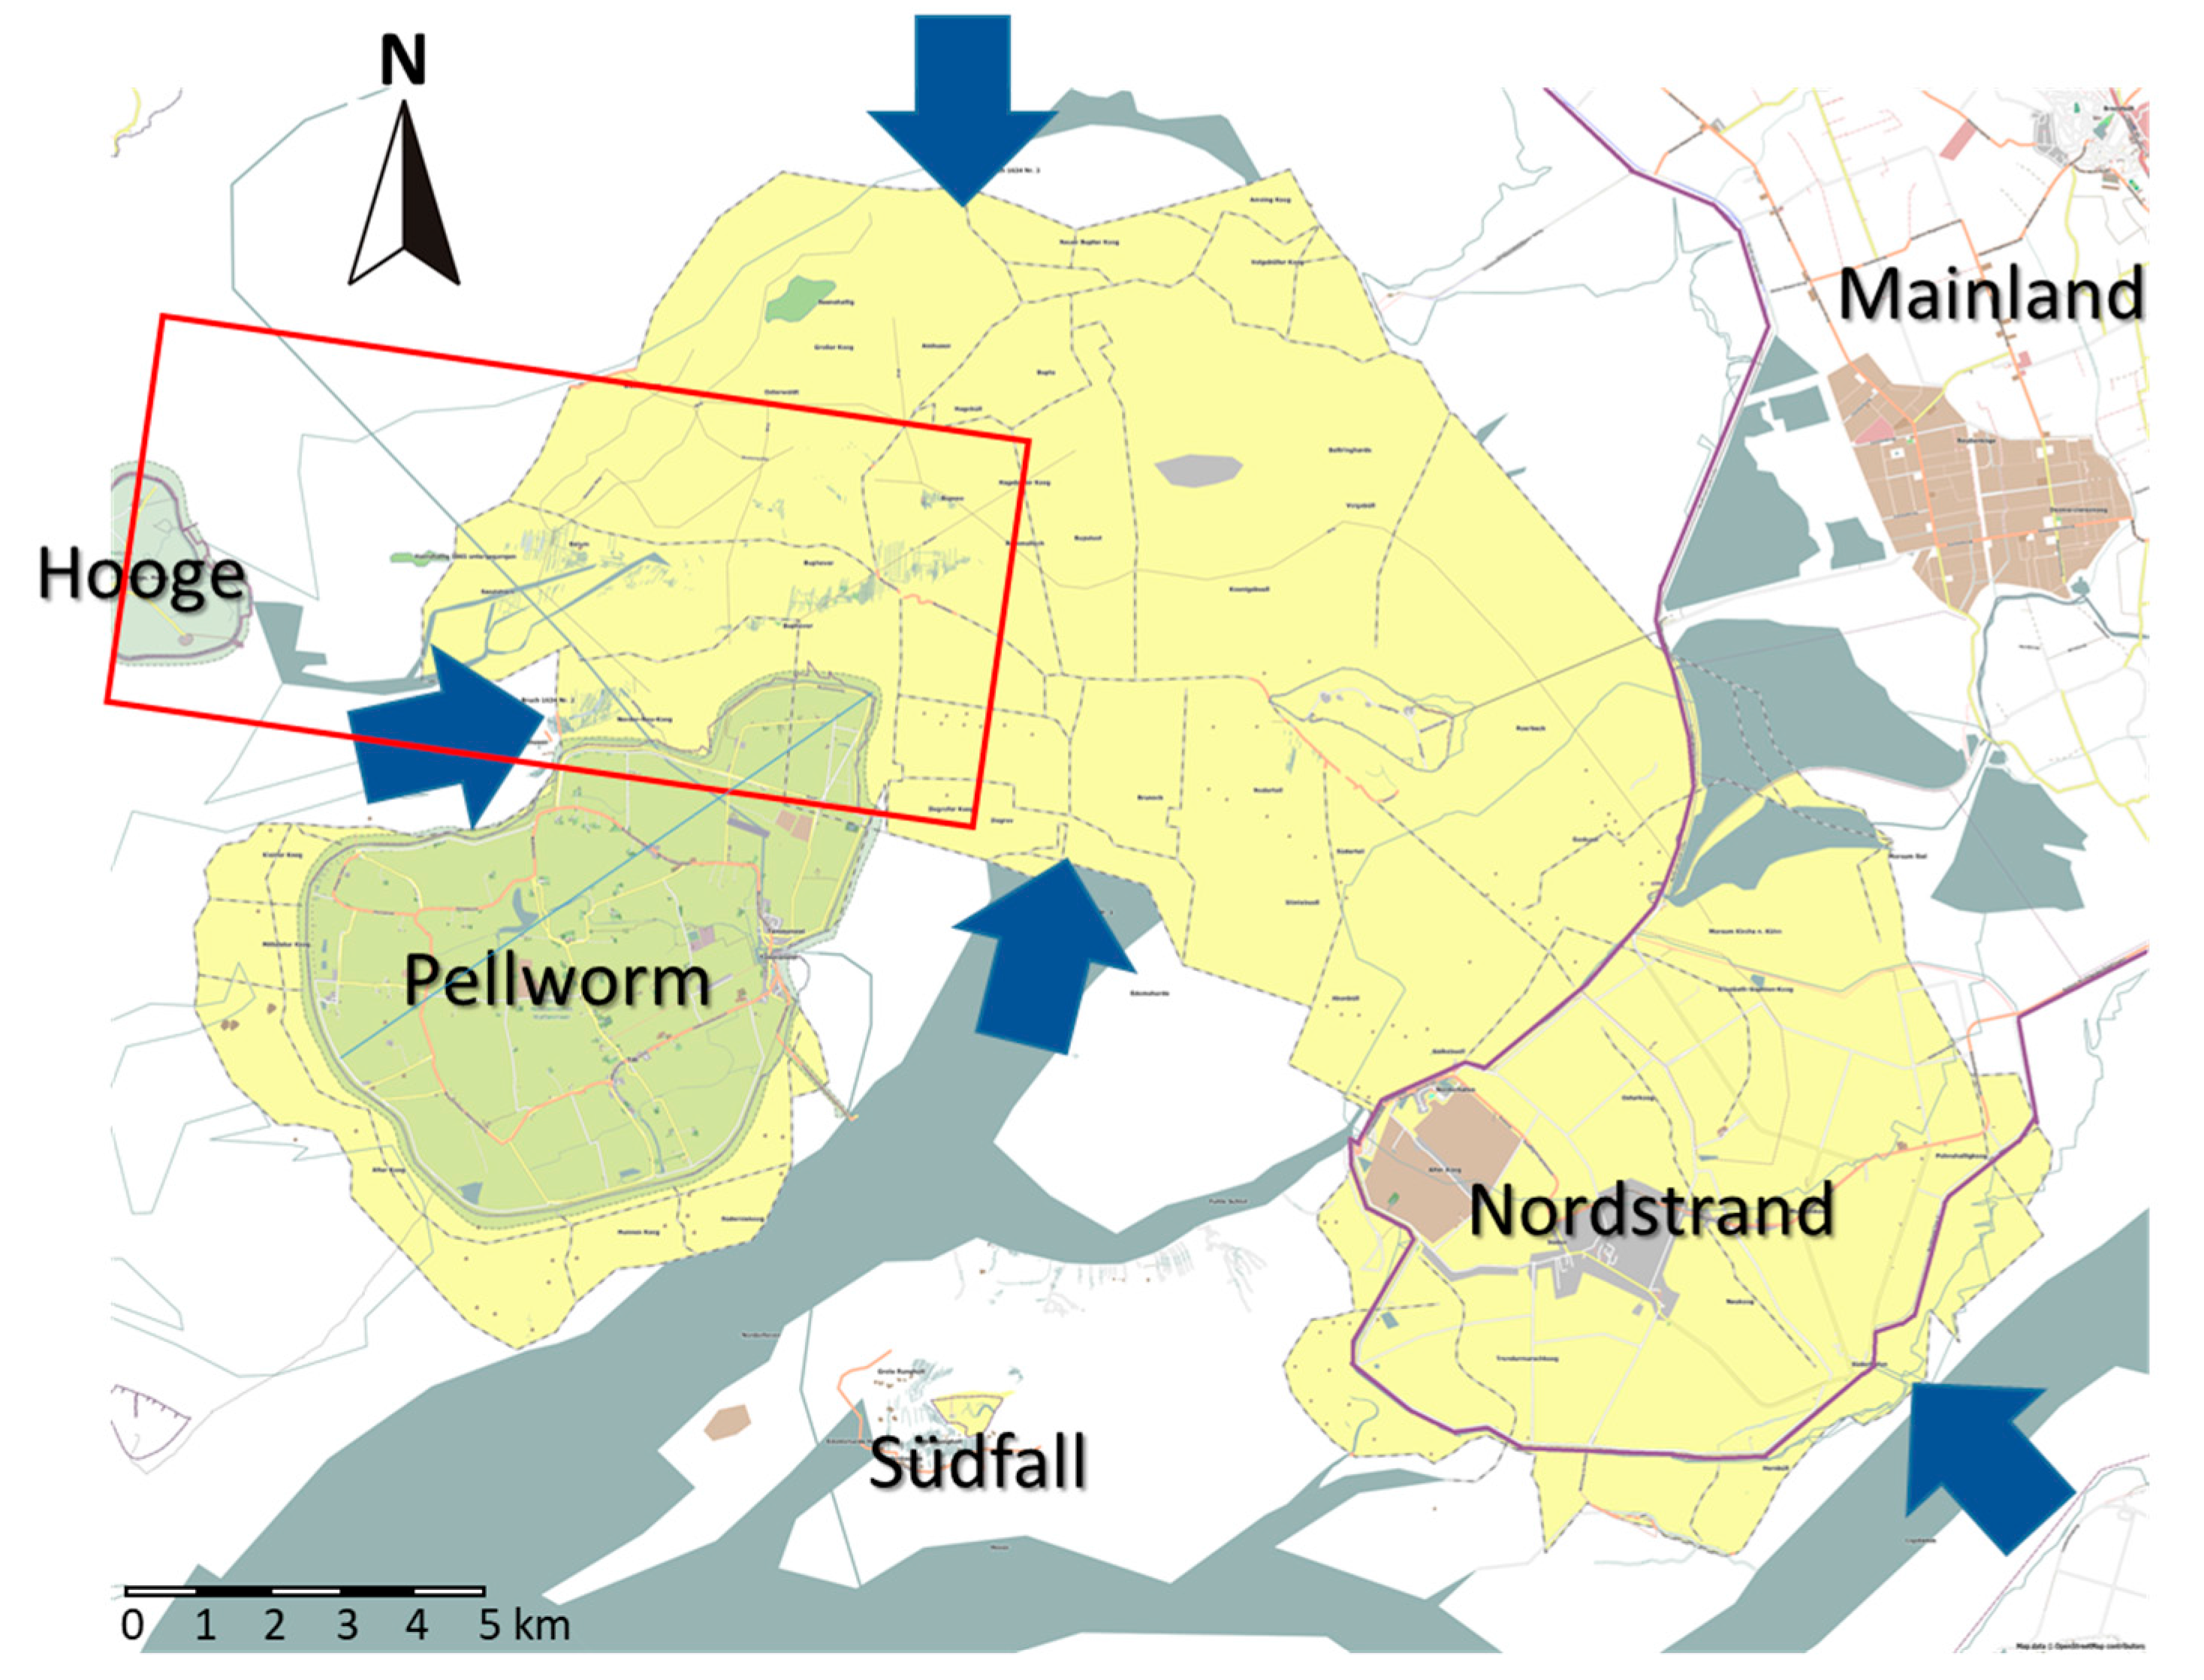
The locations of all (known) cultural traces are depicted in Figure 4, where the light-green background color marks the islands of Pellworm (bottom) and Hooge (left) and the yellow background color the former island of Strand (Figure 1). Several of those traces are meanwhile lost, particularly around the small island (so-called Hallig) of Südfall, because of the strong erosion by the tidal currents, wind, and waves. The red rectangle, again, marks the location of the SAR image shown in Figure 3. Four dark blue arrows mark those locations, where the dikes broke during the second “Grote Mandrenke” in 1634.
Many lines mark the (known) locations of former dikes and lanes, as derived from historical maps of that area. Within our study area, i.e., within the red rectangle, groups of parallel lines denote known locations of former drainage systems. The systems consisted of a mesh of ditches, whose remains have become visible after they appeared again on the surface of the intertidal flats.
2.2. Synthetic Aperture Radar Data
A total of 19 SAR images acquired between 2012 and 2017 by the German TerraSAR/TanDEM-X and the Canadian Radarsat-2 satellites in high-resolution modes were available for our analyses of SAR signatures of historical land use. The pixel sizes of all images are on the order of 1 m², or even below, thereby allowing for the detection of fine structures such as remains of narrow ditches, settlements, etc. All images were calibrated and geocoded, and the speckle noise was reduced applying a Lee filter [20]. Of particular use was the new “staring spotlight” mode of the TerraSAR/TanDEM-X missions, with pixel sizes reaching down to 0.05 m2 (Table 1) and spatial resolutions down to 0.5 m. This made it possible to detect fine structures even after speckle filtering.
SAR data from the European ENVISAT ASAR [21] and the Japanese ALOS PALSAR [22] missions have been successfully used for archaeological prospection and monitoring. However, since the pixel sizes of those images are on the order of 10 to 100 m2, they did not allow studying the fine structures that are of interest herein. Table 1 gives an overview of all SAR images used, including the acquisition times and modes, pixel sizes, and the times of the closest low tide.
Intertidal flats are highly morphodynamic, and when the muddy and sandy marine sediments of the flats’ upper layer are moved away, banks of peat, old clay, and remains of farmland and settlements appear again on the dry-fallen surface. Moreover, the deposition of fine sediments along those morphologically harder structures can increase the local contrast, thereby making them (better) visible in aerial and satellite imagery. Analyzing the high-resolution SAR imagery we found at several places fine linear structures, which are clearly anthropogenic.
3. Examples of Cultural Traces Found on SAR Imagery
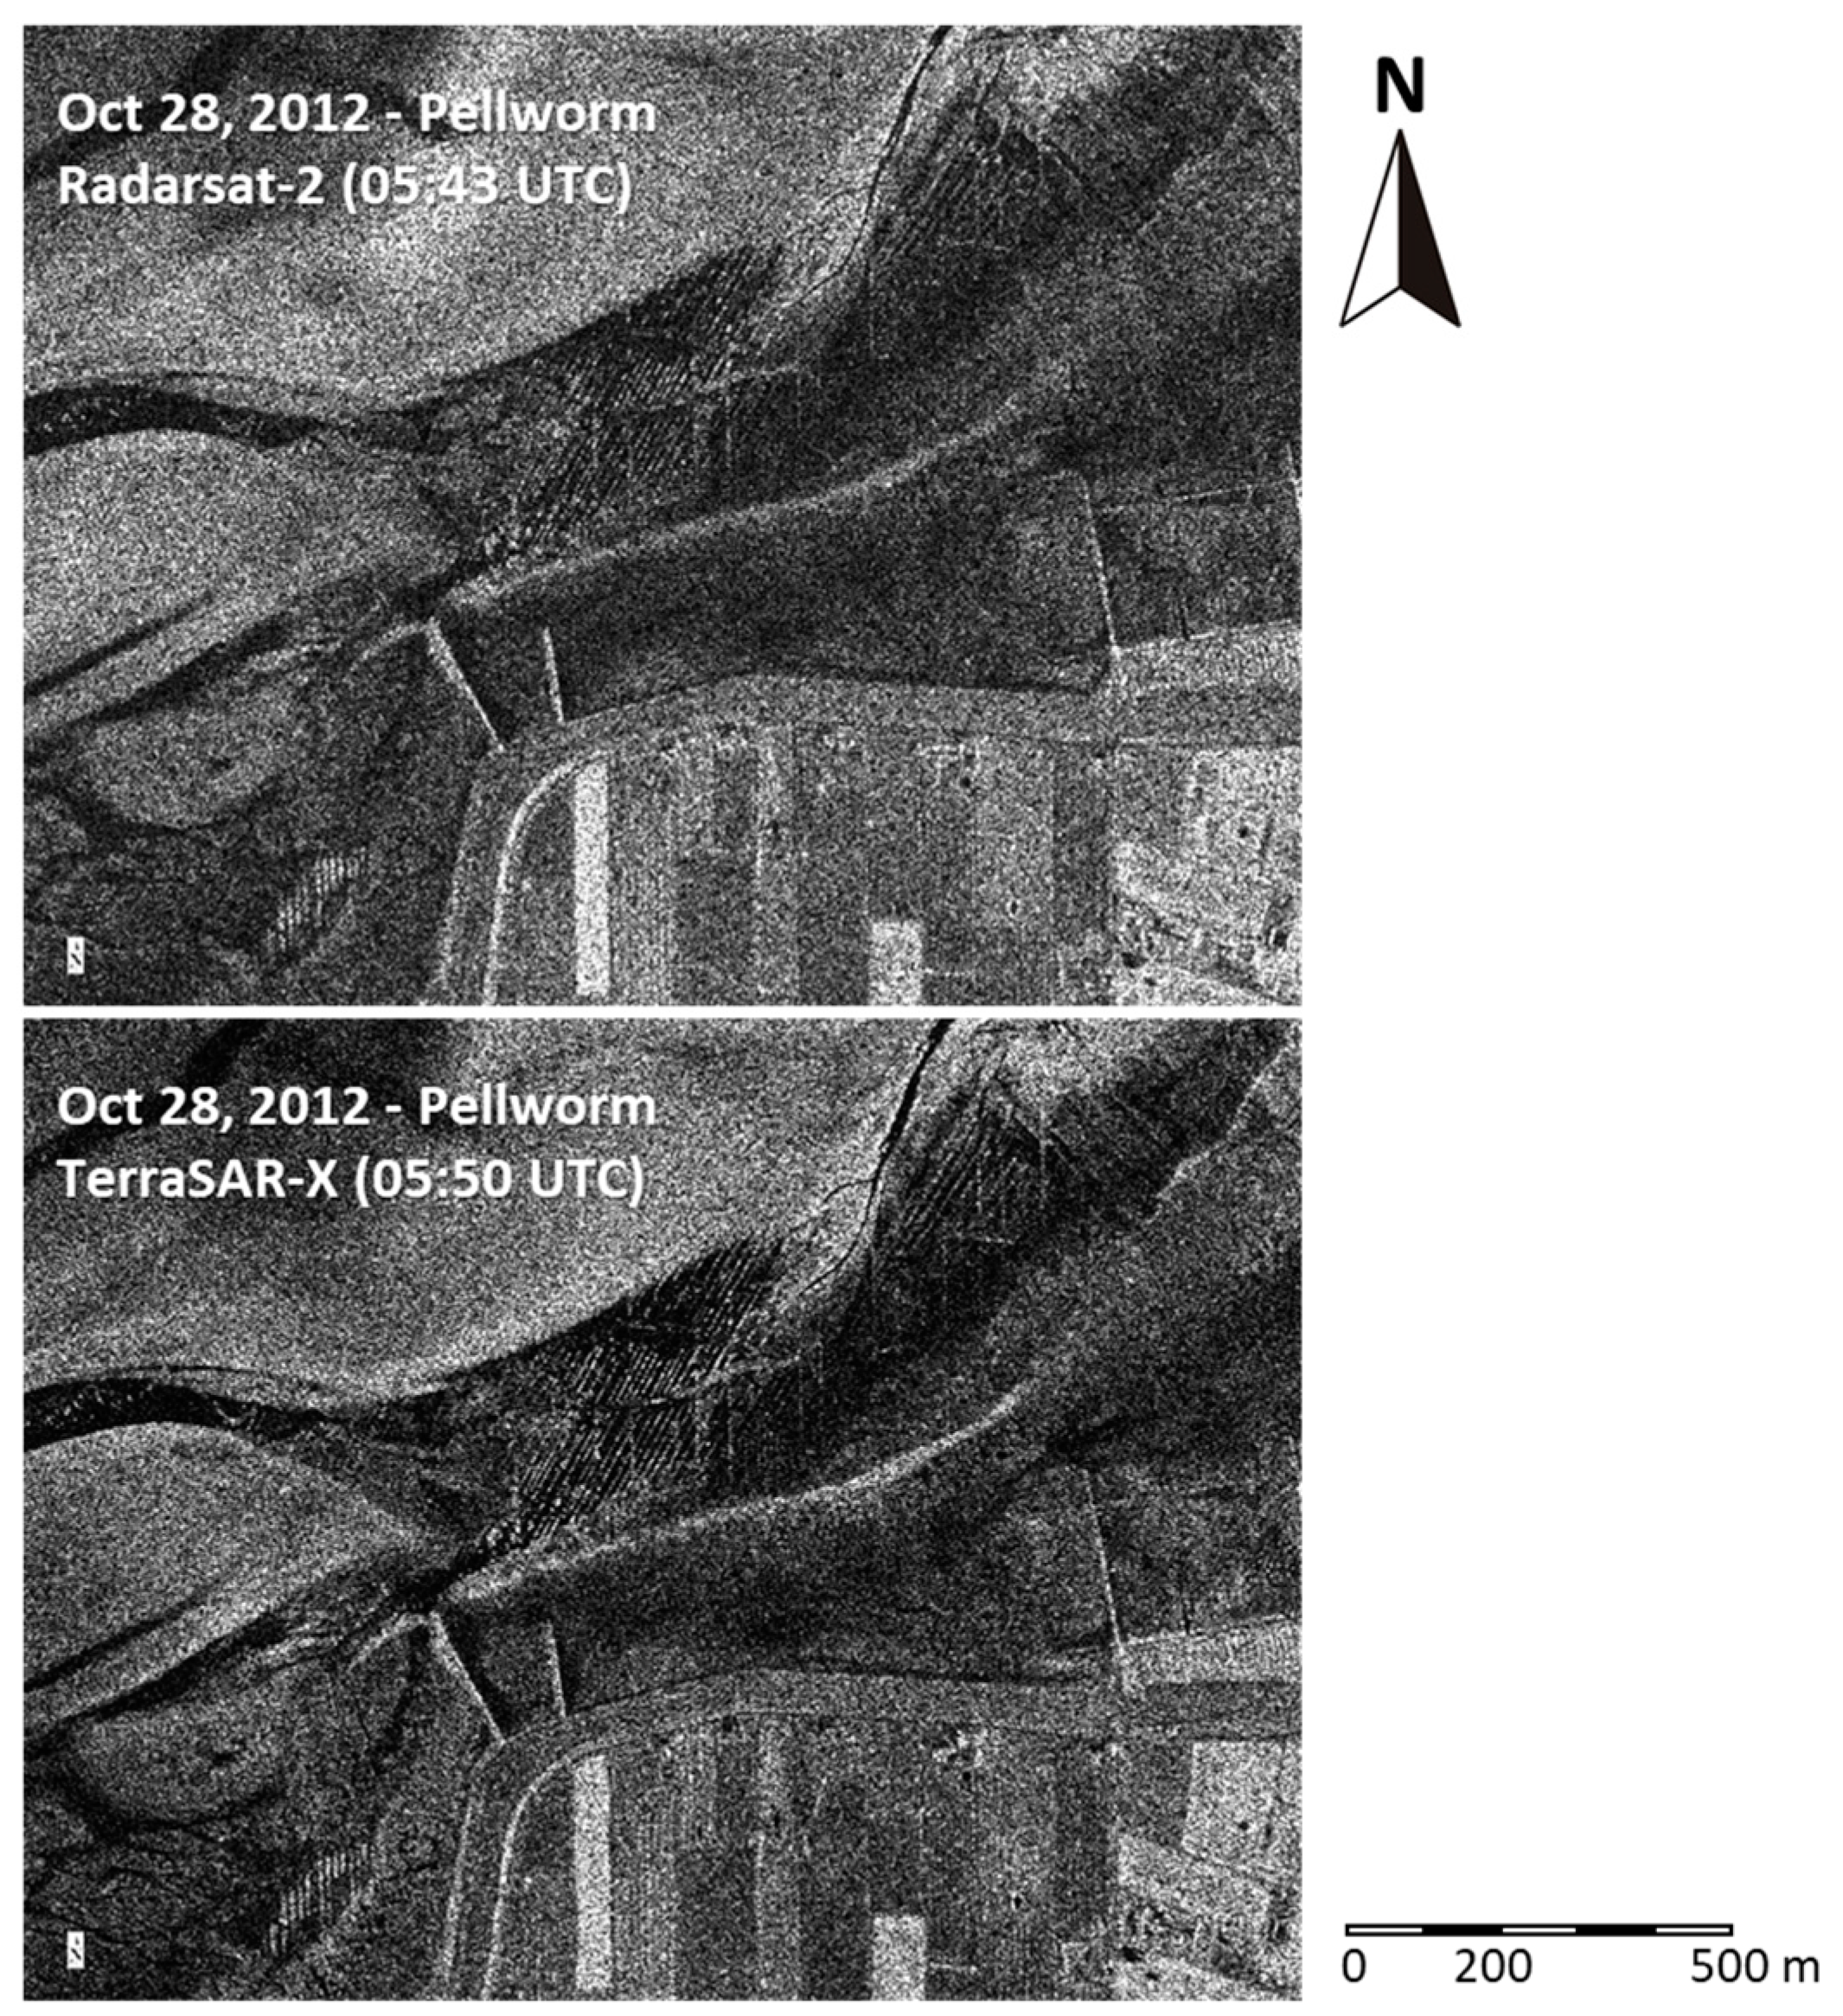
The two SAR images in Figure 5 were acquired on the same day, 28 October 2012, only 7 mins apart, by Radarsat-2 (upper panel) and TerraSAR-X (lower panel), both with pixel sizes of 1 m × 1 m. They show the same 1.7 km × 1.3 km area, north of Pellworm, containing the lower left red square in Figure 3. The diagonal parallel lines in the images’ centers are manifestations of remains of historical ditches (compare with Figure 4 as well) that were buried for centuries under the sandy sediment.
These SAR image examples demonstrate that cultural traces on exposed intertidal flats can be detected by space-borne SAR, if the spatial resolution is high enough. We also note that the two SAR systems operate at different microwave frequencies (Radarsat-2: 5.41 GHz; TerraSAR-X: 9.65 GHz), but show similar image contrasts caused by the cultural traces. The radar backscattering depends on the surface roughness, whose scales are of the same order than the radar wavelength (some centimeters). Therefore, we can conclude that the roughness caused by the cultural traces must be of scales of several centimeters, too (see below).
3.1. Remains of Settlements in “Bupsee”
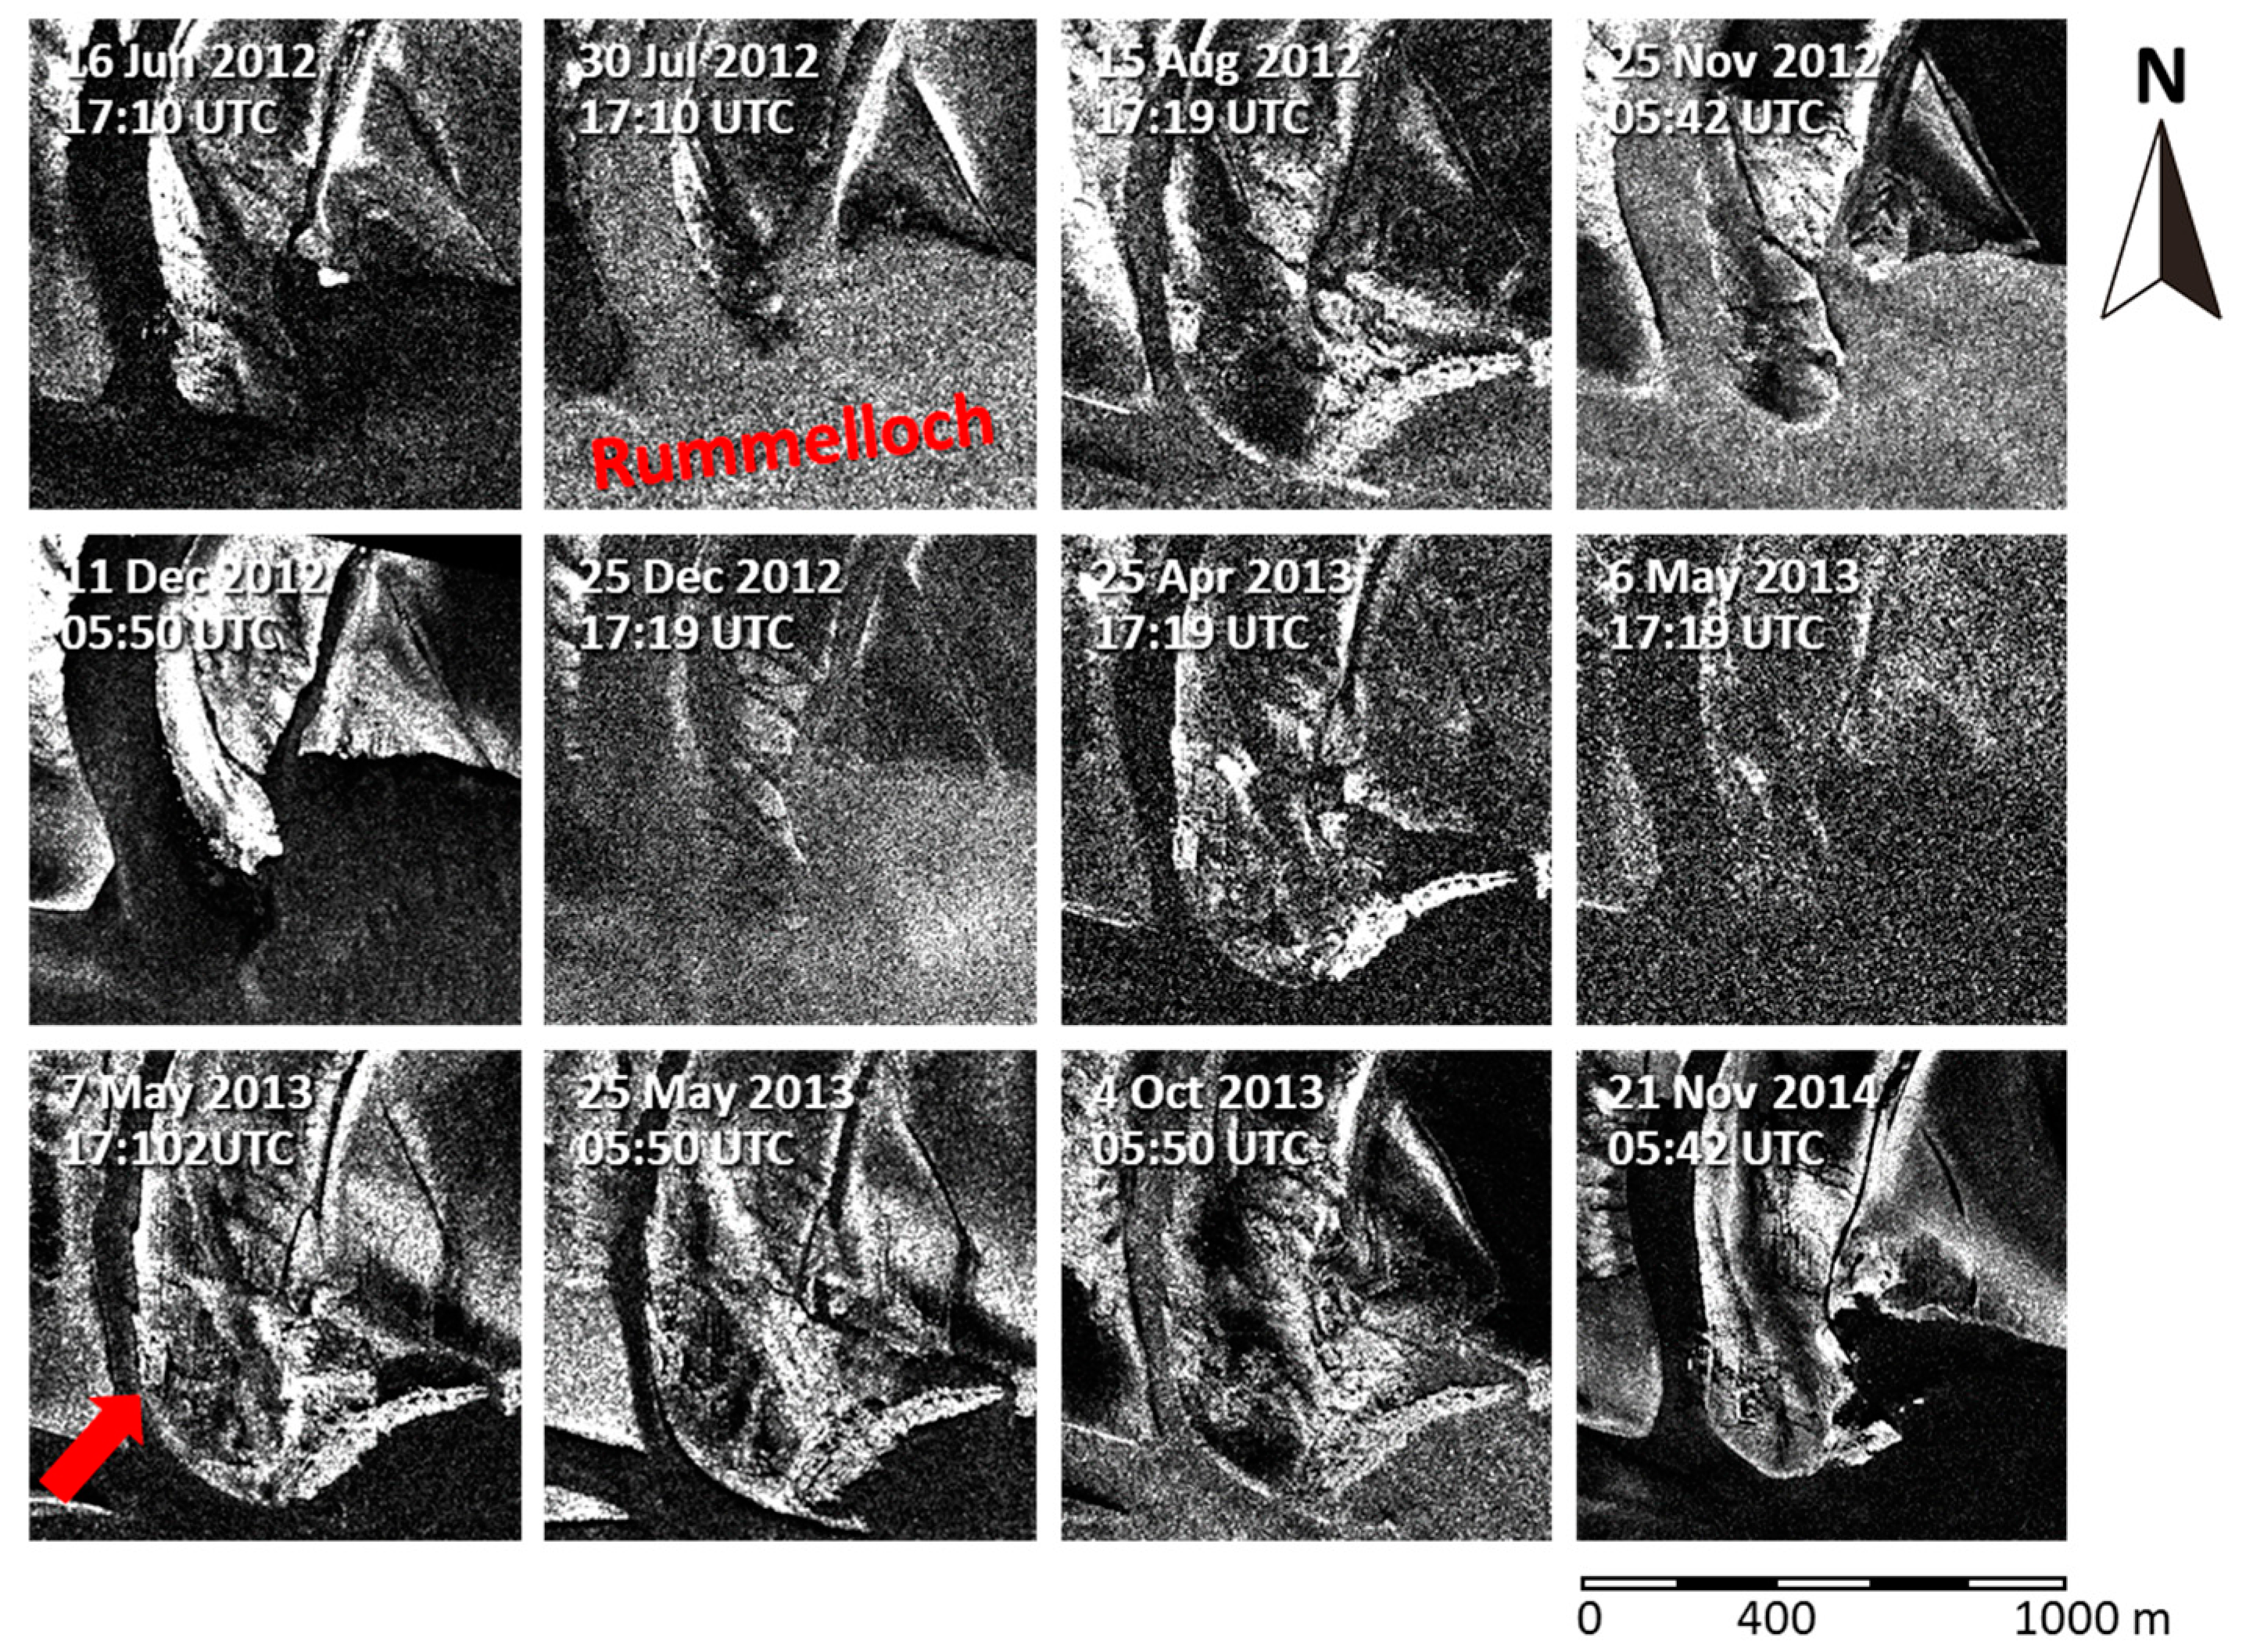
A series of 1 km × 1 km details of TerraSAR/TanDEM-X images is included in Figure 6. The SAR images show the same spot, north-east of Pellworm, corresponding to the upper right red square in Figure 3. In the lower part of each panel the tidal channel “Rummelloch” can be delineated, as well as a smaller tidal channel entering from the north. The intertidal flat in the panels’ centers had fallen dry to different extent, depending on the water level at the time of image acquisition. A rectangular feature, which appears in some of the panels (but not in all of them), is marked by the red arrow in the lower left panel. This feature was observed in high-resolution TerraSAR-X imagery first, and it was studied in greater detail using data acquired in the ‘staring spotlight’ mode (lower right panel of Figure 6).
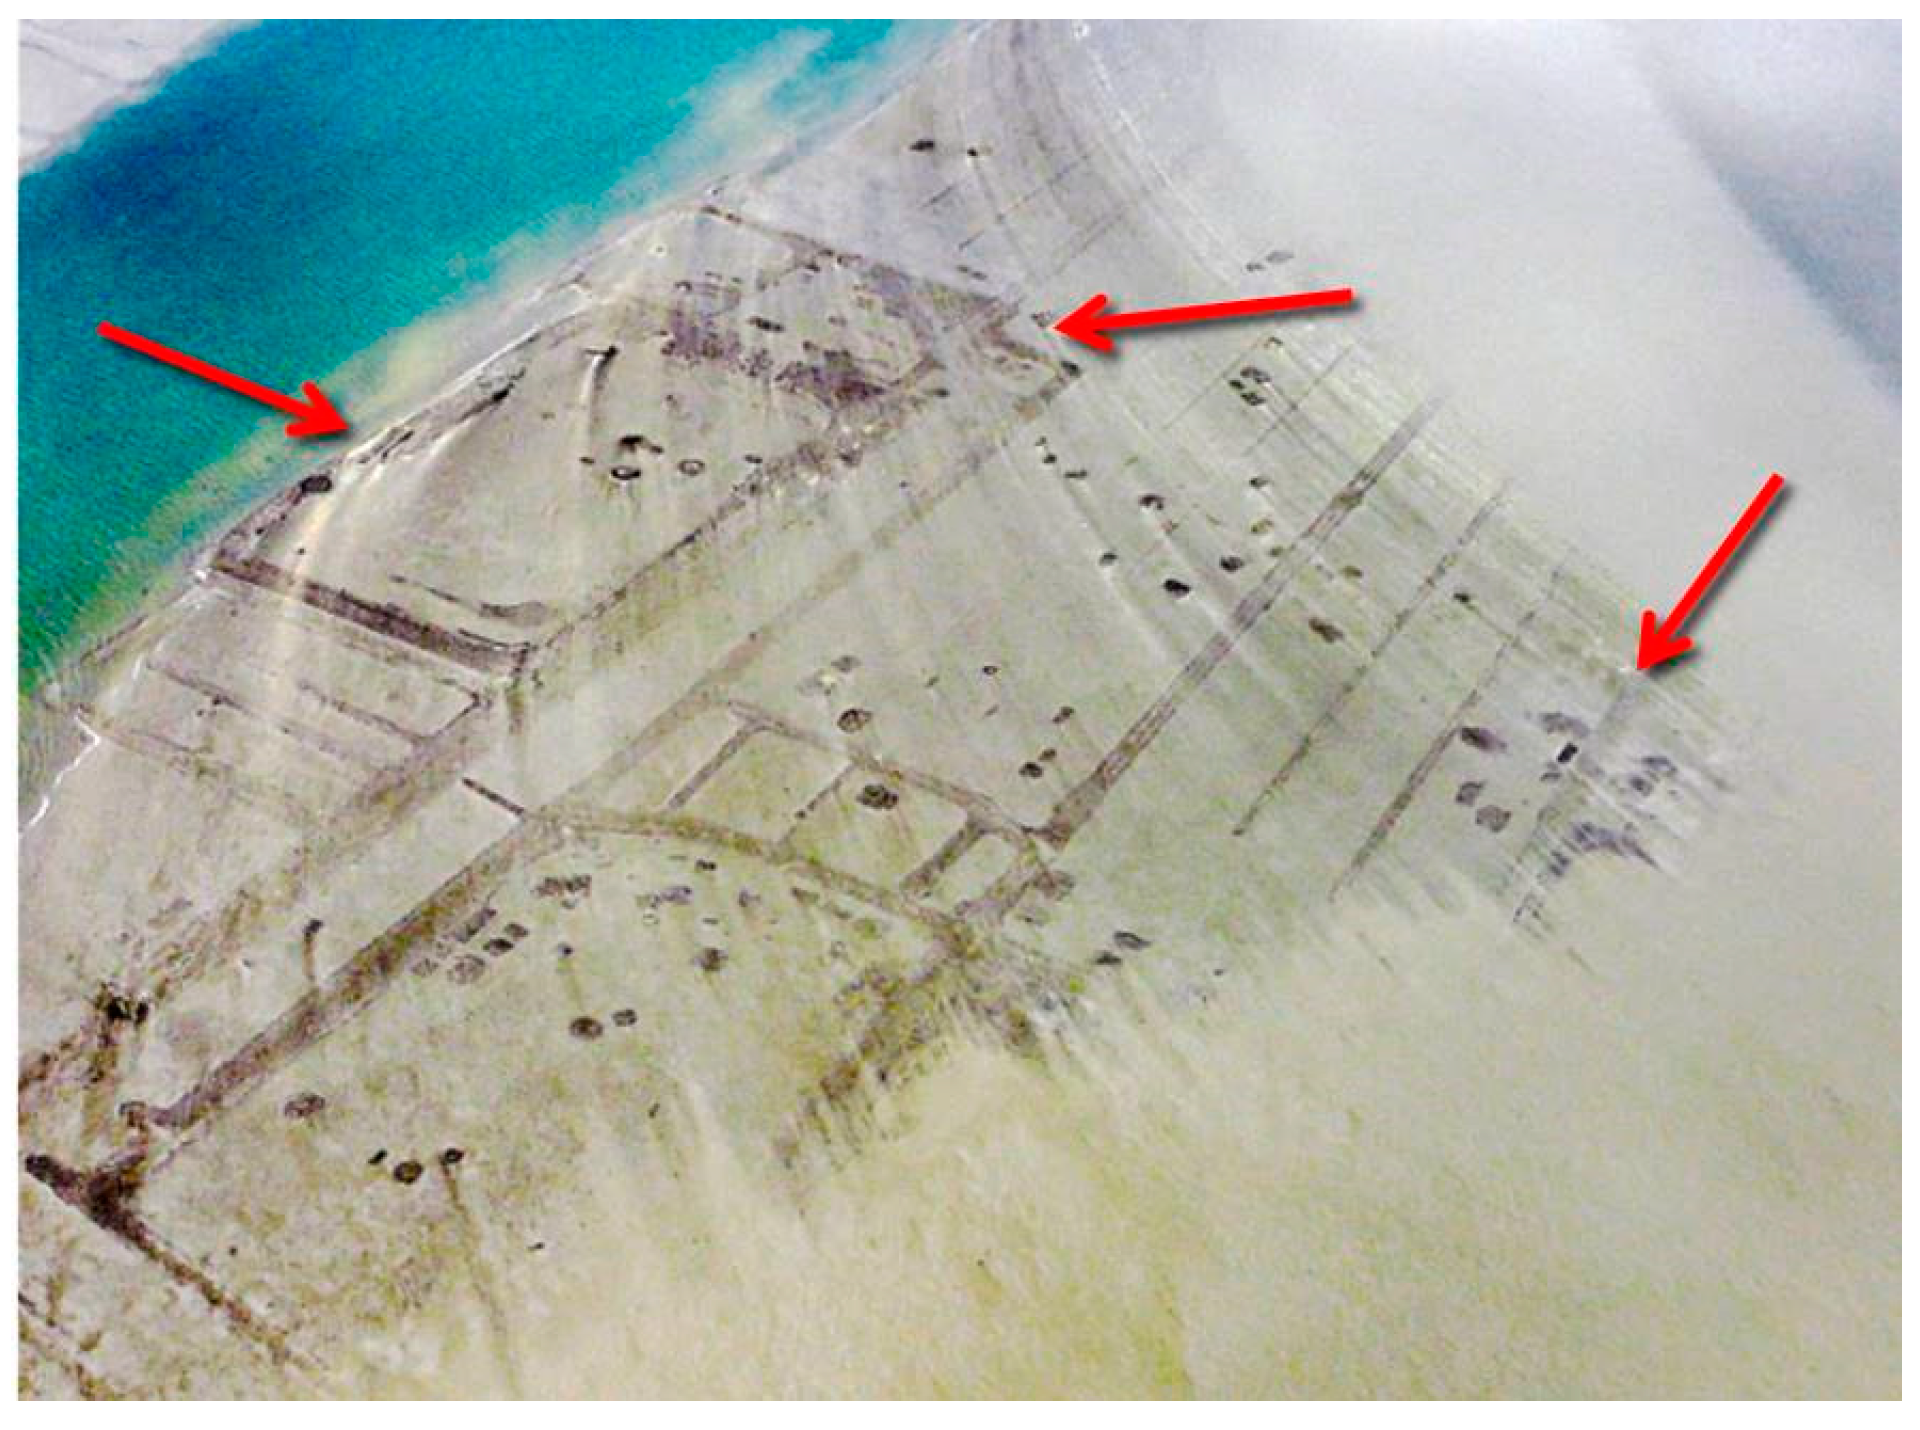
Figure 7 shows an aerial photograph of the same intertidal flat, taken at low tide on 29 July 2009 (i.e., some years before the SAR images were acquired). Here, it is obvious that the above-mentioned linear structures originate from foundations of former constructions. In addition, several dark spots are visible, which originate from former wells, pits, cisterns, etc. Those spots can also be found as bright spots on SAR imagery (Figure 8) if the spatial resolution is high enough. Note that in SAR images of lower resolutions they could easily be confused with the speckle noise typical for SAR imagery. Three arrows are included in the aerial photograph for better comparison with the SAR images shown in Figure 8. Also visible in the photograph is the sandy sediment, under which those structures were buried for long, and which was driven apart by currents, wind, and waves.
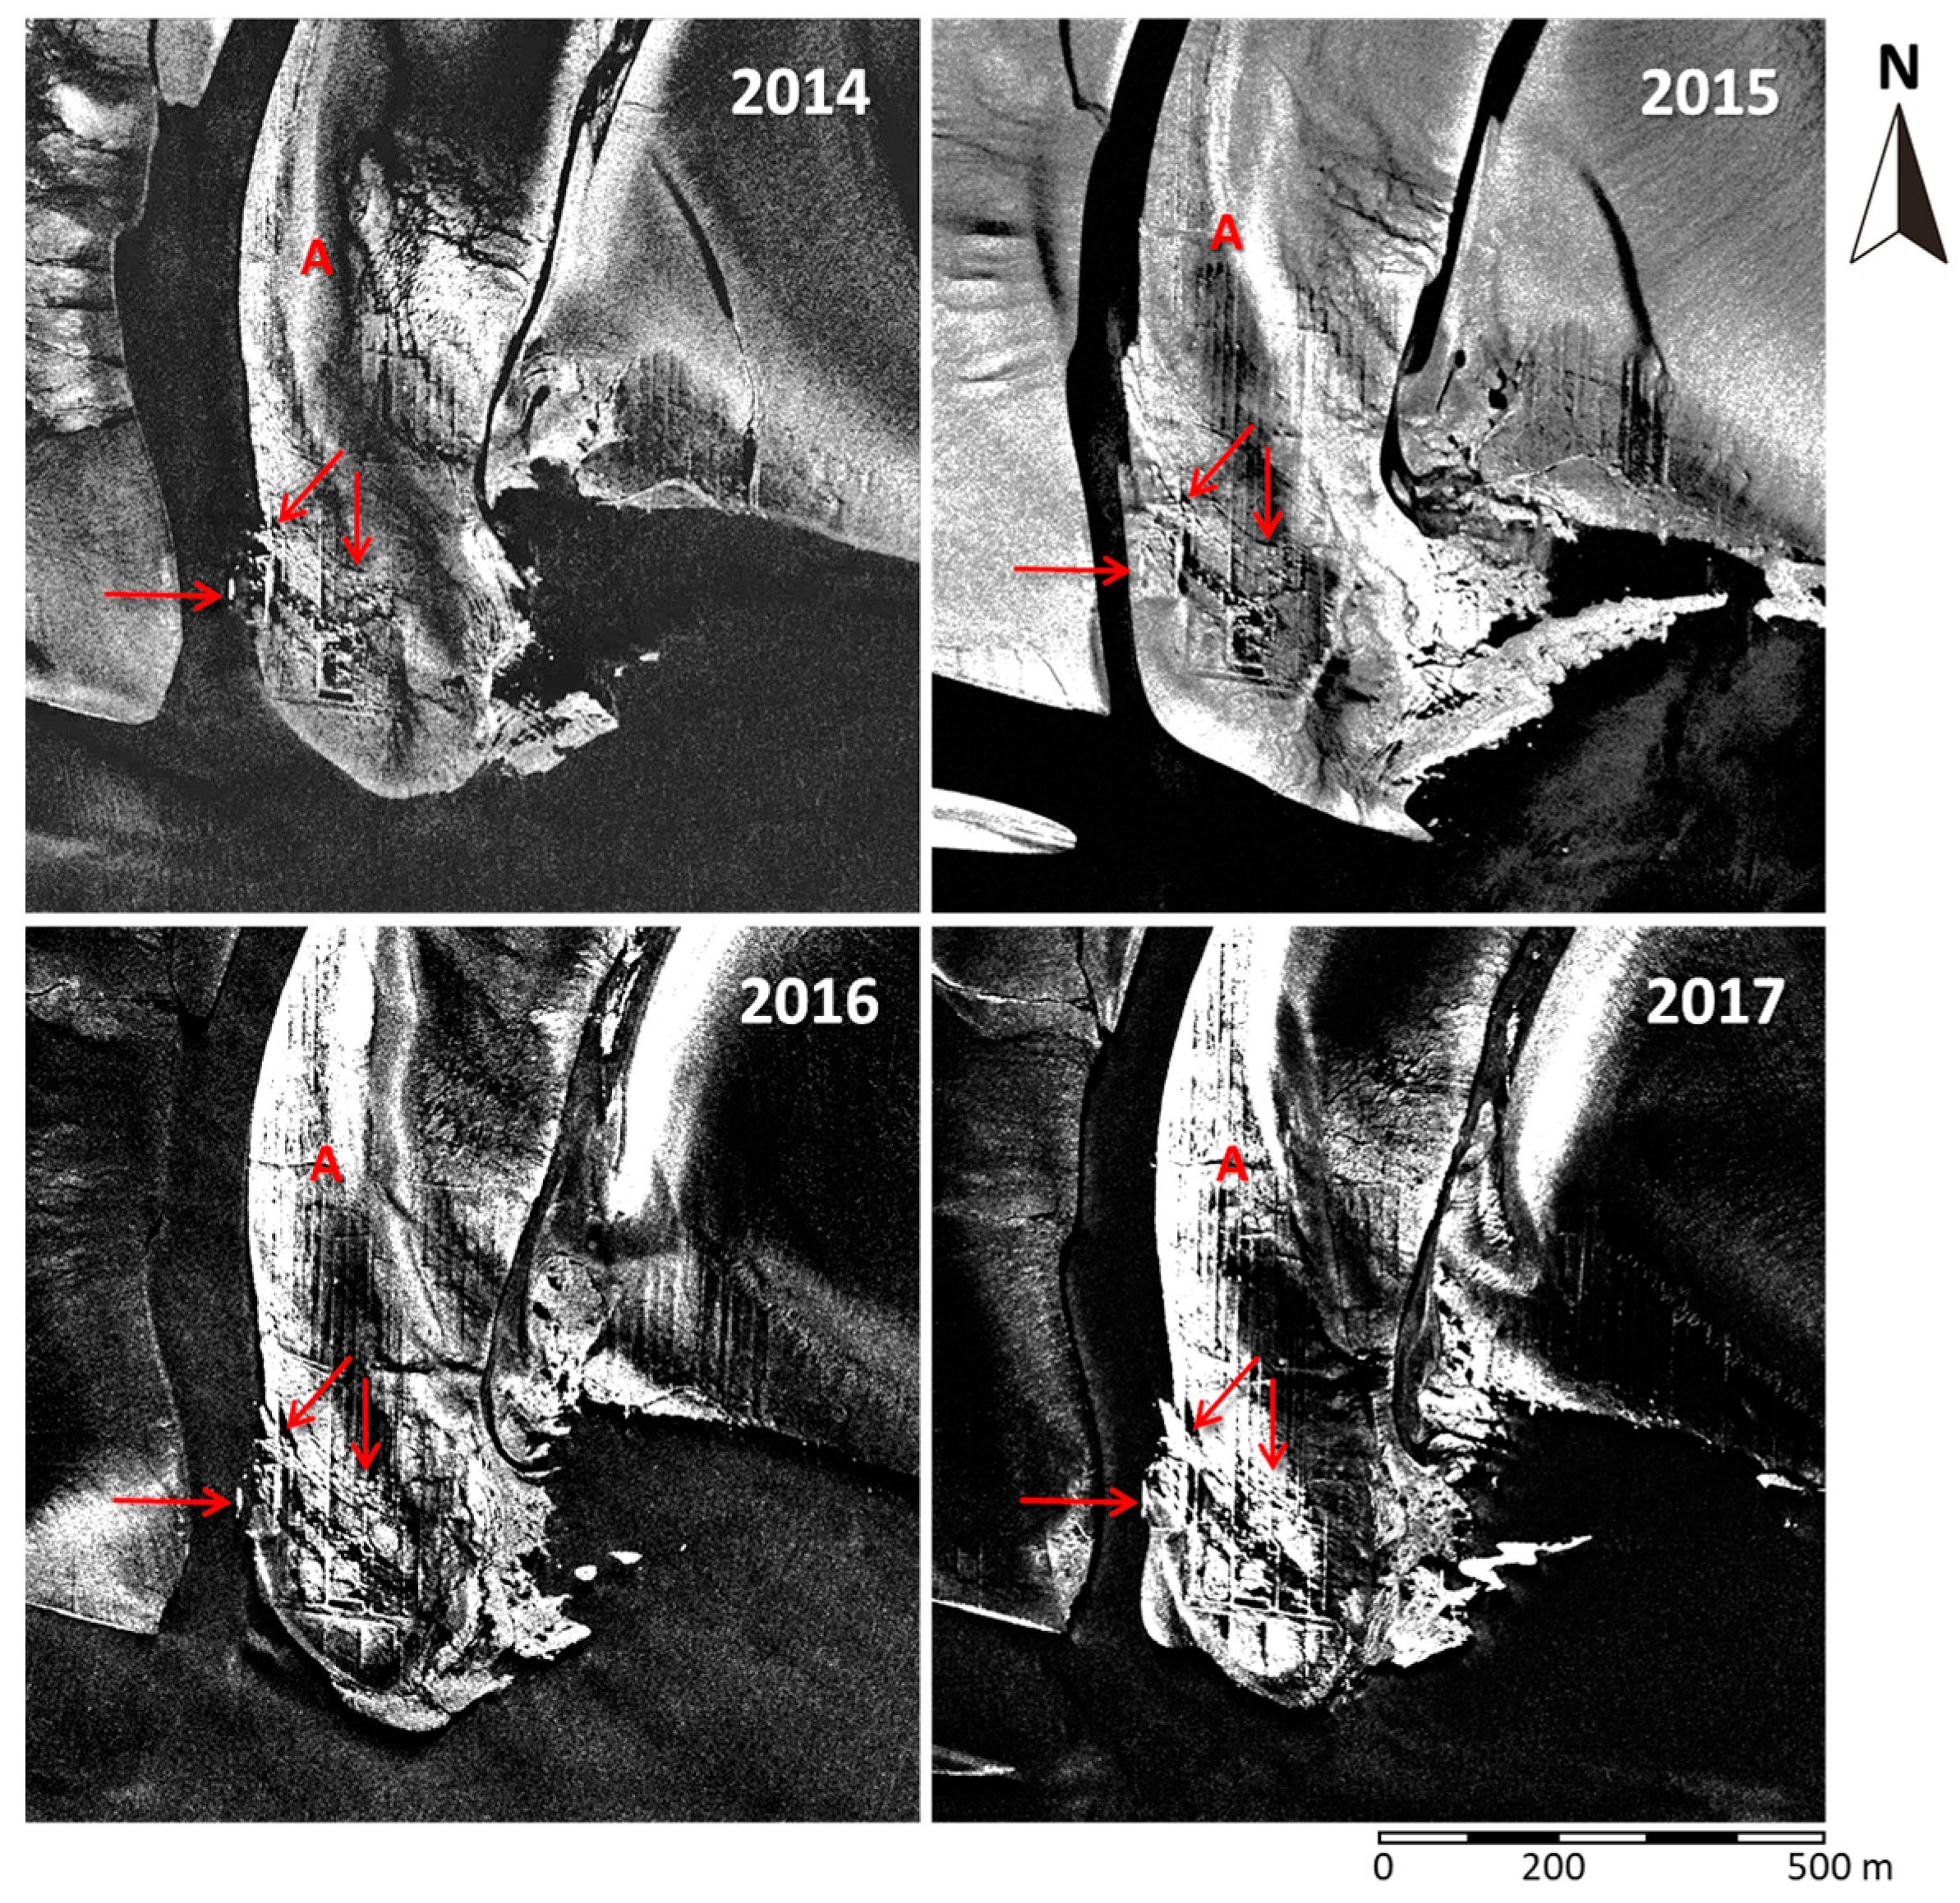
Figure 8 contains 1000 m × 1000 m details of four TerraSAR-X/TanDEM-X images acquired in staring spotlight mode on 19 November 2014, at 17:02 UTC (upper left; 27 minutes after low tide), on 20 January 2015, at 05:51 UTC (upper right; 36 minutes before low tide), on 18 July 2016, at 05:42 UTC (lower left; 10 minutes after low tide), and on 22 June 2017, at 17:02 UTC (lower right; 11 minutes before low tide). The location of these 1 km2 details is the same as in Figure 6 (upper right red square in Figure 3).
The very fine pixel sizes of 28 cm × 28 cm and below allow imaging of remains of historical land use (e.g., houses, ditches, lanes), which usually are too narrow to be delineated on SAR imagery of conventional resolution, with pixel sizes on the order of 10 m × 10 m. Clearly visible in all panels of Figure 8 are linear, partly rectangular structures in the lower left image centers, close to the tidal creek (note the red arrows and compare with Figure 7). A close comparison of the aerial photograph (Figure 7) with the high-resolution SAR images (Figure 8) also reveals that, during the approx. Five years between the acquisitions, parts of the exposed remains were already lost, due to the permanent erosion, sedimentation, and morphological changes. However, the comparison of the four panels of Figure 8 also reveals that those rectangular structures are expanding eastward, i.e., that an increasing amount of those traces is appearing at the surface. This example demonstrates that erosion may erase, but may also produce, the traces on the surface that are visible on SAR imagery.
Groups of parallel vertical lines can be seen at different locations in all image centers. The mean distance between those parallel lines is about 15 m, thus indicating that they are remains of former ditches and drainage channels [18]. The letter (A) marks the same location in all panels; note that the spatial extent of the parallel vertical lines surrounding this letter has been increasing, due to the erosion of the upper sediment layers. A closer comparison with the map of all known cultural traces (see below) also reveals that these are structures that had not been known so far.
The above comparisons illustrate the strong morphodynamics on intertidal flats, but also the need for a frequent monitoring of those archaeological sites.
3.2. Remains of Drainage Systems and Lanes in “Waldhusen”
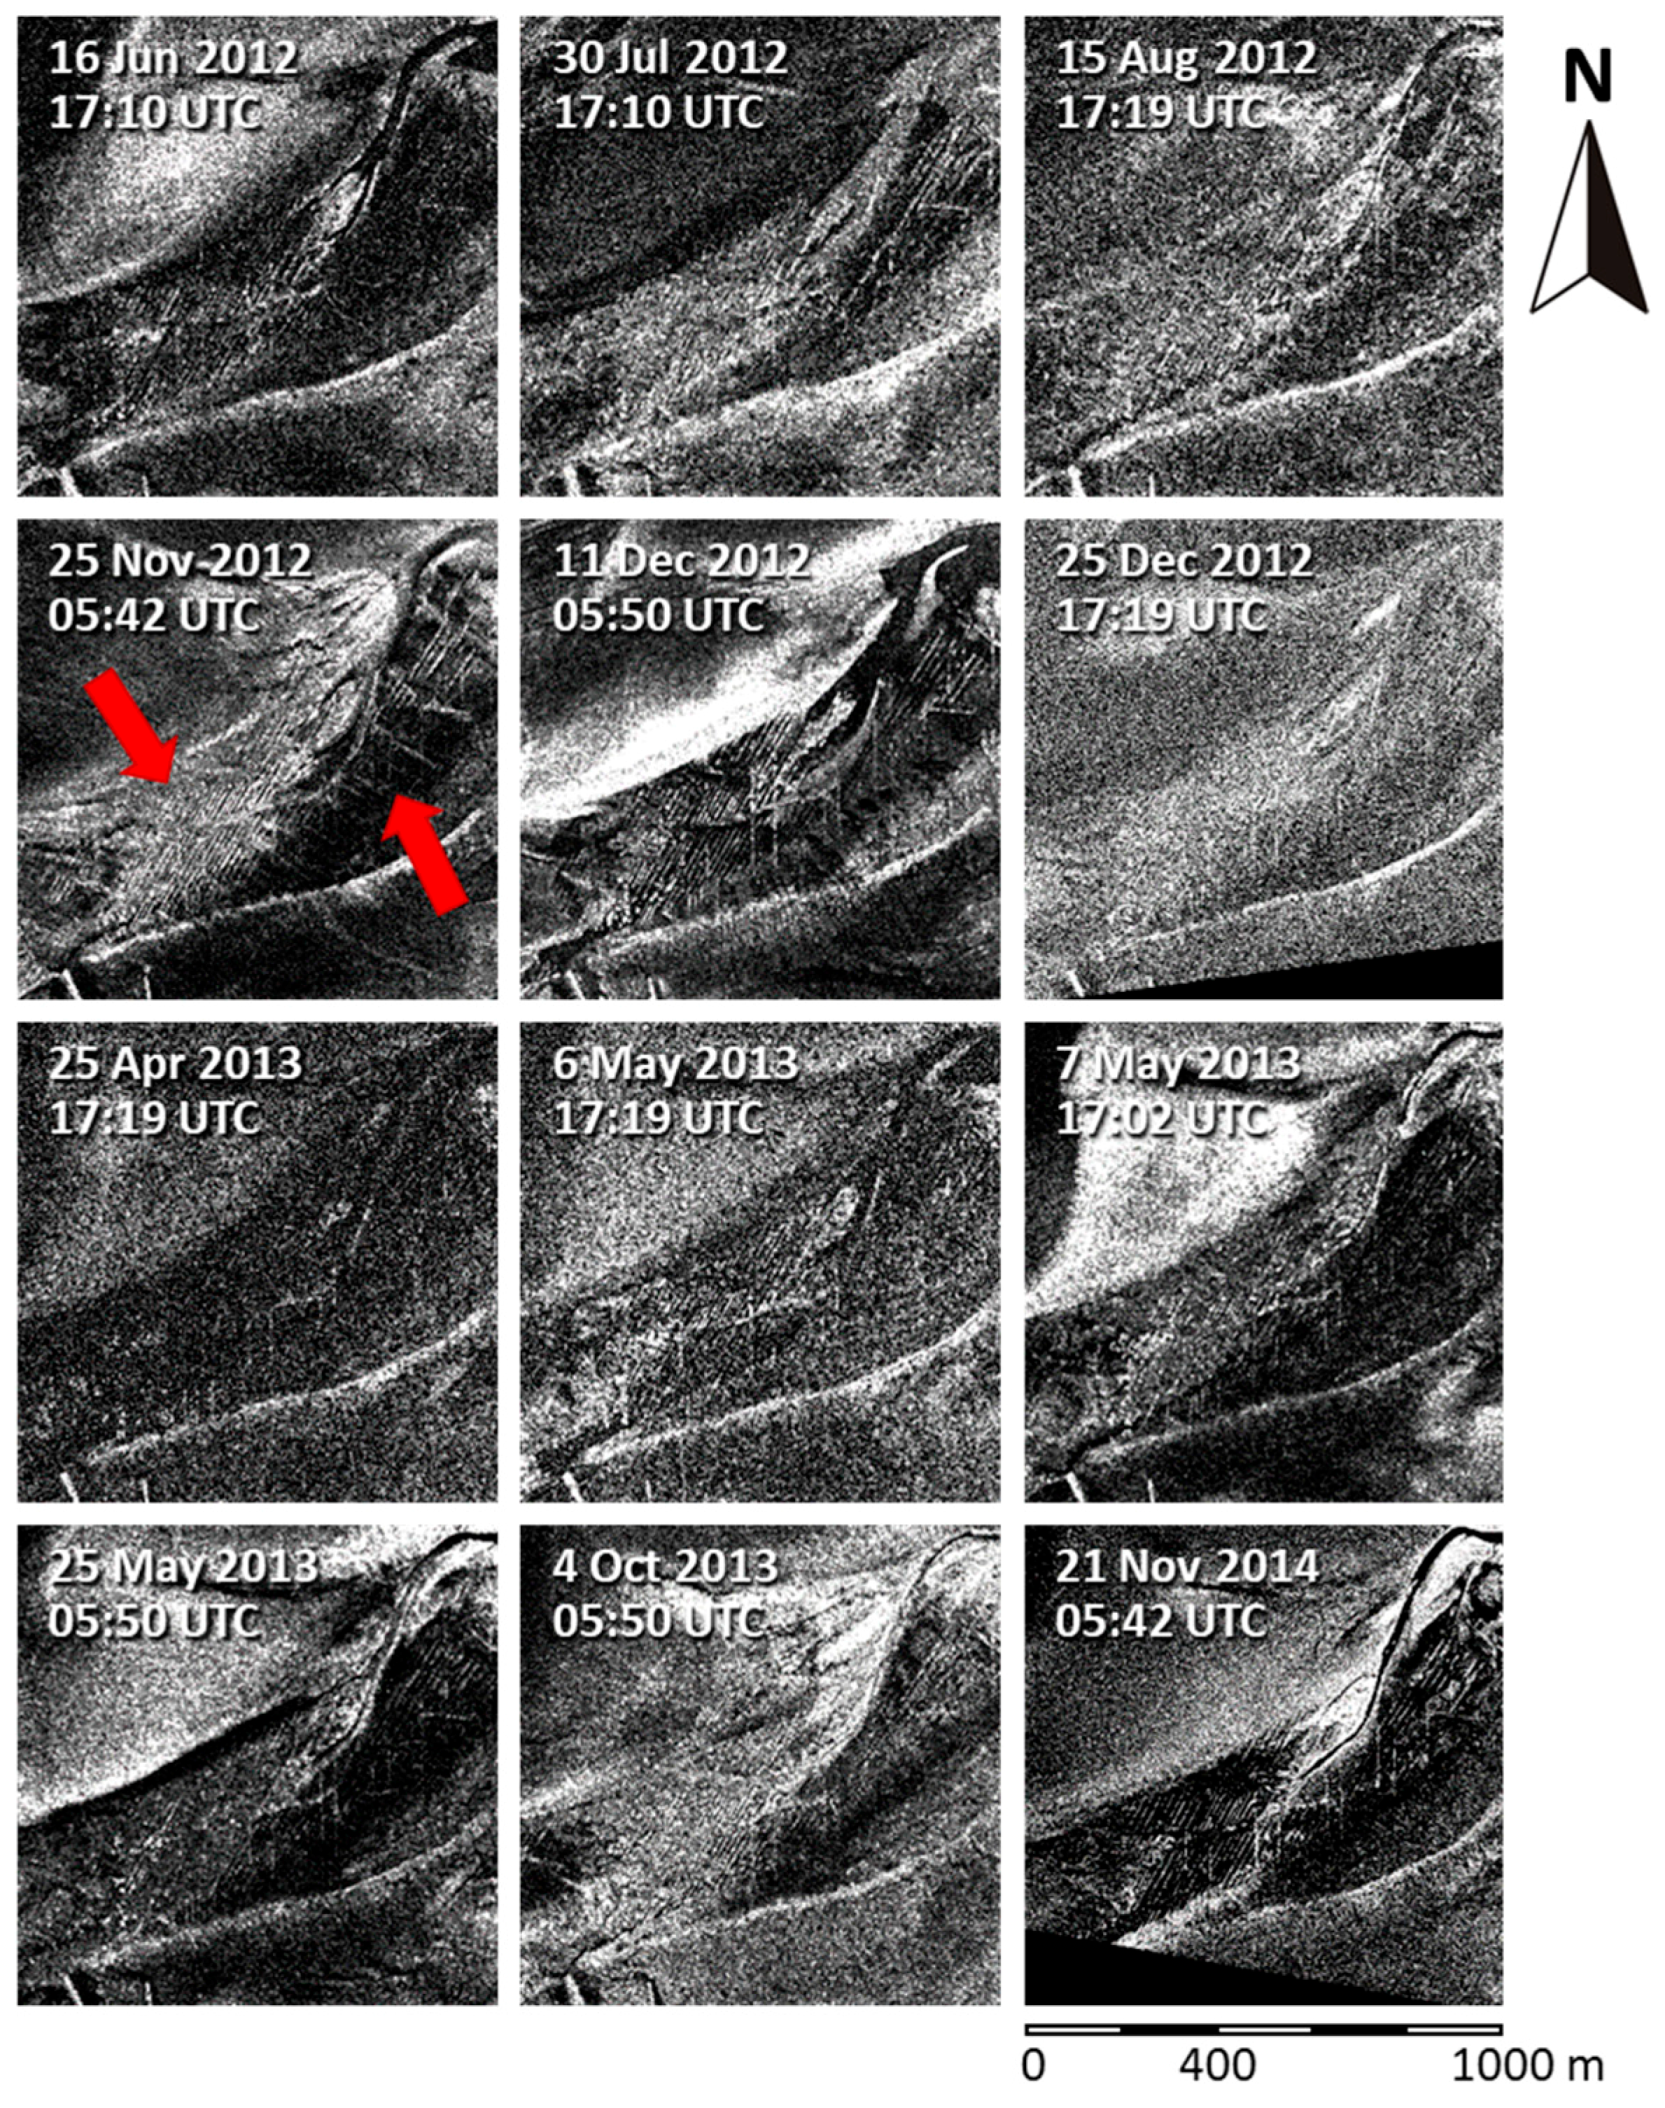
A series of 12 TerraSAR/TanDEM-X images (1 km × 1 km details, corresponding to the lower left red square in Figure 3) is shown in Figure 9. The red arrows mark the same diagonal parallel lines that were shown in Figure 5 and that are due to former ditches and lanes. However, different environmental conditions, namely different water levels and wind speeds during the image acquisitions, may strongly reduce the radar contrast of those structures, thereby making it difficult to extract them from SAR images. Also note that the brightness of the exposed intertidal flats varies, depending not only on the type of sediment [19], but also on the environmental conditions [23]. These variations, however, are not of interest herein.
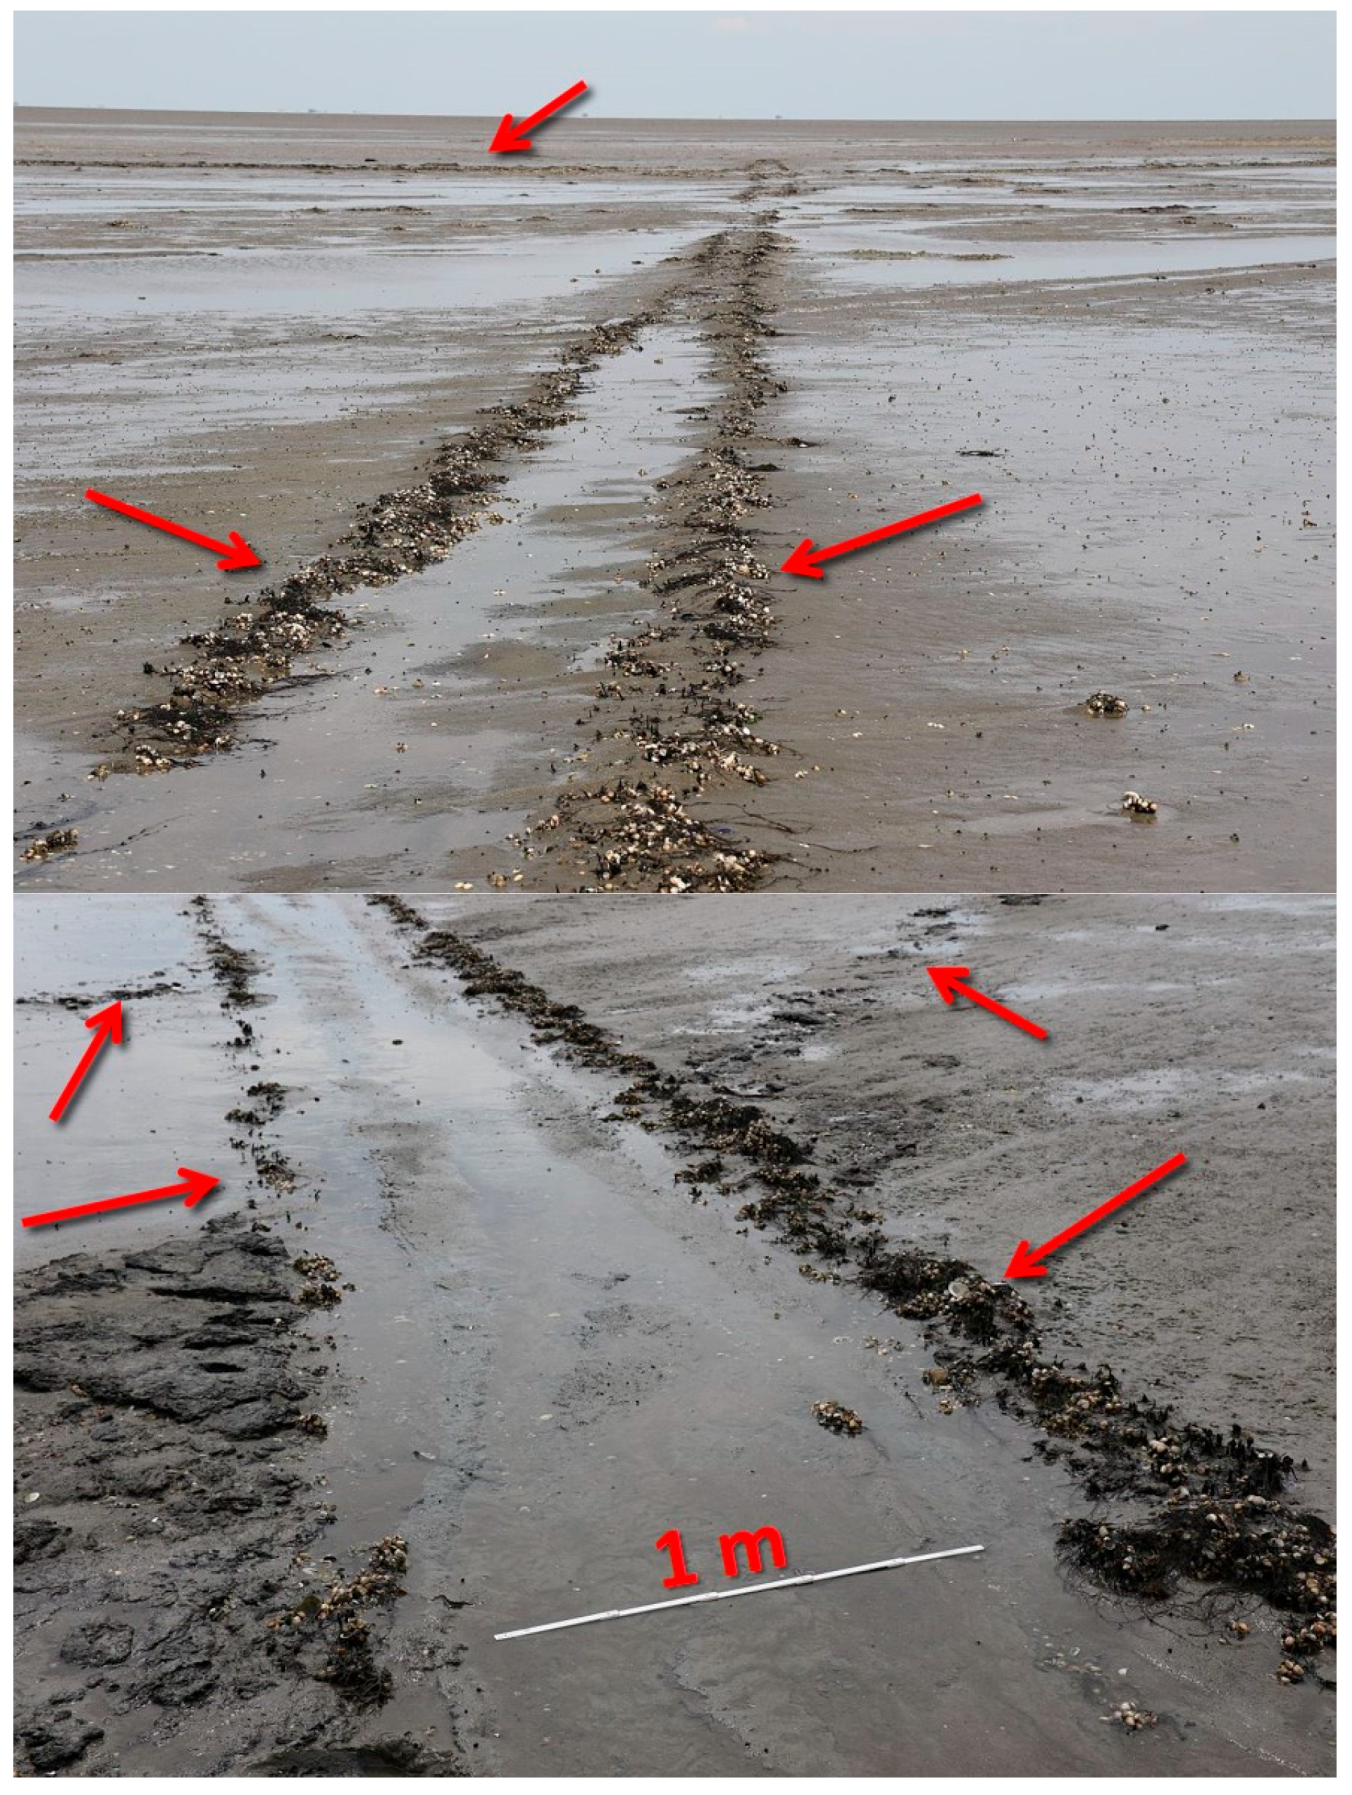
Figure 10 shows two photographs taken during low tide on 15 June 2017 in the study area. Dark parallel structures (marked by the red arrows) on the sand and mud flats can be delineated, which correspond to those seen on the SAR images. Note the differences in sediment composition of the linear structures and the surrounding sandy flats. The ditch remains are marked by denser (harder) sediment causing higher surface roughness, which in turn results in higher radar backscattering. Also note that those lines show higher concentration of bivalves and vegetation (sea grass). Also visible is remnant water in between those structures and in small tidal pools scattered over the study area. This water effectively flattens the surface seen by the SAR (at low wind speeds), thereby leading to a stronger contrast between the parallel bright lines and the dark areas in between (Figure 11).
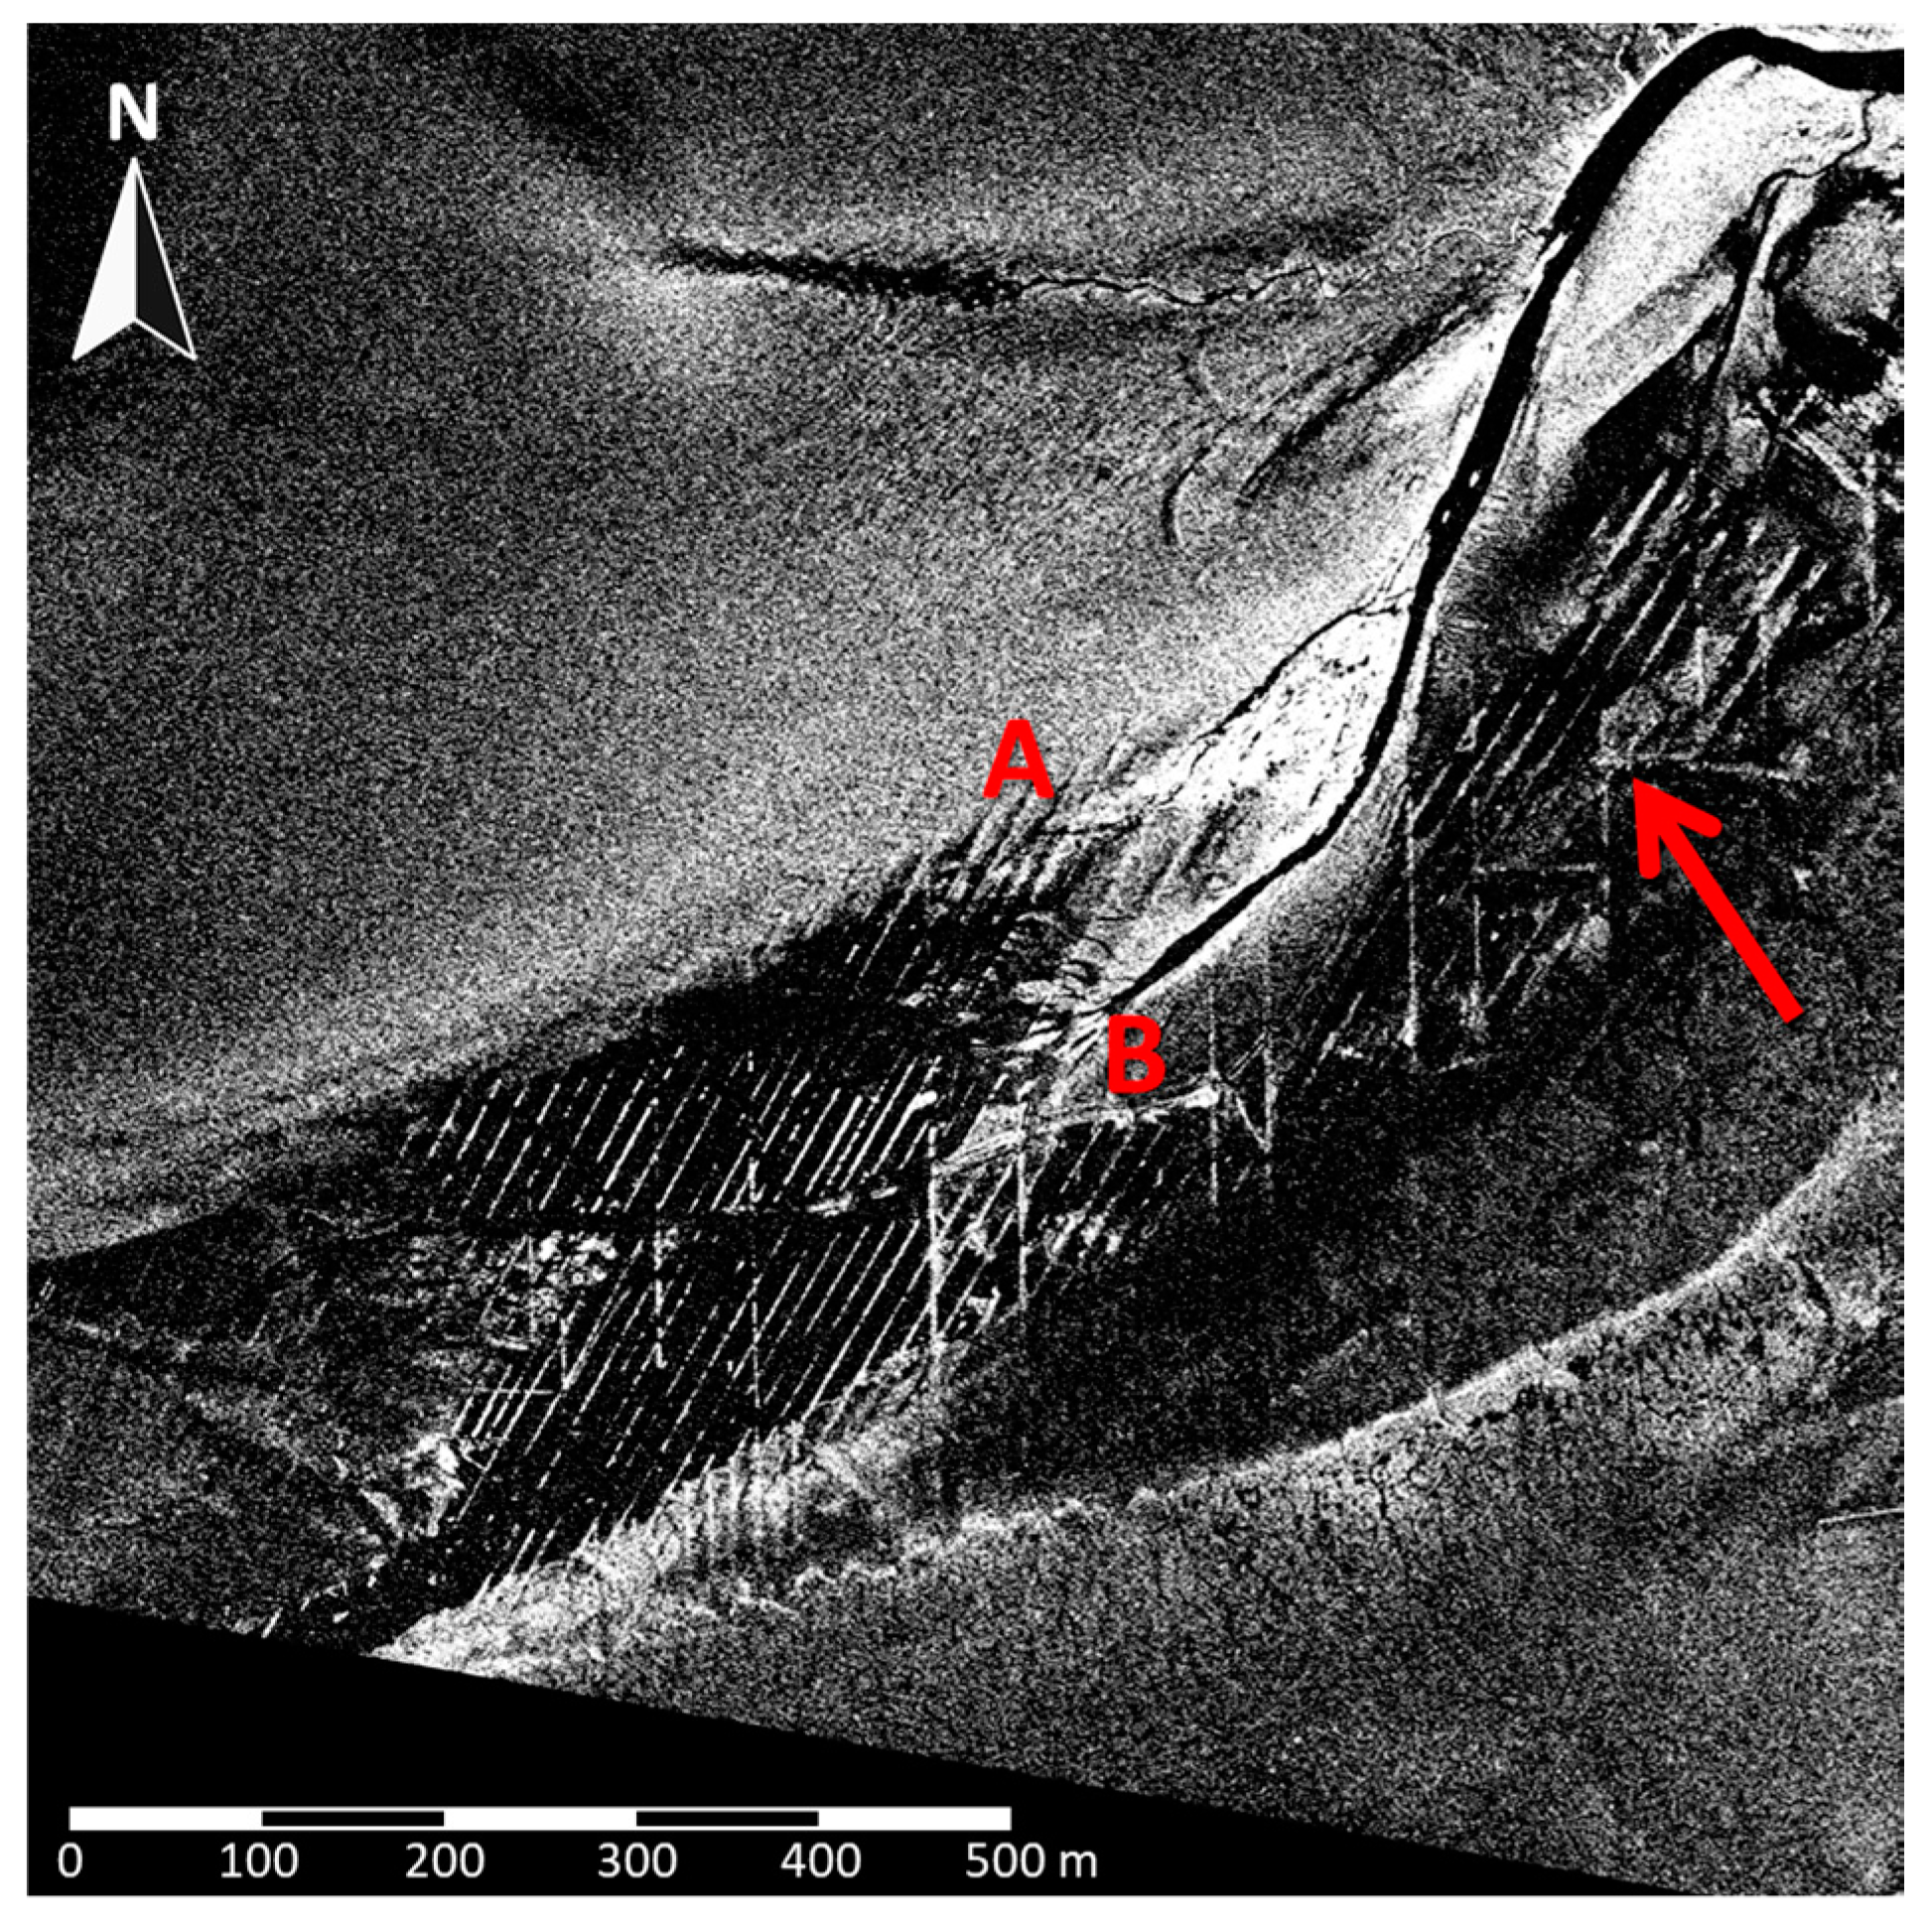
An example of very high resolution SAR imagery of the same site (corresponding to the lower right panel of Figure 9) is shown in Figure 11. Inserted is a red arrow that marks the location, at which the photographs of Figure 10 were taken. This small (1000 m × 1000 m) section of a TanDEM-X staring spotlight scene was acquired on 21 November 2014, at 05:42 UTC (low tide) and shows many bright and dark parallel lines all over the image center. The distance of those lines is between 10 m and 20 m, again, indicating that they are remains of a former mesh of draws and ditches built for the drainage of the farmland [18]. However, we also note that, once the exposed space in between is partly filled with sandy sediments, some of the lines may also appear dark (seen in the image center of Figure 11, below letter (A)).
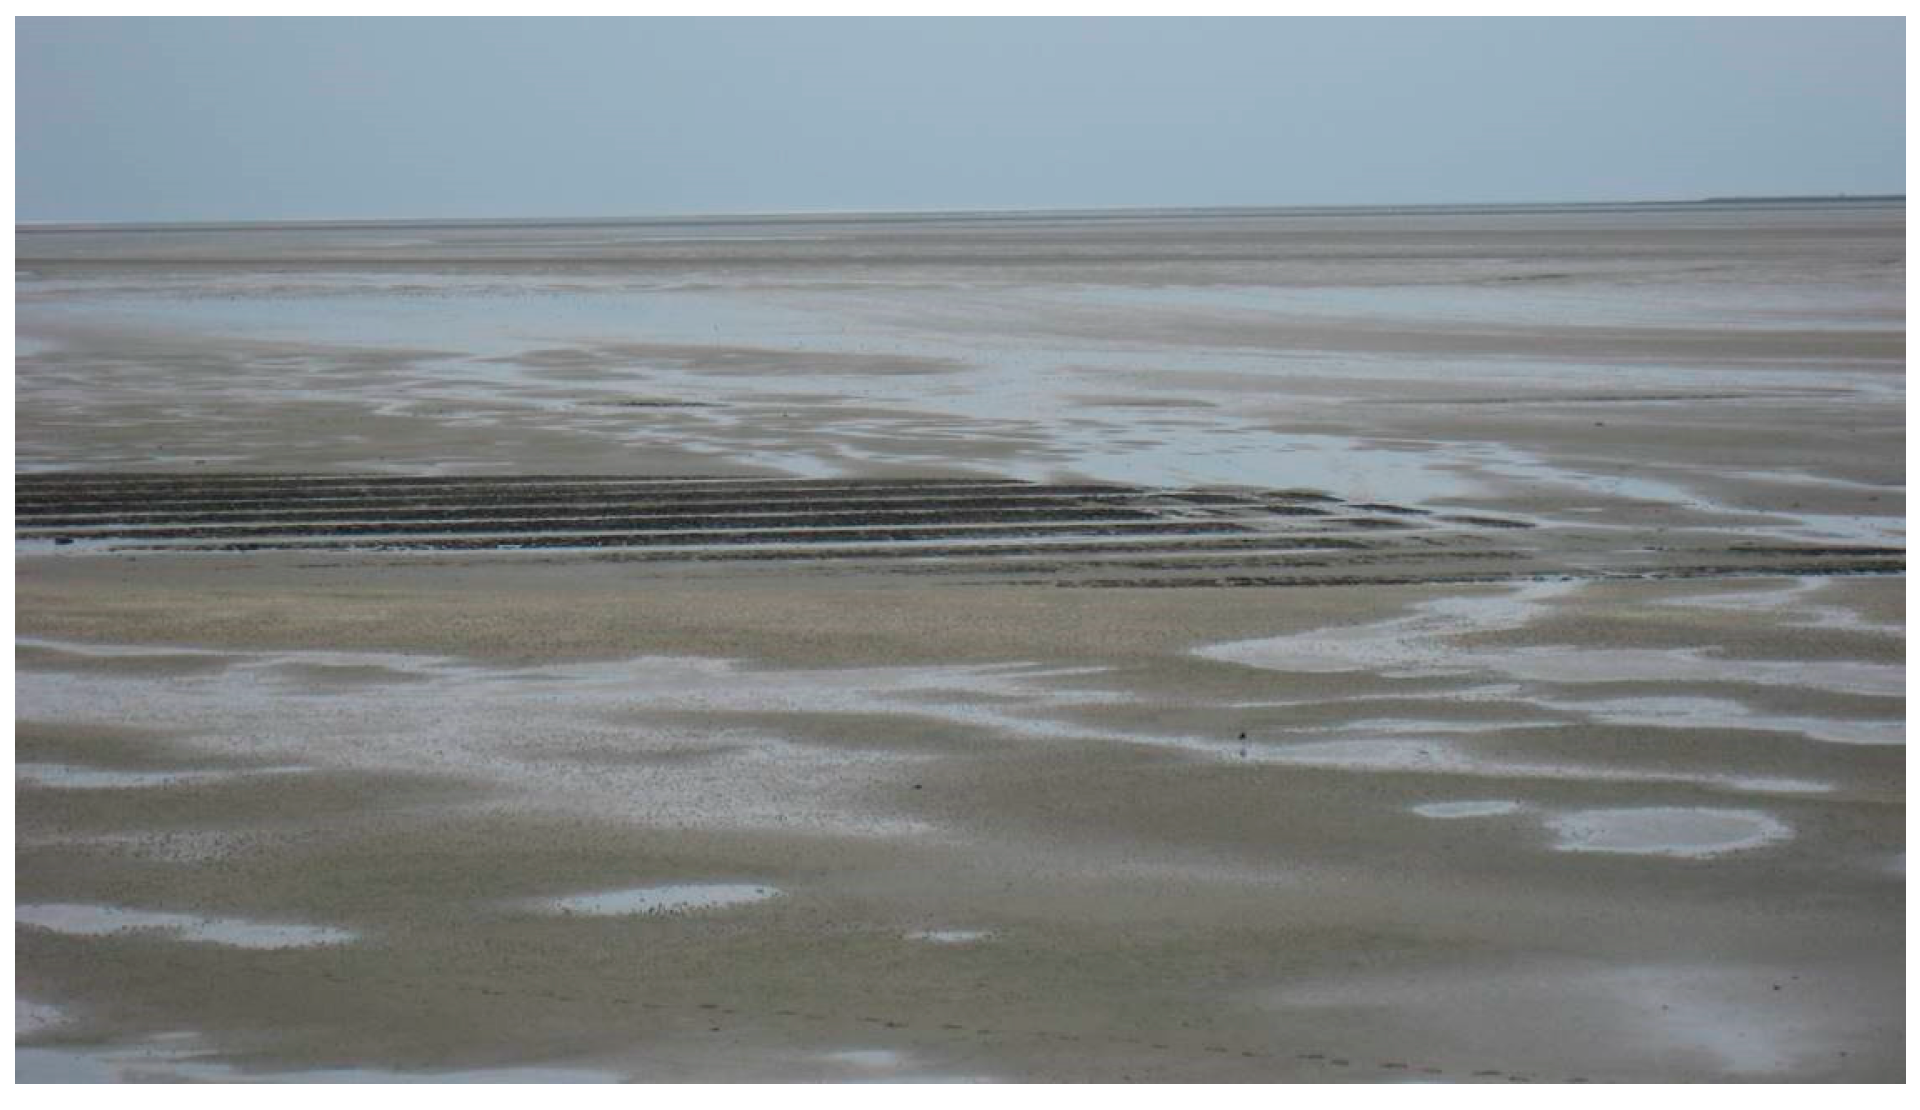
A part of the same area, north of the red arrow in Figure 11, is shown on the photograph in Figure 12 that was taken from a vantage point on Pellworm’s northern dike at low tide on 15 May 2009. During that time, easterly winds were driving the water out of the study area and caused very low water levels. Under such favorable environmental conditions the parallel features could be easily observed from land. We also note, however, that the prevailing westerly winds in that area, along with the greater distance of most of the remains from the coast, usually make such land-based observations very difficult.
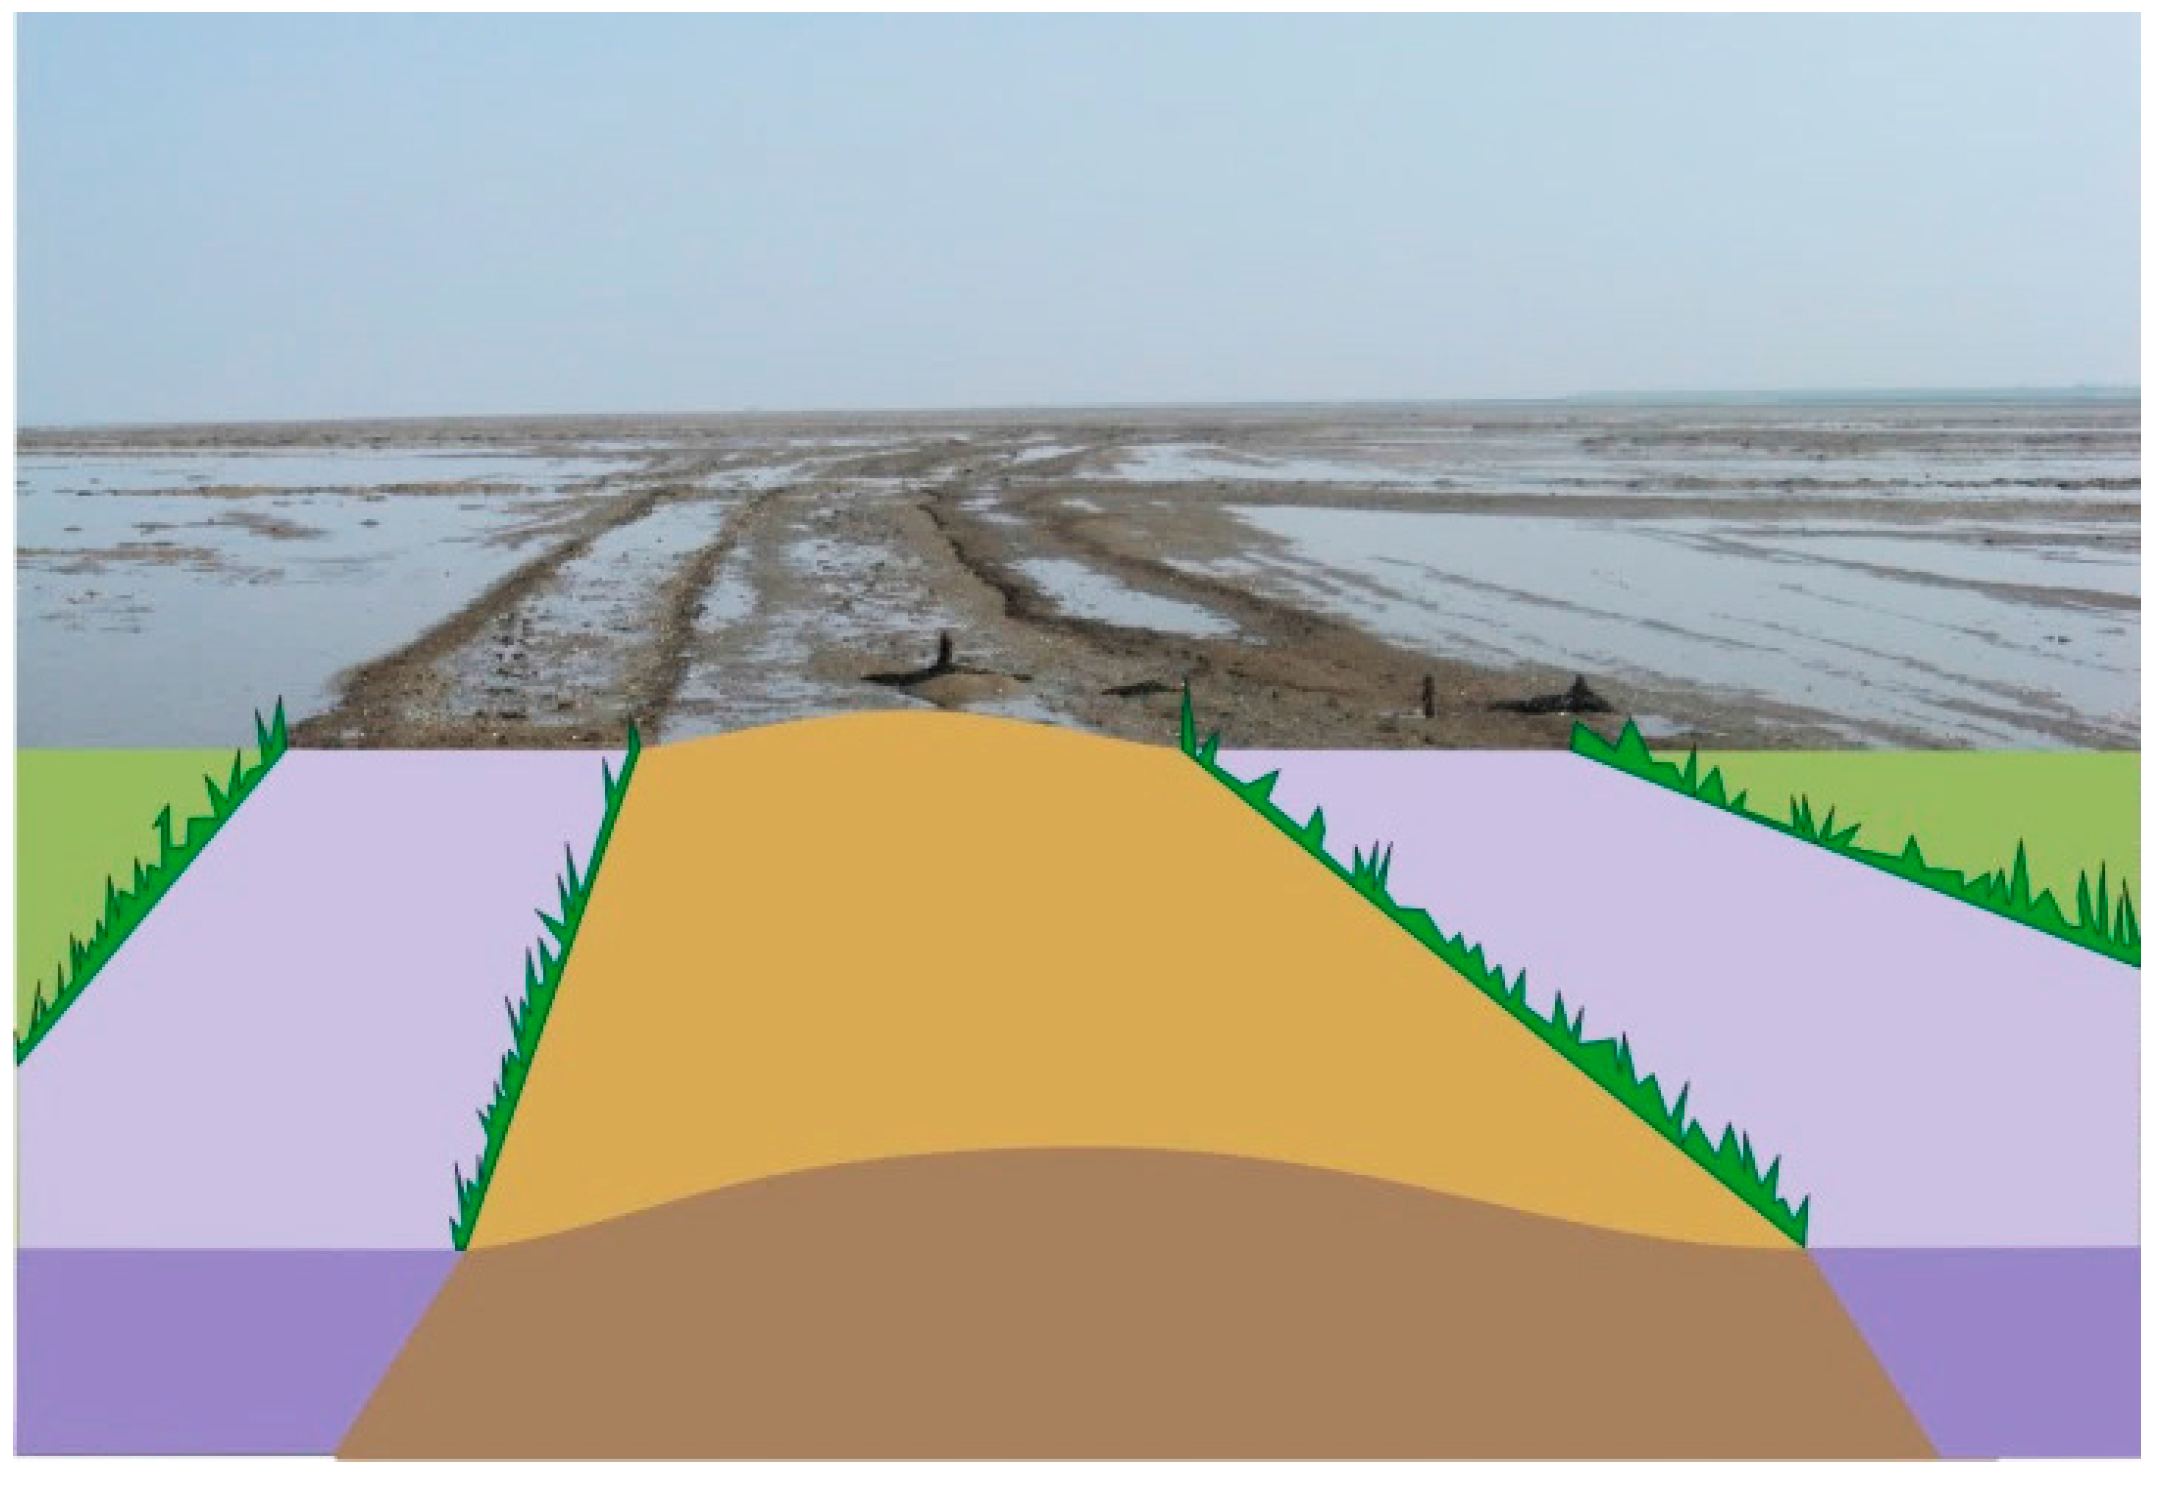
Figure 13 shows a reconstruction of a historical lane, with ditches on either sides, which can be found on the intertidal flats north of Pellworm and which may cause structures like those observed in the SAR imagery (below letter (B) in Figure 11). Residuals of fossil farmland structures, mostly of ditches, but also of lanes or dikes, cannot be observed through their relief of less than 10 cm height. Instead, it is the sediments on the lost pastures that are different from those in the linear structures of ditches. Typical Wadden sediments on the flat sand banks consist of marine fine sand, which had been the basic compound of the old marsh land and which is still a major part of the coastal environment on the German North Sea coast. In contrast, the surface of the fossil ditches is different: in their center pillow-like sediments can be found, while the ditch edges are often stabilized by fossil roots and other plant material connected with the sediment (Figure 10). This causes narrow ridges of only 10 cm to 30 cm width, which can still be found today and which show up on SAR imagery, if its spatial resolution is high enough.
4. Comparison with Existing Data
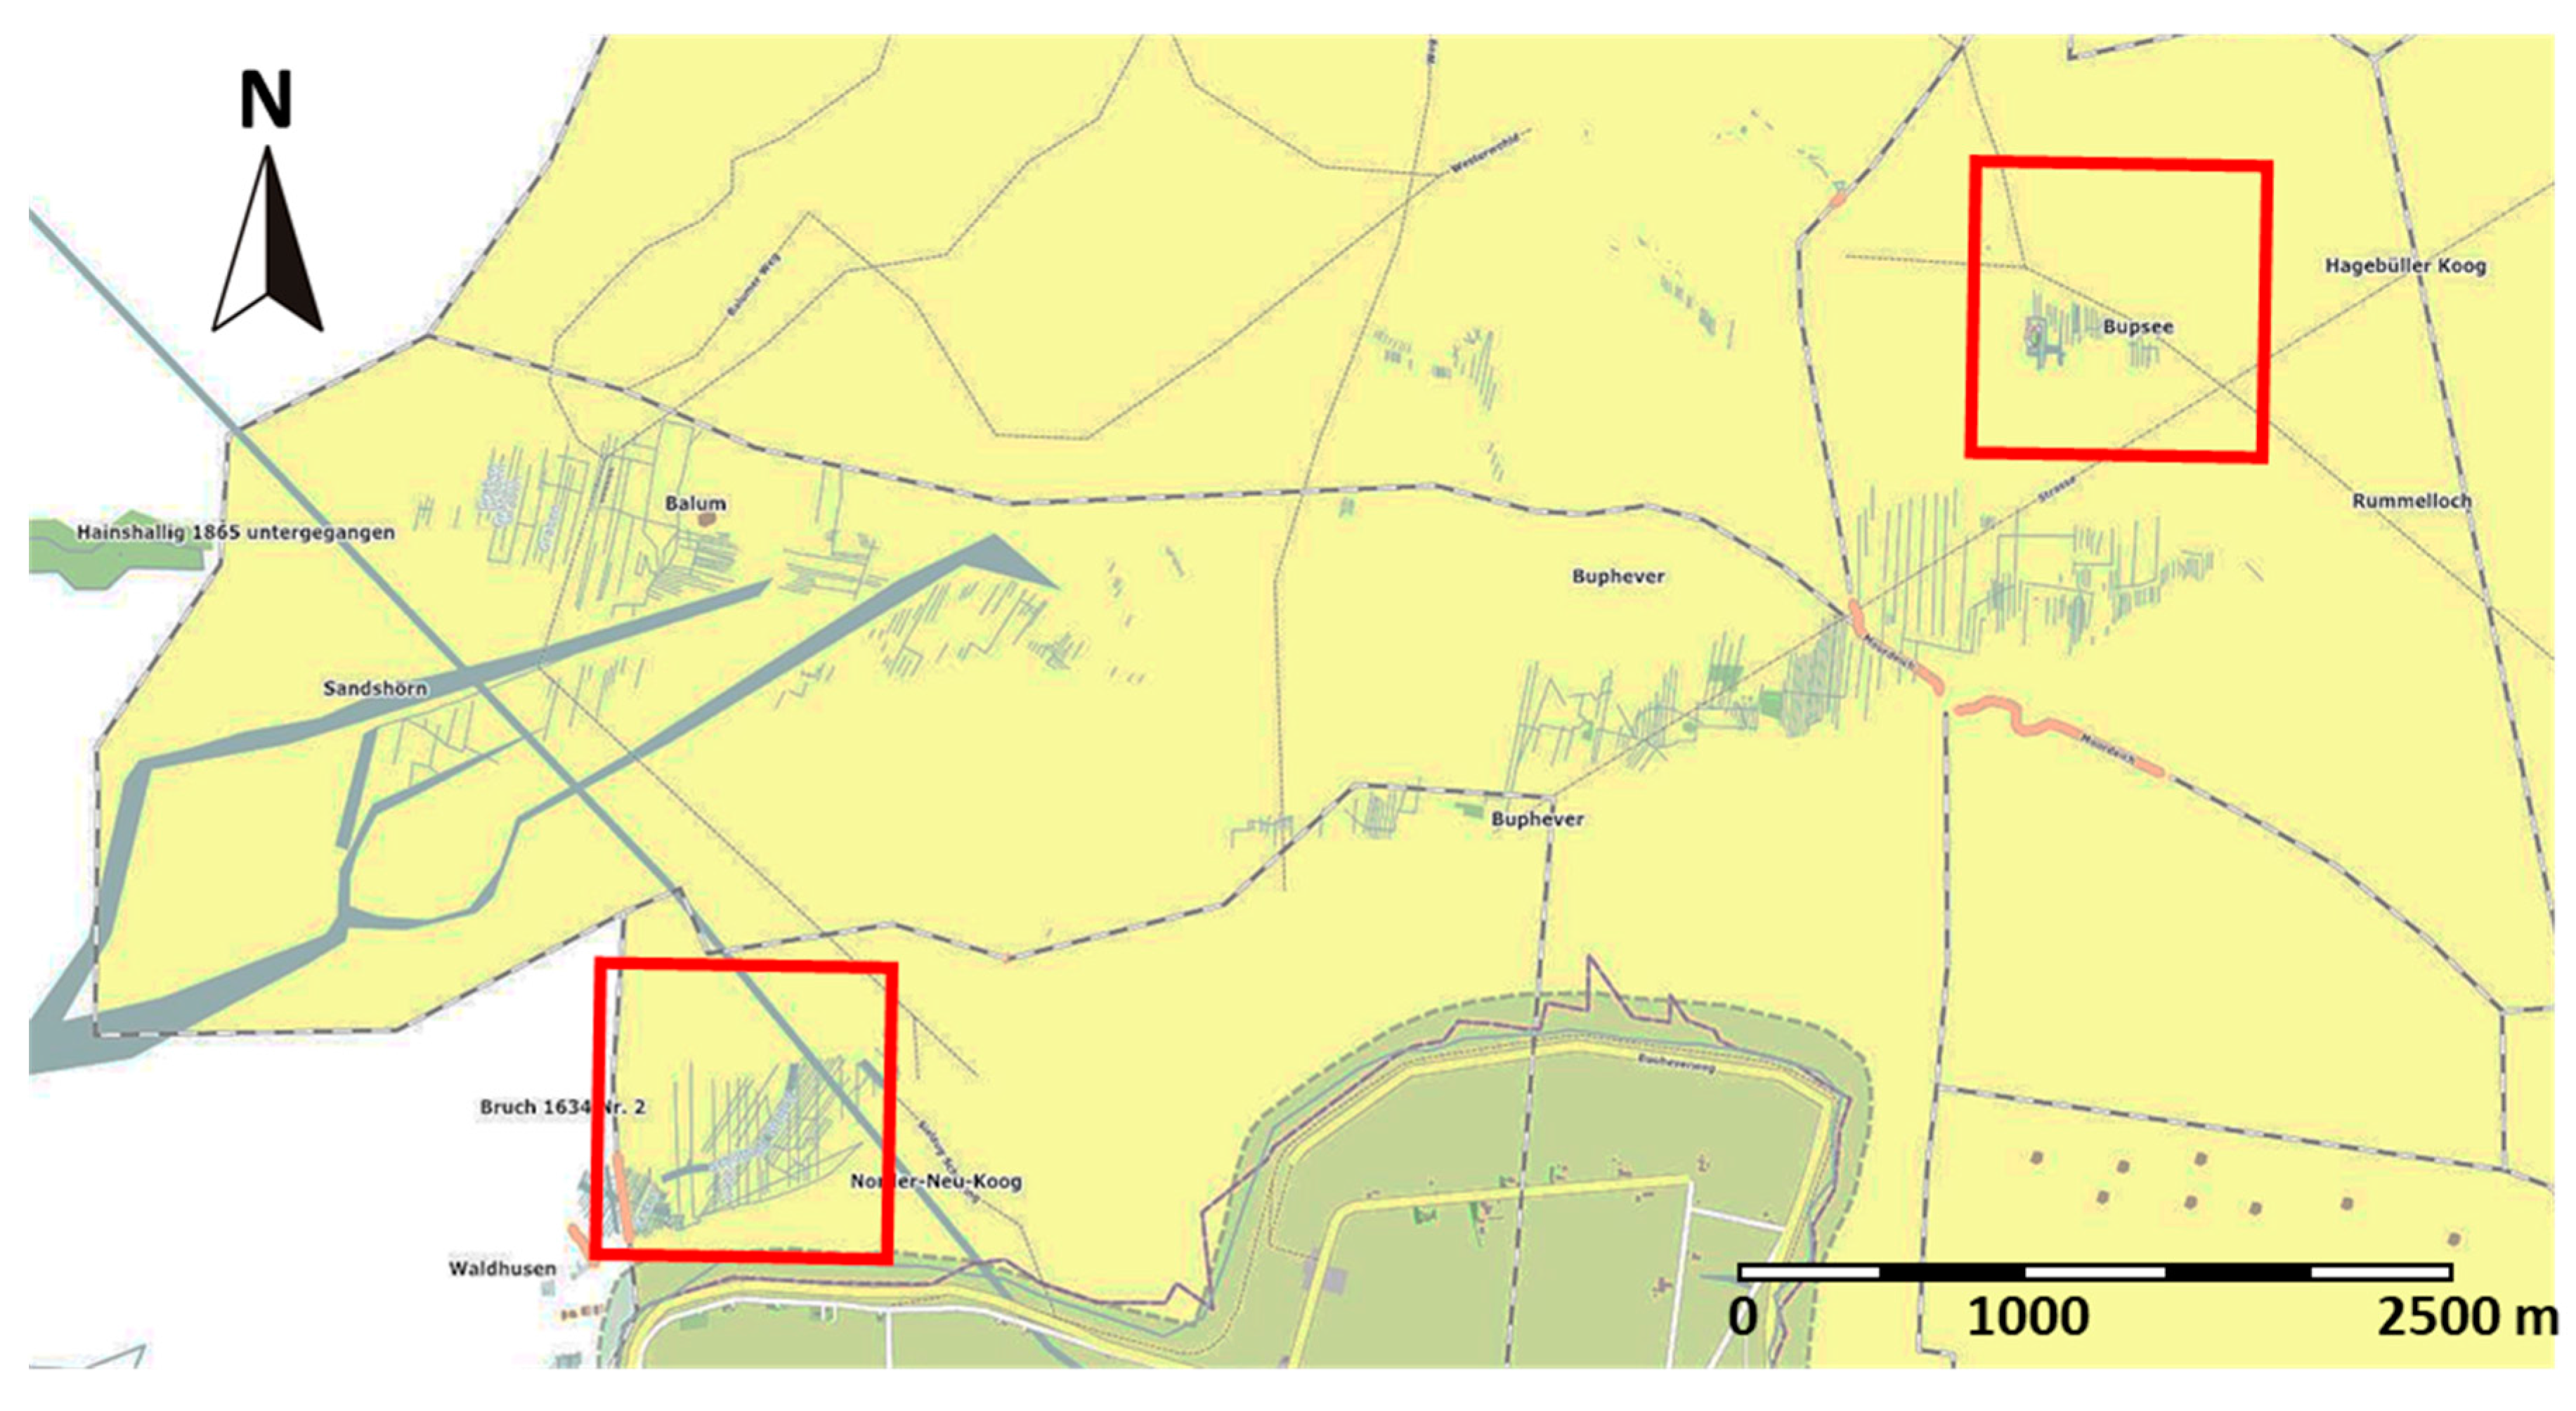
A detail of the map in Figure 4 is shown in Figure 14. Two red squares mark the areas investigated herein in greater detail, “Waldhusen” (lower left) and “Bupsee” (upper right), where remains of former ditches and lanes and of former settlements, respectively, have been found on SAR imagery.
In the area “Waldhusen” (lower left square) parallel linear features on the map correspond well with the SAR observations; however, new features were found in the area “Bupsee” (upper right square). Here, more vertical lines (i.e., north-southerly oriented structures) were found on the SAR images (Figure 8) than known before [18]. This is a clear indication that SAR imagery can be used to update und to improve maps of remains of historical land use.
We also note, however, that the SAR did not capture all features that are included in the map: the extent of the linear features on the SAR imagery shown in Figure 9 is smaller than in the lower left square on the map. Again, this proves the strong morphodynamic changes in that area, which may lead to an appearance, but also to a disappearance, of exposed cultural traces.
5. Conclusions
We have demonstrated that high-resolution SAR imagery can be used to complement archaeological surveys on intertidal flats on the German North Sea coast. The new high-resolution TerraSAR-X acquisition mode (“staring spotlight”) allows detecting various kinds of remains of historical land use, some of which have been unknown so far. Signatures of remains of both former settlements and former systems of ditches and of peat cutting, dating back to periods before major storm surges in the 14th and 17th centuries, can be found on high-resolution TerraSAR/TanDEM-X images. In this respect, best results were obtained (i.e., strongest and clearest signatures were found) when SAR images acquired in the new “staring spotlight” mode were used, with pixel sizes on the order of 0.1 m2.
In many cases the observed signatures of former ditches are due to different sediment types, which in turn are due to the actual ditch morphology. The presence of fossil roots and other organic material results in denser and harder sediments, which may be directly sensed by space-borne SAR, or which may cause additional sedimentation (i.e., a deposition of sandy sediments) that can be seen on SAR imagery. We also note that different sediments may cause different biological productivity, and are therefore often marked by benthic organisms causing different surface roughness patterns. Also, bivalves tend to settle on those sediments, thereby causing higher surface roughness sensed by the SAR.
SAR sensors are advantageous over optical sensors, because their use is independent of daylight and weather conditions. This is a particular advantage for the studies presented herein, since data acquisitions of the study area always have to be made at low water levels. Moreover, acquisitions made by spaceborne SAR sensors allow a frequent surveillance of the study areas, which is required in a strongly morphodynamic environment.
Further research will see thorough analyses of more SAR imagery of the area of interest, but also of other locations further north (close to the island of Langeneß), where more cultural traces were reported before. Automated detection of those remains that manifest in linear structures on SAR imagery seems possible through an application of Fourier and Principal Component Analyses as well as Hough Transformations, but only if the image resolution is high enough.
Acknowledgments
Parts of this research received funding from the German Ministry of Economy (BMWi) under contract 50 EE 0817, RS2 and TSX data were provided by the Canadian Space Agency (CSA) under contract 5077 and by the German Aerospace Center (DLR) under contract COA0118, respectively. RADARSAT is an official mark of the Canadian Space Agency.
Author Contributions
Martin Gade designed and performed all SAR image analyses and wrote most parts of the text. Jörn Kohlus initiated this research and provided a-priori knowledge about the site and cultural traces. Cornelia Kost provided knowledge about all known cultural traces in the study area. All authors participated in the data interpretation and in the final text editing.
Conflicts of Interest
The authors declare no conflict of interest. The funding sponsors had no role in the design of the study; in the collection, analyses, or interpretation of data; in the writing of the manuscript, and in the decision to publish the results.
References
- Behre, K.-H. Landschaftsgeschichte Norddeutschlands: Umwelt und Siedlung von der Steinzeit bis zur Gegenwart; Wachholtz: Neumünster, Germany, 2009; p. 308. [Google Scholar]
- Meier, D. Landschaftsentwicklung und historische Nutzung der Nordseeküste. In Warnsignale aus Nordsee & Wattenmeer. Eine Aktuelle Umweltbilanz; Lozán, J.L., Rachor, E., Reise, K., Sündermann, J., Westernhagen, V., Eds.; Wissenschaftliche Auswertungen: Hamburg, Germany, 2002; pp. 161–166. [Google Scholar]
- Bantelmann, A. Die Landschaftsentwicklung an der schleswig-holsteinischen Westküste, dargestellt am Beispiel Nordfriesland. Die Küste 1966, 14, 1–182. [Google Scholar]
- Gade, M.; Kohlus, J.; Mertens, C. Archaeological Surveys on the German North Sea Coast Using High-Resolution Synthetic Aperture Radar Data. In Proceedings of the 37th ISRSE Symposium, Tshwane, South Africa, 8–12 May 2017. [Google Scholar]
- Gade, M.; Kohlus, J. SAR Imaging of Archaeological Sites on Dry-Fallen Intertidal Flats in the German Wadden Sea. In Proceedings of the 2015 International Geoscience and Remote Sensing Symposium (IGARSS), Milan, Italy, 26–31 July 2015. [Google Scholar]
- Gade, M.; Melchionna, S.; Stelzer, K.; Kohlus, J. Multi-Frequency SAR Data Help Improving the Monitoring of Intertidal Flats on the German North Sea Coast. Estuar. Coast. Shelf Sci. 2014. [Google Scholar] [CrossRef]
- Gade, M.; Kohlus, J. After the Great Floods: SAR-Driven Archaeology on Exposed Intertidal Flats. In Proceedings of the ESA Living Planet Symposium 2016, Prague, Czech Republic, 9–13 May 2016. [Google Scholar]
- Lasaponare, R.; Masini, N. Satellite Synthetic Aperture Radar in Archaeology and Cultural landscape: An Overview. Archaeol. Prospect. 2013, 20, 71–78. [Google Scholar] [CrossRef]
- Chen, F.; Lasaponara, R.; Masini, N. An overview of satellite synthetic aperture radar remote sensing in archaeology: From site detection to monitoring. J. Cult. Herit. 2017, 23, 5–11. [Google Scholar] [CrossRef]
- Tapete, D.; Cigna, F. Trends and perspectives of space-borne SAR remote sensing for archaeological landscape and cultural heritage applications. J. Archaeol. Sci. Rep. 2016, 14, 716–726. [Google Scholar] [CrossRef]
- Chen, F.; Jiang, A.; Tang, P.; Yang, R.; Zhou, W.; Wang, H.; Lu, X.; Balz, T. Multi-scale synthetic aperture radar remote sensing for archaeological prospection in Han Hangu Pass, Xin’an, China. Remote Sens. Lett. 2017, 8, 38–47. [Google Scholar] [CrossRef]
- Stewart, C.; Lasaponara, R.; Schiavon, G. ALOS PALSAR Analysis of the Archaeological Site of Pelusium. Archaeol. Prospect. 2013, 20, 109–116. [Google Scholar] [CrossRef]
- Linck, R.; Busche, T.; Buckreuss, S.; Fassbinder, J.W.E.; Seren, S. Possibilities of Archaeological Prospection by High-Resolution X-band Satellite Radar—A Case Study from Syria. Archaeol. Prospect. 2013, 20, 97–108. [Google Scholar] [CrossRef]
- Moore, E.; Freeman, T.; Hensley, S. Spaceborne and Airborne Radar at Angkor: Introducing New Technology to the Ancient Site. In Remote Sensing in Archaeology. Interdisciplinary Contributions to Archaeology; Wiseman, J., El-Baz, F., Eds.; Springer: New York, NY, USA, 2006; pp. 185–216. [Google Scholar]
- Tapete, D.; Cigna, F.; Donoghue, N.M. ‘Looting marks’ in space-borne SAR imagery: Measuring rates of archaeological looting in Apamea (Syria) with TerraSAR-X Staring Spotlight. Remote Sens. Environ. 2016, 178, 42–58. [Google Scholar] [CrossRef]
- Balz, T.; Caspari, G.; Fu, B.; Liao, M. Discernibility of Burial Mounds in High-Resolution X-Band SAR images for Archaeological Prospections in the Altai Mountains. Remote Sens. 2016, 8, 817. [Google Scholar] [CrossRef]
- Müller, G.; Stelzer, K.; Smollich, S.; Gade, M.; Melchionna, S.; Kemme, L.; Geißler, J.; Millat, G.; Reimers, C.; Kohlus, J.; et al. Remotely sensing the German Wadden Sea—A new approach to address national and international environmental legislation. Environ. Monit. Assess. 2016, 188, 1–17. [Google Scholar] [CrossRef] [PubMed]
- Bantelmann, A. Die Landschaftsentwicklung an der schleswig-holsteinischen Westküste; Wachholtz: Neumünster, Germany, 1967; p. 97. [Google Scholar]
- Gade, M.; Alpers, W.; Melsheimer, C.; Tanck, G. Classification of sediments on exposed tidal flats in the German Bight using multi-frequency radar data. Remote Sens. Environ. 2008, 112, 1603–1613. [Google Scholar] [CrossRef]
- Lee, J.S. Digital Image Enhancement and Filtering by Use of Local Statistics. IEEE Trans. Pattern Anal. Mach. Intell. 1980, 2, 165–168. [Google Scholar] [CrossRef] [PubMed]
- Tapete, D.; Cigna, F.; Masini, N.; Lasaponara, R. Prospection and Monitoring of the Archaeological Heritage of Nasca, Peru, with ENVISAT ASAR. Archaeol. Prospect. 2013, 20, 133–147. [Google Scholar] [CrossRef]
- Dore, N.; Patruno, J.; Pottier, E.; Crespi, M. New Research in Polarimetric SAR Technique for Archaeological Purposes using ALOS PALSAR Data. Archaeol. Prospect. 2013, 20, 79–87. [Google Scholar] [CrossRef]
- Gade, M.; Wang, W.; Kemme, L. On the Imaging of Exposed Intertidal Flats by Dual-Polarization Synthetic Aperture Radar. Remote Sens. Environ. 2017. under review. [Google Scholar]
Figure 1.
Changes in the German North Sea coastline during the past 700 years (note the upper left part of each panel), after [1]. The left panel shows vast coastal wetlands that were lost after the first “Grote Mandrenke” in 1362. In the middle panel, the horseshoe-shaped island of Strand (white arrow) can be seen, whose major, central parts got lost after the second “Grote Mandrenke” in 1634.

Figure 2.
Area of interest on the German North Sea coast, north off Pellworm island, i.e., at the location of the former island of Strand. The red rectangle in the close-up on the upper left marks the location of the SAR image shown in Figure 3.
Figure 2.
Area of interest on the German North Sea coast, north off Pellworm island, i.e., at the location of the former island of Strand. The red rectangle in the close-up on the upper left marks the location of the SAR image shown in Figure 3.

Figure 3.
TerraSAR-X image of the area of interest, north of Pellworm and east of Hooge, acquired on 12 December 2012. The red squares denote two areas that were observed in greater detail. © DLR 2012.
Figure 3.
TerraSAR-X image of the area of interest, north of Pellworm and east of Hooge, acquired on 12 December 2012. The red squares denote two areas that were observed in greater detail. © DLR 2012.

Figure 4.
Map showing in yellow the former Island of Strand, and in green today’s islands Pellworm and Hooge. The mainland and Nordstrand are located on the right. Locations of residuals of former landuse, along with roads, dikes, and names of former settlements are also inserted. The blue arrows denote those main locations, at which the dikes broke in 1634, and the red rectangle denotes the locations of the SAR image shown in Figure 3. Map: C. Kost.

Figure 5.
Radarsat-2 (upper) and TerraSAR-X (lower) SAR images of the same (1.7 km × 1.3 km) spot, north off Pellworm, acquired on 28 October 2012. Parallel diagonal lines in the images’ centers are remains of historical ditches. Radarsat-2 data and products © MacDonald, Dettwiler and Associates Ltd. 2012—All Rights Reserved; TerraSAR-X data © DLR 2012.

Figure 6.
Examples of (1 km × 1 km) TerraSAR-X imagery of the area of interest marked by the right square in Figure 3. The red arrow in the lower left panel denotes cultural traces, whose imprints can be seen on some of the SAR images, and best on the ‘staring spotlight’ scene on the lower right. © DLR 2012, 2013, 2014.

Figure 7.
Aerial photograph of exposed intertidal flats north of Pellworm, taken in July 2009. Residuals of former settlements, close to a tidal creek (upper left), can be clearly seen. The arrows were included for easier comparison with the SAR images shown in Figure 8. Photograph: B. Hälterlein, LKN.

Figure 8.
Subsections (1000 m × 1000 m) of four TerraSAR-X/TanDEM-X staring spotlight scenes acquired on (upper left) 19 November 2014, (upper right) 20 January 2015, (lower left) 18 July 2016, and (lower right) 22 June 2017. The linear structures are cultural traces. The letter (A) is introduced for convenience (see text), the arrows are inserted for intercomparison with Figure 7. © DLR 2014, 2015.

Figure 9.
Examples of TerraSAR-X imagery of the area of interest marked by the left square in Figure 3. The red arrows mark several diagonal bright lines that can be identified on all SAR images, and that are due to traces of old drainage systems. They are best visible on the “staring spotlight” scene on the lower right. © DLR 2012, 2013, 2014.

Figure 10.
Two photographs of traces of historical ditches in the area of interest, taken at low tide during a field excursion in June 2017. The red arrows in both panels mark manifestations of the (former) ditches’ rims that can be seen on SAR imagery. Photographs: M. Gade.
Figure 10.
Two photographs of traces of historical ditches in the area of interest, taken at low tide during a field excursion in June 2017. The red arrows in both panels mark manifestations of the (former) ditches’ rims that can be seen on SAR imagery. Photographs: M. Gade.

Figure 11.
Subsection (1000 m × 1000 m) of a TanDEM-X staring-spotlight scene acquired on 21 November 2014, north of Pellworm Island. Letters (A) and (B) are described in the text. The photographs shown in Figure 10 were taken in the area marked by the red arrow. © DLR 2014.
Figure 11.
Subsection (1000 m × 1000 m) of a TanDEM-X staring-spotlight scene acquired on 21 November 2014, north of Pellworm Island. Letters (A) and (B) are described in the text. The photographs shown in Figure 10 were taken in the area marked by the red arrow. © DLR 2014.

Figure 12.
Photograph of the study area north of the red arrow in Figure 11. The picture was taken at low tide on 15 May 2009, when easterly winds caused a very low water level. Photograph: M. Gade.
Figure 12.
Photograph of the study area north of the red arrow in Figure 11. The picture was taken at low tide on 15 May 2009, when easterly winds caused a very low water level. Photograph: M. Gade.

Figure 13.
Reconstruction of a historical lane with ditches on either side. Photograph and sketch: J. Kohlus.
Figure 13.
Reconstruction of a historical lane with ditches on either side. Photograph and sketch: J. Kohlus.

Figure 14.
Detail of the map shown in Figure 4. Two red squares denote the locations of the SAR images shown in Figure 6 and in Figure 9, respectively. Map: C. Kost.


Table 1.
SAR data used in the present study.
| Sensor | Date/Time | Low Tide | Mode 1 | Pixel Size |
|---|---|---|---|---|
| TerraSAR-X | 16 June 2012, 17:10 UTC | 16:47 UTC | Spotlight | 1.00 m × 1.00 m |
| TerraSAR-X | 30 July 2012, 17:10 UTC | 16:04 UTC | Hires SL | 1.00 m × 1.00 m |
| TerraSAR-X | 15 August 2012, 17:19 UTC | 17:29 UTC | Hires SL | 1.00 m × 1.00 m |
| Radarsat-2 | 28 October 2012, 05:44 UTC | 05:39 UTC | Ultra Fine | 1.00 m × 1.00 m |
| TerraSAR-X | 28 October 2012, 05:50 UTC | 05:39 UTC | Spotlight | 1.00 m × 1.00 m |
| TerraSAR-X | 25 November 2012, 05:42 UTC | 04:13 UTC | Hires SL | 0.75 m × 0.75 m |
| TerraSAR-X | 11 December 2012, 05:50 UTC | 04:09 UTC | Hires SL | 0.75 m × 0.75 m |
| TerraSAR-X | 12 December 2012, 05:33 UTC | 05:15 UTC | Hires SL | 0.50 m × 0.50 m |
| TanDEM-X | 25 December 2012, 17:19 UTC | 16:48 UTC | Hires SL | 0.50 m × 0.50 m |
| TanDEM-X | 25 April 2013, 17:19 UTC | 18:42 UTC | Hires SL | 1.00 m × 1.00 m |
| TanDEM-X | 6 May 2013, 17:19 UTC | 16:22 UTC | Hires SL | 1.00 m × 1.00 m |
| TerraSAR-X | 7 May 2013, 17:02 UTC | 17:15 UTC | Hires SL | 1.00 m × 1.00 m |
| TerraSAR-X | 25 May 2013, 05:50 UTC | 06:38 UTC | Hires SL | 1.00 m × 1.00 m |
| TanDEM -X | 4 October 2013, 05:50 UTC | 06:14 UTC | Hires SL | 1.00 m × 1.00 m |
| TanDEM -X | 19 November 2014, 17:02 UTC | 16:35 UTC | Staring SL | 0.26 m × 0.26 m |
| TanDEM -X | 21 November 2014, 05:42 UTC | 05:42 UTC | Staring SL | 0.22 m × 0.22 m |
| TanDEM -X | 20 January 2015, 05:51 UTC | 06:27 UTC | Staring SL | 0.28 m × 0.28 m |
| TerraSAR-X | 18 July 2016, 05:42 UTC | 05:32 UTC | Staring SL | 0.22 m × 0.22 m |
| TerraSAR-X | 22 June 2017, 17:02 UTC | 17:13 UTC | Staring SL | 0.26 m × 0.26 m |
1 Hires SL = High Resolution Spotlight; Staring SL = Staring Spotlight.
© 2017 by the authors. Licensee MDPI, Basel, Switzerland. This article is an open access article distributed under the terms and conditions of the Creative Commons Attribution (CC BY) license (http://creativecommons.org/licenses/by/4.0/).
Share and Cite
MDPI and ACS Style
Gade, M.; Kohlus, J.; Kost, C. SAR Imaging of Archaeological Sites on Intertidal Flats in the German Wadden Sea. Geosciences 2017, 7, 105. https://doi.org/10.3390/geosciences7040105
AMA Style
Gade M, Kohlus J, Kost C. SAR Imaging of Archaeological Sites on Intertidal Flats in the German Wadden Sea. Geosciences. 2017; 7(4):105. https://doi.org/10.3390/geosciences7040105
Chicago/Turabian StyleGade, Martin, Jörn Kohlus, and Cornelia Kost. 2017. "SAR Imaging of Archaeological Sites on Intertidal Flats in the German Wadden Sea" Geosciences 7, no. 4: 105. https://doi.org/10.3390/geosciences7040105
Note that from the first issue of 2016, this journal uses article numbers instead of page numbers. See further details here.