Mapping the Causes of Forest Fires in Portugal by Clustering Analysis


1
ISEP-School of Engineering, Polytechnic of Porto and CERENA-Centre for Natural Resources and the Environment, 4200-072 Porto, Portugal
2
FLUC-Department of Geography and Tourism, RISCOS and CEGOT-Centre of Studies in Geography and Spatial Planning, 3004-530 Coimbra, Portugal
3
ISEP-School of Engineering, Polytechnic of Porto, 4200-072 Porto, Portugal
*
Author to whom correspondence should be addressed.
Geosciences 2020, 10(2), 53; https://doi.org/10.3390/geosciences10020053
Submission received: 9 December 2019
/
Revised: 21 January 2020
/
Accepted: 26 January 2020
/
Published: 29 January 2020
(This article belongs to the Special Issue Wildfires Hazards)
Abstract
:This paper presents a spatial characterization of the distribution at district level of the forest fire events that occurred in mainland Portugal between 1996 and 2015 and whose causes were investigated. We further examine the breakdown of the causes of these forest fires over this period. Results supported by relevant validated statistics show that of the total fire events recorded, 94.4% were identified as an effective occurrence, of which 22.2% had burned an area greater than 1 ha, and of these only 42.1% were investigated. False alarms or fires without a recorded burning area are more significant in the districts of Aveiro, Lisbon and Porto, the biggest municipalities. Of the fires whose causes were investigated, the largest number of recorded events were in NE regions (49.0%), followed by NW regions (41.7%), and finally in the rest of the country (9.3%). Taking into account the ratio between the investigated fires and the total number of fires and the behavior profile produced for cluster analysis, a different panorama is brought to light, with the center and south regions showing greater effort to investigate the fires. A thorough analysis of the causes and motivations of the ignition of these forest fire occurrences showed that human activity, either deliberate (20.4%) or negligent (29.9%), outweigh natural phenomena (0.6%). Reactivations (14.6%) and Unknown (34.5%) causes decreased as time passed, whereas negligent and deliberate causes increased. However, these results could change if the percentage of unknown information in relation to the origin of the forest fires is considerable. The outcome of this research will support an efficient management related to fire mitigation and suppression including establishing preventive actions to reduce the occurrence of forest fires and emphasize the need to improve the procedure for recording forest fire events in Portugal, especially in relation to identifying their cause.
1. Introduction
Fire is one of the major drivers of ecosystem dynamics in European Mediterranean landscapes, as it has affected soil and vegetation composition for millennia [1,2]. A wide range of factors have been indicated as likely to encourage fire ignition. Several scientific papers have been published in recent years that support the strong relationship between the incidence of forest fires and climatic and meteorological features in European countries (e.g., [3,4,5,6]), while other studies report that the causes of forest fire ignitions are mainly anthropogenic (e.g., [5,7,8,9,10,11]). The human factors that are commonly linked to fire ignition are the forest-agricultural or forest-urban interface constraints related to land use management, social conflicts arising from unemployment, rural poverty, hunting disputes or simply from the inappropriate use of the fire recreation activities. These anthropogenic sources of fire ignition are also known to be related to fire persistence and seasonality, while fire density patterns are associated with variables of specific climates and vegetation cover [12].
Conversely, natural ignitions in the European Mediterranean basin, such as lightning, are common in regions where the atmospheric conditions feature low humidity and little or no precipitation. In mainland Portugal, these natural wildfires are more prone to occur during the summer, when temperatures are high and relative air humidity is low. The summer follows a rainy period with lower temperatures that lasts from October to May, and which promotes the availability of a large amount of biomass fuel that can be burned each year [13,14,15]. These meteorological conditions, in conjunction with strong winds, significantly increase the tendency for natural forest wildfires to occur [16].
However, fire occurrence in Portuguese forests only developed in what was considered a natural manner until the beginning of the industrial revolution, in the nineteenth century. From this point, the traditional use of fire in Portuguese forests was changing mainly due to increasing mechanization in agriculture and changes in people’s daily life and its organization [17]. Also, the period from the 1950s to the 1970s was remarkable regarding the change of the fire regime in Portuguese forests. This was essentially due to modifications in the Portuguese socio-economic matrix and the composition of the population, as well to people’s lifestyle at a time which saw a significant exodus of the rural population to urban and/or industrial areas, either inland or abroad, in the search of better living conditions. As a result of these phenomena, the traditional use of the Portuguese territory was changing in a way that led to the progressive abandonment of large swathes of agricultural areas, which gradually gave way to forest and large areas of scrubland [10,18,19]. Under these conditions, livestock grazing also slowed significantly and the scrubland that was once cleared to provide bedding for the cattle and the wood once used for cooking and for heating homes were left to accumulate in the forest [20]. This movement whereby rural areas were abandoned gained strength during the present century, largely due to the major economic crisis that this country has been undergoing [21]. This modified socio-economic pattern has also led to changes in the traditional causes of fire ignition in recent decades, whose origin have predominantly become anthropogenic instead of natural, not only in Portugal but in other European Mediterranean countries, too [10,11,22,23,24,25].
According to the European Commission [26], the yearly number of forest fire occurrences tended to increase in the five southern Member States (Portugal, Spain, France, Italy, and Greece) between the 1980s and the 1990s. This increase was mainly due to improved recording procedures. This trend remained stable for around ten years and then reversed to become a decrease in the 2000s. In this period, Portugal was identified as the country with the greatest number of fires (42% of the total occurrences recorded), affecting forest cover that mainly consisted of shrubland, Pinus pinaster, and Eucalyptus globulus plantations, species that burn more easily than the native Quercus faginea and Quercus suber.
Human activity and behaviors were identified as the causes of the majority of Portuguese forest fire ignitions that occurred in the last three decades, whether by deliberate actions, negligence, accident or carelessness [10,11,23]. Despite its importance, knowledge of the human causes, i.e., the reasons for forest fires, is still very limited [11,24,27], although it is widely recognized that they can vary considerably. Thus, most of the published research rarely mentions the human activity component in terms of human behavior such as incendiarism and the negligent use of fire. These findings reinforce the need to include regional information in the analysis of the causes of fires. A good knowledge of the causes of forest fires, the relevant motives and the spatial-temporal distribution of fires is therefore crucial to devising prevention policies suited to the socio-economic, cultural and environmental circumstances of each region [28,29]. Accurate information on the causes of fire would help produce reliable predictions of the number of fires and where, when and why they are expected to occur [30].
The aim of this paper is thus to describe the spatial distribution of the number of forest fires whose causes were investigated (TIF) that occurred in mainland Portugal in the last twenty years, between 1996 and 2015, at the district level. In addition, spatial patterns of the causes of TIF are identified and how they are related within the most critical districts.
2. Materials and Methods
2.1. Study Area
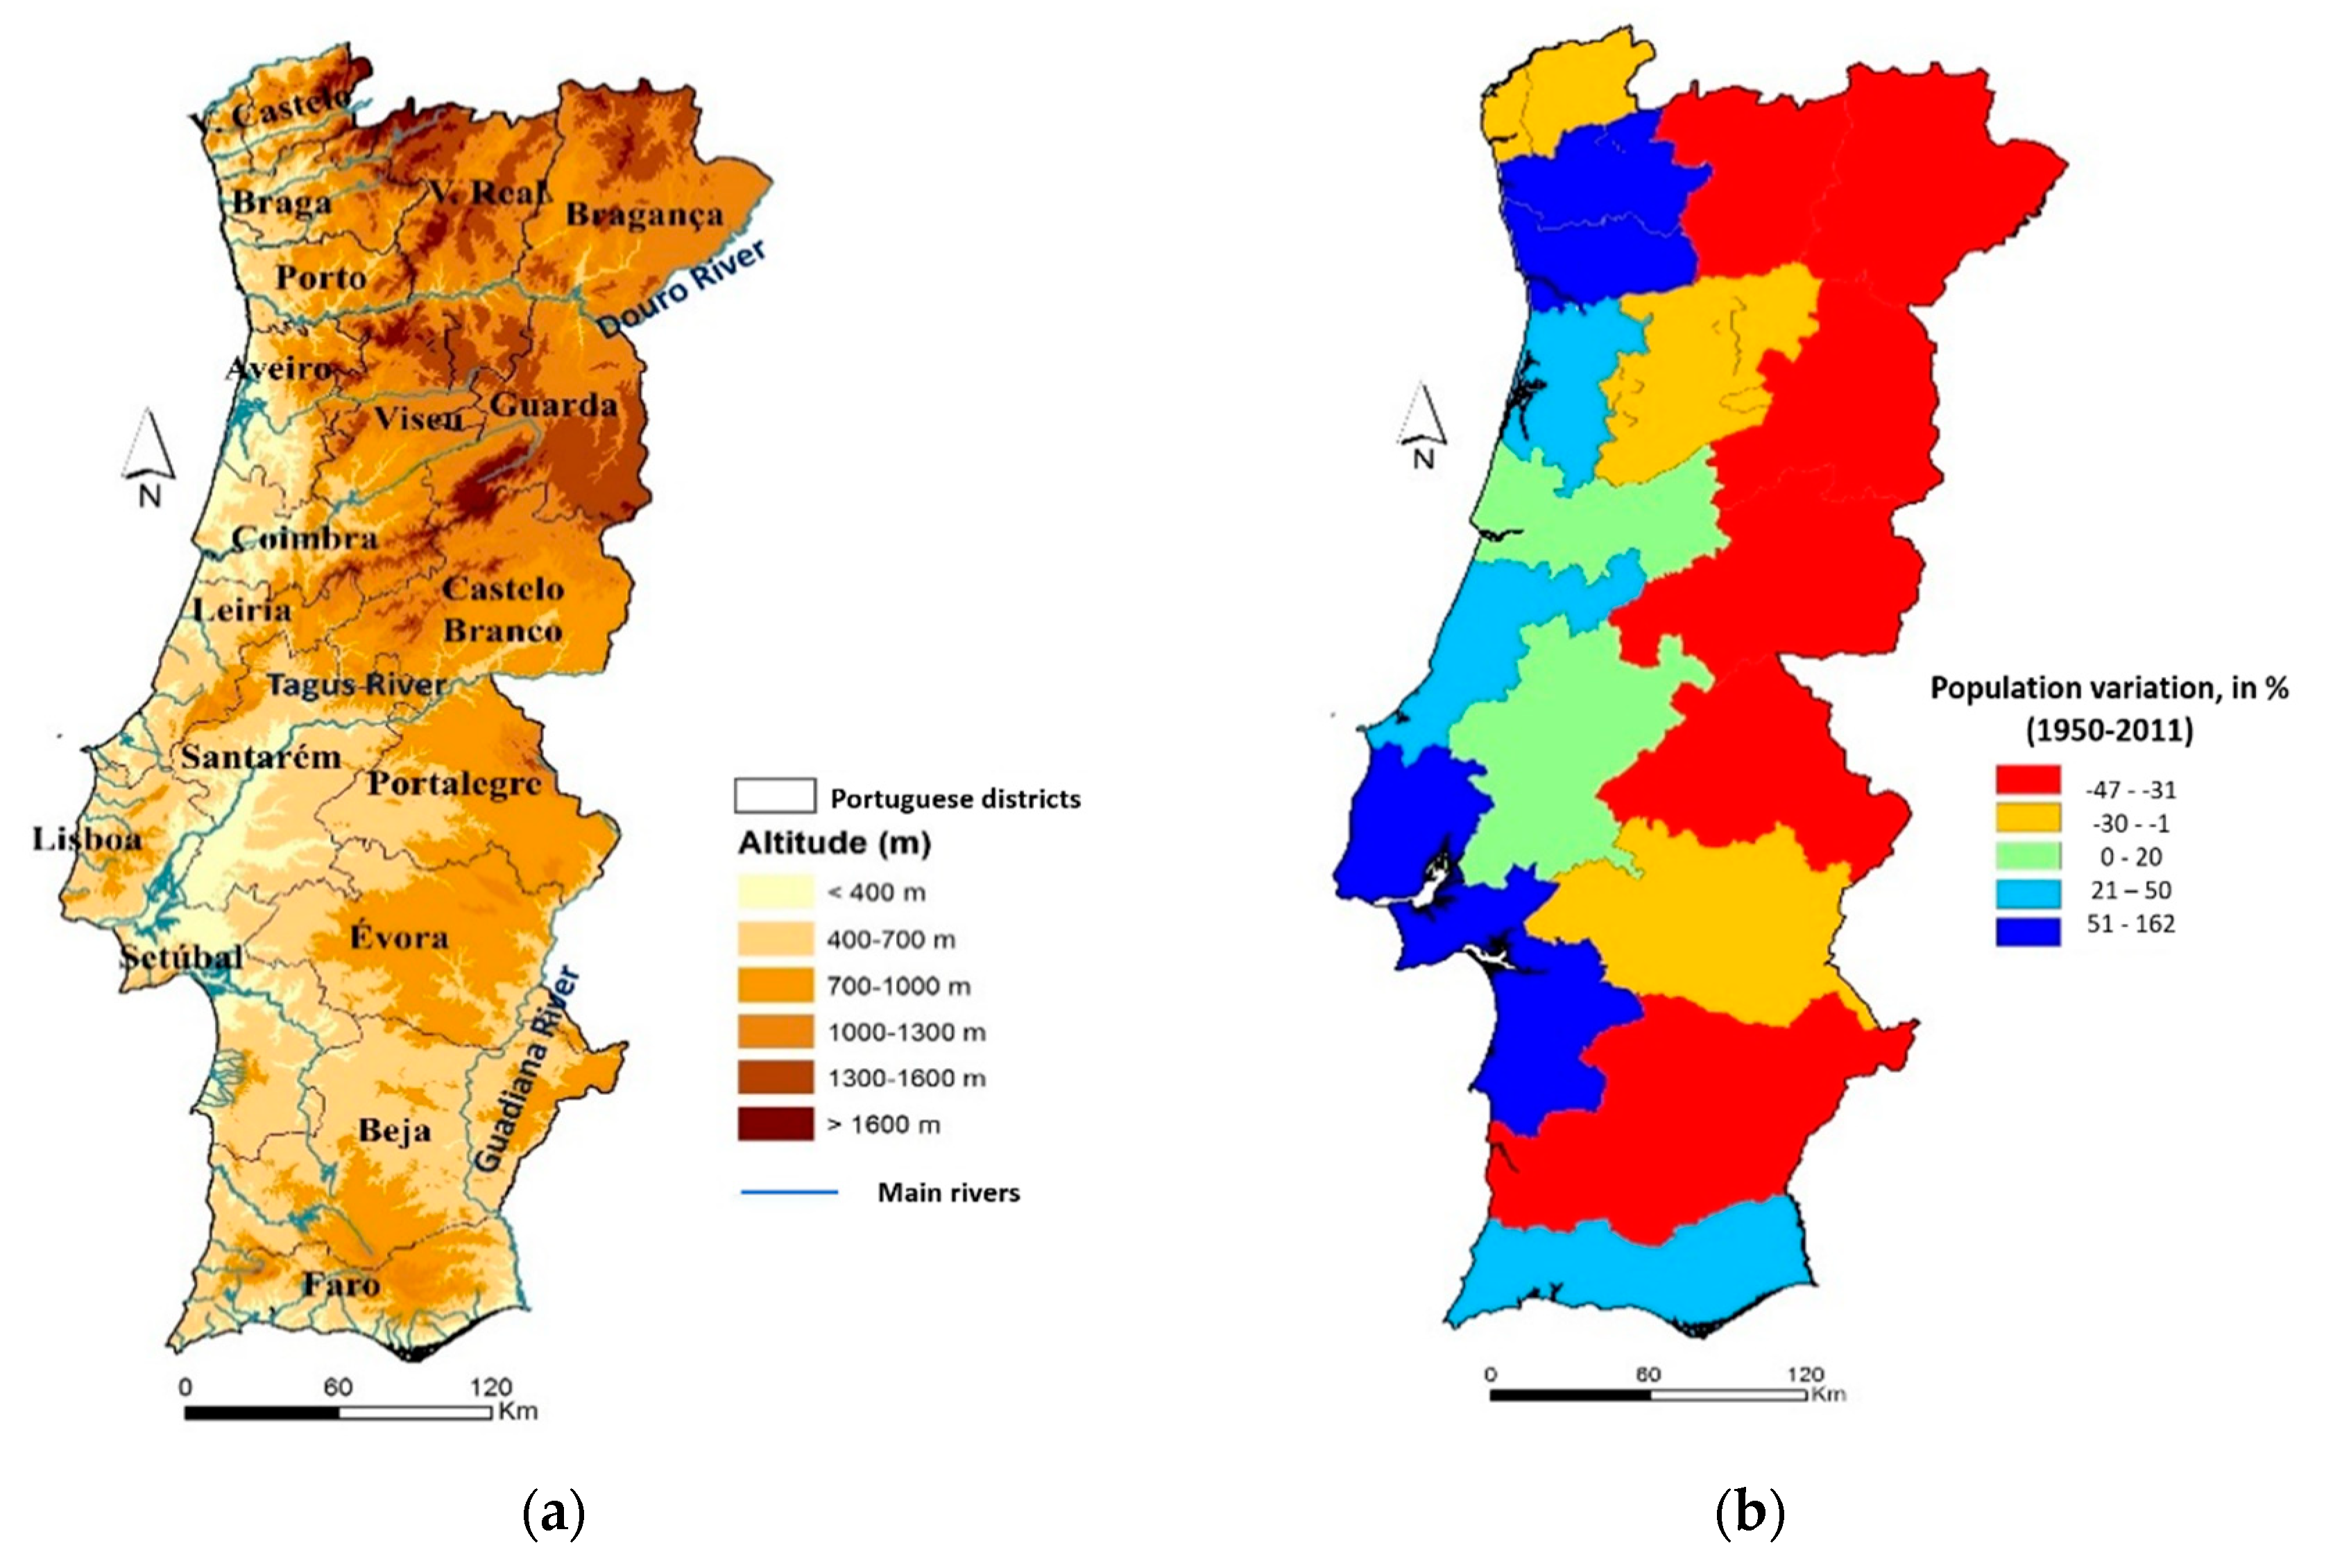
The Portuguese mainland is organized into 18 districts, covering in total about 90,000 km2. It lies between 37° N and 42° N latitude and between 6° W and 10° W longitude on the Iberian Peninsula in the extreme southwest of continental Europe. Despite its modest land area, the physical environment varies significantly from north to south (Figure 1).
This variation is largely explained by the different physiographic characteristics; most of the country’s mountains lie north of the River Tagus, where the landscape is more rugged and the slopes are steeper and intersected by deep valleys [18]. The southern part of mainland Portugal is mainly characterized by the vast flat or rolling terrain of the pediplain, where the average altitude varies between 200 and 400 m. Despite this variability, the country as a whole reflects the seasonal pattern typical of a Mediterranean climate notable for cool, wet winters and hot, dry summers. Thus, all the districts have a reasonably long dry season, lasting two to five months, increasing from north to south and from coastal to inland Portugal.
Forest ecosystem patterns on mainland Portugal cover one third of the territory and provide a wide range of both goods and services. Most Portuguese forests are of high economic importance, largely because they provide raw materials for the paper, furniture and cork derivatives industries and are, in many cases, the result of planned afforestation/reforestation. Of the total forest, 87% is under private ownership. The average size of these private properties ranges from 2 ha in the north, through 30 ha in the central districts of the country to 100 ha in the south.
In relation to the tree species planted on the Portuguese mainland, there are two distinct scenarios: pine and eucalypts are the two main species used in the north, while in the south, oaks are the most common species. Furthermore, in some northern districts, pine accounts for more than half of the total forest area, while eucalypts are favored in the coastal districts of the northern regions. In southern districts, pine and eucalypts are also planted but they represent a substantially smaller fraction of the forest area than in the north [30].
Significant socio-economic changes have affected Portugal for at least the last five/six decades. The population of the rural areas decreased substantially in the second half of the 20th century, leading to the abandonment of agricultural land and a reduction in the size of livestock herds and the amount of forest fuels consumed by grazing and the collection of firewood [9,18,31].
In the period 1950–2011, nine districts (Viana do Castelo, Vila Real, Viseu, Bragança, Guarda, Castelo Branco, Portalegre, Évora and Beja) lost between 10% and 47% of their population. Conversely, coastal districts from Setúbal to Braga saw their inhabitants increase over the same period; today, they have the highest concentration and density of urban populations, as well as younger residents [10].
2.2. Databases
All records dating from 1996 to 2015, available in the Portuguese Institute for Nature and Forests Conservation (ICNF) data bank (http://www.icnf.pt/portal/florestas/dfci/estatisticas), were used in this work. Each record contains certain relevant information, specifically, geographic location, date, burned area in hectares and cause of the ignition, reported when the fire was investigated by the competent authorities.
By applying various filters, the total annual occurrences in each district and the total annual occurrences in the country were extracted from these records. All the occurrences (TOc) were grouped by burns (TB) or false burns, by forest fires (TF) or agricultural burns, by investigated fires (TIF) or fires not investigated, and finally by cause, when known.
The classifications of causes of forest fire are presented in Table 1.
In this study, districts were the geographical unit that performed the best according to our assessment and given the specific goals and time period of the study. A district is an intermediate unit in which the integration and harmonization of socio-biophysical characteristics with the dynamics and responsibilities of the authorities in the district can be promoted with a view to supporting the necessary changes and implementing the strategic actions required to protect the forest against forest fires. Fire policies, suppression and prevention efforts are also organized at the district level.
The districts considered in this manuscript are referenced as shown in Table 2.
2.3. Statistical Analysis
A descriptive statistical analysis was performed for fire occurrences (TOc, TB, TF and TIF), both for the mainland and individually for each district. The TIF records were investigated in depth with respect to the origin of forest fires (Un, In, Ne, Na, Re) to ascertain the possible existence of similar patterns of behavior between districts.
There are several statistical approaches to analyze space-time data. In this work, due to the high degree of randomness of the data, a clustering analysis was considered to extract and synthesize the information. A hierarchical agglomerative clustering algorithm based on a complete linkage method was therefore used to investigate similarity between districts. City block distance between each district profile was the metric used to perform clustering in relation to the types of occurrence.
The Spearman correlation coefficient between causes in district profiles was computed. We used the Spearman correlation coefficient because the samples do not validate the Shapiro-Wilk normality test for a confidence level of 95%.
The criterion used to select the number of clusters took the analysis of the produced dendrograms and the color-coded distance matrix into account by associating each color with the distance between pairs of districts and the matrix [32]. The cophenetic correlation coefficient was used as a measure of clustering efficiency [33,34].
All statistical analysis was conducted in Python 2.7 with NumPy, SciPy, Matplotlib and Pandas packages.
3. Results
3.1. Spatial Temporal Distribution of Occurrences by Type
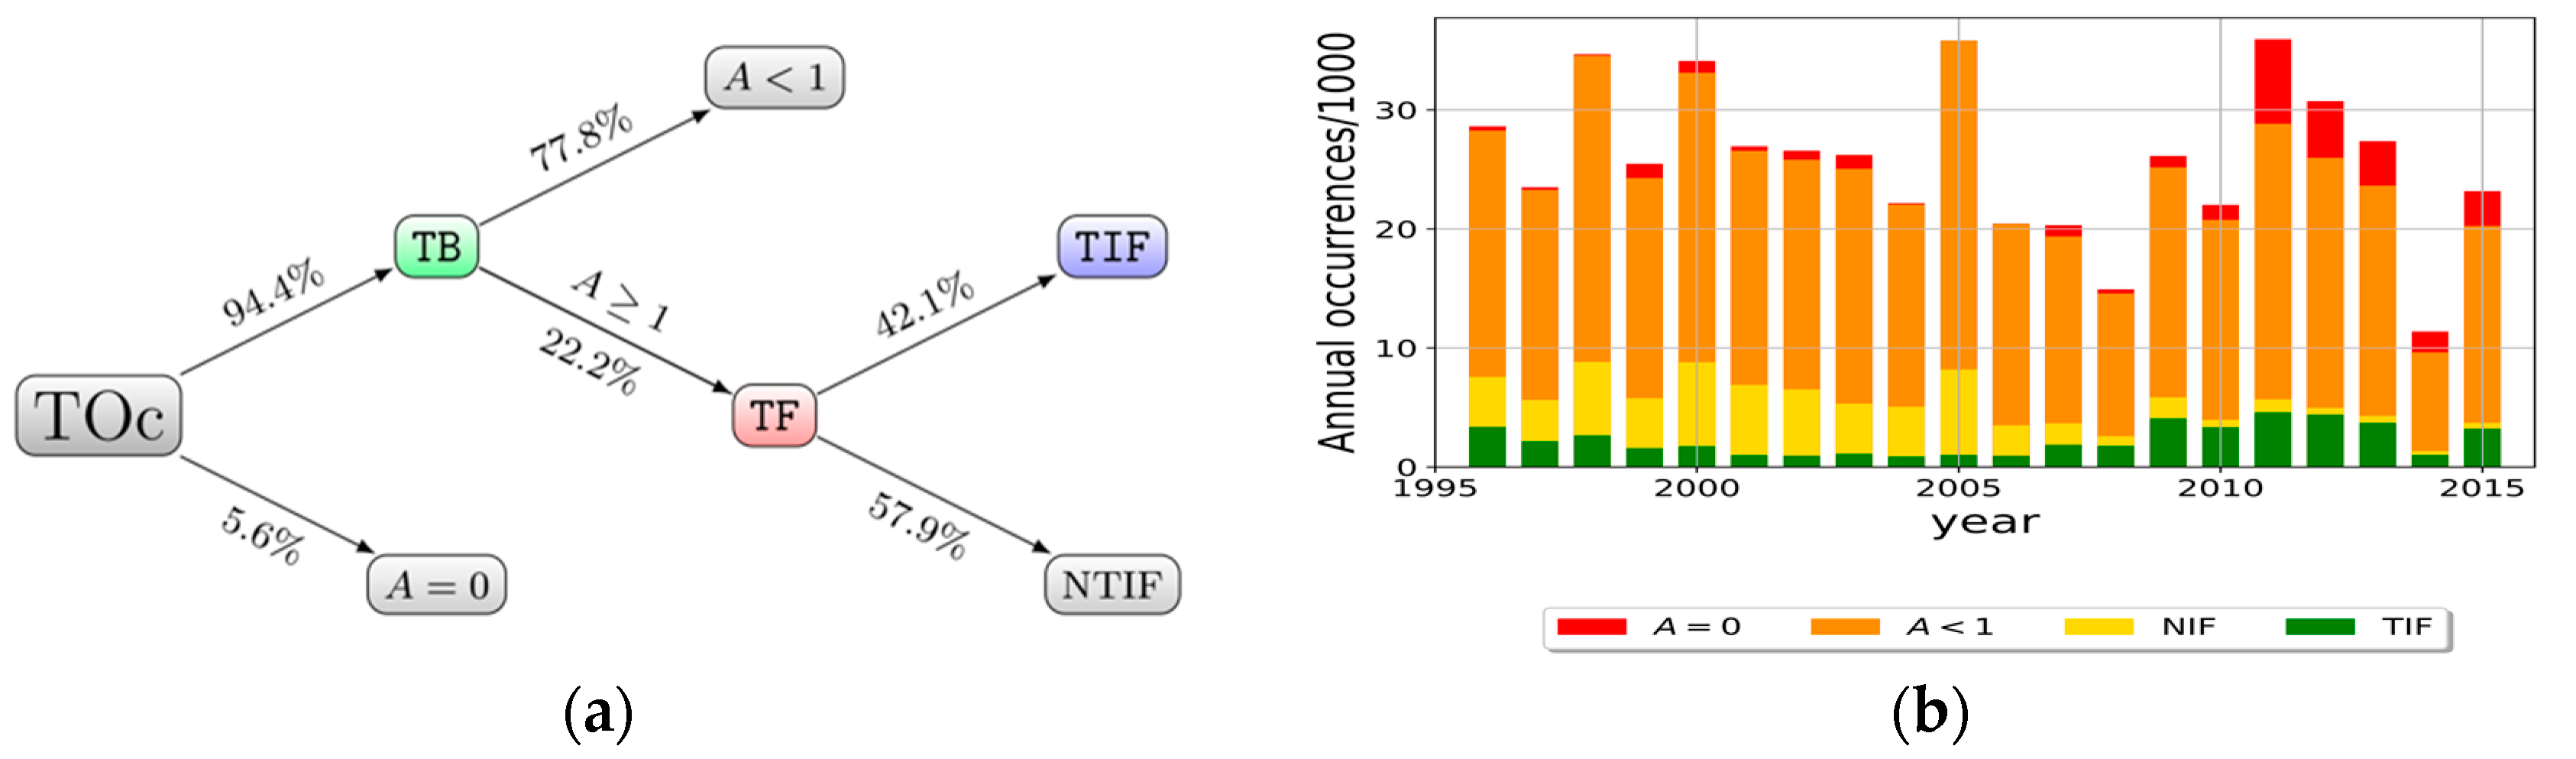
In the period between 1996 and 2015 a total of 516,577 occurrences (TOc) were recorded; however, 94.4% were classified as forest fires, i.e., the total burns (TB) in these two decades correspond to 487,503 events. Two kind of TB situations were considered: burns with burned area less than 1 ha, (A < 1 ha), amounting to 77.8%, and forest fires with burned area greater than 1 ha (A ≥ 1 ha), amounting to 22.2% (108,242 occurrences). Of these, 45,603 (42.1%) were investigated to determine the cause of the fire (TIF) (Figure 2a).
Figure 2b shows the evolution of the types of occurrences during the period under study. In general, since 2010, forest fire occurrences have tended to decrease while the number of false alarms ignition investigated tend to increase. In fact, NIF almost disappear, to be replaced by TIF.
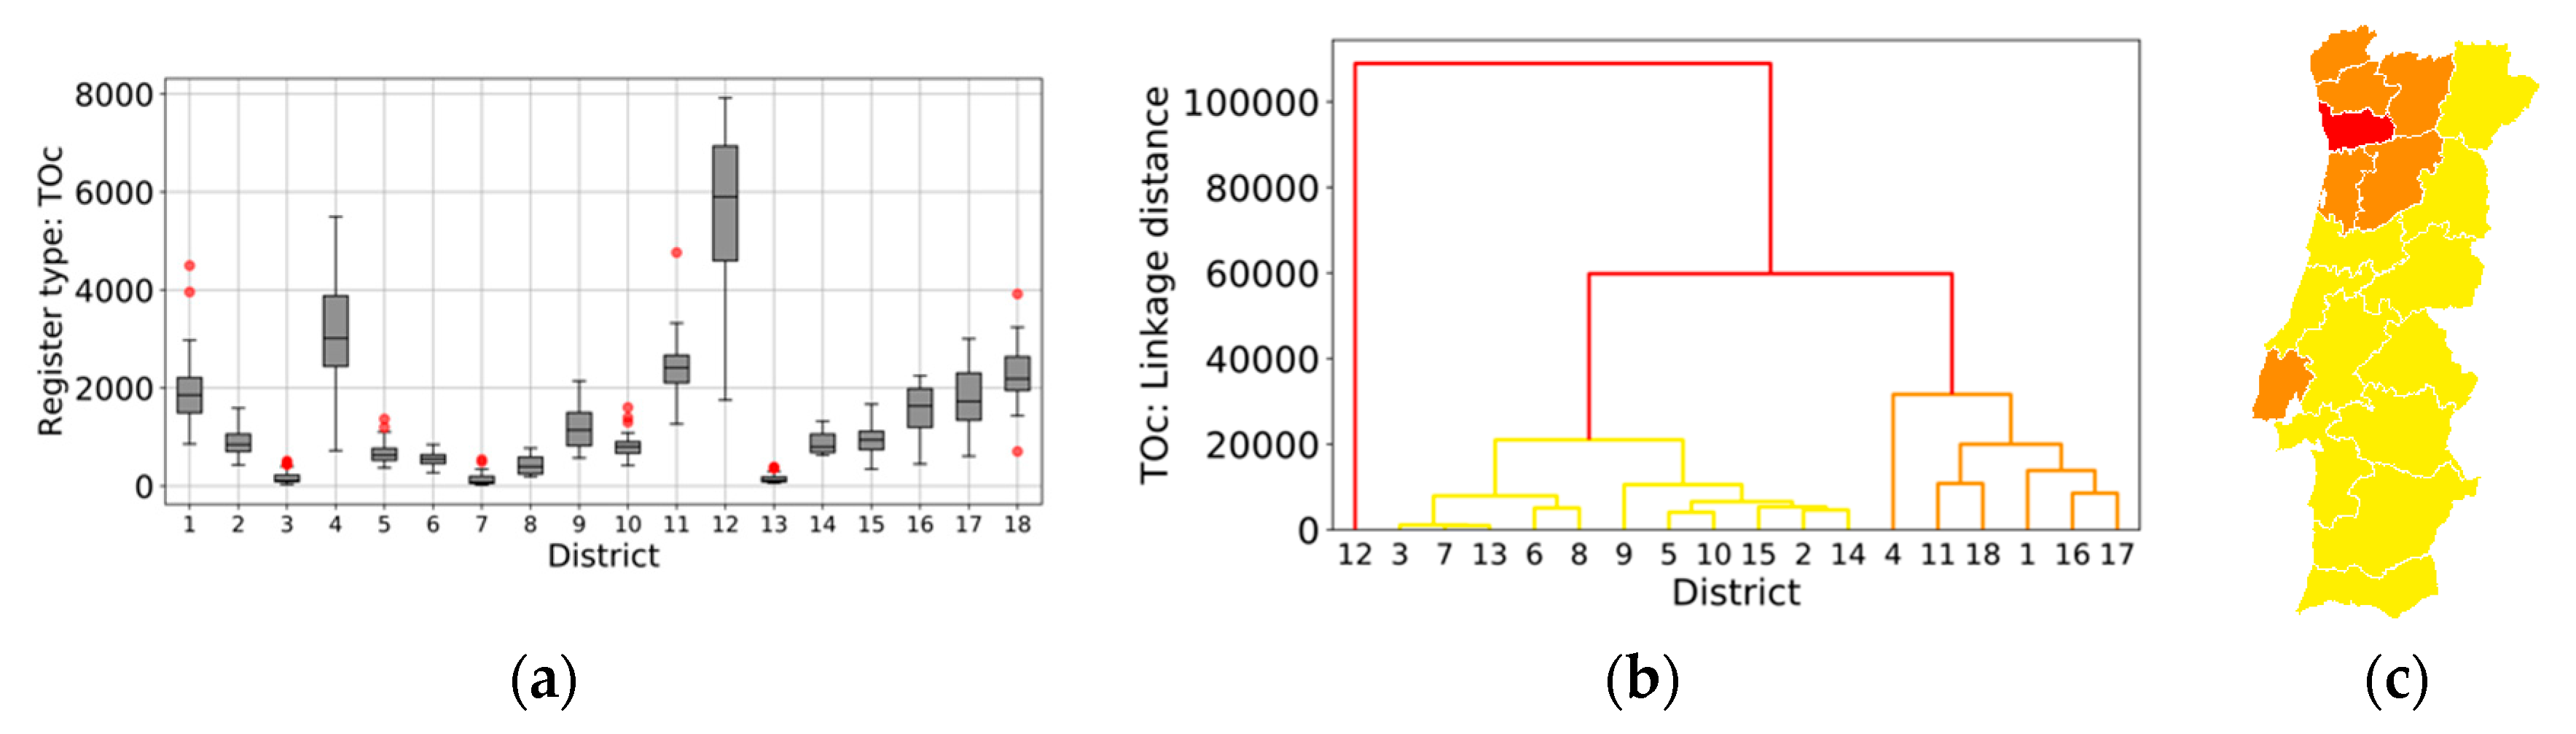
The total number of occurrences recorded in the two decades, by year and by district, is summarized in the boxplot of Figure 3a. Hierarchical clustering was applied to data and the results are presented in Figure 3b. The geographical localization of each cluster is shown in Figure 3c.
These outputs clearly show a great dispersion in the distribution of annual occurrences, with three main clusters. The Porto cluster has the highest number and the higher mean annual distribution of ignitions, 5600 ± 1698, and an asymmetric distribution, with 50% of the annual occurrences between 2000 and 6000 and the remaining 50% between 6000 and 8000. Aveiro, Braga, Lisboa, Viana do Castelo, Vila Real and Viseu are aggregated in another cluster which presents an annual ignition of 2211 ± 945. The remaining districts recorded the lowest annual average (630 ± 430) and have an annual number of occurrences below 2000. In this cluster there is a subgroup consisting of Beja, Évora, Portalegre (Alentejo region), which is considered to have residual values compared with the other districts.
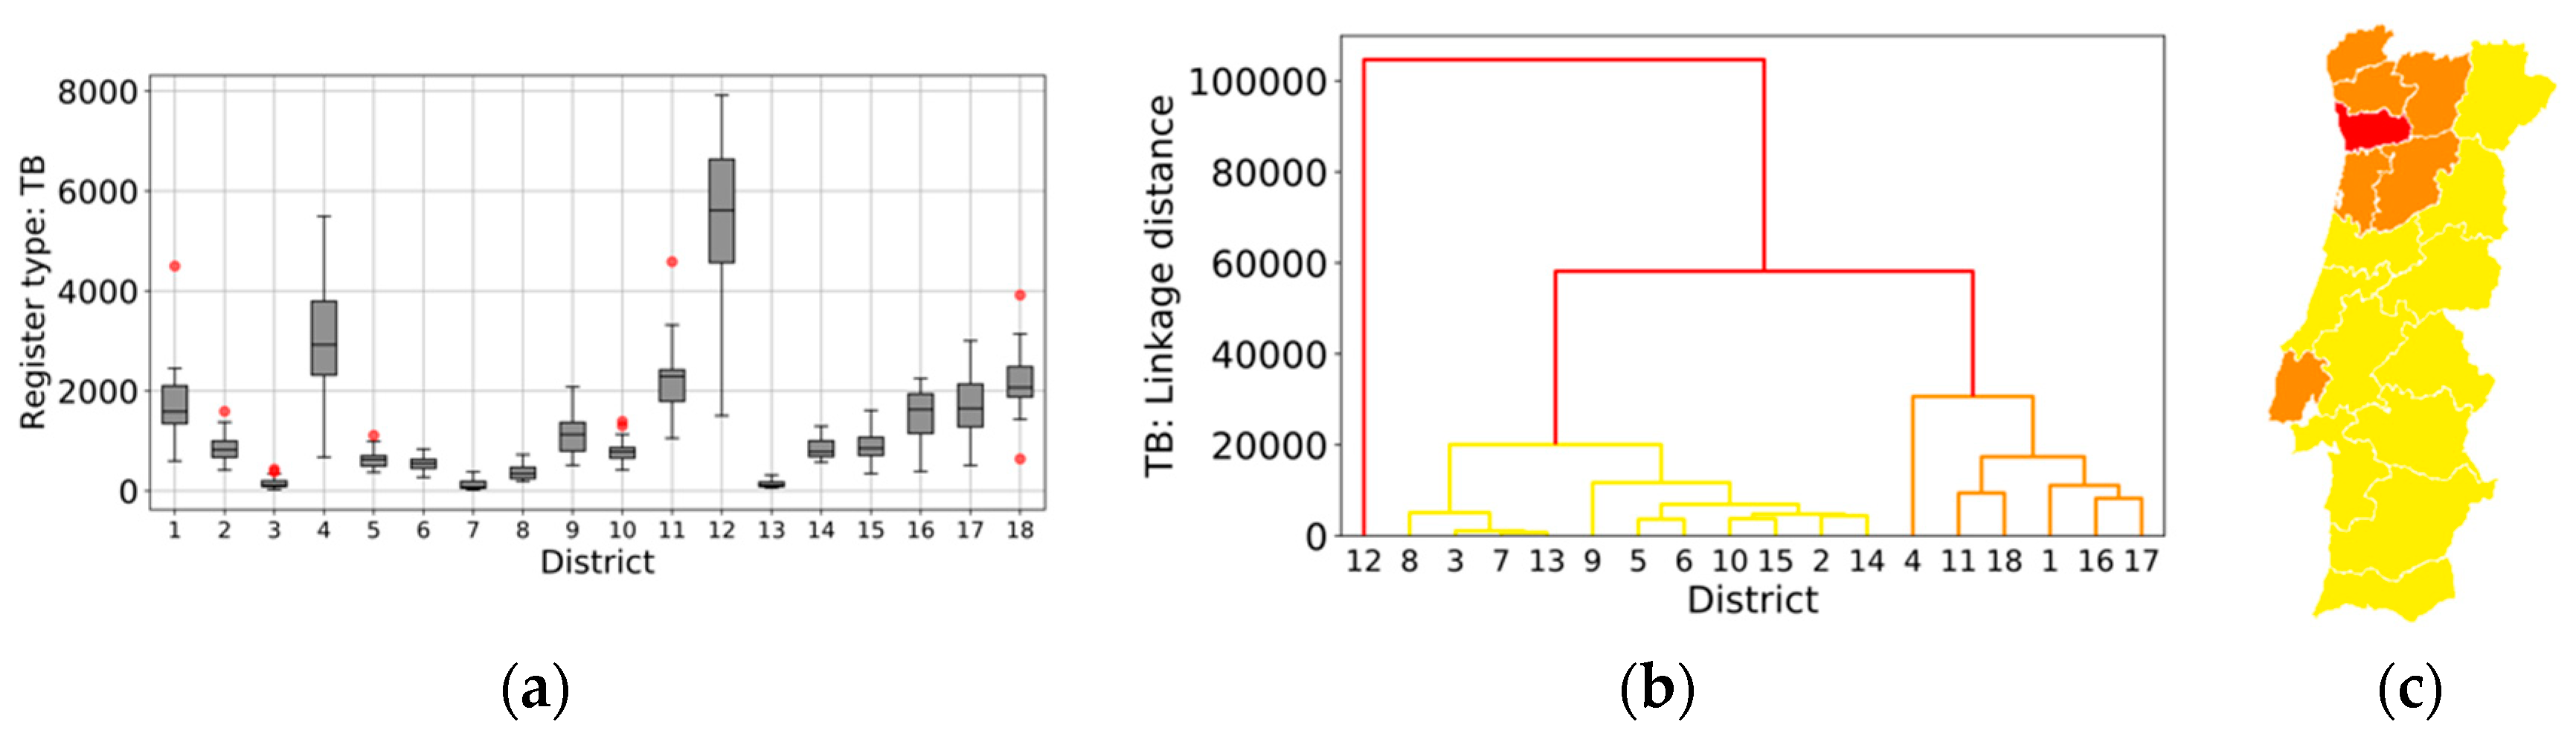
Regarding the occurrences classified as fire (A > 0) (Figure 4), the results of the analysis are similar to those for total occurrences. The clusters have the same groups of districts. The annual averages and respective standard deviation are: 5356 ± 1677, 2080 ± 921 and 592 ± 401, respectively, for the different clusters. The cophenetic coefficients are also similar (0.87), meaning that clustering analysis and the dendrogram are reliable techniques to use since they keep the pairwise distances between the original unmodeled data.
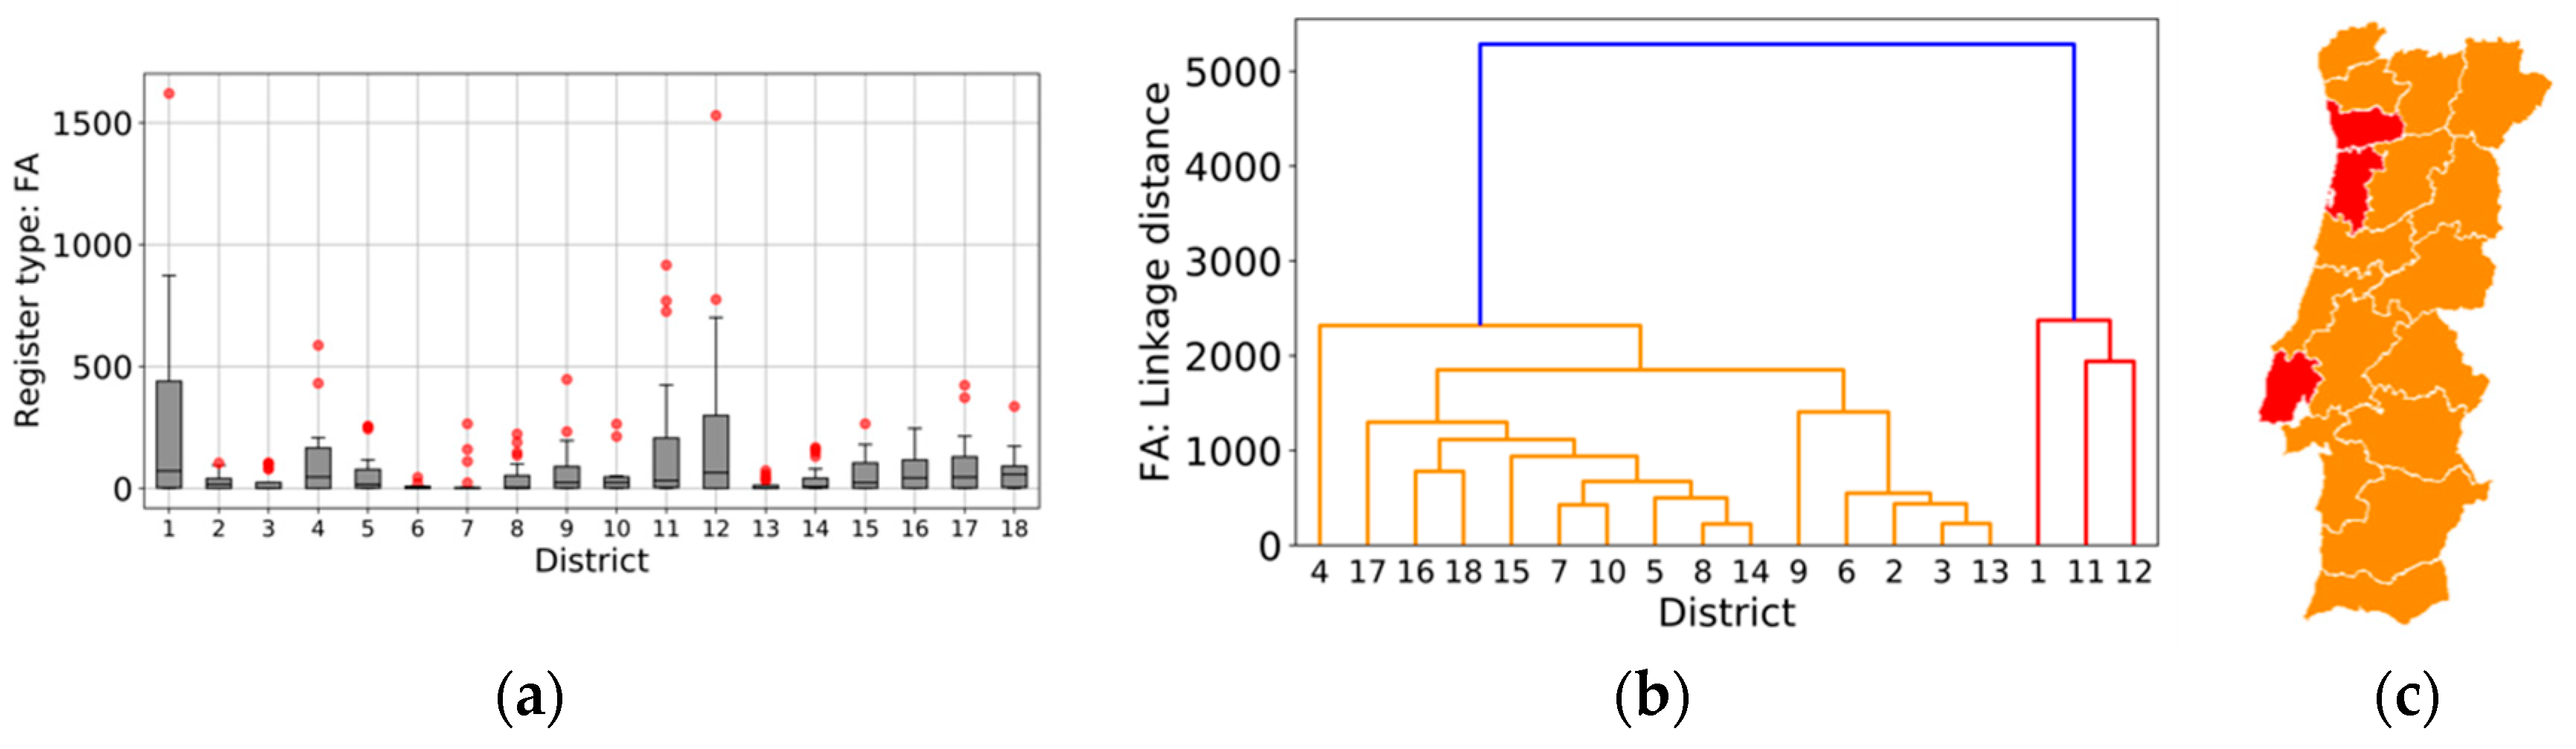
False alarms (FA), or fires without burned area, are more frequent in Aveiro, Lisbon and Porto (Figure 5), with an annual average of 232 ± 300 occurrences. The rest of the country presents an annual mean of 50 ± 84 occurrences. Both groups show a high annual variation, evidenced by the high standard deviation and the presence of a significant number of outliers.
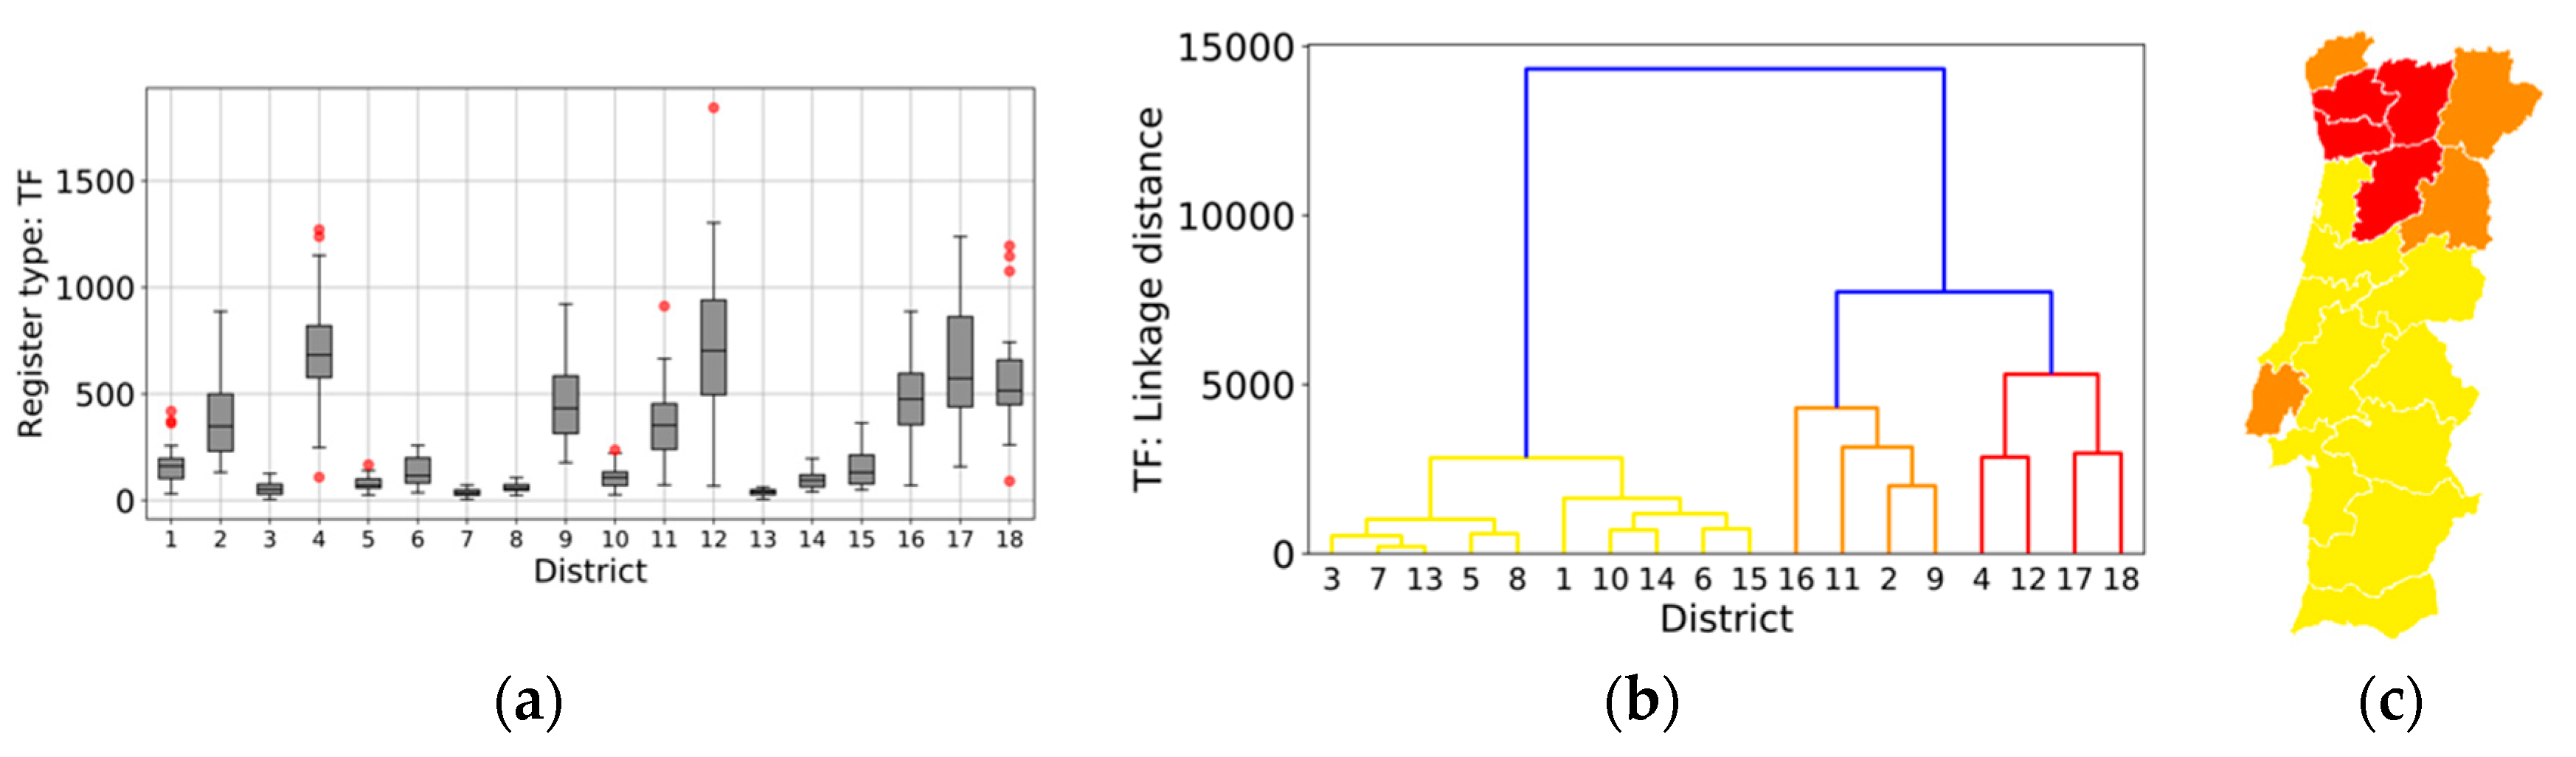
Considering TF, a cophenetic coefficient of 0.85 was obtained, meaning that the representativeness of distributions and hierarchical analysis is reliable. Three clusters were obtained, with Braga, Porto, Vila Real and Viseu forming the cluster with the highest number of forest fires. It is characterized by having more than 500 ignitions in 50% of records (median), with over 1000 occurrences in some years. The cluster composed of Bragança, Guarda, Lisbon and Viana do Castelo has a median of less than 500 occurrences; however, about 25% of the records report more than 500 fires. The cluster formed of the remaining districts records the lowest annual number of occurrences >1 ha, with a median value below 200 and never exceeding 500 ignitions (Figure 6).
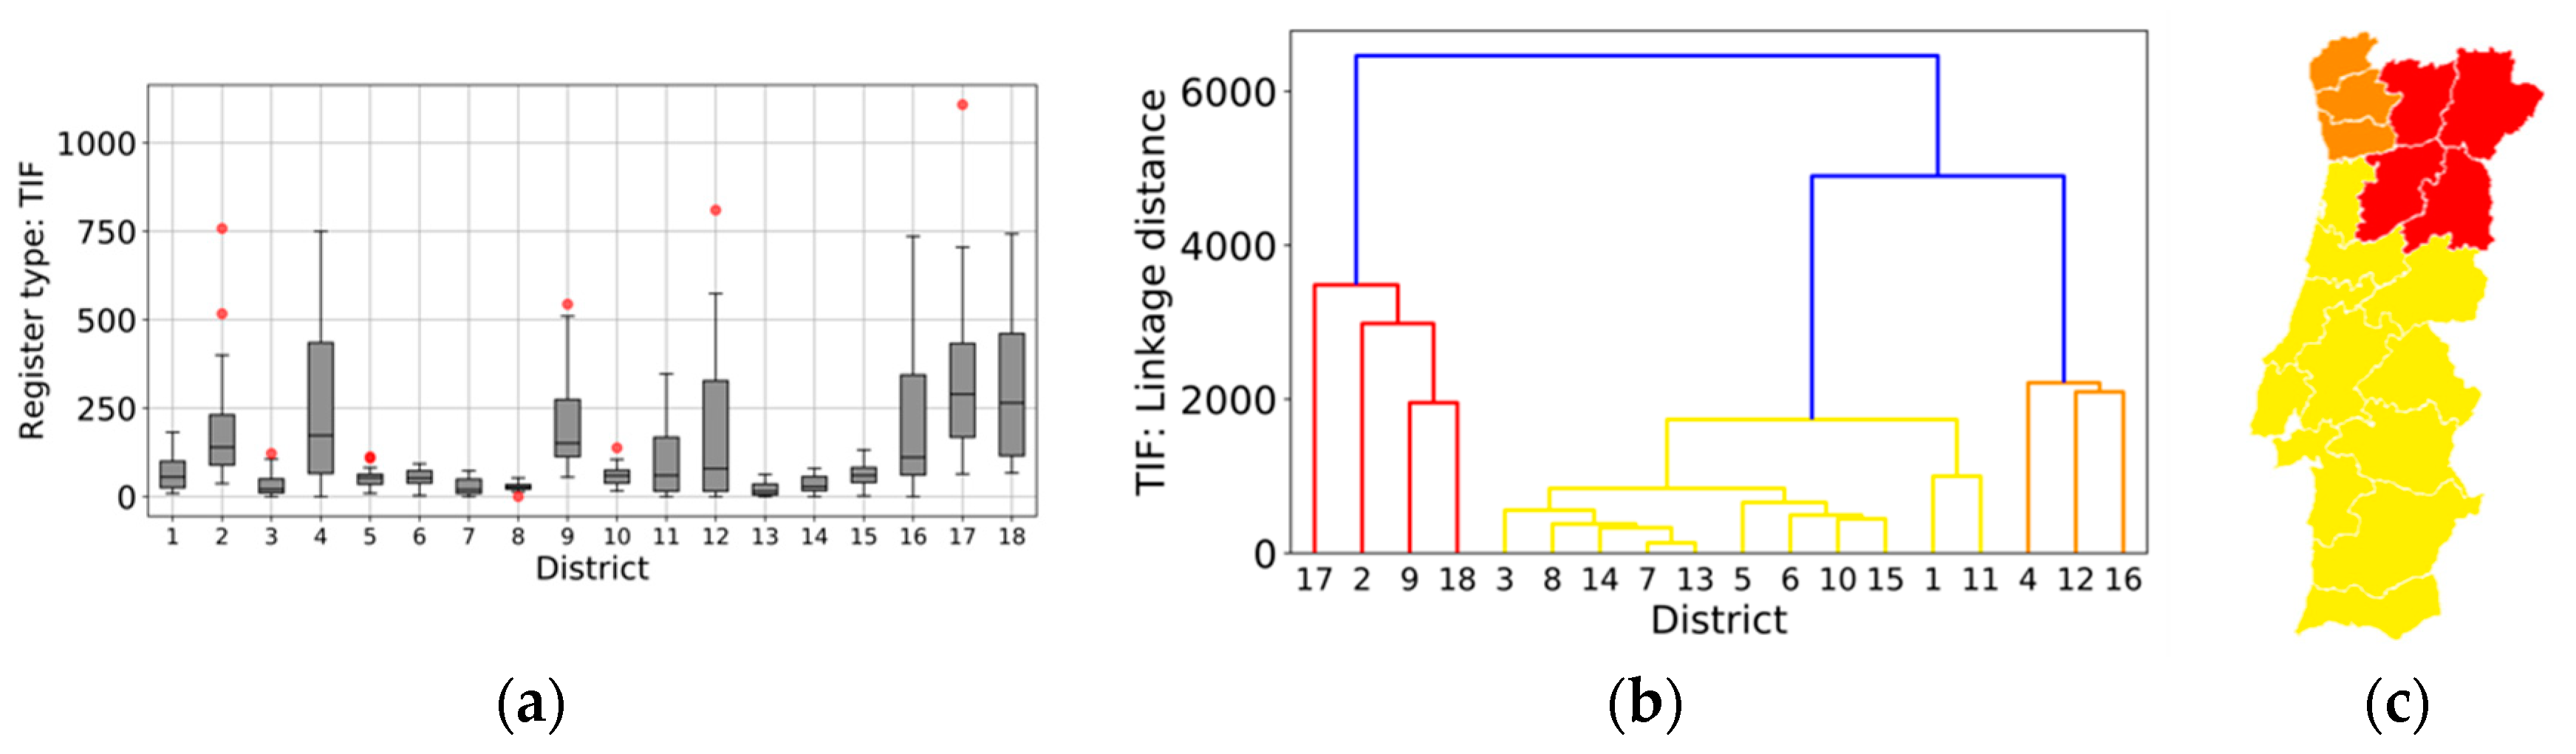
With regard to TIF, three clusters were also obtained (cophenetic coefficient: 0.87). Although most of the districts remain in the same common group, such as in TF and TIF, there are some exchanges between groups, suggesting that districts have different coverage capacities when it comes to research into the reasons underlying forest fire ignition (Figure 7).
3.2. Ratio between TIF/TF and Annual Average of TIF/TF in Portugal
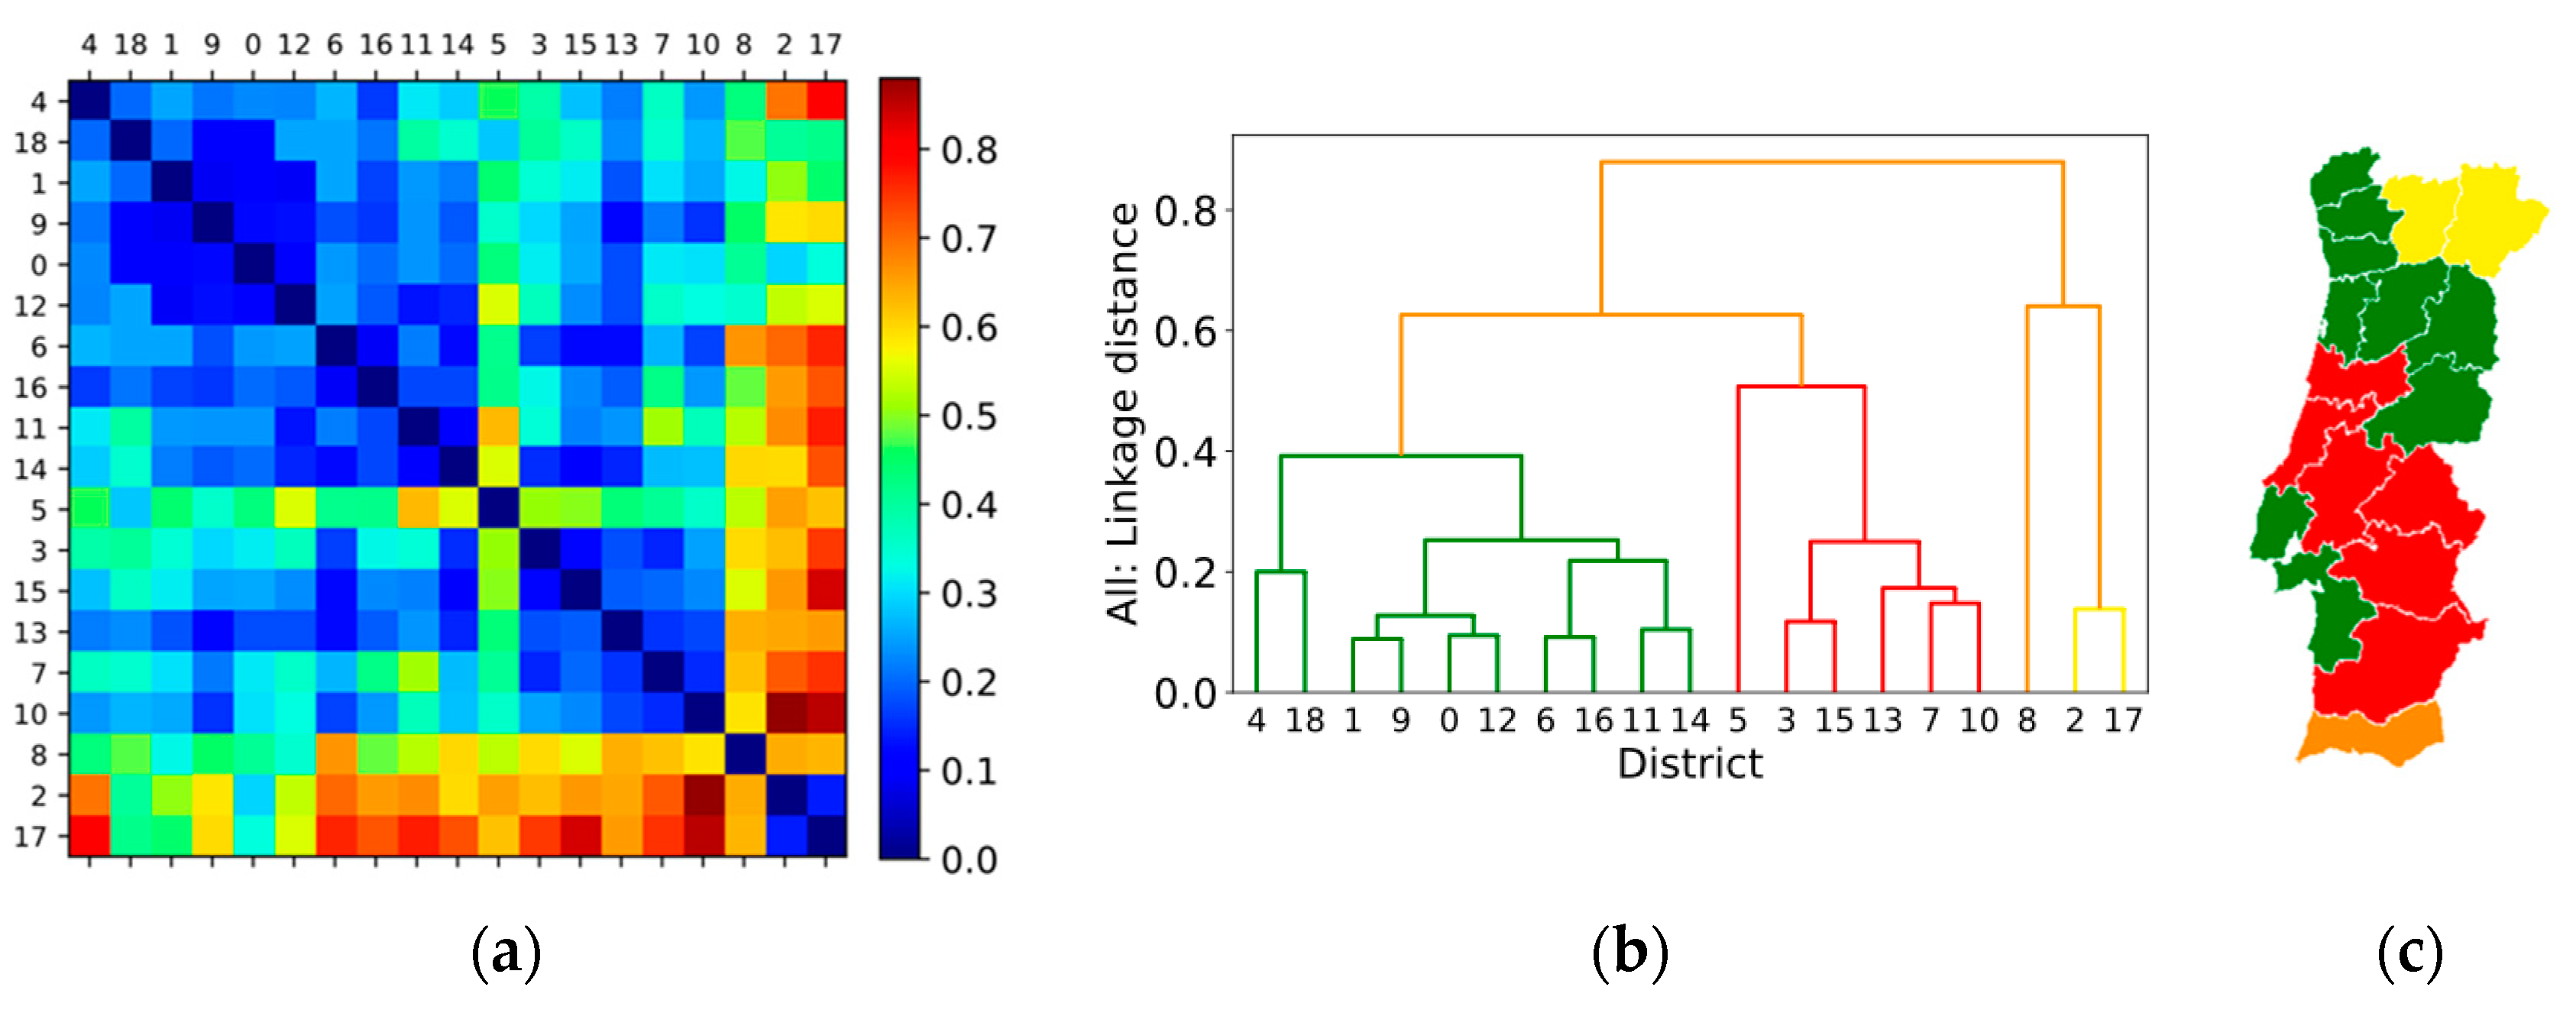
With the aim being to compare the ability to respond to requests from the district authorities responsible for the investigation into forest fires, in Figure 8 we present the graphs which summarize the comparative study between the relative profiles of the districts, obtained from the ratio between the annual number of fires investigated in relation to the number of forest fires that occurred by year and by district. For this purpose, the relative profiles (TIF/TF) were compared between all pairs of districts, using the Spearman correlation coefficient. The results are shown in Figure 8. The annual average of Portugal is represented by “0”.
According to Figure 8, in the last two decades the districts of Coimbra, Beja, Santarém, Portalegre, Évora and Leiria had higher values of investigated ignitions than the ones recorded in Aveiro, Braga, Castelo Branco, Guarda, Lisboa, Porto, Setúbal, Viana do Castelo and Viseu. The greatest dissimilarity occurred between the districts of Faro, Bragança and Vila Real and all the other districts.
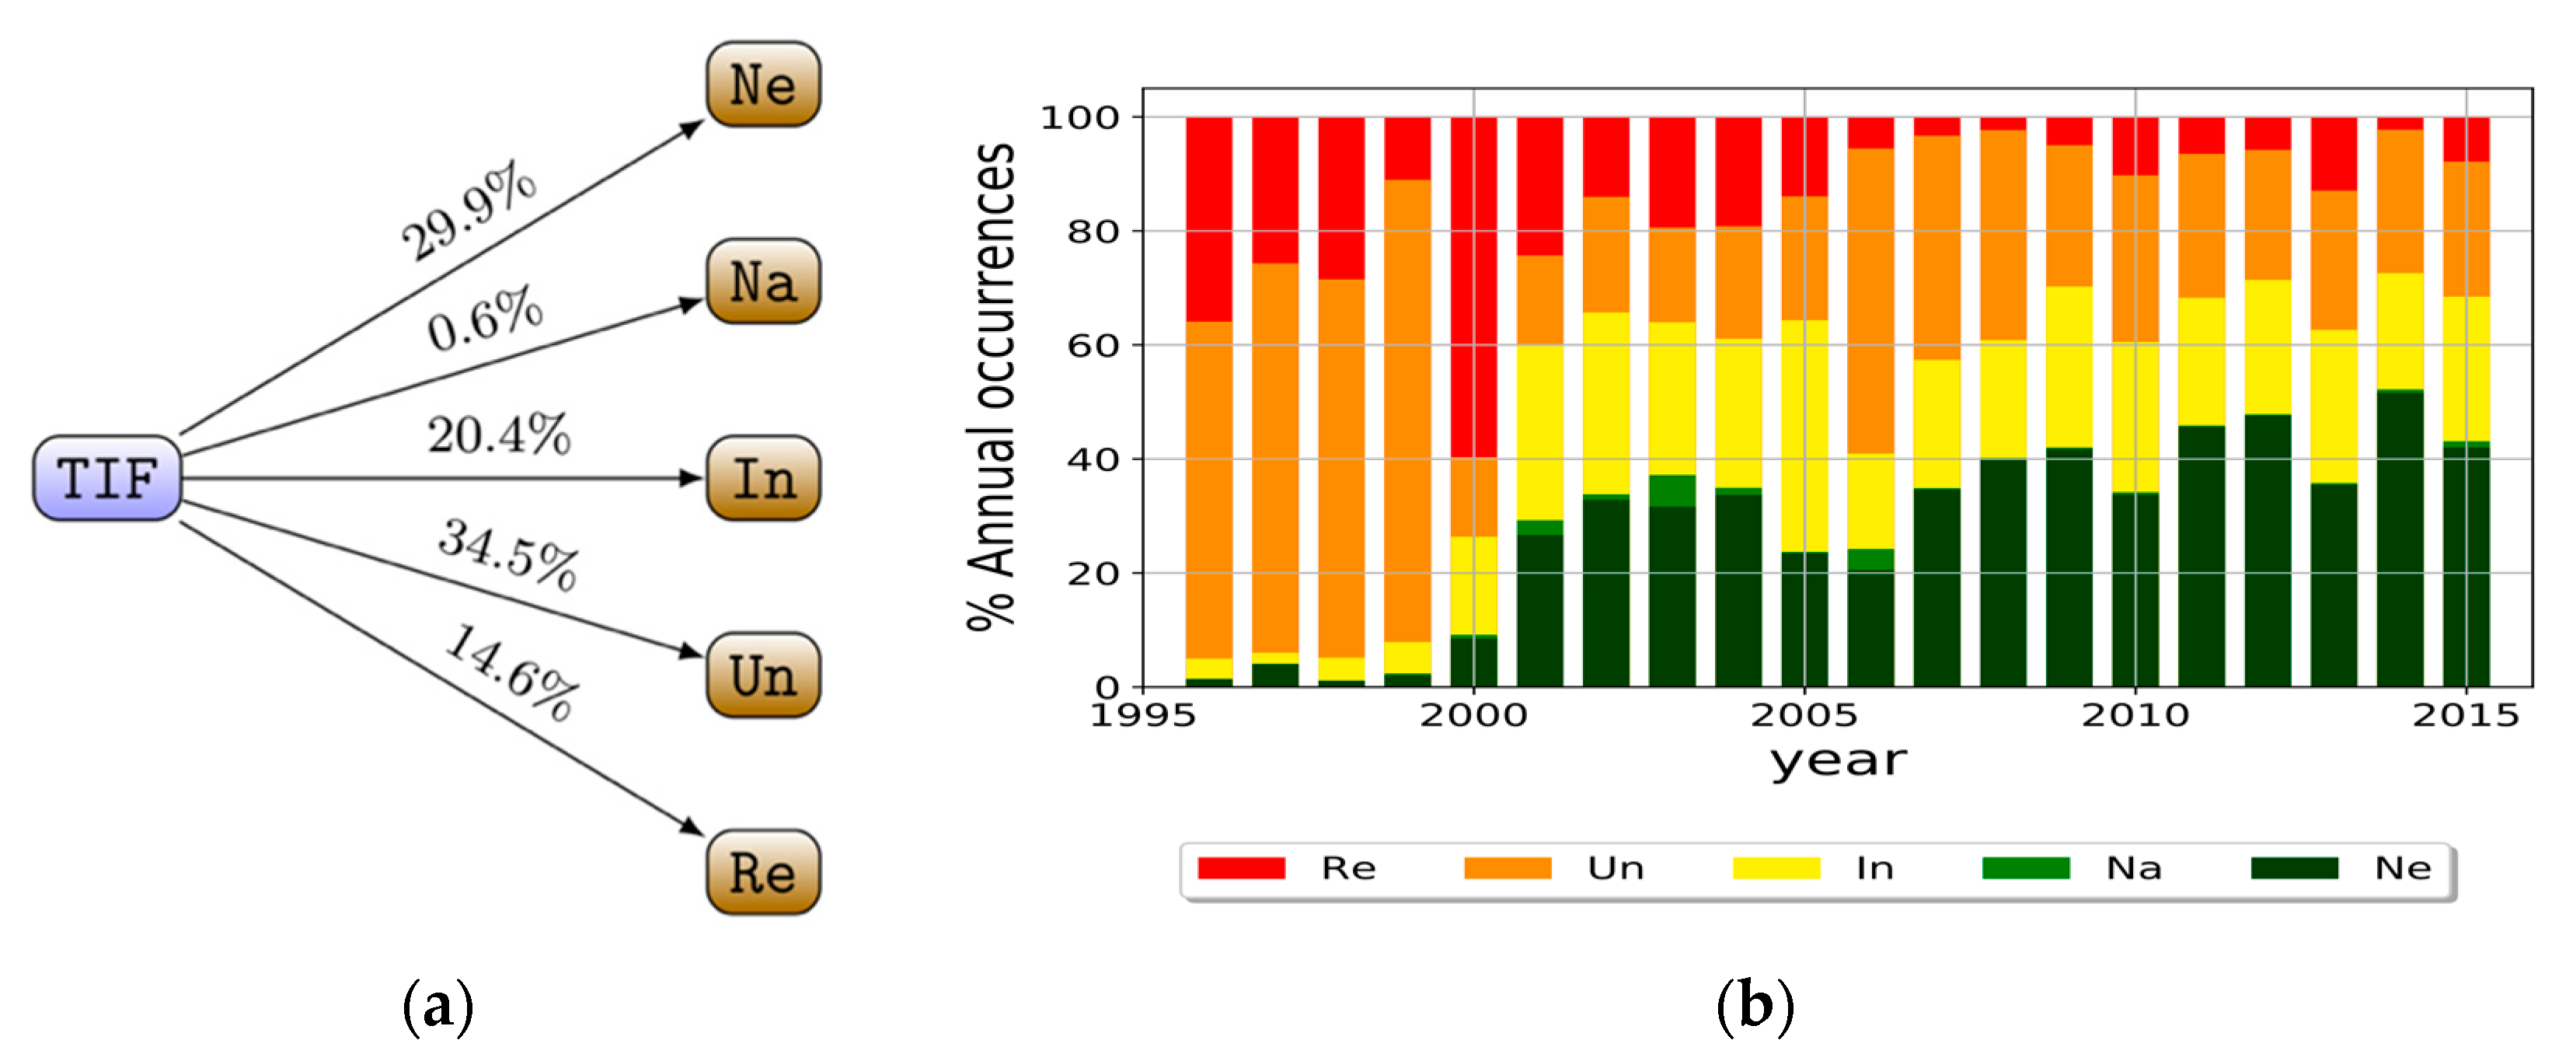
3.3. Spatial Distribution of Ignition Causes
As we can see in Figure 9, the ‘unknown cause’, due to lack of resources to start and/or conduct investigations up to the end, has a weight of 34.5% in the TIF. However, these fires have been decreasing significantly in Portugal since the beginning of the 2000s, presumably as a result of efforts to remedy this shortage (Figure 9b). Negligent and deliberate were responsible for 29.9% and 20.4% ignitions, respectively. The human-caused forest fires saw the highest increase in the period under investigation, particularly from the year 2000. Reactivations represent 14.6% and natural causes only amount to 0.6% of total ignitions of investigated forest fires.
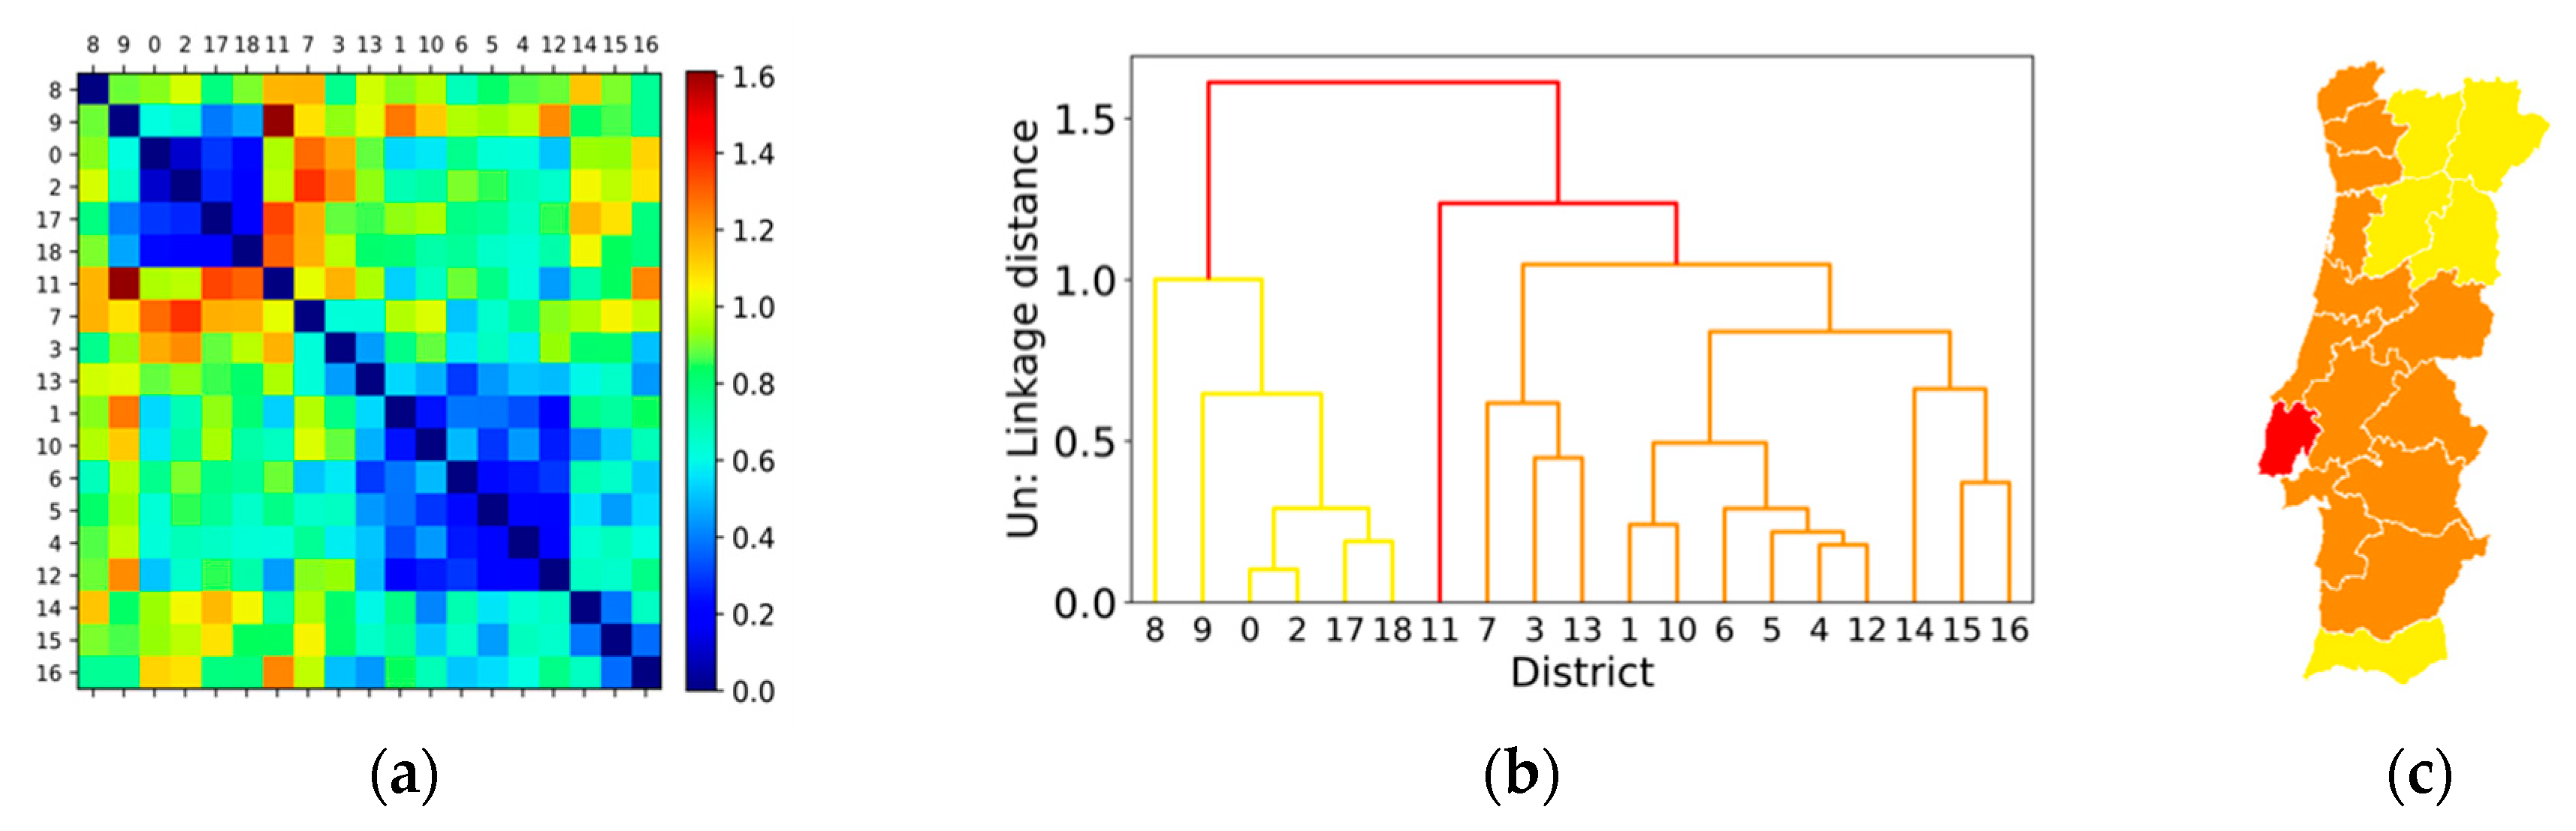
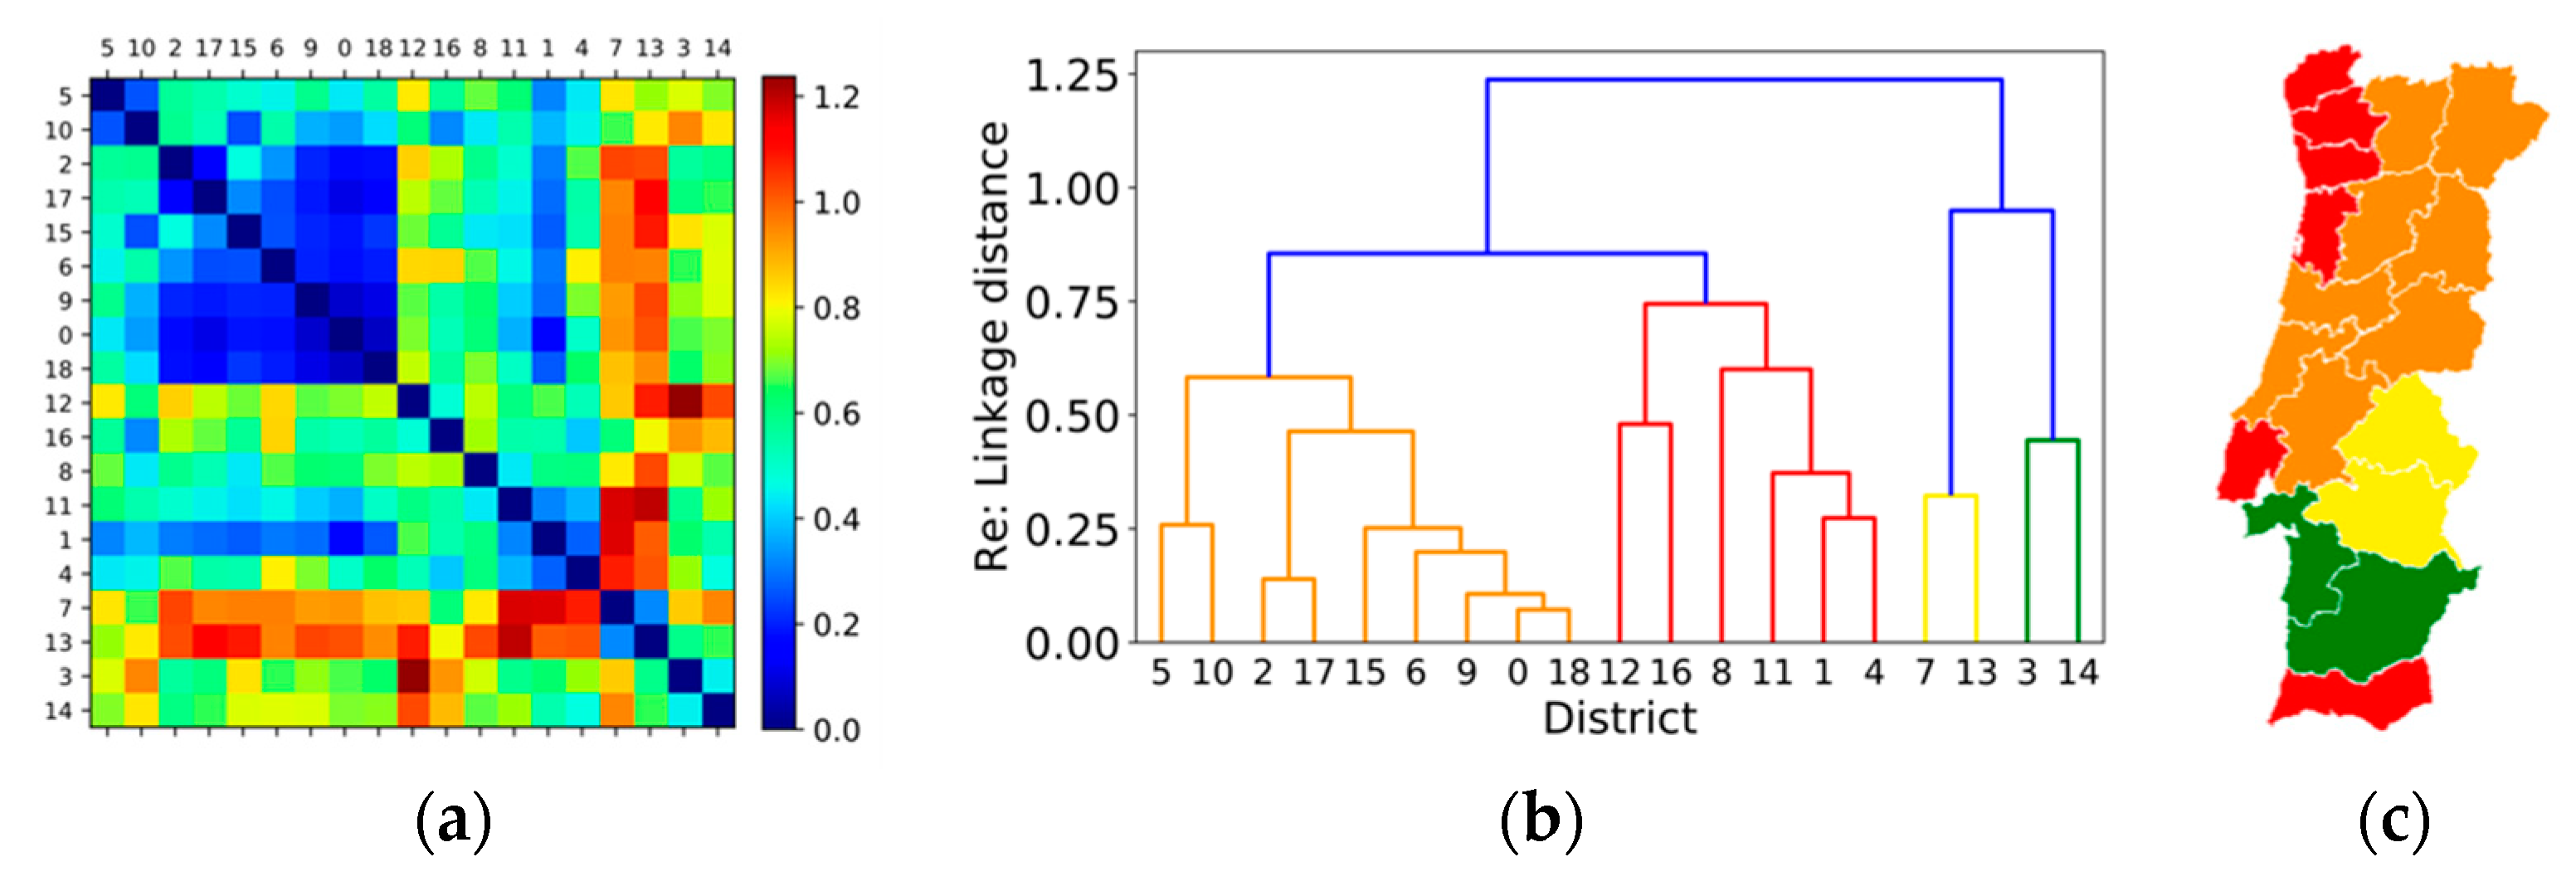
From the graphics (Figure 10), we can see that Lisbon (11) was the district registering the highest percentage of unknown causes and also the greatest dissimilarity compared with Guarda, Vila Real, Viseu, and Faro, which had the lowest unknown cause values. According to the matrix presented in Figure 10a, the northeast districts (Bragança, Vila Real and Viseu) presented great similarity among them, as did the central (Aveiro, Coimbra, Castelo Branco and Leiria) and northwest districts (Porto and Braga).
Districts dominated by negligent causes of forest fires were found in the vast majority of the Portuguese territory, including the entire southern and the central and north inland regions (Figure 11). In this cluster, comprising twelve districts, around 23% of annual causes were identified as negligent. For the remaining districts the mean annual varies between 15.2% (Porto and Braga) and 13.1% (Leiria). Aveiro, Leiria and Coimbra were; however, the most dissimilar districts compared with the rest of the country (Figure 11a).
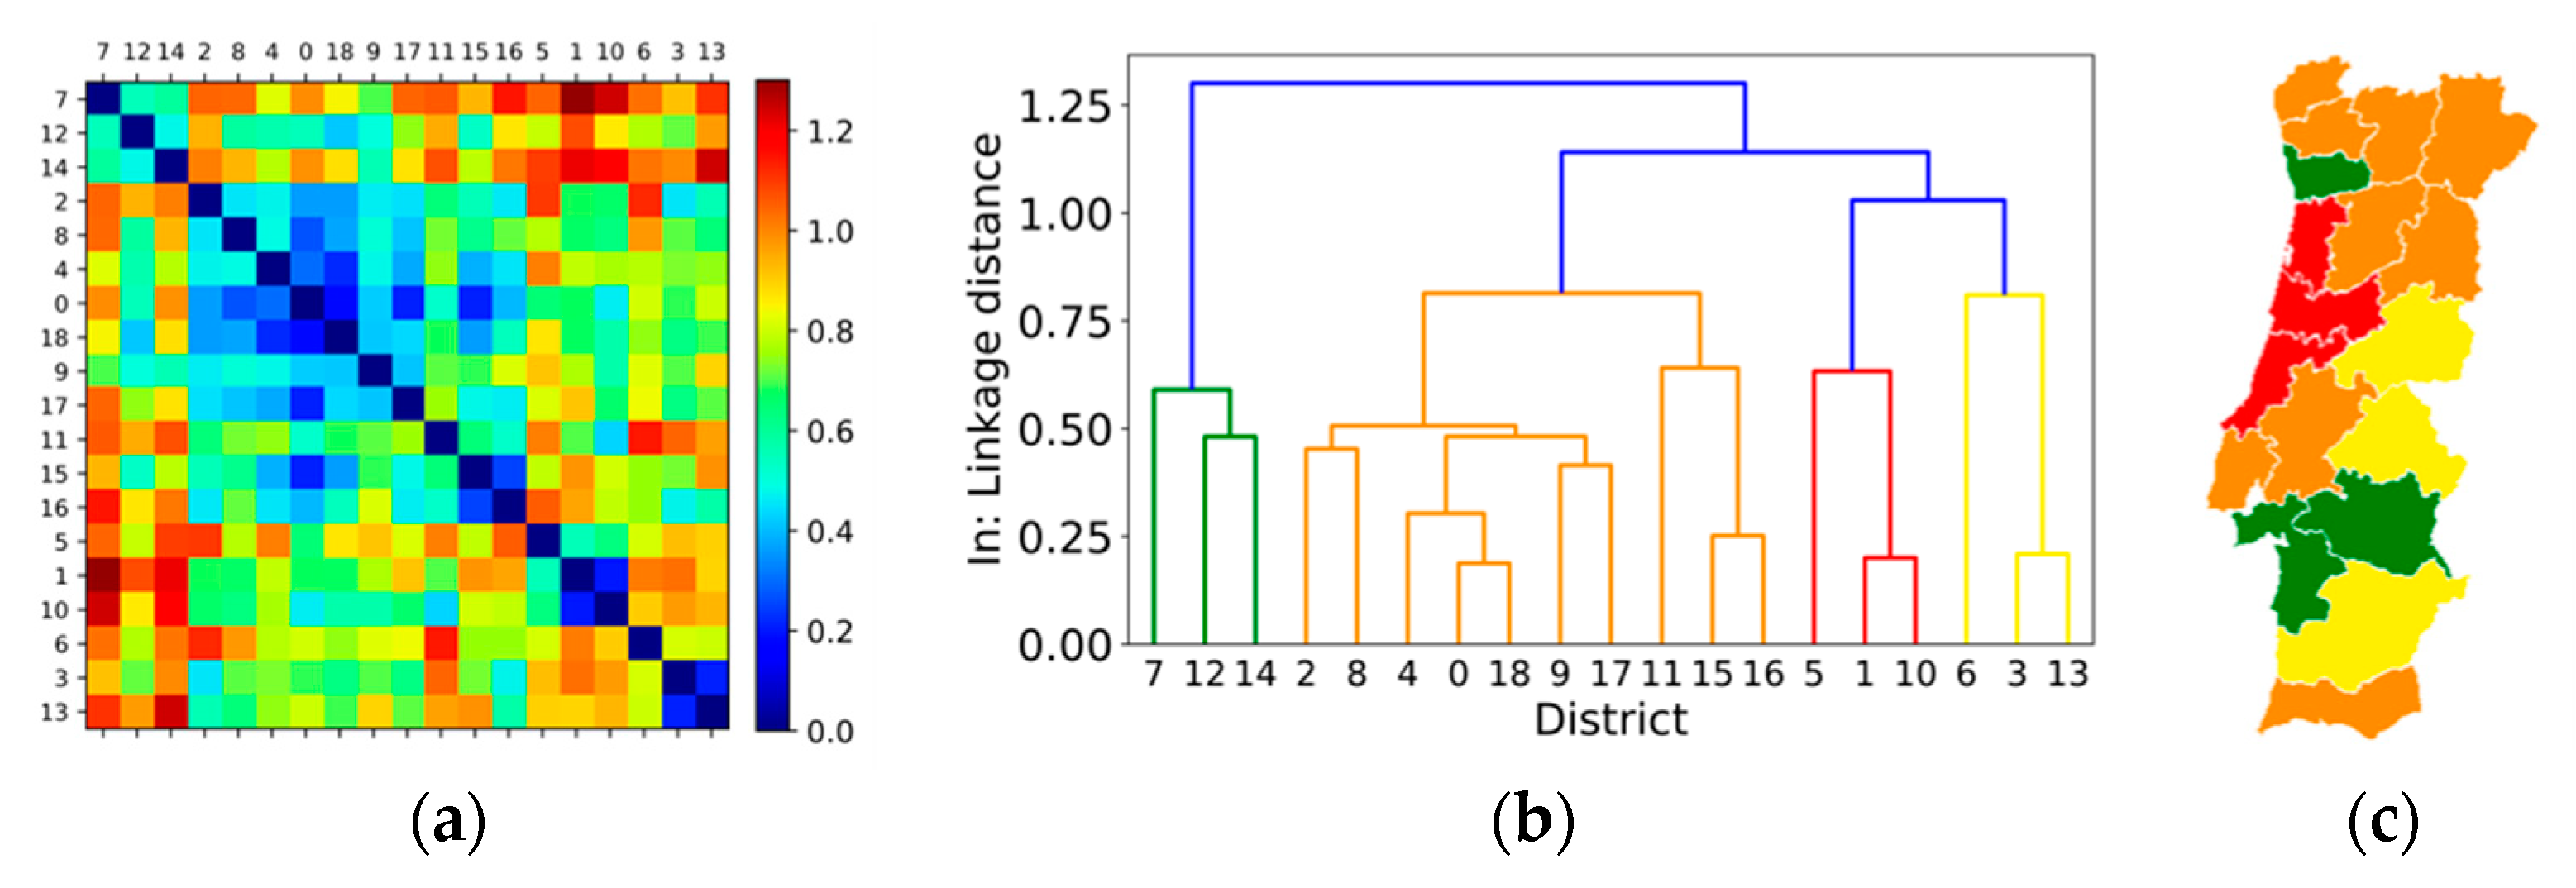
Deliberate forest fires (Figure 12), caused by malicious acts of pyromaniacs or for agricultural and livestock reasons are highly relevant in the central and northern regions, as well as in the southernmost district. The highest values were recorded in the cluster comprising the districts of Aveiro, Coimbra and Leiria, with an annual mean of 18.4% and a standard deviation of 27.8%, and the one formed by the districts of Braga, Bragança, Faro, Guarda, Lisboa, Santarém, Viseu, Viana do Castelo and Vila Real, with an average of 17.3 ± 21.5%. Évora and Setúbal, included in the cluster with the lowest values, are the most dissimilar districts, as we can see in the matrix in Figure 12a.
Figure 13 shows the spatial distribution of Re (reactivations) by district. In short, Re are spatially concentrated in two main groups: the first includes six districts near the coastline—in the north, Aveiro, Braga, Porto and Viana do Castelo, plus Lisbon and Faro. For this cluster, the mean annual of rekindles was 24.4 ± 18.4% for the analyzed period. The second group, with an annual mean of 18.8 ± 14.0%, is concentrated in the central and northern inland districts. Évora and Portalegre are; however, the districts that show the lowest similarity among all the spatial units (Figure 13a).
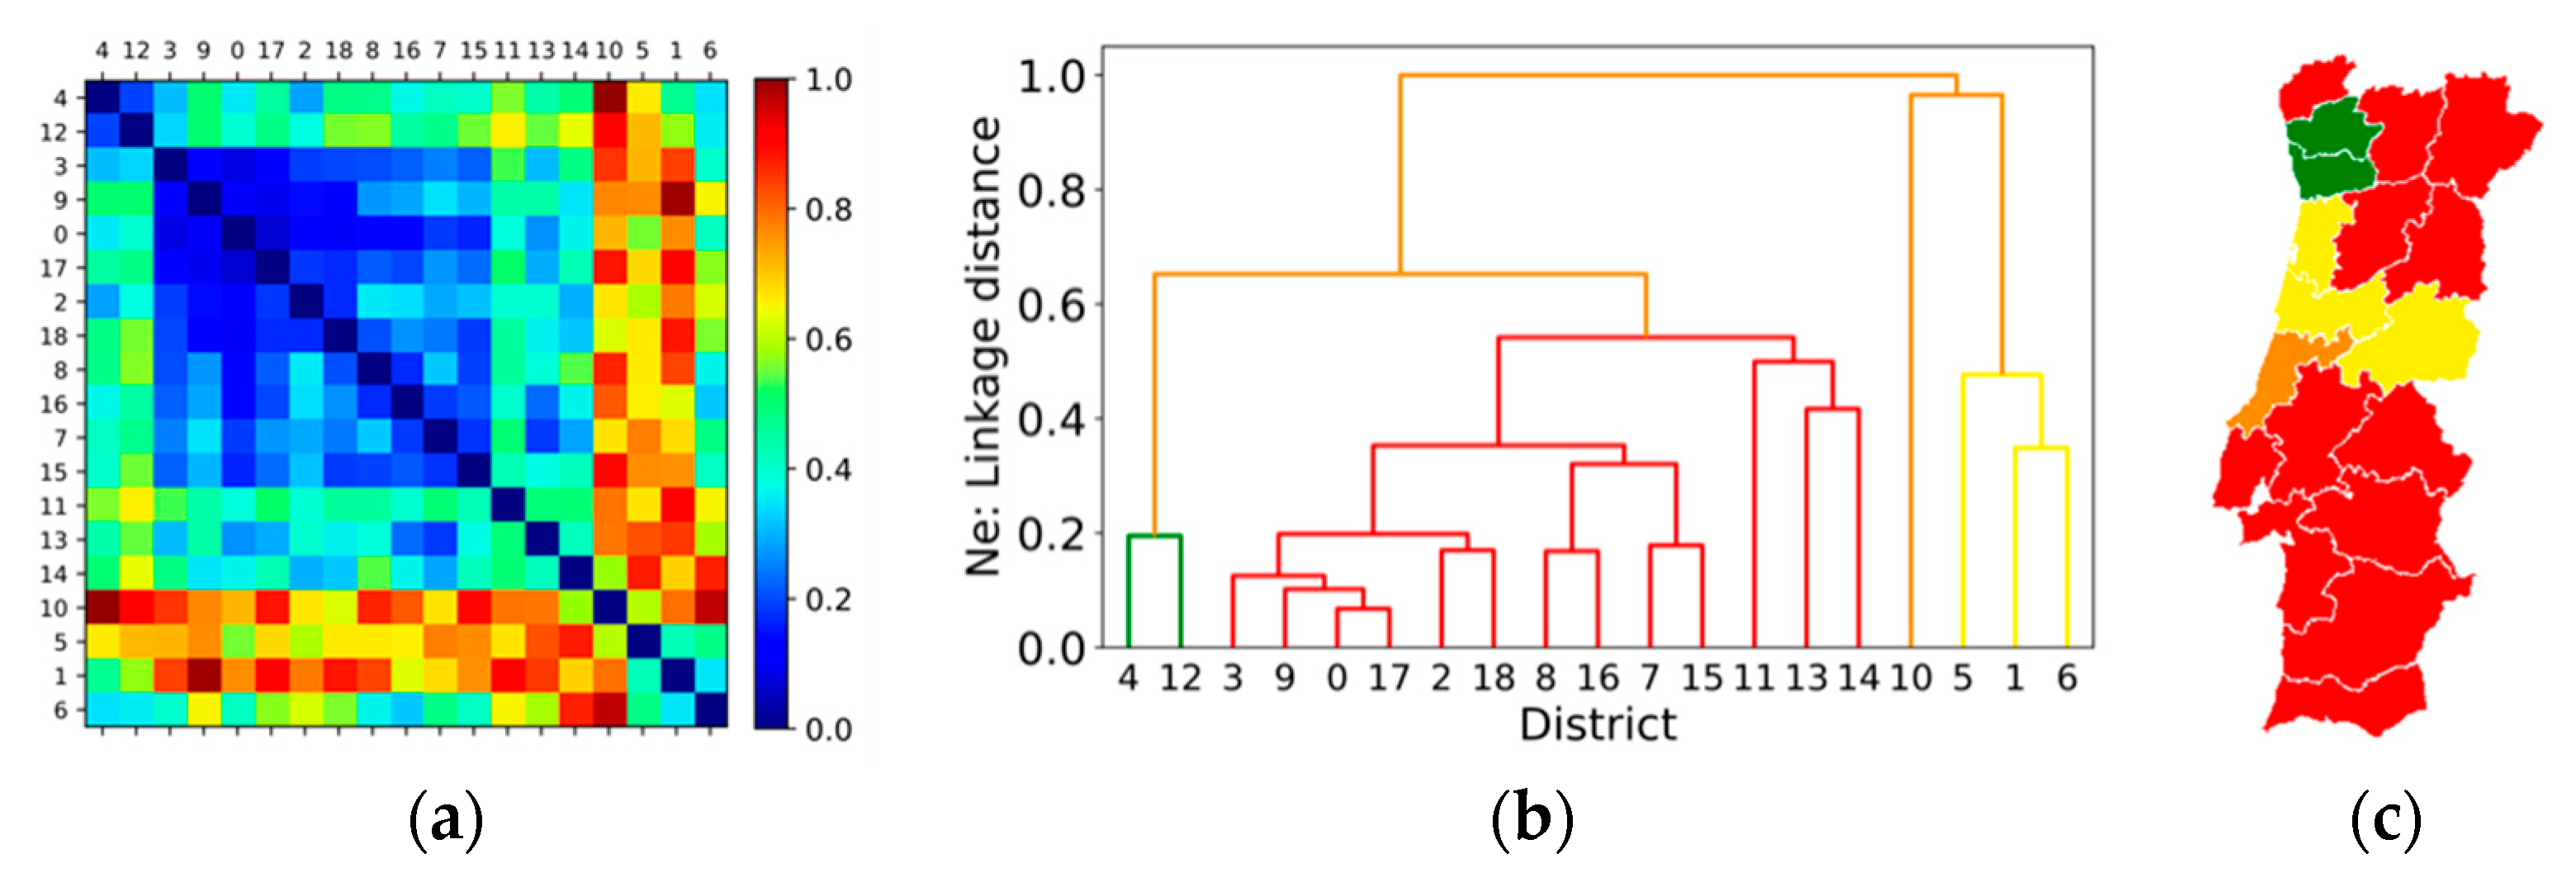
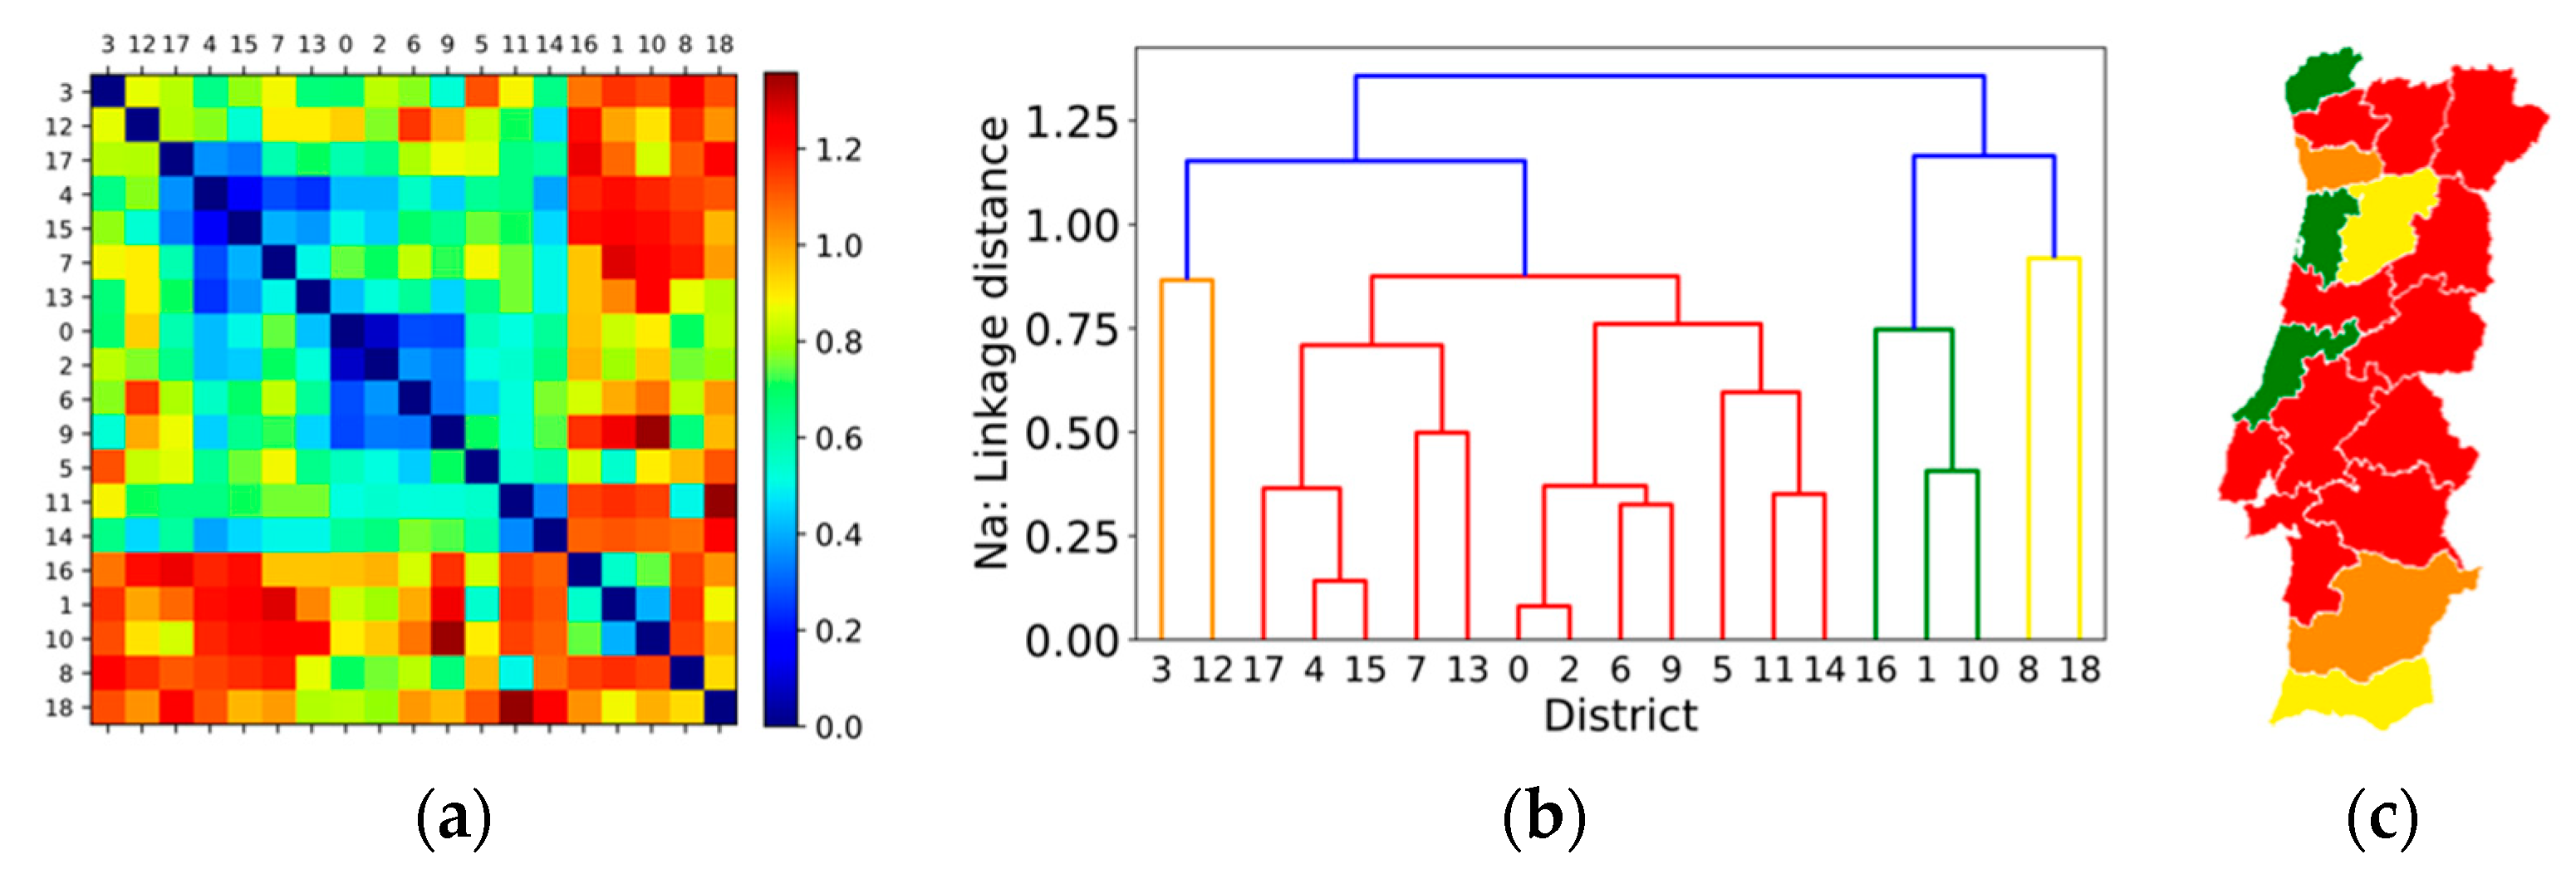
Regarding naturally ignited forest fires (Figure 14), the districts most affected in the last two decades were Braga, Bragança, Castelo Branco, Coimbra, Guarda, Lisboa, Portalegre, Évora, Santarém, Setúbal and Vila Real, with an annual mean of 3.05 ± 1.32% of the total of investigated wildfires. Conversely, Aveiro, Leiria and Viana do Castelo recorded the lowest values, 0.95 ± 0.27%. Viana do Castelo, Aveiro, Leiria, Faro and Viseu show the greatest dissimilarities, as can be seen in the matrix in Figure 14a.
4. Discussion
4.1. Spatial Temporal Occurrence by Type and Motivation
In the period between 1996 and 2015 the total number of fires in the 18 districts of mainland Portugal reached 108,242 ignitions, but this huge number only represents 22% of the total number of occurrences (investigated and non-investigated) reported by ICNF for the analyzed period. In fact, the data available for this study suggests, a priori, that the level of information gathered on the causes that originate fires falls very short of what is desirable. ‘Unknown cause’ due to lack of resources to start and/or to conduct investigations up to the end amounts to an average of 34.5% in the total of investigated occurrences. This figure indicates, however, an improvement on the Portuguese procedure for recording the occurrences of forest fires, since in the last decade Costa et al. [30] reported a value of 75% for unknown ignition sources. The lack of official registration of this type of information has been reported in other Mediterranean countries (e.g., [26,35]).
Despite the constraints mentioned above in terms of data quality, the performed analysis shows that negligent and deliberate causes assume a very significant relevance in the investigated fires. In fact, in Portugal, wildfires are mainly caused by human negligence or human intent (arson and deliberate incendiarism). These results were highlighted by several authors [11,24,30,36,37], who found that around 97% of investigated fires are human-caused. Moreover, significant spatial contrast was detected in the number and causes of wildfires. On this subject, Nunes et al. [10] identified both topography and population density as the most relevant municipal drivers of ignitions in Portuguese forests. However, population density seems to play a double role in NO: although greater population density leads to a higher number of fires it is also commonly associated with districts with a suitable number of fire fighters’ facilities that allow a quick response in case of emergency. Considering this, an in-depth analysis of the spatial distribution of NO is convenient. On the other hand, the high number of NO in mainland Portugal is not necessarily found in the districts with a higher total forested area [30]. Several works and reports note that, depending on the social, economic and cultural context of a given region, the causes of forest fire ignition may differ spatially from country to country and from region to region, within the same country [28]. As an example, the use of fire for the renewal of shrub pastures in mountain grazing areas and in recreation activities has a strong impact on wildfire occurrence [9,21,38,39].
Rekindles of fires, which represent more than 14% of known causes, is also a wildfire problem. This number can be as high as 30% in some districts. According to Beighley and Hyde [40], the main reasons are: first, a volunteer firefighter culture of only using hoses and water, staying on roads, and not using hand tools; second, too many daily fires forcing brigades to move prematurely from one first intervention action to another and not checking suppressed fires to make sure they are properly extinguished.
In this context, understanding the underlying patterns of forest fires in terms of their spatiotemporal distribution could help the decision makers to take preventive measures beforehand, by identifying potential hazards and deciding on strategies for fire prevention, detection and suppression.
4.2. The Performance of the Used Methodology
Forest fires were studied using classical statistical tools. However, these methods have limitations, both terms of in capturing all the features underlying the dynamics of forest fires, and with respect to the evolution over time. Forest fire dynamics have correlations in size, space and time. Size-frequency distributions expose long-range memory, which is typical in complex systems. Correlation between data is characterized by self-similarity and the absence of a characteristic length-scale, meaning that forest fires exhibit power-law (PL) behavior.
This study hopes to contribute to the literature for making better decisions in the selection of appropriate cluster methods by using subgroup sizes, variable numbers, subgroup means and variances.
5. Conclusions
The data available on NO in mainland Portugal in the period 1996 to 2015 showed three regions that had distinctive behavior over those two decades. In relation to the investigated fires, three clusters were identified: (i) the northwest, (ii) the northeast; and (iii) the center and south regions. The analysis of the NO ignition sources revealed that human activities, either deliberate or negligent, are predominant, rather than natural phenomena such us storms. In both the northern and central regions, the NO was predominant: 20.4% due to deliberate causes and 29.9% due to negligent use of fire. The huge percentage of unknown information in relation to the origin of forest fires (34.5%) highlights a serious weakness in terms of the level of information gathered and emphasizes the need to improve the data registration process.
A better understanding of the variations in causes of forest fires throughout Portugal will improve fire risk management, fire prevention planning, and firefighting. Analysis at district level can help define priorities in different areas in order to design appropriate prevention measures and improve the effectiveness of fire prevention; equally, it supports environmental and civil protection policies such as the allocation of firefighting resources.
Considering that the public authorities are largely responsible for that task, a political decision on increasing both human and technological resources to allocate to the data collection stage is pertinent. In addition, and given that the regional incidence of fire ignitions differs from district to district and also varies with respect to the type of ignition, different actions targeting specific audiences must be considered. In this context, the district fire management plans should contain planning actions that support the district strategy actions to prevent and control forest fires with tactics to secure people’s participation. As an example, we dare to recommend the development of special educational programs for the population in general. This would seem to be an appropriate approach in districts where deliberate and negligent ignitions are predominant. Furthermore, the development of special programs on the use of controlled fire techniques for the purposes of soil clearing, and forest and pasture renewal should be implemented more effectively in order to guide farmers in those districts where natural ignitions are predominant.
Author Contributions
A.C.M.C. and A.S. carried out the data inventory and analyzed the data; A.C.M.C. and A.N. wrote the manuscript and L.L. revised the data analysis and improved the manuscript. All authors have read and agreed to the published version of the manuscript.
Funding
This research was partially funded by CERENA (strategic project FCT-UID/ECI/04028/2019) and CEGOT (FCT-UID/GEO/04084/2013) and partially co-financed by the European Regional Development Fund (ERDF) through the COMPETE 2020—Operational Programme Competitiveness and Internationalization (POCI).
Conflicts of Interest
The authors declare no conflict of interest.
References
- Naveh, Z. The evolutionary significance of fire in the Mediterranean region. Vegetation 1975, 29, 199–208. [Google Scholar] [CrossRef]
- Pausas, J.G.; Keeley, J.E. A burning story: The role of fire in the history of life. Bioscience 2009, 59, 593–601. [Google Scholar] [CrossRef] [Green Version]
- Hoinka, K.P.; Carvalho, A.; Miranda, A.I. Regional-scale patterns and wildland fires in central Portugal. Int. J. Wildland Fire 2009, 18, 36–49. [Google Scholar] [CrossRef] [Green Version]
- Tedim, F.; Remelgado, R.; Borges, C.; Carvalho, S.; Martins, J. Exploring the occurrence of mega-fires in Portugal. For. Ecol. Manag. 2013, 294, 86–96. [Google Scholar] [CrossRef]
- Moreno, M.V.; Conedera, M.; Chuvieco, E. Fire regime changes and major driving forces in Spain from 1968 to 2010. Environ. Sci. Policy 2014, 37, 11–22. [Google Scholar] [CrossRef]
- Venäläinen, A.; Korhonen, N.; Hyvärinen, O.; Koutsias, N.; Xystrakis, F.; Urbieta, I.R.; Moreno, J.M. Temporal variations and change in forest fire danger in Europe for 1960–2012. Nat. Hazards Earth Syst. Sci. 2014, 14, 1477–1490. [Google Scholar] [CrossRef] [Green Version]
- Sebastián-López, A.; Salvador-Civil, R.; Gonzalo-Jiménez, J.; SanMiguel-Ayanz, J. Integration of socio-economic and environmental variables for modelling long-term fire danger in Southern Europe. Eur. J. For. Res. 2008, 127, 149–163. [Google Scholar] [CrossRef]
- Carmo, M.; Moreira, F.; Casimiro, P.; Vaz, P. Land use and topography influences on wildfire occurrence in northern Portugal. Landsc. Urban Plan. 2011, 100, 169–176. [Google Scholar] [CrossRef] [Green Version]
- Moreira, F.; Viedma, O.; Arianoutsou, M.; Curt, T.; Koutsias, N.; Rigolot, E.; Barbati, A.; Corona, P.; Vaz, P.; Xanthopoulos, G.; et al. Landscape-wildfire interactions in southern Europe: Implications for landscape management. J. Environ. Manag. 2011, 92, 2389–2402. [Google Scholar] [CrossRef] [Green Version]
- Nunes, A.N.; Lourenço, L.; Meira-castro, A.C. Exploring spatial patterns and drivers of forest fires in Portugal (1980–2014). Sci. Total Environ. 2016, 573, 1190–1202. [Google Scholar] [CrossRef]
- Parente, J.; Pereira, M.G.; Amraoui, M.; Tedim, F. Negligent and intentional fires in Portugal: Spatial distribution characterization. Sci. Total Environ. 2017, 624, 424–437. [Google Scholar] [CrossRef] [PubMed] [Green Version]
- Chuvieco, E.; Justice, C. Relations between human factors and global fire activity. In Advances in Earth Observation of Global Change; Chuvieco, E., Li, J., Yang, X., Eds.; Springer: London, UK, 2010; pp. 187–199. [Google Scholar]
- Trigo, R.M.; Pereira, J.M.C.; Pereira, M.G.; Mota, B.; Calado, T.J.; Câmara, C.C.; Espirito, S.F. Atmospheric conditions associated with the exceptional fire season of 2003 in Portugal. Int. J. Climatol. 2006, 26, 1741–1757. [Google Scholar] [CrossRef]
- Carvalho, A.; Flannigan, M.D.; Logan, K.; Miranda, A.I.; Borrego, C. Fire activity in Portugal and its relationship to weather and the Canadian Fire Weather Index System. Int. J. Wildland Fire 2008, 17, 328–338. [Google Scholar] [CrossRef]
- Ferreira-Leite, F.; Bento-Gonçalves, A.; Lourenço, L.; Úbeda, X.; Vieira, A. Grandes Incêndios Florestais em Portugal Continental como Resultado das Perturbações nos Regimes de Fogo no Mundo Mediterrâneo. Silva Lusit. 2013, 21, 127–142. [Google Scholar]
- Viegas, D.X. Forest fires in Portugal in 2005—an overview. Int. For. Fire News 2006, 34, 22–30. [Google Scholar]
- Alves, A.A.; Devy-Vareta, N.; Oliveira, A.; Pereira, J.S. A floresta e o fogo através dos tempos. In Incêndios Florestais em Portugal: Caracterização, Impactes e Prevenção; ISA Press: Lisboa, Portugal, 2006; pp. 15–40. [Google Scholar]
- Nunes, A.N. Regional variability and driving forces behind forest fires in Portugal an overview of the last three decades (1980–2009). Appl. Geogr. 2012, 34, 576–586. [Google Scholar] [CrossRef]
- Nunes, A.; Lourenço, L. Increased vulnerability to wildfires and post fire hydro-geomorphic processes in Portuguese mountain regions: What has changed? Example of Piódão and Pomares basins. Open Agric. 2017, 2, 70–82. [Google Scholar]
- Lourenço, L. Aspetos socioeconómicos dos incêndios florestais em Portugal. Biblos 1991, LXVII, 373–385. [Google Scholar]
- Meira-Castro, A.; Bento-Gonçalves, A.; Vieira, A.; Lourenço, L.; Fernandes, S.; Nunes, A. Forest fires occurrences and burned area in mainland Portugal: Preliminary assessment to a fifteen years period. Flamma 2015, 6, 90–94. [Google Scholar]
- Vélez, R. High intensity forest fires in the Mediterranean Bassin: Natural and socioeconomic causes. Disaster Manag. 1993, 5, 16–21. [Google Scholar]
- Andrienko, G.; Andrienko, N.; Long, M.; Ganteaume, A.; Lampin-Maillet, C.; Jappiot, M.; Meira-Castro, A.; Lourenço, L.; Bento-Gonçalves, A. Analysis of fire causes spatial and temporal distribution in Europe and identification of the main driving factors (Final); Deliverable D 5.2. Contract number 384 340; European Commission-JRC: Brussels, Belgium, 2010; p. 148. [Google Scholar]
- Lourenço, L.; Fernandes, S.; Bento-Gonçalves, A.; Castro, A.; Nunes, A.; Vieira, A. Causas de incêndios florestais em Portugal continental. Análise estatística da investigação efetuada no último quindénio (1996 a 2010). Cad. Geogr. 2012, 30–31, 61–81. [Google Scholar]
- Oliveira, S.; Pereira, M.C.; San-Miguel-Ayanz, J.; Lourenço, L. Exploring the spatial patterns of fire density in Southern Europe using Geographically Weighted regression. Appl. Geogr. 2014, 51, 143–157. [Google Scholar] [CrossRef]
- San-Miguel-Ayanz, J.; Durrant, T.; Boca, R.; Libertà, G.; Boccacci, F.; Leo, M.; Pérez, J.L.; Schulte, E. Forest Fires in Europe, Middle East and North Africa 2015; EUR 28158 EN; EU publications: Brussels, Belgium, 2016.
- Lovreglio, R.; Leone, V.; Giaquinto, P.; Notarnicola, A. New tools for the analysis of fire causes and their motivations: The Delphi technique. For. Ecol. Manag. 2006, 234, 18–33. [Google Scholar] [CrossRef]
- Ganteaume, A.; Camia, A.; Jappiot, M.; San Miguel-Ayanz, J.; Long-Fournel, M.; Lampin, C. A review of the main driving factors of forest fire ignition over Europe. Environ. Manag. 2013, 51, 651–662. [Google Scholar] [CrossRef] [Green Version]
- Camia, A.; Durrant, T.; San-Miguel, J. Harmonized classification scheme of fire causes in the EU adopted for the European Fire Database of EFFIS; Publications Office of the European Union: Brussels, Belgium, 2013.
- Costa, L.; Badeck, F.; Thonicke, K. Sensitivity of Portuguese Forest Fires to Land Use and Climatic Factors. In Proceedings of the International conference Wildfire, Sevilla, Spain, 14–17 May 2007; Available online: https://gfmc.online/doc/cd/SESIONES_TEMATICAS/ST1/Costa_et_al_GERMANY_PT.pdf (accessed on 27 January 2020).
- Rego, F.C. Land use changes and wildfires. In Responses of Forest Ecosystems to Environmental Changes; Teller, A., Mathy, P., Jeffers, J.N.R., Eds.; Elsevier Applied Science: London, UK, 1992; pp. 367–373. [Google Scholar]
- Hair, J.F.; Black, W.C.; Babin, B.J.; Anderson, R.E. Multivariate Data analysis, 7th ed.; Pearson Prentice Hall: New Jersey, NJ, USA, 2014. [Google Scholar]
- Saraçli, S.; Doğan, N.; Doğan, İ. Comparison of hierarchical cluster analysis methods by cophenetic correlation. J. Inequalities Appl. 2013, 203. [Google Scholar] [CrossRef]
- Sokal, R.R.; Rohlf, F.J. The comparison of dendrograms by objective methods. Taxon 1962, 11, 33–40. [Google Scholar] [CrossRef]
- Martinez, J.; Vega-Garcia, C.; Chuvieco, E. Human-caused wildfire risk rating for prevention planning in Spain. J. Environ. Manag. 2009, 90, 1241–1252. [Google Scholar] [CrossRef]
- Lourenço, L.; Fernandes, S.; Nunes, A.; Bento-Gonçalves, A.; Vieira, A. Determination of forest fire causes in Portugal (1996–2010). Flamma 2013, 4, 171–175. [Google Scholar]
- Nunes, A.; Lourenço, L.; Fernandes, S.; Meira-Castro, A.C. Principais causas dos incêndios florestais em Portugal: Variação espacial no período 2001/12. Territorium. 2014, 21, 135–146. [Google Scholar] [CrossRef] [Green Version]
- Leone, V.; Lovreglio, R.; Martín, M.P.; Martínez, J.; Vilar, L. Human factors of fire occurrence in the Mediterranean. In Earth Observation of Wildland Fires in Mediterranean Ecosystems; Chuvieco, E., Ed.; Springer-Verlag: Heidelberg, Berlin, 2009; pp. 149–170. [Google Scholar]
- Koutsias, N.; Martinez-Fernandez, J.; Allgower, B. Do factors causing wildfires vary in space? Evidence from geographically weighted regression. GIScience Remote Sens. 2010, 47, 221–240. [Google Scholar] [CrossRef]
- Beighley, M.; Hyde, A.C. Portugal Wildfire Management in a New Era. Assessing Fire Risks, Resources and Reforms. 2018. Available online: https://www.isa.ulisboa.pt/files/cef/pub/articles/2018-04/2018_Portugal_Wildfire_Management_in_a_New_Era_Engish.pdf (accessed on 20 April 2019).
Figure 1.
Mainland Portugal: (a) Variation in altitude; (b) Percentage of population variation by district, between 1950 and 2011.
Figure 1.
Mainland Portugal: (a) Variation in altitude; (b) Percentage of population variation by district, between 1950 and 2011.

Figure 2.
Occurrences in mainland Portugal from 1996 to 2015: (a) Total for two decades; (b) Annual profile of Total occurrences (TOc), Total burns (TB), Total forest fires with burned area greater than 1 ha (TF), Total forest fires with burned area less than 1 ha (A), and Total forest fires with burned area greater than 1 ha and whose cause was investigated (TIF); (b) Cumulative occurrences.

Figure 3.
Spatial distribution of Total occurrences (TOc): (a) Distribution by district; (b) Clusters by annual profile of distribution; (c) Clusters in geographic location (cophenetic coefficient: 0.88).
Figure 3.
Spatial distribution of Total occurrences (TOc): (a) Distribution by district; (b) Clusters by annual profile of distribution; (c) Clusters in geographic location (cophenetic coefficient: 0.88).

Figure 4.
Spatial distribution of Total burns (TB: (a) Distribution by district; (b) Clusters by annual profile of distribution; (c) Clusters in geographic location (cophenetic coefficient: 0.87).
Figure 4.
Spatial distribution of Total burns (TB: (a) Distribution by district; (b) Clusters by annual profile of distribution; (c) Clusters in geographic location (cophenetic coefficient: 0.87).

Figure 5.
Spatial distribution of Total forest fires with burned area less than 1 ha (A): (a) Distribution by district; (b) Clusters by annual profile of distribution; (c) Clusters in geographical location (cophenetic coefficient: 0.94).
Figure 5.
Spatial distribution of Total forest fires with burned area less than 1 ha (A): (a) Distribution by district; (b) Clusters by annual profile of distribution; (c) Clusters in geographical location (cophenetic coefficient: 0.94).

Figure 6.
Spatial distribution of Total forest fires with burned area greater than 1 ha (TF): (a) Distribution by district; (b) Clusters by annual profile of distribution; (c) Clusters in geographic location (cophenetic coefficient: 0.85).
Figure 6.
Spatial distribution of Total forest fires with burned area greater than 1 ha (TF): (a) Distribution by district; (b) Clusters by annual profile of distribution; (c) Clusters in geographic location (cophenetic coefficient: 0.85).

Figure 7.
Spatial distribution of Total forest fires with burned area greater than 1 ha and whose cause was investigated (TIF): (a) Distribution by district; (b) Clusters by annual profile of distribution; (c) Clusters in geographic location (cophenetic coefficient: 0.87).
Figure 7.
Spatial distribution of Total forest fires with burned area greater than 1 ha and whose cause was investigated (TIF): (a) Distribution by district; (b) Clusters by annual profile of distribution; (c) Clusters in geographic location (cophenetic coefficient: 0.87).

Figure 8.
Ability to respond to requests: (a) Dissimilarity matrix based on Spearman correlation coefficient; (b) Clusters by annual profile distribution of TIF in relation to TF; (c) Clusters in geographic location (cophenetic coefficient: 0.76).
Figure 8.
Ability to respond to requests: (a) Dissimilarity matrix based on Spearman correlation coefficient; (b) Clusters by annual profile distribution of TIF in relation to TF; (c) Clusters in geographic location (cophenetic coefficient: 0.76).

Figure 9.
Causes of fires in mainland Portugal; (a) Relative proportion of each cause in investigated fires; (b) Annual distribution of fires by cause.
Figure 9.
Causes of fires in mainland Portugal; (a) Relative proportion of each cause in investigated fires; (b) Annual distribution of fires by cause.

Figure 10.
Unknown causes (Un): (a) Dissimilarity matrix; (b) Clusters by relative annual profile of distribution; (c) Clusters in geographic location (cophenetic coefficient: 0.74).
Figure 10.
Unknown causes (Un): (a) Dissimilarity matrix; (b) Clusters by relative annual profile of distribution; (c) Clusters in geographic location (cophenetic coefficient: 0.74).

Figure 11.
Negligent causes (Ne): (a) Dissimilarity matrix; (b) Clusters by relative annual profile of distribution; (c) Clusters in geographic location (cophenetic coefficient: 0.86).
Figure 11.
Negligent causes (Ne): (a) Dissimilarity matrix; (b) Clusters by relative annual profile of distribution; (c) Clusters in geographic location (cophenetic coefficient: 0.86).

Figure 12.
Deliberate causes (In): (a) Dissimilarity matrix; (b) Clusters by relative annual profile of distribution; (c) Clusters in geographic location (cophenetic coefficient: 0.72).
Figure 12.
Deliberate causes (In): (a) Dissimilarity matrix; (b) Clusters by relative annual profile of distribution; (c) Clusters in geographic location (cophenetic coefficient: 0.72).

Figure 13.
Reactivations (Re): (a) Dissimilarity matrix; (b) Clusters by relative annual profile of distribution; (c) Clusters in geographic location (cophenetic coefficient: 0.79).
Figure 13.
Reactivations (Re): (a) Dissimilarity matrix; (b) Clusters by relative annual profile of distribution; (c) Clusters in geographic location (cophenetic coefficient: 0.79).

Figure 14.
Natural causes (Na): (a) Dissimilarity matrix; (b) Clusters by relative annual profile of distribution; (c) Clusters in geographic location (cophenetic coefficient: 0.81).
Figure 14.
Natural causes (Na): (a) Dissimilarity matrix; (b) Clusters by relative annual profile of distribution; (c) Clusters in geographic location (cophenetic coefficient: 0.81).


Table 1.
Classifications of causes of forest fires.
| Unknown | (Un) | absence of sufficient objective evidence to determine the cause of the ignition of fire |
| Natural | (Na) | lightning generated in thunderstorms |
| Negligence | (Ne) | the misguided use of fire in activities such as burning trash, mass burning of agricultural and forest fuels, fun and leisure activities; failure to properly extinguish cigarettes by smokers; the dispersal and transport of incandescent particles from chimneys; etc. |
| Intentional | (In) | incendiarism and arson, mostly resulting from behaviors and attitudes reacting to the constraints of agroforestry management systems and to conflicts related to land use |
| Reactivations | (Re) | reburning of an area over which a fire has previously passed, but where fuel has been left that is later ignited by latent heat, sparks, or embers |
Table 2.
District reference numbers.
| (0) Portugal | (5) Coimbra | (10) Leiria | (15) Santarém |
| (1) Aveiro | (6) Castelo Branco | (11) Lisboa | (16) Viana do Castelo |
| (2) Bragança | (7) Évora | (12) Porto | (17) Vila Real |
| (3) Beja | (8) Faro | (13) Portalegre | (18) Viseu |
| (4) Braga | (9) Guarda | (14) Setúbal |
© 2020 by the authors. Licensee MDPI, Basel, Switzerland. This article is an open access article distributed under the terms and conditions of the Creative Commons Attribution (CC BY) license (http://creativecommons.org/licenses/by/4.0/).
Share and Cite
MDPI and ACS Style
Meira Castro, A.C.; Nunes, A.; Sousa, A.; Lourenço, L. Mapping the Causes of Forest Fires in Portugal by Clustering Analysis. Geosciences 2020, 10, 53. https://doi.org/10.3390/geosciences10020053
AMA Style
Meira Castro AC, Nunes A, Sousa A, Lourenço L. Mapping the Causes of Forest Fires in Portugal by Clustering Analysis. Geosciences. 2020; 10(2):53. https://doi.org/10.3390/geosciences10020053
Chicago/Turabian StyleMeira Castro, Ana C., Adélia Nunes, António Sousa, and Luciano Lourenço. 2020. "Mapping the Causes of Forest Fires in Portugal by Clustering Analysis" Geosciences 10, no. 2: 53. https://doi.org/10.3390/geosciences10020053
Note that from the first issue of 2016, this journal uses article numbers instead of page numbers. See further details here.