Article

Domestication over Speciation in Allopolyploid Cotton Species: A Stronger Transcriptomic Pull

by
Josef J. Jareczek
1,2,†,
Corrinne E. Grover
1,†,
Guanjing Hu
3,4,
Xianpeng Xiong
4,
Mark A. Arick II
5,
Daniel G. Peterson
5 and
Jonathan F. Wendel
1,*
1
Ecology, Evolution, and Organismal Biology Department, Iowa State University, Ames, IA 50010, USA
2
Biology Department, Bellarmine University, Louisville, KY 40205, USA
3
State Key Laboratory of Cotton Biology, Institute of Cotton Research, Chinese Academy of Agricultural Sciences, Anyang 455000, China
4
Shenzhen Branch, Guangdong Laboratory of Lingnan Modern Agriculture, Key Laboratory of Synthetic Biology, Ministry of Agriculture and Rural Affairs, Agricultural Genomics Institute at Shenzhen, Chinese Academy of Agricultural Sciences, Shenzhen 518120, China
5
Institute for Genomics, Biocomputing & Biotechnology, Mississippi State University, Mississippi State, MS 39762, USA
*
Author to whom correspondence should be addressed.
These authors contributed equally to this work.
Genes 2023, 14(6), 1301; https://doi.org/10.3390/genes14061301
Submission received: 15 May 2023 / Revised: 13 June 2023 / Accepted: 13 June 2023 / Published: 20 June 2023
(This article belongs to the Special Issue Cotton Genes, Genetics, and Genomics)

Abstract

:
Cotton has been domesticated independently four times for its fiber, but the genomic targets of selection during each domestication event are mostly unknown. Comparative analysis of the transcriptome during cotton fiber development in wild and cultivated materials holds promise for revealing how independent domestications led to the superficially similar modern cotton fiber phenotype in upland (G. hirsutum) and Pima (G. barbadense) cotton cultivars. Here we examined the fiber transcriptomes of both wild and domesticated G. hirsutum and G. barbadense to compare the effects of speciation versus domestication, performing differential gene expression analysis and coexpression network analysis at four developmental timepoints (5, 10, 15, or 20 days after flowering) spanning primary and secondary wall synthesis. These analyses revealed extensive differential expression between species, timepoints, domestication states, and particularly the intersection of domestication and species. Differential expression was higher when comparing domesticated accessions of the two species than between the wild, indicating that domestication had a greater impact on the transcriptome than speciation. Network analysis showed significant interspecific differences in coexpression network topology, module membership, and connectivity. Despite these differences, some modules or module functions were subject to parallel domestication in both species. Taken together, these results indicate that independent domestication led G. hirsutum and G. barbadense down unique pathways but that it also leveraged similar modules of coexpression to arrive at similar domesticated phenotypes.

1. Introduction

Domestication of wild plants and animals has been a prominent feature of human history for thousands of years, leading to the expansion of civilizations worldwide [1]. Many plant and animal species have been domesticated by humans, from food, labor, and companion animals to the crop species that make up the backbone of modern agriculture [1,2,3]. Crops, in particular, have been instrumental in human history, with cereal grains such as barley, wheat, and rice kickstarting the transition to an agricultural society. When viewed through a scientific lens, domestication provides an opportunity to explore evolution on a telescoped timescale. The strong directional selection that species undergo during domestication causes phenotypic changes within thousands of years rather than millions [2,4,5,6,7,8,9]. Examining the impact of domestication on genomes, transcriptomes, proteomes, and the other -omes can illuminate how they have responded to human selection, which in turn provides insight into how these processes might operate in natural settings for non-domesticated plants and animals.
A common observation is that domesticated plants exhibit similar phenotypic responses to similar selection pressures [9,10,11]. Fruit size and yield tend to increase, plant size and architecture become modified to permit compact planting, and plants acquire day-length neutrality in flowering to facilitate broader habitats and synchronized harvest, as seen in maize, cotton, rice, and dozens of other plant species [4,5,12,13,14,15]. Domestication is not without its problematic consequences [16], however, as domesticated plants tend to be more susceptible to diseases and pests, have lower genetic diversity than their wild ancestors due to bottlenecks of the domestication process, and require considerable agricultural inputs. These recurring themes in domesticated plants are of great interest, particularly in plants where closely related taxa have been independently domesticated and, therefore, potentially arrived at similar phenotypes via some mix of parallel and independent genetic changes.
One genus that provides an excellent system to study multiple domestication events is Gossypium, the source of cotton and the most prevalent textile plant in the world [17]. Agronomically, cotton refers to one of four species that were independently domesticated on two continents roughly 5–8 thousand years ago. Notably, the two species that dominate cotton commerce, G. hirsutum (AD1) and G. barbadense (AD2), are allopolyploid, like many crops, meaning they originally had duplicated copies of every gene. Gossypium hirsutum, or Upland cotton, is the most widely grown species, accounting for over 90% of commercially grown cotton globally [17]. Native populations of G. hirsutum are spread across Central America and the Caribbean; the species was most likely domesticated initially in the northern part of the Yucatan Peninsula, from where it spread under domestication throughout Central America, the Caribbean, and much later, the US and globally [18]. Gossypium barbadense, also known as Egyptian cotton or Sea Island cotton, makes up roughly 8% of commercially grown fiber from the two allopolyploid cotton species [17]. Native to and domesticated within coastal Peru west of the Andes, G. barbadense expanded into northern South America, Central America, the Caribbean and the Pacific [18,19,20,21]. Several features distinguish the two allopolyploids, with G. hirsutum able to tolerate a wider range of habitats and with a higher yield, and the two species differing in pest and disease severities. Gossypium barbadense has longer, stronger, and finer fiber and is therefore grown more for luxury textiles (colloquially known as “Pima” or “Egyptian” cotton) despite its lower yield. As the world’s foremost textile crops, these two species are the subject of considerable study and efforts at crop improvement, including intentional and unintentional interspecific hybridization. This introgression has occurred many times in both directions, with the goal of producing varieties that possess the positive traits of both G. hirsutum and G. barbadense, i.e., are relatively hardy and easy to cultivate, and are high-yielding with long, strong, fine fiber [18,20,22,23,24,25].
Despite the importance of cotton to the global economy, the genomic targets of selection and their effects on the domesticated cotton phenotype (day length neutrality, longer, stronger fiber, higher yield, etc.) are mostly unknown. Low genetic diversity is present in wild and domesticated accessions of both species [18,20,22], and the genome-wide targets of domestication are not well understood [18,26]. Comparative transcriptomics has the potential to reveal the targets of selection without the necessity of large-scale GWAS studies or selection screens, thus forming a complementary approach for understanding the mechanisms of domestication. Previously, the cotton fiber transcriptome was evaluated at key timepoints between wild and domesticated G. hirsutum [27] or between cultivars of G. hirsutum and G. barbadense [28,29]. Other analyses have been used to evaluate key genes and/or modules in cotton fiber development between different domesticated accessions or domesticated-derived mutants [30,31,32,33,34,35,36,37,38,39,40]. This study examines the transcriptome of developing fiber in G. barbadense at important developmental time points that mirror those previously analyzed [27]. Comparisons were made between these time points, domestication states, and G. hirsutum using differential gene expression analysis. Because genes operate in the context of entire networks of genes, we also employed network analysis, allowing insight into how domestication has altered the fiber transcriptome on several levels. This approach offers the opportunity to explore whether selection has differentially operated on various components of the fiber coexpression network in each species and under parallel domestication.
This study addresses two primary questions: (1) How has the transcriptome been altered by the natural process of speciation, playing out over almost a million years, versus domestication, on the timescale of 5000–8000 years? (2) How have the coexpression networks of these two species changed over time in terms of module preservation, membership, and connectivity? Our analyses supported several novel conclusions. First, G. barbadense has lower differential gene expression than G. hirsutum and fewer significant modules, potentially indicating a more canalized development program. Second, gene expression differences between domesticated types of G. hirsutum and G. barbadense are greater than between wild forms of the two species, indicating that selection increased expression divergence, even with interspecific gene flow. Third, whereas most coexpression network modules differ between species, there is evidence of parallel selection between the two species. Fourth, modules are not well-preserved between species, indicating a high level of divergence in fiber coexpression networks, which was also increased by domestication. Our results reveal the extraordinary divergence in the transcriptomic underpinnings of the generally similar phenotypes of two independently domesticated cotton species.

2. Materials and Methods

2.1. Plant Material, RNA Extraction and Sequencing

The developing fiber was collected from G. hirsutum and G. barbadense plants grown in the Pohl Conservatory at Iowa State University (Table 1). Plants were grown in 2-gallon pots between 22.2–25.5 °C. Flowers were hand-pollinated and tagged, and bolls were collected at 5, 10, 15, and 20 days post-anthesis (DPA) per species (Supplementary Table S1). A minimum of three biological replicates were collected for each species at each DPA, where replicates were derived from three different accessions for each combination of species and domestication status (Table 1), thereby reducing the influence of accession-specific expression patterns on each comparison. Bolls were pooled at 5 DPA to obtain sufficient material for RNA extraction. Collected ovules were flash-frozen in liquid nitrogen and stored at −80 °C until RNA extraction. The frozen fibers were first ruptured with glass beads and then subjected to RNA extraction using the Sigma Plant Spectrum total RNA kit (Sigma-Aldrich Burlington, Burlington, MA, USA). The extracted RNA samples were further purified using the phenol-chloroform method as previously described [41]. Samples were sent to the Iowa State University DNA facility for quality control (utilizing the Agilent 2100 Bioanalyzer), library construction, and sequencing on the Illumina NovaSeq 6000 to obtain paired-end (PE), 150 nucleotide reads. Raw reads were quality trimmed using trimmomatic version 0.39 [42] from Spack [43] (module trimmomatic/0.39-da5npsr). Specifically, adapter sequences were removed, and reads were quality trimmed to a minimum length of 75 bp; only reads surviving as PE were kept.

2.2. Reference Preparation, Mapping, and Differential Gene Expression Analysis

Species-specific reference transcriptomes were generated using the G. raimondii [44] genome annotation and species-specific SNP information [45] using custom scripts from https://github.com/Wendellab/AD2-vs-AD1 (accessed on 16 June 2023). Read mapping and quantification were performed for each sample relative to its representative transcriptome via Kallisto v0.46.1 [46] using ‘kallisto quant’. Samples with fewer than 1 million (M) reads quantified were excluded from the following data analyses conducted in R/4.2.0 [47]. Using the R package DESeq2 v1.36.0 [48], raw read counts were normalized by applying a variance stabilizing transformation (rld) with the design ‘~species+condition+DPA’, followed by principal component analysis (PCA) via plot PCA. Samples with irregular placement by PCA, potentially representing pre-aborted bolls or mistagged samples, were removed and noted in Supplementary Table S1.
Analyses of differential gene expression (DGE) between species, conditions (representing domestication status), and timepoints were conducted using the simplified design “~group”, where the single factor “group” represented all 16 combinations of the three original factors of “species’’ (G. hirsutum or G. barbadense), “condition” (wild or domesticated), and “DPA” (5, 10, 15, or 20 DPA). Pairwise comparisons were conducted as contrasts between adjacent timepoints in wild and domesticated accessions of the same species (e.g., 10 versus 5 DPA in wild G. barbadense), between wild and domesticated accessions of the same species at a given timepoint (e.g., domesticated versus wild G. barbadense at 5 DPA), and between species at a given timepoint and for a given condition (e.g., wild G. barbadense versus wild G. hirsutum at 5 DPA). In all cases, differential expression was considered significant at a Benjamini-Hochberg [49] adjusted p-value < 0.05. Overlap between species and timepoints was visualized as UpSet diagrams in R using ComplexUpset v1.3.3 [50] and ggplot2 v3.3.6 [51]. Data tables were generated using tidyverse v1.3.1 [52], magrittr v2.0.3 [53], data.table v1.14.2 [54], and DEGreport v1.32.0 [55]. Relevant code is available from https://github.com/Wendellab/AD2-vs-AD1 (accessed on 16 June 2023).

2.3. Weighted Co-Expression Gene Network Analysis

Network analysis was conducted in R using WGCNA [56,57] to build independent weighted gene coexpression networks for G. hirsutum and G. barbadense, as well as construct a meta-network from all samples, as previously described [58]. Briefly, the raw read count data were filtered to remove genes with zero variance and then rld normalized as input to construct a Pearson correlation matrix between all gene pairs. An adjacency matrix was generated from the Pearson correlation matrix to represent gene connection strength. The sum of connection strengths for a gene represents the connectivity of a gene, which indicates how strongly that gene is coexpressed with the other genes in the network. The adjacency matrix was also used to calculate a topological overlap matrix, which measures the strength of coexpression relationships between any two genes with respect to the rest of the network [59]. Genes with highly similar coexpression patterns were clustered into modules [56]. GO enrichment of modules was performed using topGO [60]. Network preservation was measured using Zsummary and medianRank [56] scores built-in WGCNA.

3. Results

3.1. RNA-Seq Sample Quality and Removal

From the 80 G. hirsutum (AD1) samples collected, 39 were removed due to poor read depth, incomplete replication, or unusual placement in the principal component analysis (PCA), the latter perhaps attributable to the occurrence of frequent boll abortion and/or pest damage on G. hirsutum. After sample cleaning, 41 G. hirsutum samples remained with an average of 27 million mapped reads (Supplementary Table S1). Similarly, 18 of the 47 G. barbadense (AD2) samples were removed due to poor read depth, incomplete replication, or unusual placement in the PCA due to the aforementioned boll abortion and/or pest damage. After sample cleaning, 29 G. barbadense samples were retained, with an average of 15.8 million mapped reads. Full sampling information is in Supplementary Table S1.
PCA of expression data for the two species (Supplementary Figure S1A) generally separates developmental timepoints on the first axis (33% of the variance) and species on the second axis (12% variance). As previously observed for G. hirsutum [27] and reiterated here, G. barbadense also displays a general developmental gradient (Supplementary Figure S1B), with early developmental timepoints (i.e., 5 and 10 DPA) generally clustering together and 15 DPA forming a bridge between these and later developmental timepoints (20 and 25 DPA; 25 DPA not displayed). In comparison with timepoint and species, domestication status explains less variance. When examining the single-species PCA results, separate clusters of wild and domesticated samples were evident, especially at the later developmental timepoints of 15 and 20 DPA (Supplementary Figure S1A). Congruent with their status as both independent species and independent domesticates, no interspecific domestication-based clusters are observed.

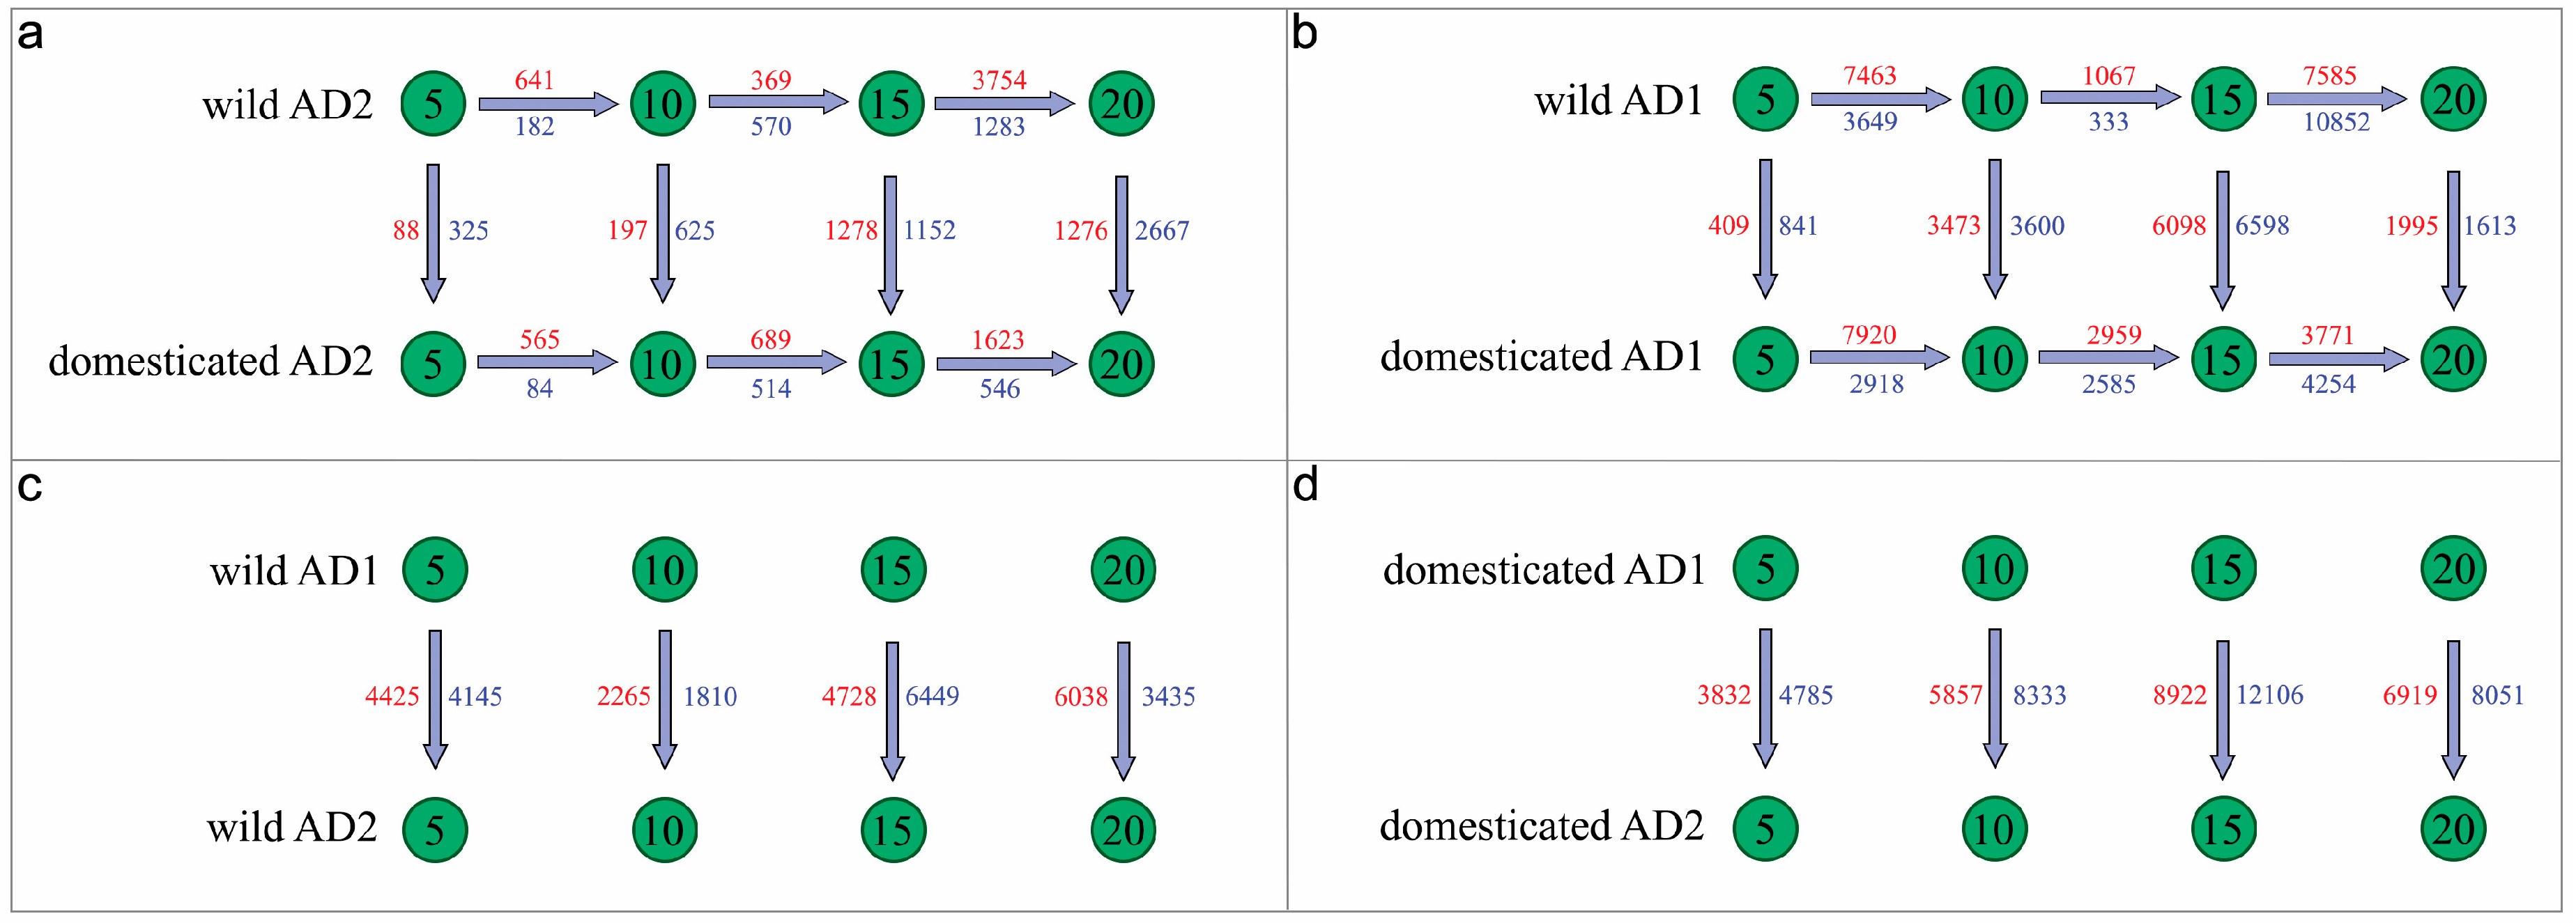
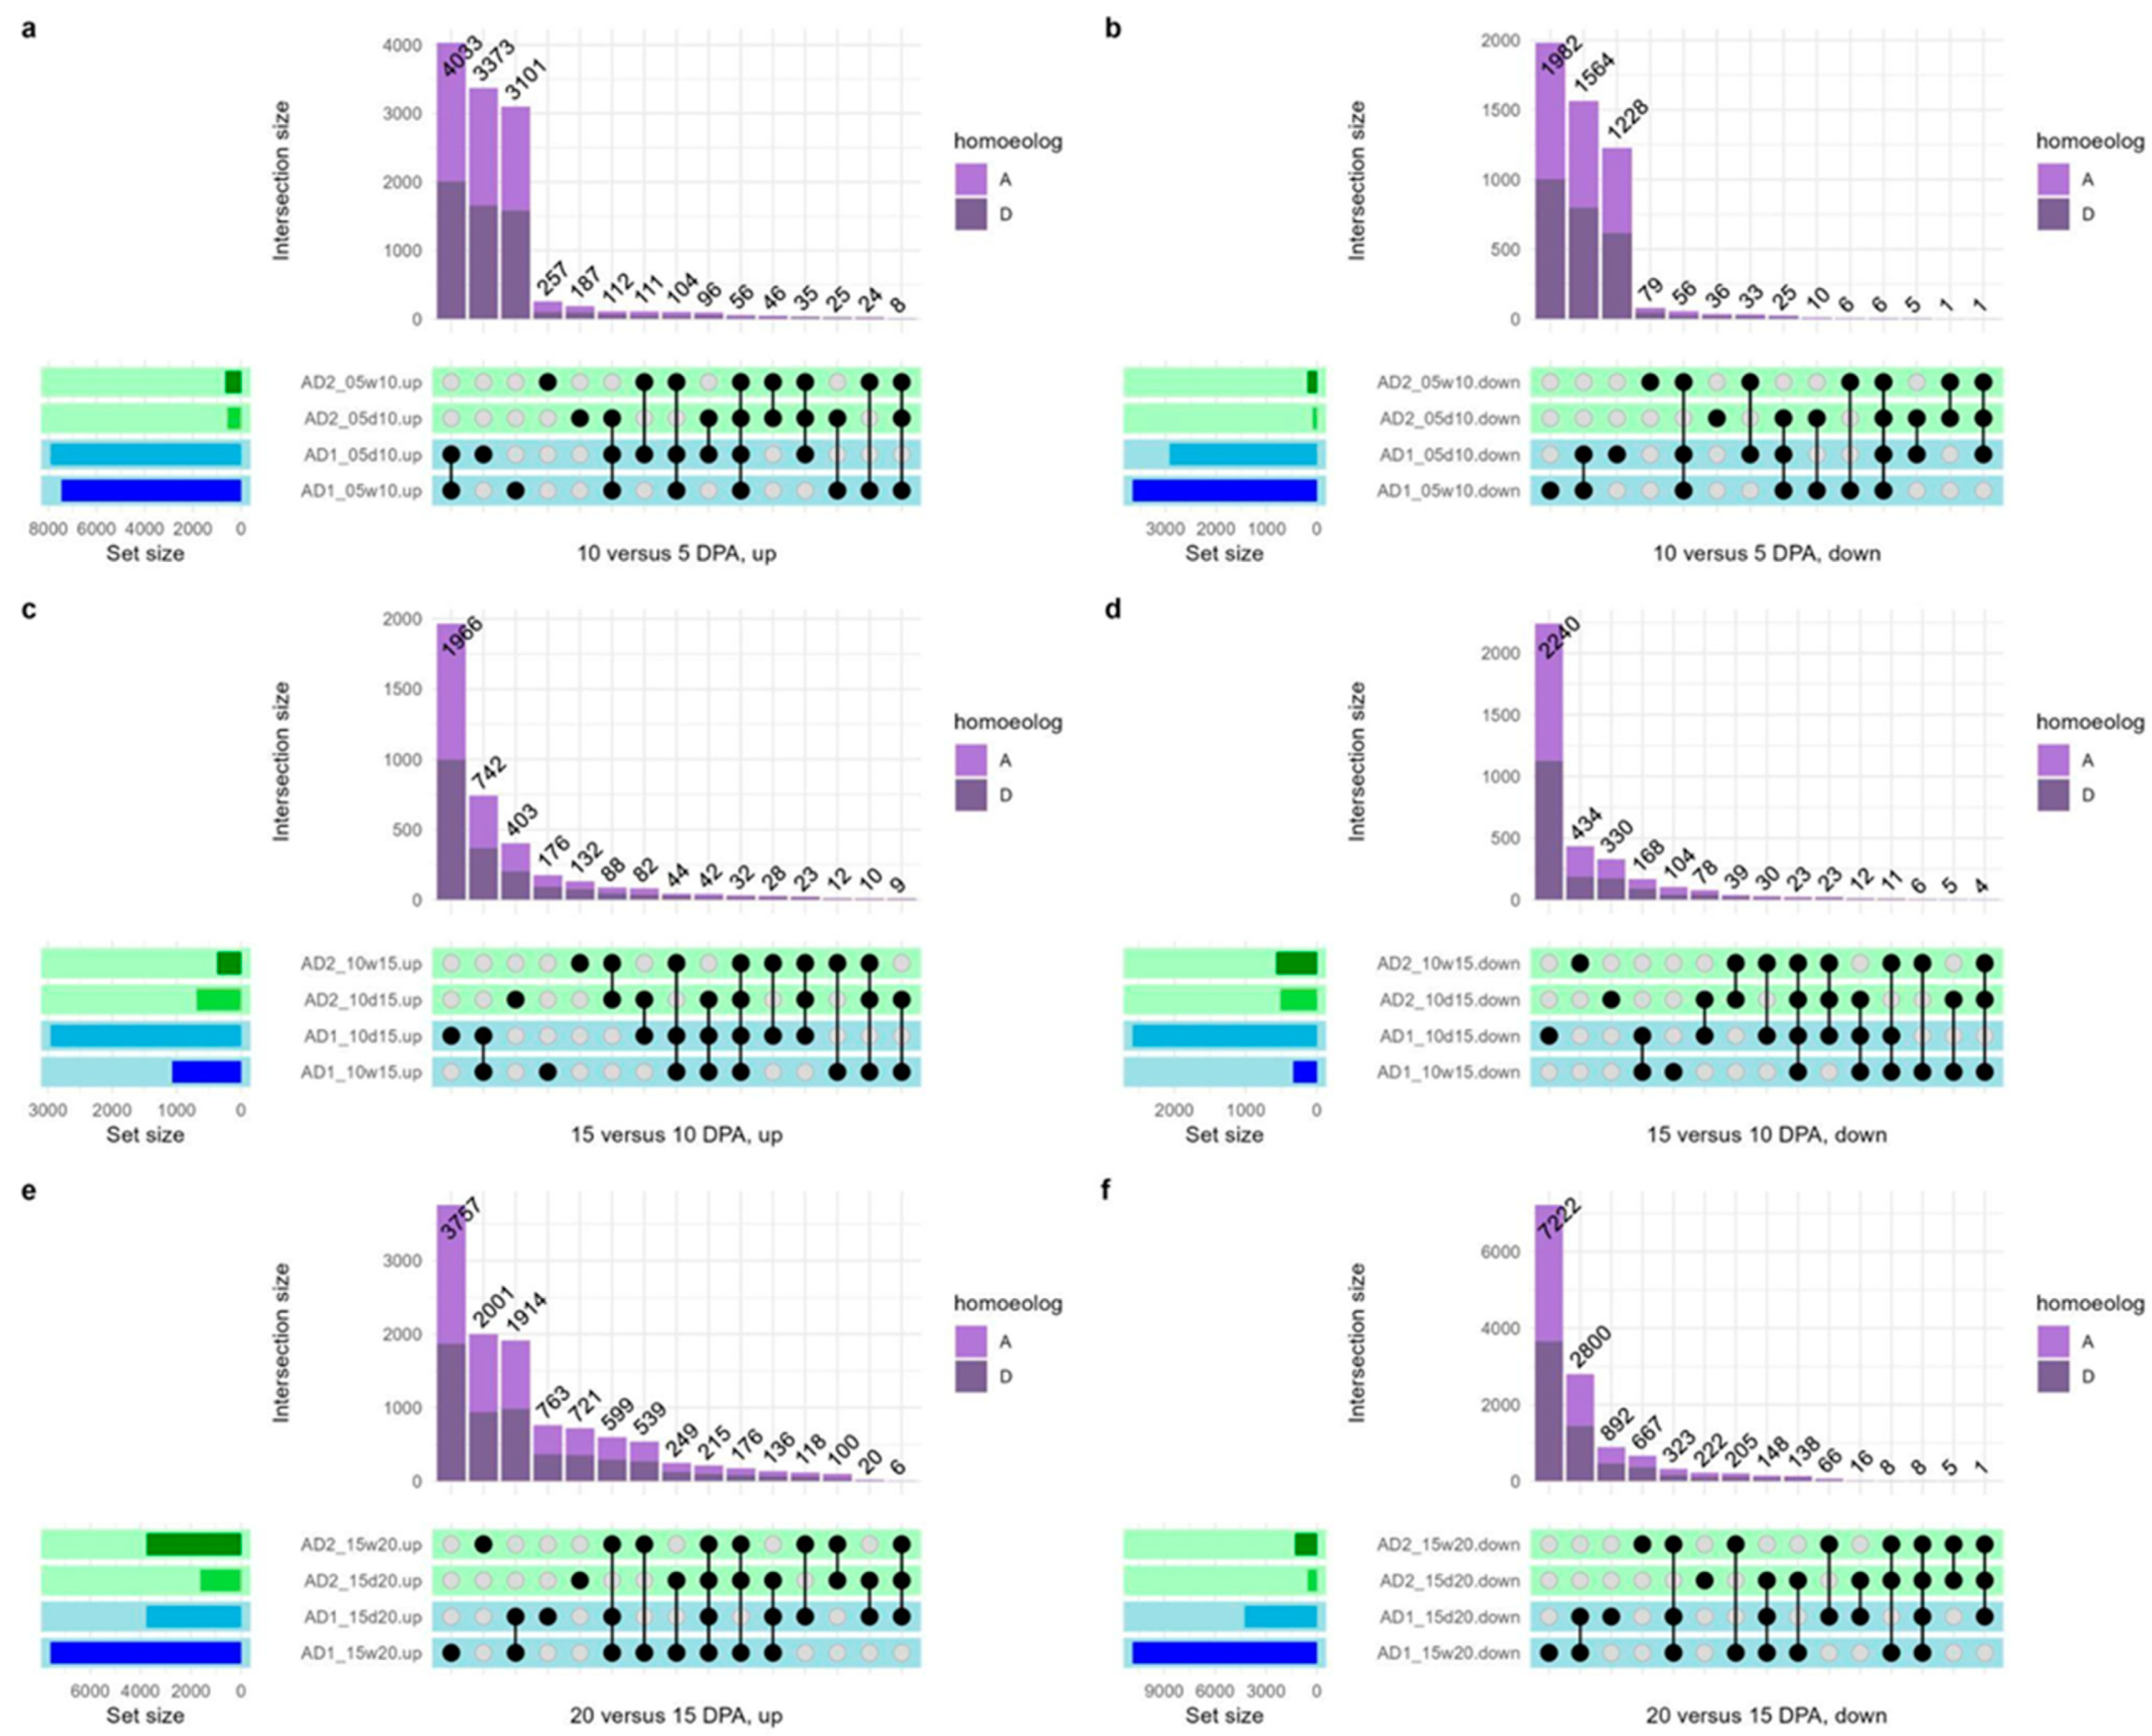
3.2. Differential Expression of Convergent Domesticates and Their Wild Progenitors

Differential gene expression (DGE) analyses between species, with respect to domestication status and among time points, are summarized in Figure 1 and Table 2. Generally, the extent of differential expression in G. hirsutum is greater than in G. barbadense for any given comparison (between timepoints and/or wild versus domesticated). This difference could be due in part to the lack of truly wild accessions of G. barbadense, to a more uniform developmental program in G. barbadense, and/or perhaps because a larger number of morphogenetic transformations were selected in G. hirsutum than in G. barbadense. In G. barbadense, the greatest amount of DGE occurs between 15 and 20 DPA in both the wild and domesticated accessions, whereas DGE between the previous timepoints was substantially lower. Likewise, the later DPA timepoints (i.e., 15 and 20 DPA) exhibited greater DGE between wild and domesticated G. barbadense than the earlier timepoints (i.e., 5 and 10 DPA). Similar patterns were both previously observed in G. hirsutum [27] and reiterated here using additional sampling; in G. hirsutum, however, the number of DGE between 5 and 10 DPA is more similar to the number of DGE observed between 15 and 20 DPA, in contrast to G. barbadense, in which substantial DE was only observed between 15 and 20 DPA. Interestingly, for both G. hirsutum and G. barbadense, DGE between timepoints is generally higher in the wild accessions than in domesticates, except for 10 to 15 DPA in both species, possibly indicating a difference in development timing relative to chronological DPA. Also notable is the amount of DGE between wild and domesticated G. hirsutum, which far exceeds the DGE between wild and domesticated in G. barbadense (24,627 total DEG in G. hirsutum vs. 7608 in G. barbadense).
Interspecific comparisons between G. hirsutum and G. barbadense reveal substantial DGE for both wild and domesticated comparisons (e.g., G. hirsutum wild versus G. barbadense wild) at all timepoints, for a total of 33,295 differentially expressed genes in the wild and 58,805 in the domesticated (Table 2, “interspecies’’ column). This is notable as a dramatic difference in the transcriptomic usage (45% versus 79% of all genes) in the same structure of two closely related species. Interestingly, the amount of DGE was greater for the domesticated interspecific comparisons than for the wild interspecific comparisons on a per DPA basis. In other words, the fiber expression profiles of G. hirsutum and G. barbadense became more divergent after domestication despite intense directional selection for similar characteristics. These interspecific differences in expression are reiterated in the general lack of shared DGE genes in any comparison (Figure 2); however, there are between 5 and 96 genes that exhibit similar novel patterns of DE between DPA in the domesticated accessions of both species (Figure 2, the intersection between AD1 and AD2 domesticated sets; Supplementary Table S2). These genes include several related to reactive oxygen species management, an important aspect of fiber elongation, upregulated between 10 and 15 DPA: peroxidase (Gorai.001G001800.A, Gorai.008G080800.D) and oxidoreductase genes (Gorai.002G062200.A, Gorai.008G296500.A, Gorai.013G179000.A). A xyloglucan endotransglucosylase/hydrolase gene involved in cell wall polysaccharide metabolism is also upregulated between 10 and 15 DPA (Gorai.005G153200.A), as is a gene related to the cytoskeleton, crucial at all stages of fiber development (Gorai.005G168500.A). Interestingly, while no gene exhibited similar DE in G. hirsutum and G. barbadense for more than one developmental timepoint, eight homoeologous pairs appeared on this list of putative convergent DE genes (i.e., homoeologous pairs for Gorai.001G218000, Gorai.004G062100, Gorai.005G042100, Gorai.009G215100, Gorai.009G244800, Gorai.010G194600, Gorai.010G202700, and Gorai.011G182600).
In all but one instance, the two homoeologs exhibited DGE at the same timepoint and in the same direction, with the noted exception (i.e., Gorai.004G062100; “ethylene forming enzyme”) exhibiting upregulation of the D-homoeolog early in development and the A-homoeolog exhibiting upregulation later in development (Supplementary Table S2). Overall, the number of homoeologs that exhibited similar expression differences between domesticated G. hirsutum and G. barbadense was similar for both subgenomes (151 A-homoeologs versus 146 D).
Because only one of the polyploid parents produces spinnable fiber (i.e., the “A-genome”), we also directly compared global homoeolog expression bias by evaluating DE between homoeologs. Contrary to expectations, more homoeolog pairs exhibited a general D-genome bias among genes in 14 out of 16 samples (Test of Proportions, p < 0.05; Supplementary Table S3). Notably, comparisons between conditions (i.e., wild versus domesticated for the same species and DPA) suggest only one significant difference (Test of Proportions, p < 0.05), albeit in the opposite direction than expected. The only inter-condition difference detected was between wild and domesticated G. barbadense at 10 DPA, where the domesticated form exhibited a greater bias toward the D-genome.

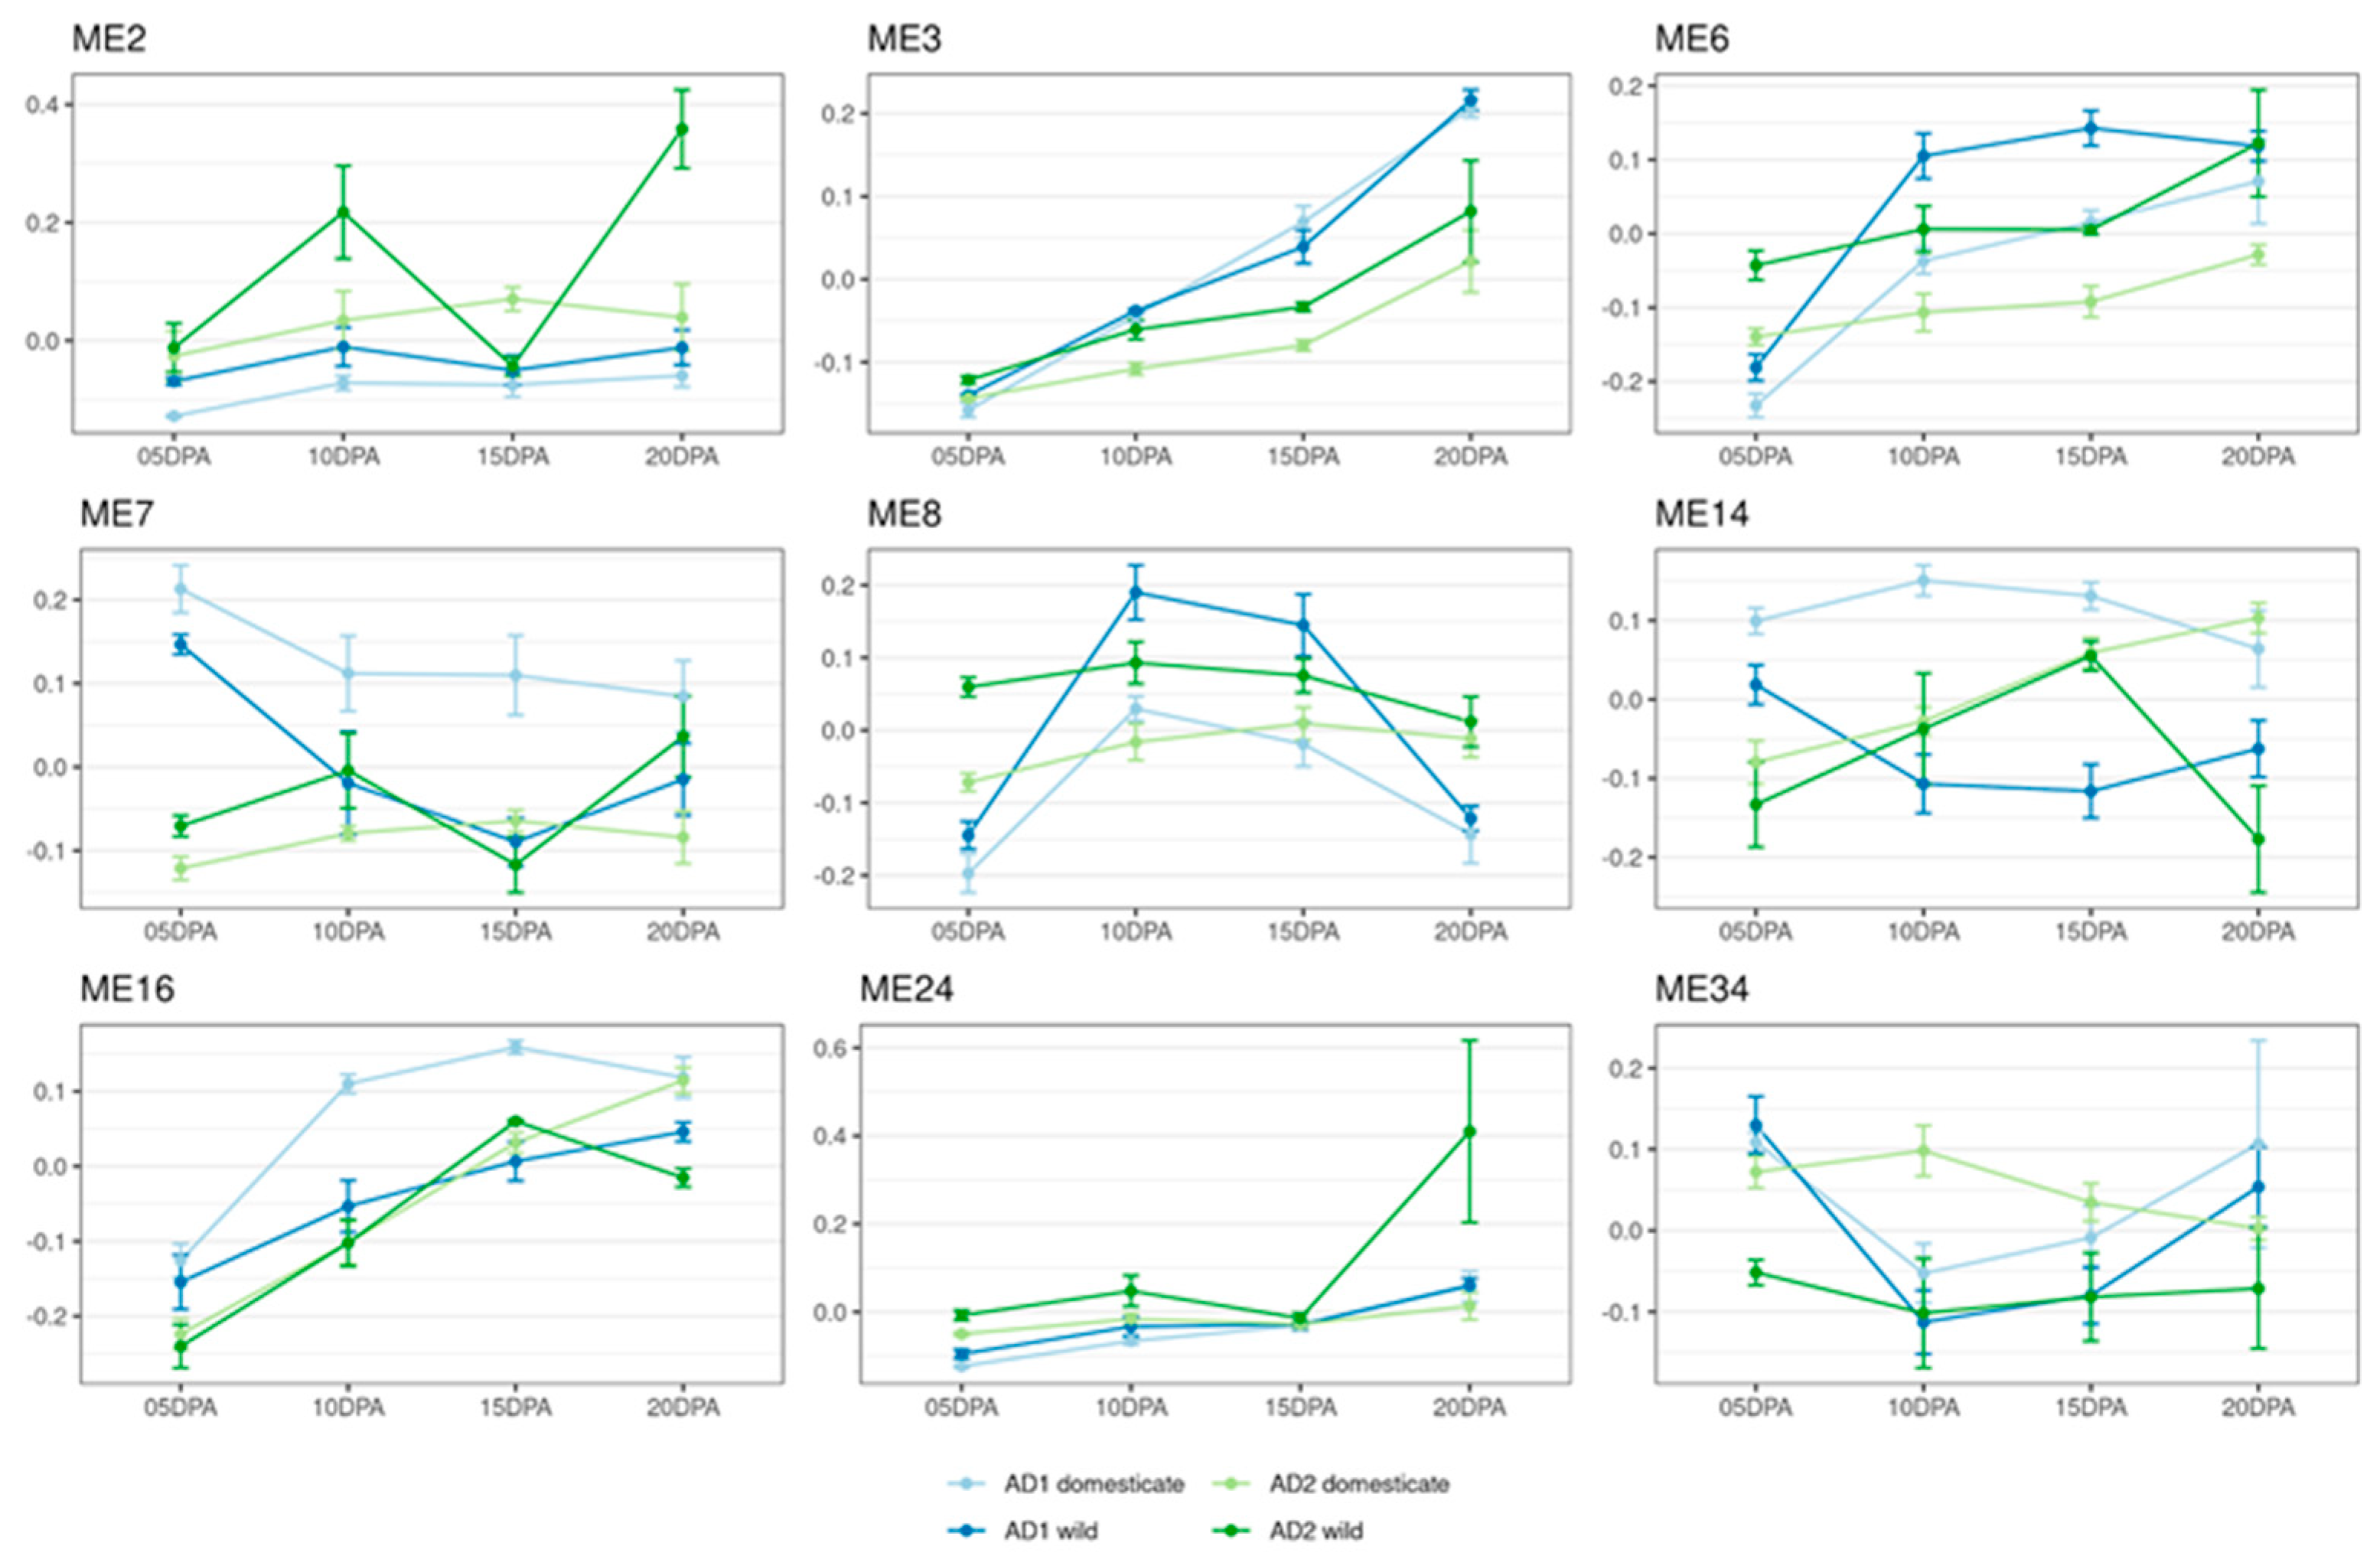
3.3. Meta-Coexpression Network Analysis Fiber Development in the Two Allopolyploid Species

To provide a global view of cotton fiber gene co-expression relationships, a meta-coexpression network analysis was conducted using all 70 samples (41 from G. hirsutum and 29 from G. barbadense). After removing invariant genes and those with zero expression, a network of 69,686 genes was constructed comprising 58 coexpression modules (Supplementary Table S4). Applying a multi-factor design to examine the representative module co-expression profiles (eigengene ~ species + development + domestication), most (56) of these modules exhibited significant associations (using ANOVA) with species (35), domestication status (40), and/or developmental timepoints (39). Applying a simplified design that combined the original three factors into a single factor (species_domestication_development), nearly all modules (53 out of 58) also exhibited significant associations. These results serve not just to reinforce the genome-wide transcriptomic alterations that have accompanied speciation and domestication but also reveal a network or “modular” view of these changes. Functional enrichment (Supplementary Table S5) using topGO revealed nine modules with clear relevance to fiber development, as implied by the gene ontology of module member genes (Supplementary Table S4). Representative expression patterns of these modules are shown in Figure 3.
Two of these fiber-relevant modules, ME3 and ME8, are functionally enriched for polysaccharide synthesis and transport, which are important to developing fiber and the high cellulose content of cotton fiber [61]. ME3 exhibits a gradual upregulation of module member genes from 5 to 20 DPA in all four accessions studied, with more drastic changes in G. hirsutum than in G. barbadense. ME3 contains ~8300 genes (Supplementary Table S6), among which are expansin, sucrose synthase, cellulose synthase, pectin lyase, actin-related protein, actin depolymerizing factor, tubulin, myosin, and profilin, all of which are genes that play a role in cell wall synthesis, particularly secondary cell wall synthesis, which is a critical aspect of fiber development [62,63,64,65,66,67,68,69]. Among those are four negative regulators of fiber length (GhMYB1, GhKNL1, GhFSN1, GhBZR3), whose higher expression in G. hirsutum (versus G. barbadense) likely contributes to the shorter fibers in upland cotton (Supplementary Table S7). ME8, which has significant associations with domestication and development, has a less clear expression pattern; it is generally more highly expressed at 10 and 15 DPA and in wild accessions. ME8 contains roughly 2000 genes (Supplementary Table S6), some of which are relevant to fiber development, namely pectin lyase, pectin methylesterase, cellulose synthase-like protein, sucrose synthase, expansin, and callose synthase, all of which are related to cell wall development [62,70,71,72].
Three of the nine modules (ME2, ME3, and ME7) are associated with reactive oxygen species physiology, a process that is important for cell function but also plays a role in fiber development by impacting cell wall extensibility and signaling the onset of secondary cell wall synthesis [67,73,74,75]. ME2 has significant associations with domestication, species, and development and is more highly expressed in G. barbadense than in G. hirsutum. Two ME2 member genes encoding the rate-limiting enzymes GhACO1 and GhACO2 in ethylene biosynthesis are known to play a positive regulatory role in fiber development (Supplementary Table S7). ME7 has significant associations for both species and domestication. It is most highly expressed in domesticated G. hirsutum, with much lower expression in all other accessions and at most other timepoints. ME7 contains ~2600 genes (Supplementary Table S6) with a wide variety of functional annotations; some that are relevant to fiber development include methyltransferases, myosins, expansin, oxidoreductases, peroxidases, α tubulin, formins, and MYB-domain proteins [34,63,68,76,77,78].
One module, ME6, was related to RNA synthesis and cell cycle regulation, the latter possibly relevant to the fiber suppressing cell division. For example, a Gibberellic Acid (GA) receptor gene GhGID1a, which is involved in the regulation of the GA signaling pathway, was found in ME6, and its ectopic expression in Arabidopsis leads to reduced growth (Supplementary Table S7). The coexpression profile of ME6 exhibited significant associations with all three terms (i.e., species, domestication, and development) and is generally more highly expressed in wild G. hirsutum. It also exhibits low expression at 5 DPA and generally higher expression at later DPA in all species. Two modules (ME7 and ME14) were associated with cytoskeletal development, motor proteins, and intracellular transport. These functions are all crucial in developing fibers, as the cytoskeleton plays a role in cell shape and in transporting materials to the site of growth in a cell. ME7, discussed above, is notable because it is only highly expressed in domesticated G. hirsutum, and ME14 had significant associations with domestication. This module is most highly expressed in domesticated G. hirsutum, with high expression at later timepoints in domesticated G. barbadense as well, thus comprising a second example of a module that may reflect parallel change under dual domestication. ME14, which contains 839 genes (Supplementary Table S6), exhibits low expression in wild accessions of both species and contains several genes relevant to cellular transport, including vesicle-associated proteins, SNARE proteins, actin, profilin, dynein, tubulin, and clathrin adaptor complex proteins [70,78,79,80,81]. One module, ME16, is related to autophagy, a critical cellular process that likely plays a role in fiber maturation. Interestingly, ME16 significantly correlates with all three factors (i.e., species, domestication, and development) and displays high expression levels at 20 DPA. ME24 is related to nutrient reservoir activity; sucrose management is a critical part of cellulose synthesis, which is, in turn, an essential aspect of fiber development. ME24 is significant under domestication, species, and development, shows high expression at 20 DPA in both species and domestication states, and contains genes related to polysaccharide synthesis and transport (Supplementary Table S6). The final module relevant to fiber development, ME34, is related to actin-based transport and is associated with domestication state and development. ME34 exhibits higher expression in domesticated accessions of both species but has different expression patterns between G. hirsutum and G. barbadense, perhaps indicating a target of parallel selection. It has high expression at 5 and 20 DPA in G. hirsutum but a more even pattern expression through development in G. barbadense. It contains several actin-related genes (Supplementary Table S6), such as villin, decapping protein, myosin, kinesin, and formin [63,66,79,82].
Two modules that did not have significant associations under domestication nevertheless displayed notable patterns of expression over time or between species. Both ME4 (ROS management) and ME5 (DNA binding) showed strong species and development effects, with strong eigengene patterns (Supplementary Figure S3). Specifically, ME4 was more highly expressed in G. hirsutum throughout development than in G. barbadense, while the reverse was true for ME5. These modules, containing 3583 and 3080 genes (Supplementary Table S6), respectively, may represent fundamental species expression differences that remain constant across the domestication divide in both species.

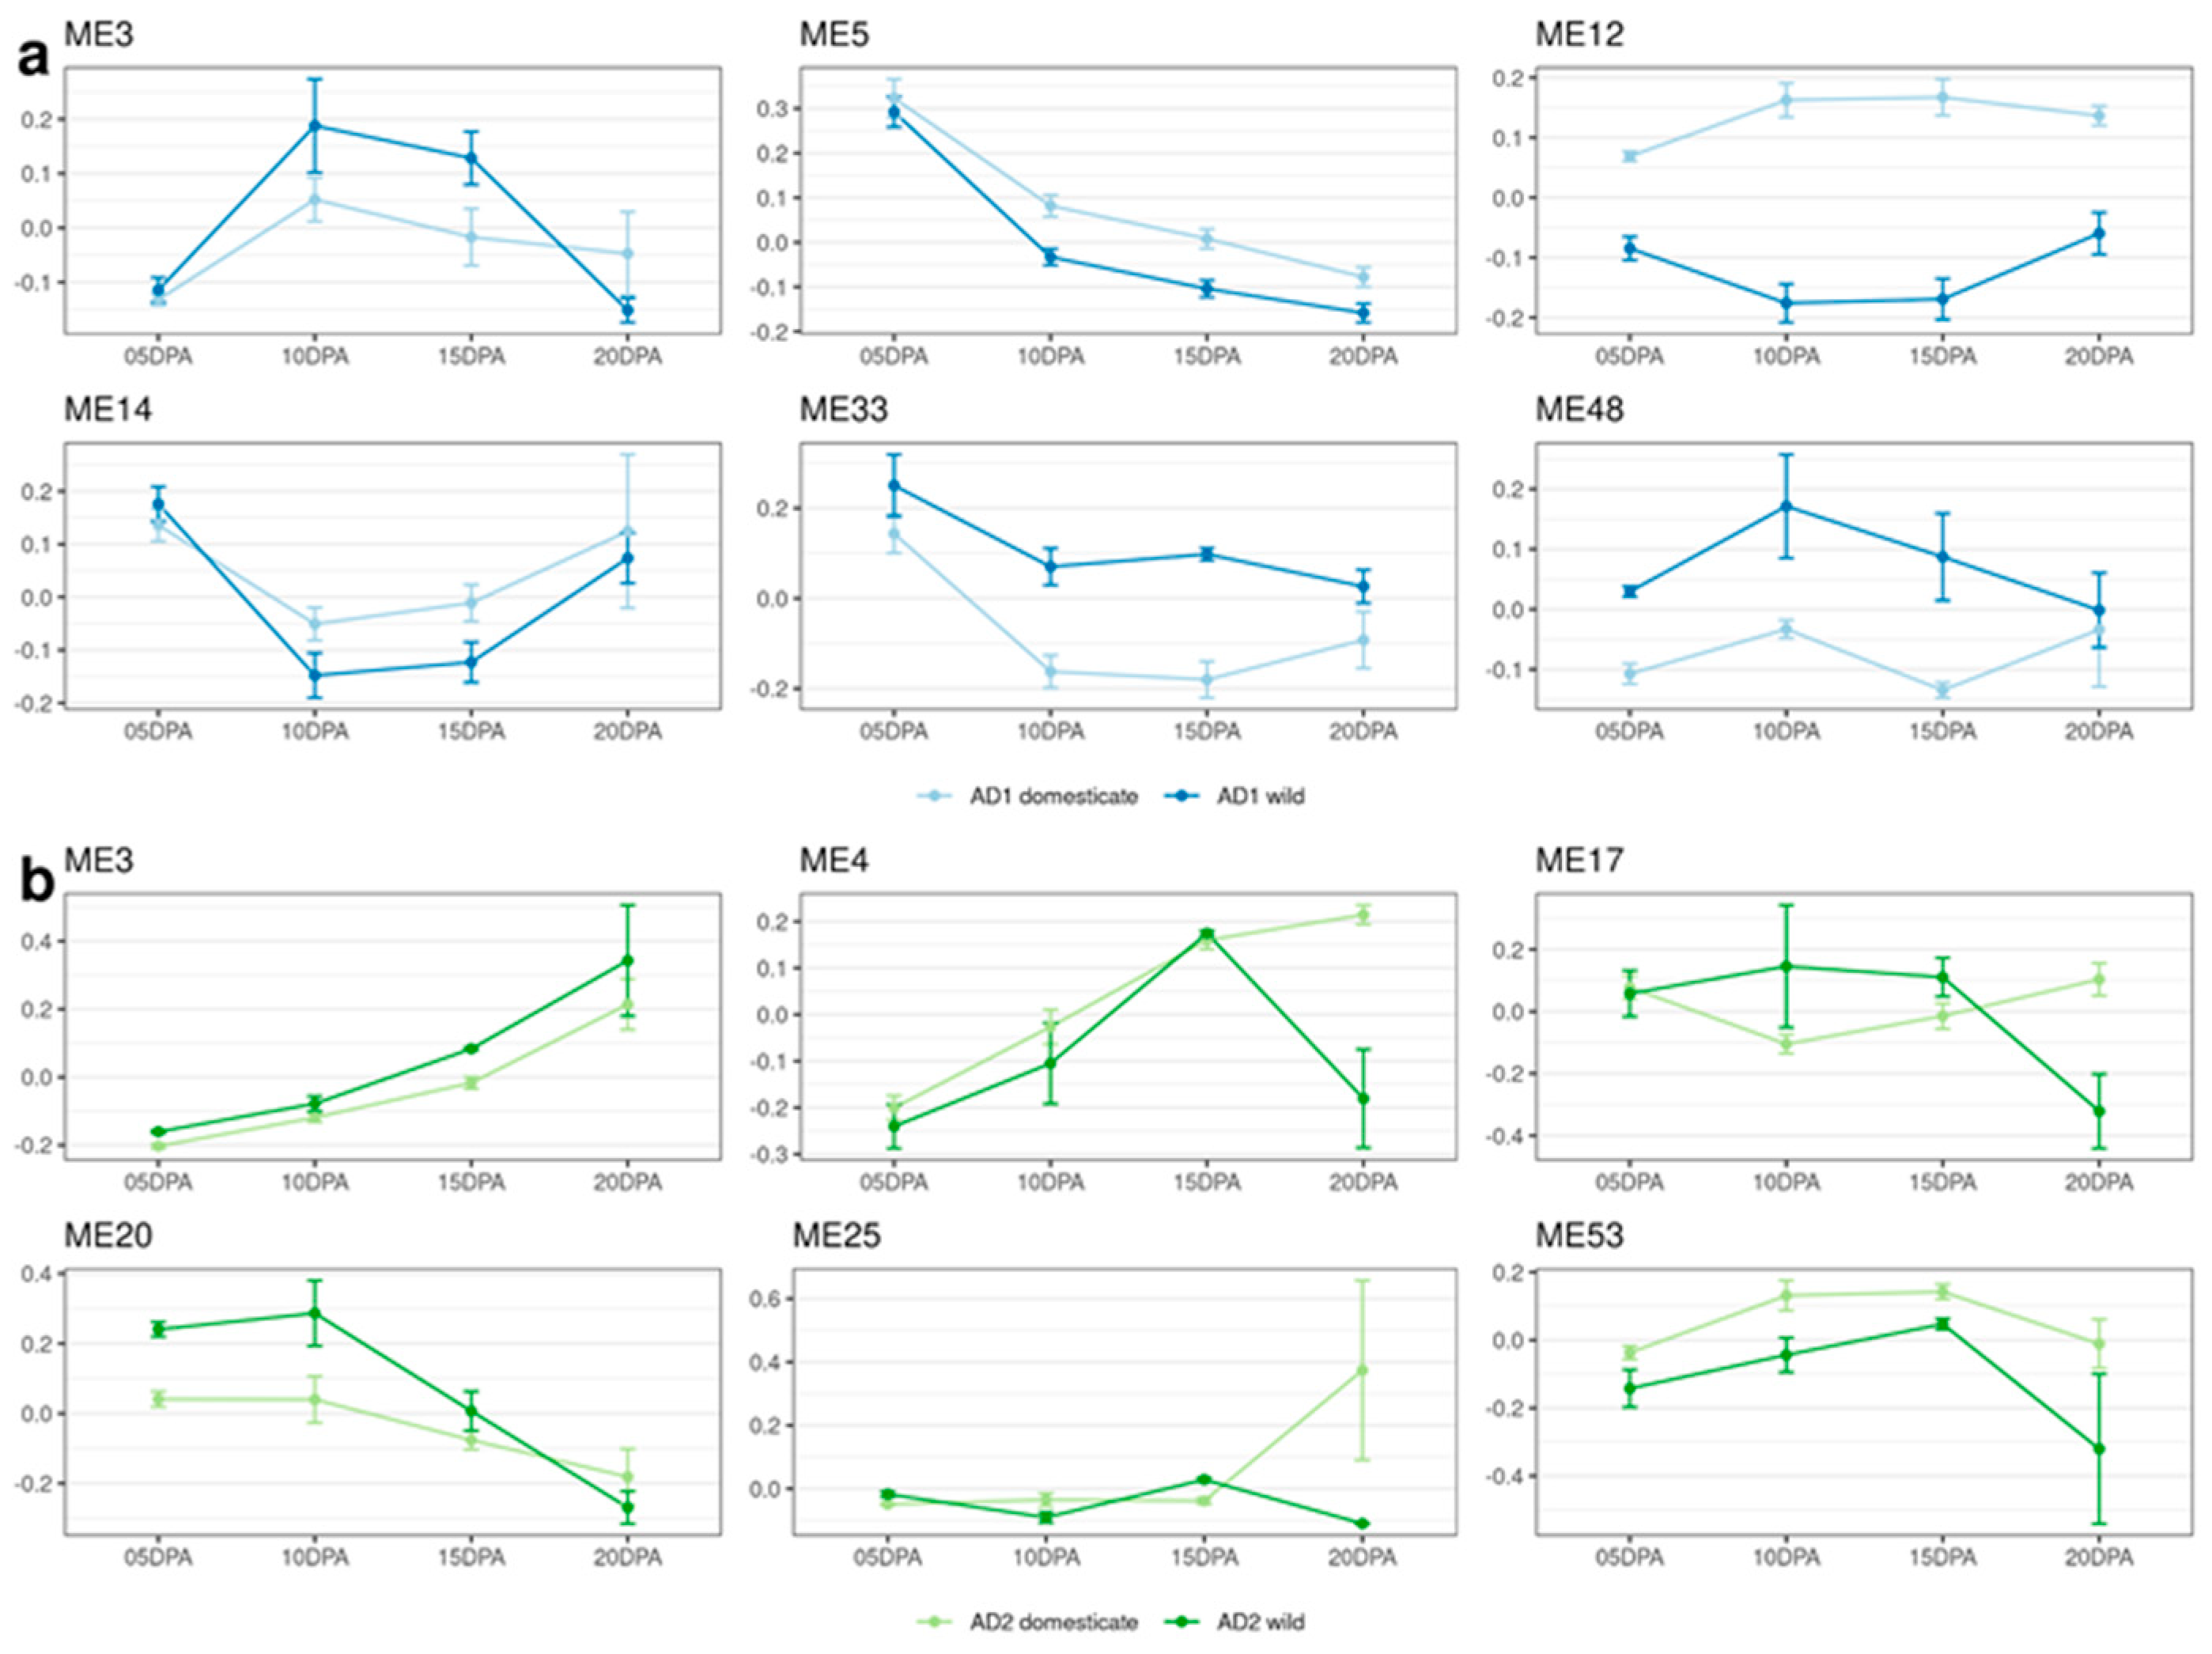
3.4. Comparison between the Separate Species-Networks for G. hirsutum and G. barbadense

In addition to the meta-network analysis constructed for both species, species-specific networks of fiber domestication were generated for interspecific comparison of the underlying transcriptional organization between G. hirsutum and G. barbadense. The G. hirsutum network comprised 62,087 genes partitioned into 76 modules (Supplementary Table S8). About one-half of these modules (35) demonstrated significant associations with domestication (23) or development (23), while 31 had significant associations when tested for the combined factor of domestication_development (Supplementary Table S9). Functional enrichment (Supplementary Table S10) of these modules revealed six modules with clear relevance to fiber development (Figure 4a, Supplementary Table S9). ME3 is significantly associated with development and domestication_development and is related to the microtubule cytoskeleton and cellular transport. It is more highly expressed in wild accessions of G. hirsutum and tends to have high expression at 10 and 15 DPA. ME3 contains 5096 genes (Supplementary Table S8); some genes of interest include the annexin gene GbAnx6 (Supplementary Table S10; [83]) and others encoding tubulin, dynamin, microtubule-associated proteins, actin-related proteins, and several types of transferase [63,79]. ME14 and ME33 are also related to cellular transport and are significantly associated with development and domestication_development, and ME33 is additionally associated with domestication. ME14 displays higher expression at 5 and 20 DPA in both wild and domesticated accessions, and ME33 has high expression at 5 DPA and generally high expression in wild accessions. ME14 has ~1300 genes (Supplementary Table S8), including dynamin, myosin, actin depolymerizing factor, actin-related proteins, formin, and villin [63,64,66,79,82]. Among those, GhFLA1 is a fasciclin-like arabinogalactan protein involved in the Cdc42p-dependent organization of the actin cytoskeleton [84] that has been reported to positively regulate fiber elongation (Supplementary Table S7). ME5 is related to reactive oxygen species management, is significant for domestication, development, and domestication_development, and its expression is inversely correlated with DPA, with a sharp drop in expression between 5 and 10 DPA. ME5 contains ~4600 genes (Supplementary Table S8), including several oxidoreductases and peroxidases [75,85]. In addition, the transcription factor GhbHLH18 was also present in ME5, which regulates fiber development through the activation of peroxidase-mediated lignin metabolism [86]. Another five known functional genes in ME5 (i.e., GhSMT2–1, GhLTPG1, GhHOX3, GhGalT1 and GhACT_LI1) may play an important role in the domestication of cotton fibers [87,88,89,90,91]. ME12 is related to autophagy and is associated with domestication and domestication_development. It shows much higher expression in domesticated G. hirsutum than in wild G. hirsutum. The final module, ME48, is related to polysaccharide synthesis. It is significant for domestication and domestication_development, and it shows higher expression in wild G. hirsutum than in domesticated G. hirsutum. ME48 contains 148 genes (Supplementary Table S8), including those encoding several hydrolases, cellulose synthase, and cellulose synthase-like protein [71,92,93]; however, none have been previously associated with fiber development.
The G. barbadense network consisted of 61,934 genes (Supplementary Table S8) partitioned into 56 modules, 20 fewer than were detected in G. hirsutum. Of these 56 modules, 21 had significant associations with domestication (12), development (13), and/or domestication_development (19). Functional enrichment of these modules revealed 6 with clear relevance to fiber development (Figure 4b, Supplementary Table S9). ME3 is related to polysaccharide synthesis and is significantly associated with domestication, development, and domestication_development. Expression of ME3 is correlated with DPA, with a sharp increase in expression between 15 and 20 DPA. ME3 contains ~4500 genes (Supplementary Table S8), including those encoding the following proteins of interest: cellulose synthase and cellulose synthase-like protein, galactosyltransferase, sucrose synthase, exostosin, glycosyl transferase, callose synthase, and several hydrolases [62,71,92,94,95]. Fourteen known functional genes, including a sucrose synthase gene (GhSusA1) and two cellulose synthase genes (GhcelA1 and GhcelA2), were present in ME3, indicating the significance of this module in fiber development (Supplementary Table S7). ME4 is related to the actin cytoskeleton and is significantly associated with all three test conditions. In domesticated G. barbadense, this module displays expression correlated with DPA, with a sharp increase between 10 and 15 DPA that continues upward into 20 DPA. It contains several genes encoding proteins of interest (Supplementary Table S8), including a known function protein (GhCFE1A) that mediates the interplay between the ER network and the actin cytoskeleton (Supplementary Table S7; [96]), and other genes encoding actin, villin, profilin, fimbrin, formin, fibrillin, and tubulin [63,64,66,79,82]. In wild G. barbadense, it shows very low expression at all timepoints other than 15 DPA. ME17 is related to reactive oxygen species management and is significantly associated with domestication_development. It does not display any particularly notable expression patterns, however. Two modules, ME20 and ME53, are related to the microtubule cytoskeleton. They are both significantly associated with all three test conditions. ME20 displays relatively low expression in domesticated G. barbadense, with a slight trend of decreasing expression over time and very high expression at 5 and 10 DPA in wild accessions. It contains several genes of interest (Supplementary Table S8), encoding proteins such as tubulin, dynamin, kinesin, and microtubule-associated proteins [63,79]. ME53 has higher expression in domesticated G. barbadense and higher expression at 10 and 15 DPA in both wild and domesticated accessions. The final relevant module is ME25, related to pectinesterase activity, which plays a role in cell wall extensibility [72]. It is significantly associated with domestication_development and shows relatively level expression in domesticated G. barbadense with an expression spike at 20 DPA; in wild G. barbadense this module has more variable expression.

3.5. Homoeolog Module Separation

Because both G. barbadense and G. hirsutum are allopolyploids, they contain duplicated genes (A- and D-homoeologs) for most genes in the genome. These gene pairs experienced shared ancestry until the divergence of the diploid progenitors of the allopolyploid, after which they may have acquired species-specific differences. In the case of G. barbadense and G. hirsutum, only one of the diploid progenitors produces spinnable fiber; therefore, it is interesting to ask whether each homoeolog in a given pair displays equivalent and/or parallel responses to speciation and (subsequently) domestication, or alternatively how independent homoeologs are with respect to these evolutionary transitions. To explore this, we examined the modular composition of paired and solo homoeologs in three constructed coexpression networks (i.e., the meta-network of both species, the G. hirsutum species network, and the G. barbadense species network). In all three coexpression networks, the number of A- and D-homoeologs contained within each network was approximately equivalent, ranging from 30,938 D-homoeologs in the G. barbadense network to 31,853 A-homoeologs in the meta-network (Supplementary Table S11). Within each network, the difference between the overall number of A- and D-homoeologs included was at most 58, indicating no broad bias in homoeolog usage in these fiber coexpression networks; however, the composition of individual modules within each network exhibited greater variability, ranging from 26 to 90% A-homoeologs (corresponding range for D-homoeolog composition = 10 to 74%). The G. hirsutum fiber network constructed here exhibits a slight bias toward D-homoeologs in the composition of most (42 out of 76) modules (Supplementary Table S11), whereas most G. barbadense (31 of 56) modules are slightly biased towards A-homoeologs (Supplementary Table S11). Despite this large variability in module composition and the biases detected, few modules exhibit a significant subgenome bias with respect to homoeolog composition (Supplementary Table S11). Of the 42 biased modules in G. hirsutum, only four modules (5%) exhibit significant bias: 3 with A-homoeolog biases and 1 with a D-homoeolog bias. Conversely, more G. barbadense modules exhibit significant bias (10 modules; 18%); however, these are evenly split as 5 A-biased and 5 D-biased modules. These results characterize the sometimes subtle differences in the fiber coexpression network between species, here with respect to homoeolog usage, and also indirectly support the idea that responses to domestication have been different in the two species.
Because homoeologs represent duplicated genes with recent independent ancestry (for allopolyploids), it is interesting to consider how often homoeolog pairs are placed in the same module (i.e., perform the same or similar functions) versus how frequently they are placed in different modules, potentially reflecting expression and/or functional divergence. While most modules exhibit no significant bias in homoeolog composition, in many cases, this lack of bias obscures the inference of homoeolog expression divergence. That is, the A- and D-homoeologs for the same ancestral gene were often placed in different modules (Table 3; Supplementary Table S11) in all three networks, indicating some degree of functional divergence between A- and D-homeologs in terms of coexpression network structure, as previously noted [27]. In the meta-network, approximately equal numbers of homoeologs (31,853 A-homoeologs vs. 31,822 D-homoeologs) were placed into network modules, but only ~37% (23,754 homoeologs, or 11,877 pairs) were placed in the same module; the remaining ~63% were placed in separate modules. Similar statistics were seen in the G. hirsutum network, where 31,055 A-homoeologs and 31,032 D-homoeologs were placed into modules, and only about one-third (22,396 homoeologs, or 11,198 pairs) of homoeolog pairs were placed into the same module. Interestingly, the G. barbadense network is slightly different: the overall homoeolog composition of the network remains roughly the same (i.e., 30,996 A- and 30,938 D-homoeologs), but here only about 23% of the module is composed of homoeolog pairs (i.e., 14,540 homoeologs, or 7270 pairs; Table 3) potentially suggesting greater expression divergence between homoeologs in G. barbadense than in G. hirsutum.

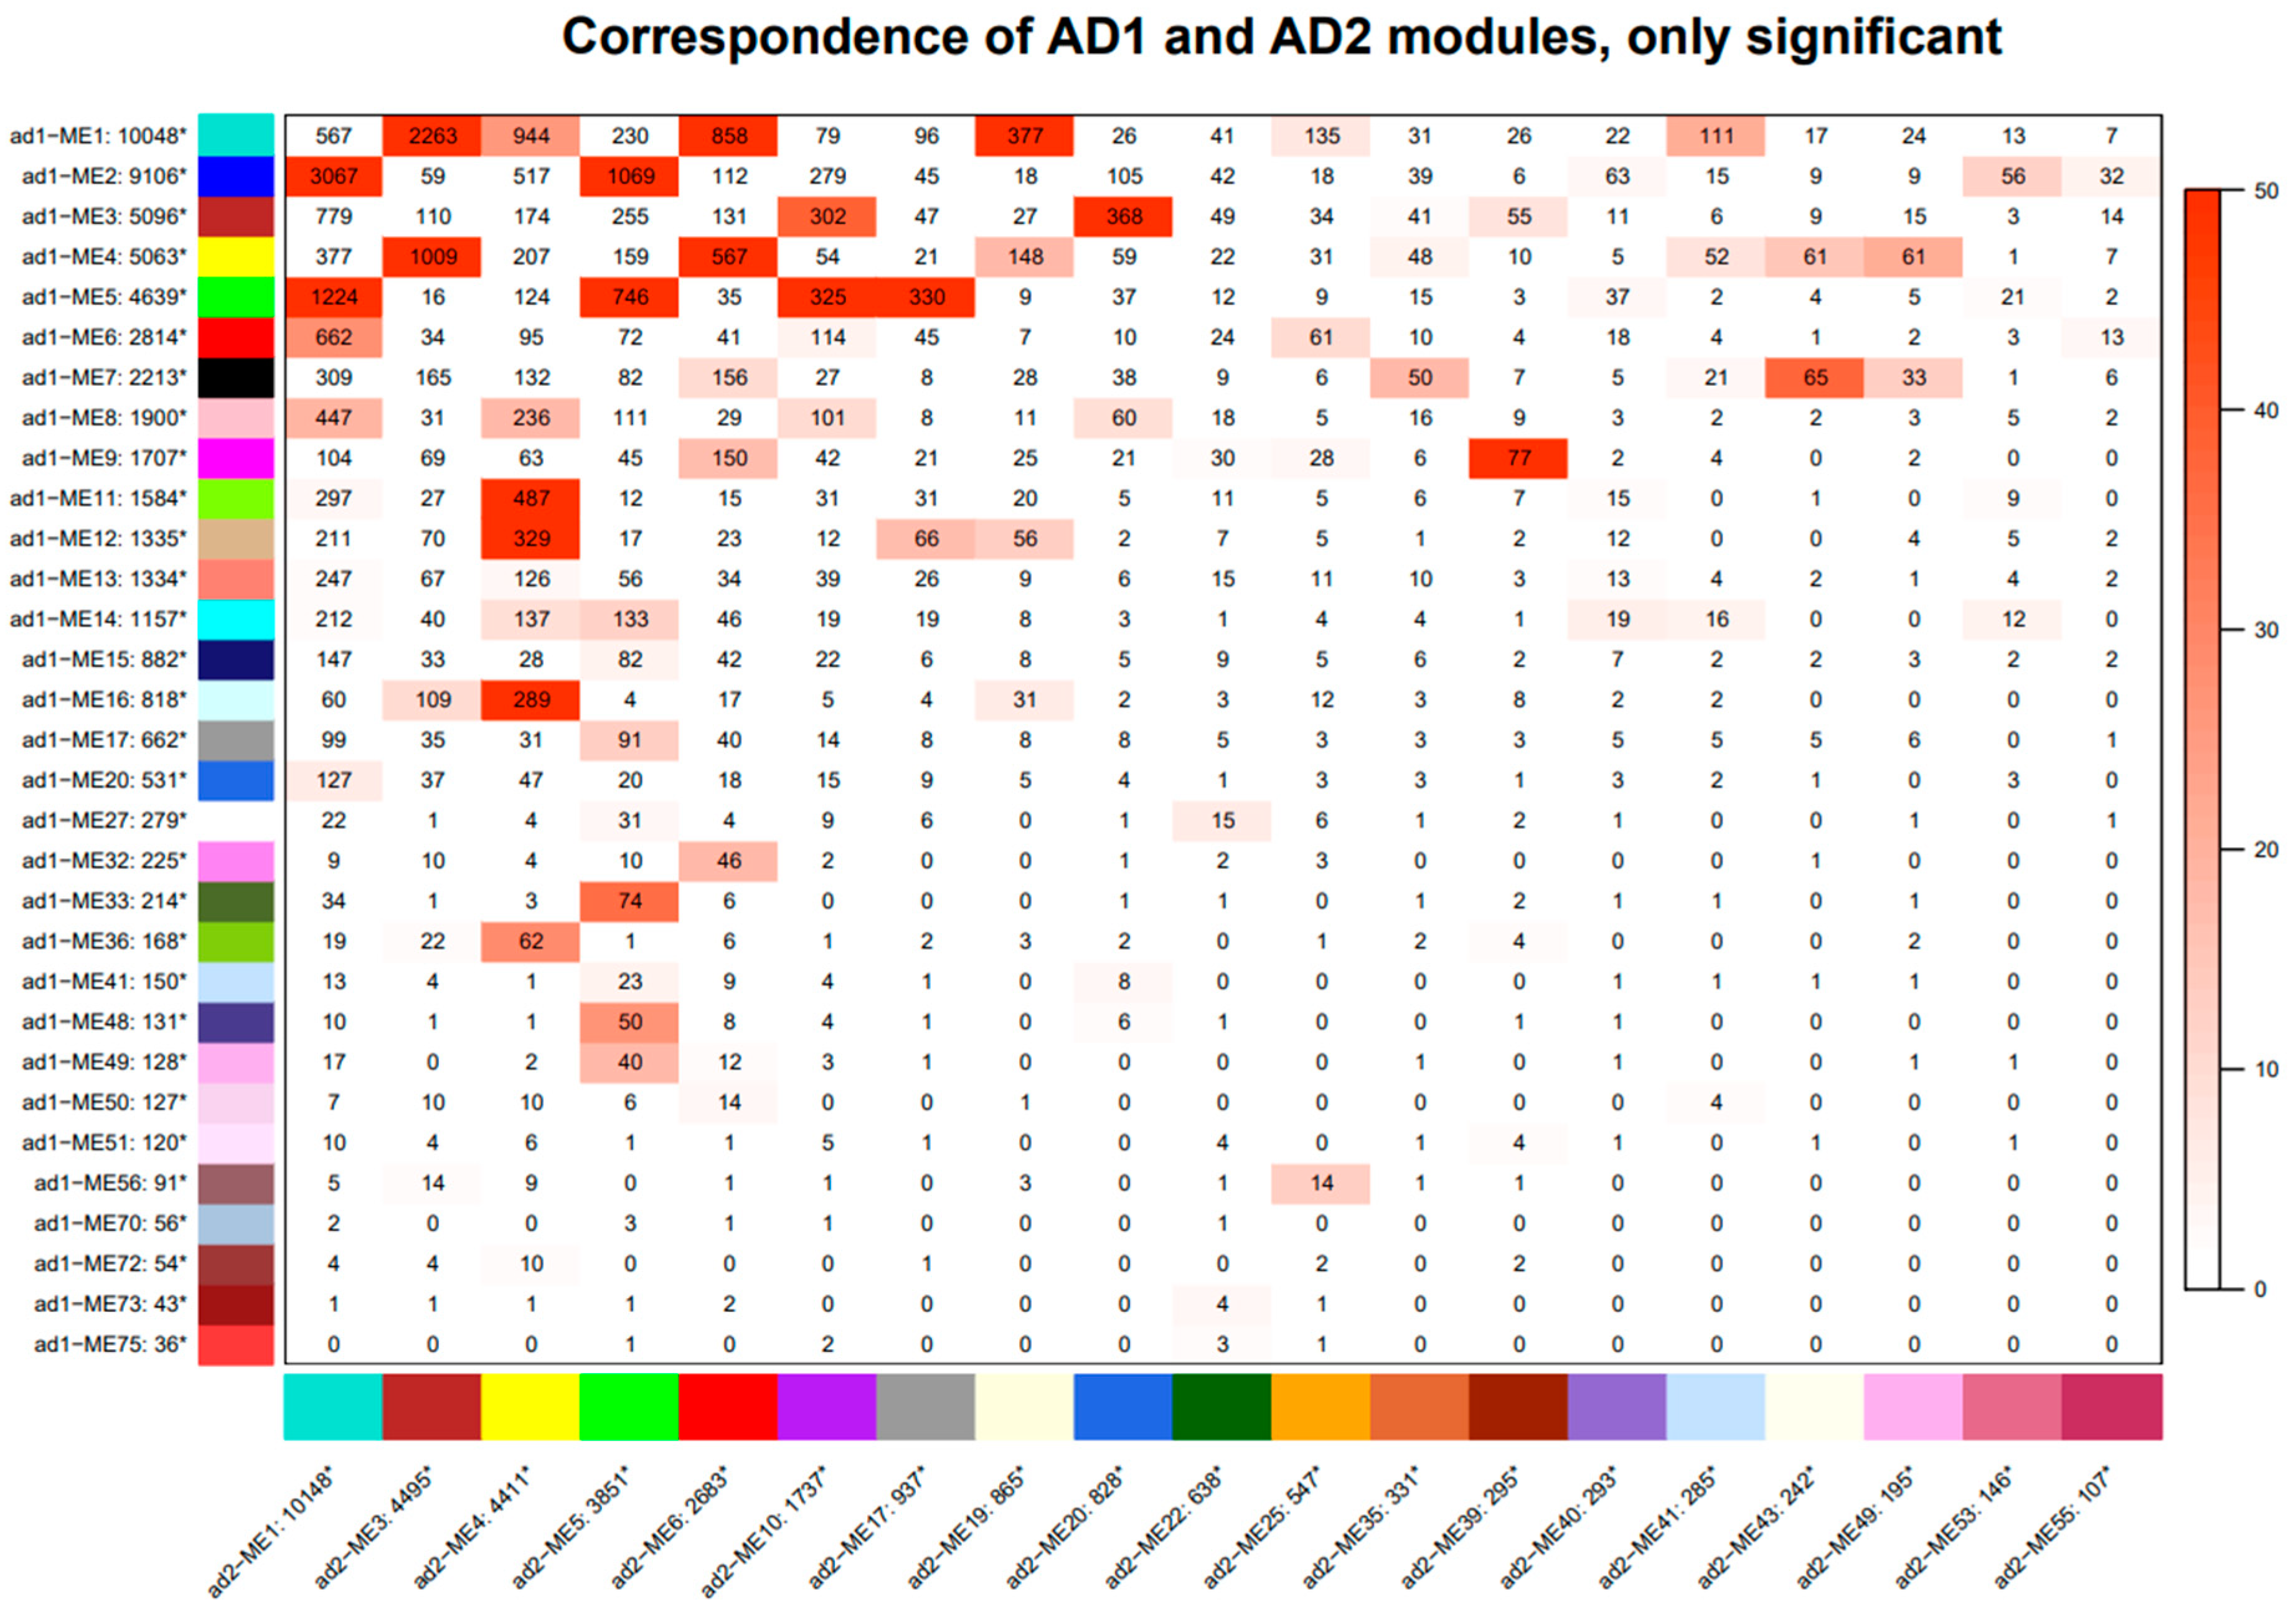
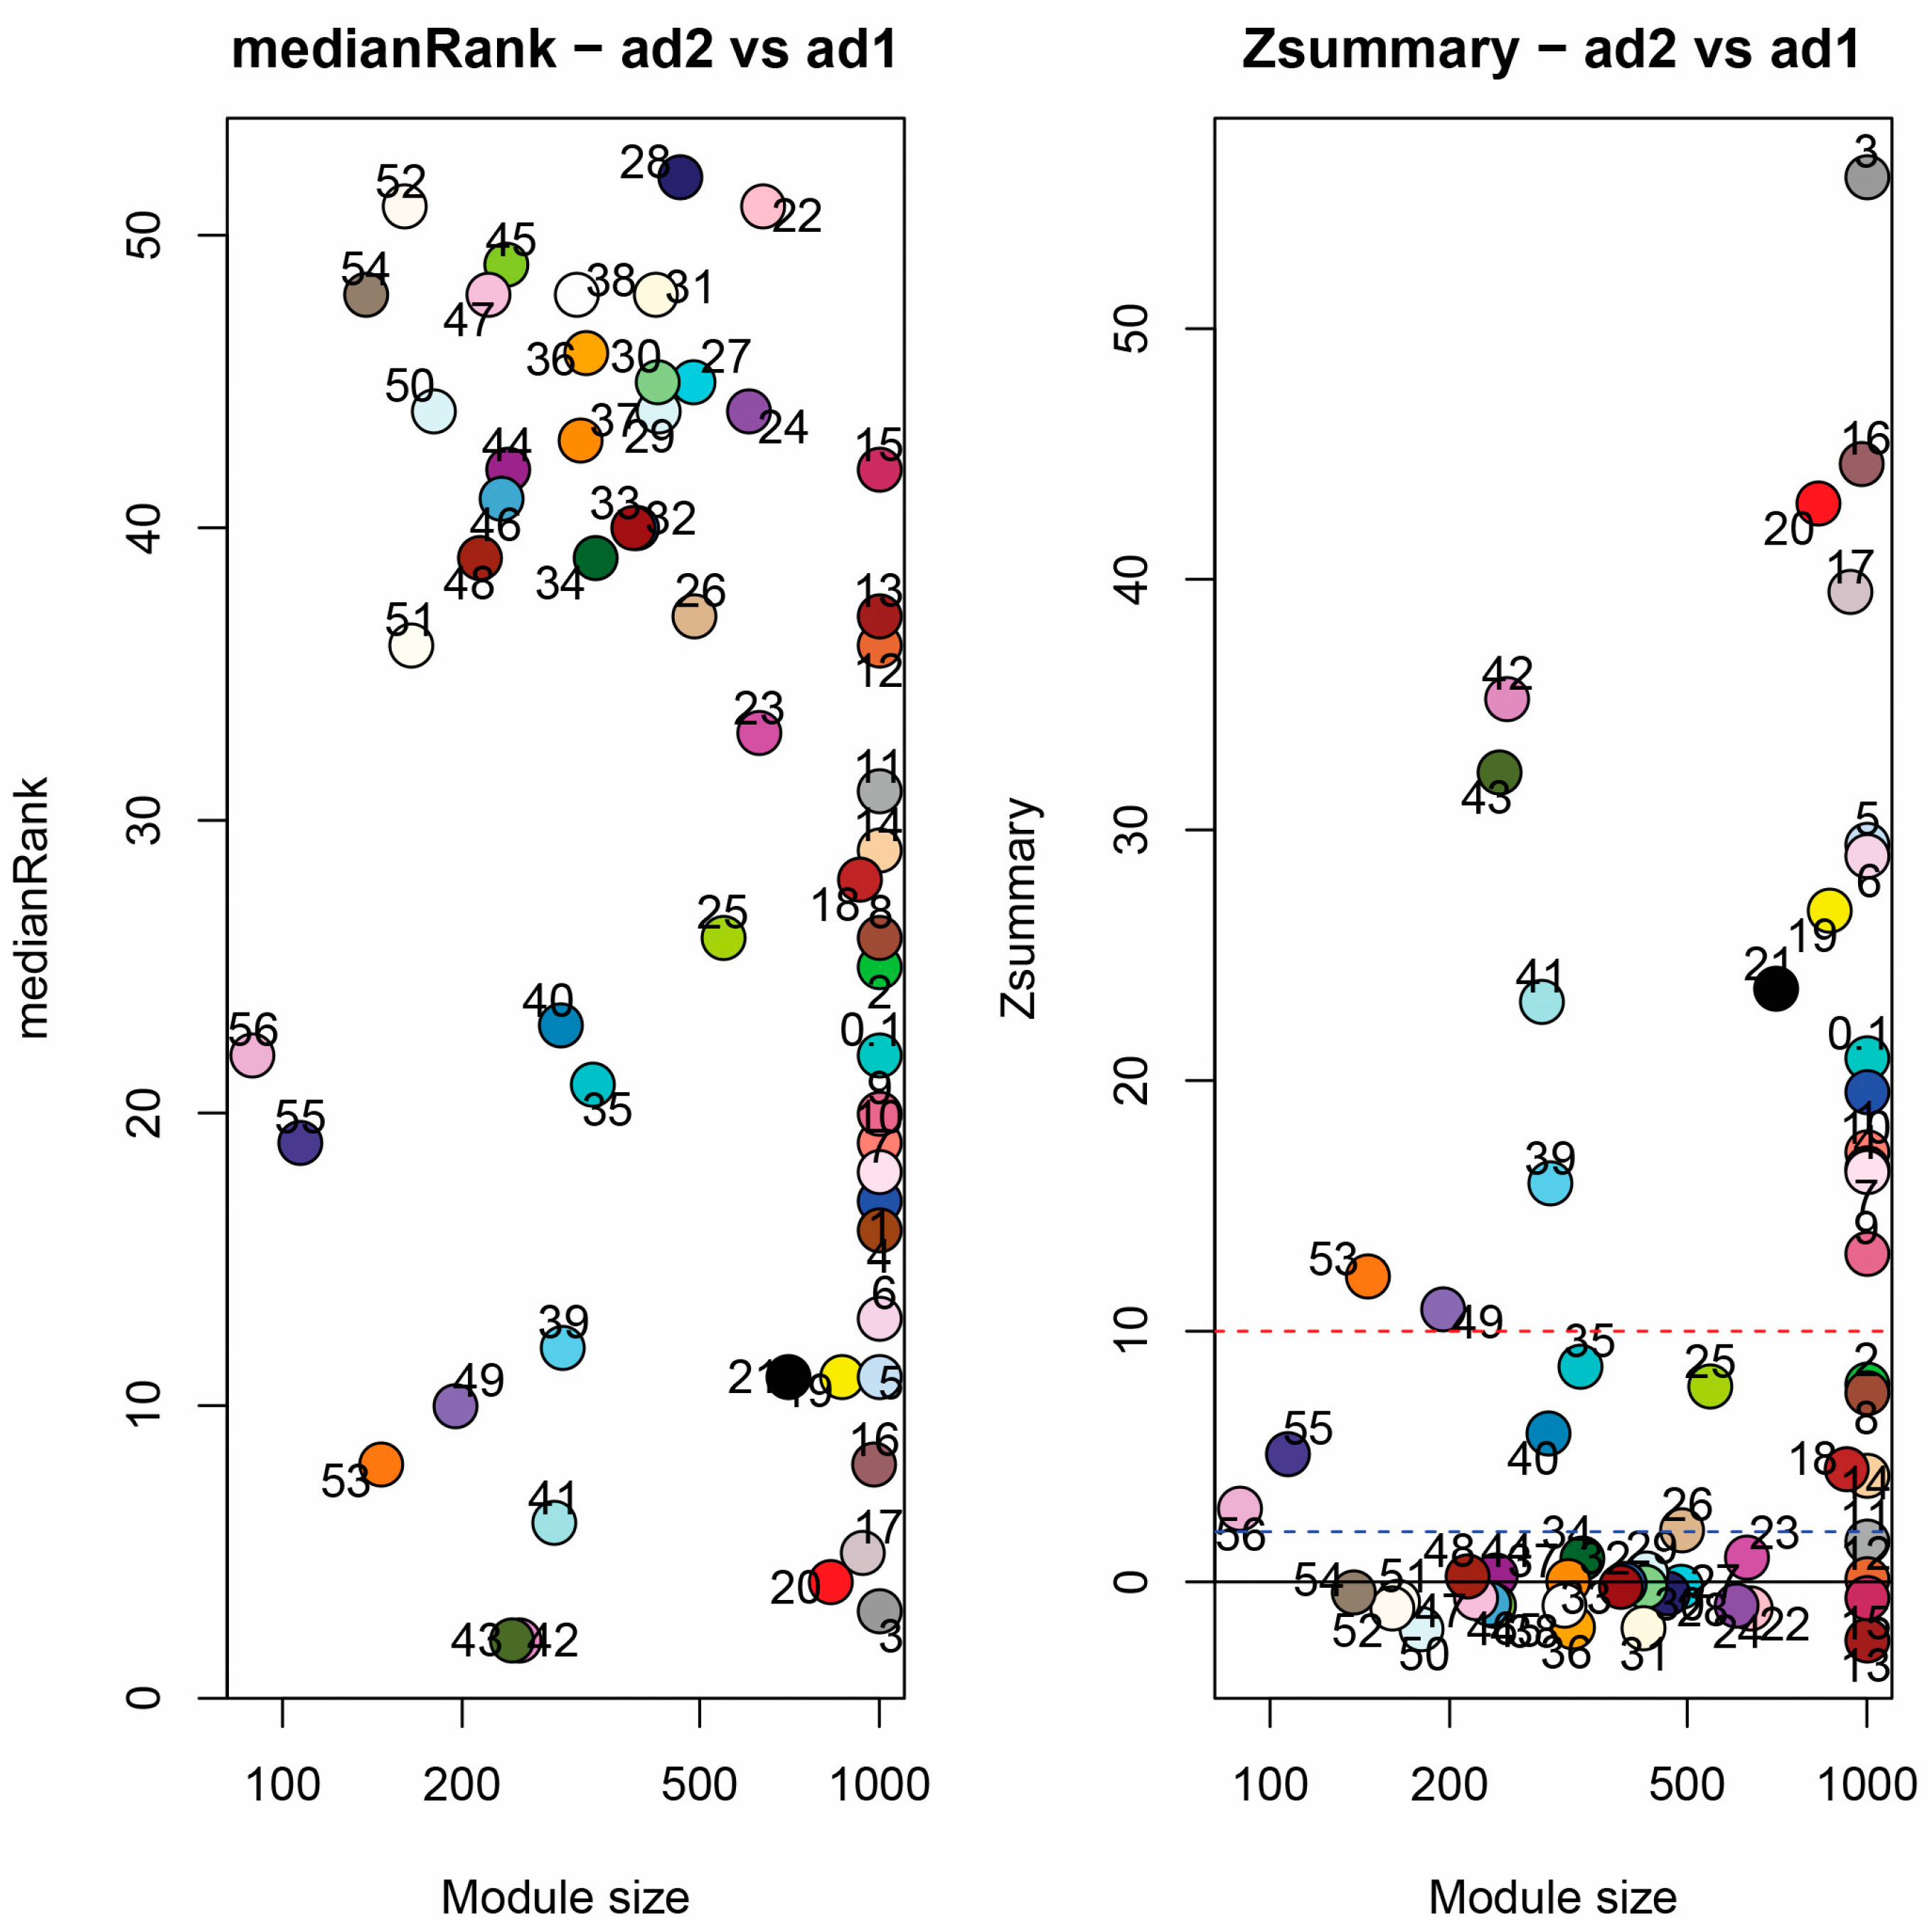
3.6. Module Correspondence and Preservation

An interesting outcome of the foregoing results is evidence for a somewhat divergent means of arriving at a convergent phenotype; however, the high dimensionality of the data may obscure similarities between the two species. We thus used module correspondence and preservation analyses to determine how well the fiber coexpression network in G. hirsutum is reiterated in G. barbadense. We employed two complementary statistical methods for evaluating the preservation between these species, medianRank and Zsummary [56], both of which assess the connectivity and density between modules to identify and compare hub genes. Modules with low medianRank scores and/or high Zsummary scores are generally considered better preserved. While there is no established cutoff for medianRank scoring, modules with a high Zsummary score (>10) are considered well-preserved, whereas modules with a Zsummary score between 2 and 10 are considered weakly preserved. In general, modules with a high medianRank and a low Zsummary (<2) are considered not well-preserved [57].
Module correspondence (Figure 5) indicates that modules from each species do not correspond 1:1 with modules in the other species, and many do not exhibit any correspondence between species. Less than half of the modules in G. hirsutum (31 modules; 41%) and G. barbadense (19 modules, 34%) exhibit statistically significant (Fisher’s exact test; p < 0.05) correspondence with at least one module in the other species. Additionally, this correspondence is frequently 1: many; that is, most modules in the G. hirsutum network correspond to many modules in the G. barbadense network and vice versa, indicating that the modular structure is, overall, not well preserved between species (but see Figure 6 and the following). Likewise, module preservation tests between G. hirsutum and G. barbadense also suggest general divergence between these fiber coexpression networks. Of the 56 modules tested, the limiting number based on the G. barbadense network, most (37, or 66%) exhibit little to no preservation (i.e., Zsummary < 10). Of these, only ten are weakly preserved (2 < Zsummary < 10), whereas 27 (48% of tested modules) exhibit no preservation (Zsummary < 2; Supplementary Table S12). These results are generally reiterated by medianRank in that the 19 modules that exhibit strong preservation (Zsummary > 10) also exhibit the lowest medianRank scores. The larger modules (i.e., ME1-M10) generally were among those with high preservation (except ME2 and ME8), although some smaller modules were considered well-preserved.
Overall, 19 modules (34%) were considered well-preserved, many significant for development and/or domestication (Supplementary Table S12) in either G. hirsutum and/or G. barbadense. Of the five best-preserved modules (ME3, ME16, ME20, ME17, and ME43), only ME3 had functional annotations in both species, which included regulation of many cellular processes, including RNA synthesis, macromolecule metabolism, metabolic processes, transcription, and gene expression. Taken together, they show clear module differences between these independently domesticated species (Figure 6), and the general lack of preservation between G. hirsutum and G. barbadense suggests that the underlying genetic changes resulting in a similar fiber phenotype between G. hirsutum and G. barbadense have led to extensive changes in network structure both throughout speciation and under domestication. This again highlights the different transcriptomic dimensions of fiber development and domestication in the two species, despite their close relationships.

4. Discussion

4.1. Independent Domestication Has Uniquely Impacted Two Polyploid Cotton Species

In addition to its agronomic importance, Gossypium is also scientifically significant as a model system for studying diploid diversification and allopolyploidization. As reviewed elsewhere [21,97,98], two Gossypium diploids, one from Africa-Asia and the other from the Americas, hybridized during the Pleistocene, underwent genome doubling, and diversified into a new allopolyploid clade now represented by seven allotetraploid species, including the two domesticated species studied here [97,98,99,100]. Remarkably and only recently (5000–8000 years ago), in an evolutionary sense, two of the allotetraploid species and two diploid species were domesticated, each independently, in four different regions of the world in two hemispheres [19,20,22,101]. This natural and human-influenced context provides a remarkable opportunity to teach us about the comparative genomic basis of superficially similar morphological transformations that accompanied strong directional human selection under domestication. Here we focus on the two polyploid domesticates, G. hirsutum and G. barbadense. Their independent domestication provides a unique and powerful opportunity to evaluate the nature of the effects that domestication has had on the genes, biosynthetic pathways, and biological networks in each of these two species over the millennia of geographic diffusion and crop improvement that have occurred since initial domestication from wild progenitors.

4.2. Comparative Expression Analysis Supports Independent Domestication Mechanisms

Given the superficial similarity of the ancestral (wild) and descendant (crop plant) fiber phenotypes between species, the question arises as to which of these parallel morphological transformations were caused by similar suites of genetic changes, as reflected in the transcriptome. Our results indicate that while there may be cases of genetic parallelism, for the most part, G. hirsutum and G. barbadense appear to have arrived at the domesticated cotton fiber phenotype through different transcriptional and genetic alterations. This is evidenced in the principal component analysis by the lack of overlapping clusters related to domestication (Supplementary Figure S1) and the near absence of overlap in the suites of genes differentially expressed during fiber development in wild vs. domesticated accessions of both species. This latter point is illustrated by the narrow intersection of DE genes inferred to have been altered by domestication in G. barbadense and G. hirsutum; of the 24,627 and 7608 total cases of DEG in G. barbadense and G. hirsutum (representing 16,485 and 6630 non-redundant genes, respectively) in the two species, only 2259 were differentially expressed in both species, of which only 297 exhibited DE in the same direction and in the same stage. Also notable is that interspecific expression divergence began before domestication, demonstrated by the existence of two species-specific, developmentally relevant modules (i.e., ME4 and ME5, collectively representing 6663 genes).
Gossypium hirsutum has a more dynamic transcriptome than G. barbadense, particularly early in fiber development, as indicated, for example, by the substantially higher numbers of DEG (Figure 1). This lower level of differential expression during development in G. barbadense may be partially explained by a fundamental difference in the genetic distances of the comparisons in the two species; that is, in G. hirsutum, the wild representative is undoubtedly a wild plant, with extant populations scattered in several coastal regions in the Gulf of Mexico. In contrast, in G. barbadense, truly wild accessions have not been identified with certainty, and thus what we refer to as “wild” G. barbadense may represent a naturalized derivative of a primitively domesticated form that became reestablished, perhaps even thousands of years ago in the small natural range of the species in western Peru and Ecuador [21]. To the extent that this is true, one might expect lower genetic divergence and hence less transcriptomic divergence between wild and domesticated forms of G. barbadense than in G. hirsutum. As a non-mutually exclusive alternative, it may be that domestication in G. barbadense entailed fewer genetic-transcriptomic transformations for any number of biological and historical reasons (e.g., more intense human-mediated selection in G. hirsutum).
In addition to this fundamental quantitative difference in the level of transcriptomic change, the patterns of DGE over the course of fiber development also differ; in G. barbadense, the number of DGE is similar between 5 and 10 DPA, and 10 and 15 DPA, and increases between 15 and 20 DPA, whereas in G. hirsutum DGE is higher early and late (between 5 and 10 DPA, and between 15 and 20 DPA) than it is in the middle of development, between 10 and 15 DPA. We note that higher DGE is expected between 15–20 DPA, as this is the time period in both species where fiber cells enter the transition stage, during which primary cell wall elongation begins to slow, the fiber lays down the winding cell layer, and secondary wall synthesis begins.
When comparing wild and domesticated accessions in both species, generally lower differential gene expression across development was observed in the domesticates (Table 2). One possible explanation for this is that domesticated plants have more canalized developmental programs versus wild accessions, as suggested by the cottonseed transcriptome [58]. With respect to the domesticated cotton fiber, a salient example may be the general repression of the lignin biosynthetic pathway, which results in the deactivation of an entire suite of genes that would otherwise contribute to expression level divergence throughout development [67].
When comparing wild and domesticated accessions of each species at each timepoint, similar patterns of DGE emerge as observed when comparing across timepoints: higher levels of DGE in G. hirsutum when compared to G. barbadense, higher DGE at 20 DPA in G. barbadense (versus G. hirsutum), and higher DGE between wild and domesticated G. hirsutum at all other stages, peaking at 15 DPA (Table 2). Notably, this mirrors results regarding flowering time neutrality in the two species, where flowering time is controlled by a few loci of major effect in G. barbadense, whereas many loci of cumulative effect produce the same phenotype in G. hirsutum [102,103]. The observed higher levels of DGE between wild and domesticated G. barbadense at 20 DPA, however, are likely due to domesticated G. barbadense having a longer elongation period, which can last as late as 25 DPA; consequently, the transcriptional overlap of elongation and secondary wall synthesis occurs for a longer period than it does in G. hirsutum or wild G. barbadense [67], leading to greater expression differences between wild and domesticated G. barbadense at this stage. The peak in G. hirsutum DGE at 15 DPA may similarly indicate a transcriptional shift (associated with the transition stage) that is offset to an earlier timepoint in G. hirsutum.
When comparing wild G. hirsutum to wild G. barbadense, there is a striking divergence in expression profiles, indicating that these two species utilize different transcriptional pathways during fiber development, even prior to domestication (Figure 2); however, this conclusion should be tempered until truly wild G. barbadense accessions have been studied. Interestingly, when comparing domesticated G. hirsutum to domesticated G. barbadense, there are even higher levels of differential gene expression between the two species at every timepoint, exceeding the levels seen in all other comparisons discussed here (Table 2). The fact that transcriptional differences are greater between the domesticates than the wild accessions indicates that domestication has increased transcriptional divergence between these two species, even in light of historical introgression and offset in developmental chronology. These expression patterns support the hypothesis that domestication impacted G. hirsutum and G. barbadense differently, resulting in greater transcriptional divergence post-domestication than post-speciation despite being domesticated for a convergent fiber phenotype. Further study of these and other independent domestication events, such as in Phaseolus [104], will enable a deeper understanding of the relative degree of repeatability under directional selection or if, instead, domestication paints with a unique brush every time.

4.3. Network Analysis Shows Substantial Differences between G. hirsutum and G. barbadense

Network analysis indicates that the G. hirsutum coexpression network consists of 76 coexpression modules, whereas the G. barbadense network consists of 56, a notable difference in module number. Interestingly, the G. barbadense network is more similar to the meta-network constructed from all samples, which contained 58 modules. Most of the modules in the meta-network had significant associations with domestication, whereas the individual networks only exhibited significant associations with domestication in about half of the modules. The meta-network contained 25 modules that were significant for both species and domestication, 15 modules that were significant for domestication but not species, and ten modules that were significant for species and not domestication. This indicates that domestication likely has a greater impact on the network topology than speciation, as was reflected in the PCA. The meta-network contains modules with significant associations with both domestication and species, indicating that they may be targets of parallel domestication that were altered differently between species. ME7, in particular, provides an excellent example of this; it has high expression exclusively in domesticated G. hirsutum, and functional enrichment indicates that it is related to reactive oxygen species management and the fiber cytoskeleton, both of which are key to fiber development [74,76,105]. Similarly, ME14, another module related to the cytoskeleton, is significantly correlated with domestication, and shows higher expression in G. hirsutum than in G. barbadense.
Examination of the G. hirsutum and G. barbadense networks reveals that the networks are substantially different beyond simple module assignments. The gene membership of these modules differs between species, with each module in G. hirsutum corresponding to multiple modules in G. barbadense and vice versa, supporting the module preservation tests indicating that most modules in these species are not well preserved between them. There are also differences on a functional level between these species; the top five modules for each have very different functional enrichment. In G. hirsutum, the top five modules have functions that include signaling, regulation of biological processes, DNA, RNA, lipid, and protein metabolism, synthesis, and localization, microtubule cytoskeleton activity, reactive oxygen species management, hormone metabolism, ribosome synthesis, and mitochondrial processes. In G. barbadense, the top five modules have functions that include the regulation of cellular processes, DNA synthesis and repair, protein synthesis, localization, folding, polysaccharide metabolism, actin binding, and organic acid biosynthesis. In short, there are drastic differences between the individual species networks, both in terms of module preservation and function, and the meta-network suggests that these differences are due in part to domestication in addition to simple species divergence.
Despite these differences, there are some similarities between the two networks. Many modules with significant associations with domestication perform similar functions in both species. These include modules related to polysaccharide synthesis, the cytoskeleton and intracellular transport, and reactive oxygen species management. These processes are essential for fiber development and have been impacted by domestication. This indicates that while domestication has led these species down unique pathways, it is ultimately leveraging overlapping systems to arrive at a similar phenotype.
In conclusion, although earlier work has shown that domestication alters module membership in the cultivated vs. wild representatives of G. hirsutum [58,59], comparisons between the domesticated polyploid cotton species have not been made. Module preservation tests show that nearly half of the network modules are not well preserved between G. hirsutum and G. barbadense. Despite the selection for convergent fiber phenotypes and introgression in elite cultivars [18], the coexpression networks in these two species are highly dissimilar. This indicates unique but overlapping domestication pathways and speaks to the importance of considering the transcriptome when addressing questions of domestication.

4.4. Polyploidy and Homoeolog Responses to Evolutionary Transitions

An interesting dimension to domestication in G. hirsutum and G. barbadense is the presence of polyploidy-duplicated genes that arise from two species that evolved independently on different continents for approximately 5–10 million years, during which only one developed the spinnable fiber phenotype. This framework leads naturally to questions regarding whether biases exist in homoeolog usage, particularly in the context of domestication. Previous work on cotton has suggested a general D-genome bias in QTLs associated with domestication [26,106,107,108], although surveys of homoeolog expression bias have been less clear [27,109,110]. Notably, these biases appear mostly vertically inherited, although some evidence indicates that homoeolog expression bias also evolves post-polyploidization and during domestication [27,58,109,110,111]. Here we find few changes in homoeolog expression bias under domestication (Supplementary Table S3), which is expected given analyses of allelic expression in wild x domesticated G. hirsutum hybrids [112]. In an analysis of the influence of cis and trans regulation on homoeolog expression, Bao et al. (2019) found that more than 90% of homoeologs exhibit no significant change in expression under domestication, refuting the expected genome-wide bias toward alleles arising from the fiber-producing parent. This absence of general bias is also reflected in the coexpression network analyses, where the overall modular composition was generally unbiased with respect to homoeolog origin. While these results may generally suggest that homoeologs may retain a certain degree of interchangeability, the frequent placement of A- and D-homoeologs in different modules (Supplementary Table S12) indicates some degree of functional divergence may differentiate A- and D-homeologs of the same gene with respect to the fiber coexpression network structure. While this has previously been noted for G. hirsutum [27] in the context of previous observations [112], these results indicate that domestication and speciation at the polyploid level have not radically altered homoeolog expression bias. We note, though, that the multiple interacting cis- and trans-controls on gene expression in a polyploid context [112] likely generate modular connectivities and relationships that are multidimensional and transcriptomically complex, thus potentially generating the distinct modular organizations observed in the two cultivated cotton species.

5. Conclusions

Cotton fiber has the distinction of being independently domesticated four times for the same general phenotype in four different species. Underlying these broad, similar phenotypes are smaller but agronomically significant, morphological differences resulting from their independent speciation and domestication paths. The foregoing explores the powerful impact domestication has had on the fiber transcriptome of the two domesticated polyploid cotton species, G. hirsutum and G. barbadense, resulting in remarkably divergent transcriptomes and impacting expression divergence more in the 5000–6000 years since domestication than the prior half million years or so. Despite the substantial divergence in the organization of the transcriptome, the presence of conserved modules and module functions in the domesticates highlights potential parallel targets of selection. Future fine-scale analyses between these domesticated species and their wild progenitors will be paramount in understanding the origin and consequences of this remarkable expression divergence that underpins a generally convergent phenotype.

Supplementary Materials

The following supporting information can be downloaded at: https://www.mdpi.com/article/10.3390/genes14061301/s1, FigureS1: PCA of gene expression; Figure S2: UpSet plots for DGE overlaps between species; Figure S3: Eigengene graphs for ME4 and ME5; Table S1: Sampling Scheme; Table S2: TPM for DEG; Table S3: HEB within and between samples; Table S4: Significant modules in the metanetwork; Table S5: Functional enrichment of metanetwork modules; Table S6: Gene-module associations; Table S7: Module distribution of known functional genes; Table S8: Modules and annotation for species coexpression networks; Table S9: Significant modules in each species; Table S10: TopGO enrichment for species network modules; Table S11: Modular distribution of homoeologs; Table S12: Module preservation between species.

Author Contributions

Conceptualization, J.J.J. and J.F.W.; methodology, J.J.J.; formal analysis, J.J.J., C.E.G., G.H., X.X. and M.A.A.II; writing—original draft preparation, J.J.J. and C.E.G.; writing—review and editing, C.E.G., G.H., X.X., M.A.A.II, D.G.P. and J.F.W.; visualization, C.E.G., G.H. and M.A.A.II; supervision, J.F.W. and D.G.P.; project administration, J.F.W.; funding acquisition, J.F.W. and D.G.P. All authors have read and agreed to the published version of the manuscript.

Funding

This research was funded by the National Science Foundation and Cotton Inc. to J.F.W. and USDA-ARS 58-6066-0-064 to DJP.

Institutional Review Board Statement

Not applicable.

Informed Consent Statement

Not applicable.

Data Availability Statement

All code is available at https://github.com/Wendellab/AD2-vs-AD1 (accessed on 19 June 2023). Sequence data is deposited under PRJNA TBD.

Acknowledgments

We would like to thank Emma Miller for her assistance in the laboratory and greenhouse, Anna Tuchin for her assistance with RNA extractions, and Kenneth McCabe for managing the greenhouse. This work was partly funded by the National Science Foundation Plant Genome Program and Cotton Incorporated. We thank the Iowa State ResearchIT unit for assistance with computational resources.

Conflicts of Interest

The authors declare no conflict of interest.

References

  1. Diamond, J. Evolution, Consequences and Future of Plant and Animal Domestication. Nature 2002, 418, 700–707. [Google Scholar] [CrossRef]
  2. Meyer, R.S.; Purugganan, M.D. Evolution of Crop Species: Genetics of Domestication and Diversification. Nat. Rev. Genet. 2013, 14, 840–852. [Google Scholar] [CrossRef] [PubMed]
  3. Teletchea, F. Animal Domestication: A Brief Overview. In Animal Domestication; Teletchea, F., Ed.; IntechOpen: London, UK, 2019; ISBN 9781838801748. [Google Scholar]
  4. Doebley, J.F.; Gaut, B.S.; Smith, B.D. The Molecular Genetics of Crop Domestication. Cell 2006, 127, 1309–1321. [Google Scholar] [CrossRef] [Green Version]
  5. Purugganan, M.D. Evolutionary Insights into the Nature of Plant Domestication. Curr. Biol. 2019, 29, R705–R714. [Google Scholar] [CrossRef] [PubMed] [Green Version]
  6. Purugganan, M.D.; Fuller, D.Q. The Nature of Selection during Plant Domestication. Nature 2009, 457, 843–848. [Google Scholar] [CrossRef] [PubMed]
  7. Gross, B.L.; Olsen, K.M. Genetic Perspectives on Crop Domestication. Trends Plant Sci. 2010, 15, 529–537. [Google Scholar] [CrossRef] [Green Version]
  8. Purugganan, M.D. What Is Domestication? Trends Ecol. Evol. 2022, 37, 663–671. [Google Scholar] [CrossRef]
  9. Olsen, K.M.; Wendel, J.F. A Bountiful Harvest: Genomic Insights into Crop Domestication Phenotypes. Annu. Rev. Plant Biol. 2013, 64, 47–70. [Google Scholar] [CrossRef] [Green Version]
  10. Meyer, R.S.; DuVal, A.E.; Jensen, H.R. Patterns and Processes in Crop Domestication: An Historical Review and Quantitative Analysis of 203 Global Food Crops. New Phytol. 2012, 196, 29–48. [Google Scholar] [CrossRef]
  11. Sakuma, S.; Salomon, B.; Komatsuda, T. The Domestication Syndrome Genes Responsible for the Major Changes in Plant Form in the Triticeae Crops. Plant Cell Physiol. 2011, 52, 738–749. [Google Scholar] [CrossRef] [Green Version]
  12. Konishi, S.; Izawa, T.; Lin, S.Y.; Ebana, K.; Fukuta, Y.; Sasaki, T.; Yano, M. An SNP Caused Loss of Seed Shattering during Rice Domestication. Science 2006, 312, 1392–1396. [Google Scholar] [CrossRef] [Green Version]
  13. Paran, I.; van der Knaap, E. Genetic and Molecular Regulation of Fruit and Plant Domestication Traits in Tomato and Pepper. J. Exp. Bot. 2007, 58, 3841–3852. [Google Scholar] [CrossRef] [Green Version]
  14. Jin, J.; Huang, W.; Gao, J.-P.; Yang, J.; Shi, M.; Zhu, M.-Z.; Luo, D.; Lin, H.-X. Genetic Control of Rice Plant Architecture under Domestication. Nat. Genet. 2008, 40, 1365–1369. [Google Scholar] [CrossRef]
  15. Swanson-Wagner, R.; Briskine, R.; Schaefer, R.; Hufford, M.B.; Ross-Ibarra, J.; Myers, C.L.; Tiffin, P.; Springer, N.M. Reshaping of the Maize Transcriptome by Domestication. Proc. Natl. Acad. Sci. USA 2012, 109, 11878–11883. [Google Scholar] [CrossRef] [Green Version]
  16. Moyers, B.T.; Morrell, P.L.; McKay, J.K. Genetic Costs of Domestication and Improvement. J. Hered. 2018, 109, 103–116. [Google Scholar] [CrossRef] [Green Version]
  17. Constable, G.; Llewellyn, D.; Walford, S.A.; Clement, J.D. Cotton Breeding for Fiber Quality Improvement. In Industrial Crops: Breeding for Bioenergy and Bioproducts; Cruz, V.M.V., Dierig, D.A., Eds.; Springer: New York, NY, USA, 2015; pp. 191–232. ISBN 9781493914470. [Google Scholar]
  18. Yuan, D.; Grover, C.E.; Hu, G.; Pan, M.; Miller, E.R.; Conover, J.L.; Hunt, S.P.; Udall, J.A.; Wendel, J.F. Parallel and Intertwining Threads of Domestication in Allopolyploid Cotton. Adv. Sci. 2021, 8, 2003634. [Google Scholar] [CrossRef] [PubMed]
  19. Westengen, O.T.; Huamán, Z.; Heun, M. Genetic Diversity and Geographic Pattern in Early South American Cotton Domestication. Theor. Appl. Genet. 2005, 110, 392–402. [Google Scholar] [CrossRef]
  20. Percy, R.G.; Wendel, J.F. Allozyme Evidence for the Origin and Diversification of Gossypium barbadense L. Theor. Appl. Genet. 1990, 79, 529–542. [Google Scholar] [CrossRef] [Green Version]
  21. Viot, C.R.; Wendel, J.F. Evolution of the Cotton Genus, Gossypium, and Its Domestication in the Americas. CRC Crit. Rev. Plant Sci. 2023, 42, 1–33. [Google Scholar] [CrossRef]
  22. Wendel, J.F.; Brubaker, C.L.; Percival, A.E. Genetic Diversity in Gossypium hirsutum and the Origin of Upland Cotton. Am. J. Bot. 1992, 79, 1291–1310. [Google Scholar] [CrossRef] [Green Version]
  23. Brubaker, C.L.; Koontz, J.A.; Wendel, J.F. Bidirectional Cytoplasmic and Nuclear Introgression in the New World Cottons Gossypium barbadense and G. hirsutum (Malvaceae). Am. J. Bot. 1993, 80, 1203–1208. [Google Scholar] [CrossRef]
  24. Zhang, J.; Percy, R.G.; McCarty, J.C. Introgression Genetics and Breeding between Upland and Pima Cotton: A Review. Euphytica 2014, 198, 1–12. [Google Scholar] [CrossRef]
  25. Lu, Q.; Shi, Y.; Xiao, X.; Li, P.; Gong, J.; Gong, W.; Huang, J. Transcriptome Analysis Suggests That Chromosome Introgression Fragments from Sea Island Cotton (Gossypium barbadense) Increase Fiber Strength in Upland Cotton. G3 Genes 2017, 7, 3469–3479. [Google Scholar]
  26. Grover, C.E.; Yoo, M.-J.; Lin, M.; Murphy, M.D.; Harker, D.B.; Byers, R.L.; Lipka, A.E.; Hu, G.; Yuan, D.; Conover, J.L.; et al. Genetic Analysis of the Transition from Wild to Domesticated Cotton (Gossypium hirsutum L.). G3 Genes Genomes Genet. 2020, 10, 731–754. [Google Scholar]
  27. Gallagher, J.P.; Grover, C.E.; Hu, G.; Jareczek, J.J.; Wendel, J.F. Conservation and Divergence in Duplicated Fiber Coexpression Networks Accompanying Domestication of the Polyploid Gossypium hirsutum L. G3 Genes Genomes Genet. 2020, 10, 2879–2892. [Google Scholar] [CrossRef]
  28. Chen, X.; Guo, W.; Liu, B.; Zhang, Y.; Song, X.; Cheng, Y.; Zhang, L.; Zhang, T. Molecular Mechanisms of Fiber Differential Development between G. barbadense and G. hirsutum Revealed by Genetical Genomics. PLoS ONE 2012, 7, e30056. [Google Scholar] [CrossRef] [Green Version]
  29. Mei, H.; Qi, B.; Han, Z.; Zhao, T.; Guo, M.; Han, J.; Zhang, J.; Guan, X.; Hu, Y.; Zhang, T.; et al. Subgenome Bias and Temporal Postponement of Gene Expression Contributes to the Distinctions of Fiber Quality in Gossypium Species. Front. Plant Sci. 2021, 12, 819679. [Google Scholar] [CrossRef]
  30. Jiao, Y.; Long, Y.; Xu, K.; Zhao, F.; Zhao, J.; Li, S.; Geng, S.; Gao, W.; Sun, P.; Deng, X.; et al. Weighted Gene Co-Expression Network Analysis Reveals Hub Genes for Fuzz Development in Gossypium hirsutum. Genes 2023, 14, 208. [Google Scholar] [CrossRef]
  31. Zou, X.; Liu, A.; Zhang, Z.; Ge, Q.; Fan, S.; Gong, W.; Li, J.; Gong, J.; Shi, Y.; Tian, B.; et al. Co-Expression Network Analysis and Hub Gene Selection for High-Quality Fiber in Upland Cotton (Gossypium hirsutum) Using RNA Sequencing Analysis. Genes 2019, 10, 119. [Google Scholar] [CrossRef] [Green Version]
  32. Duan, Y.; Chen, Q.; Chen, Q.; Zheng, K.; Cai, Y.; Long, Y.; Zhao, J.; Guo, Y.; Sun, F.; Qu, Y. Analysis of Transcriptome Data and Quantitative Trait Loci Enables the Identification of Candidate Genes Responsible for Fiber Strength in Gossypium barbadense. G3 2022, 12, jkac167. [Google Scholar] [CrossRef]
  33. Tu, L.-L.; Zhang, X.-L.; Liang, S.-G.; Liu, D.-Q.; Zhu, L.-F.; Zeng, F.-C.; Nie, Y.-C.; Guo, X.-P.; Deng, F.-L.; Tan, J.-F.; et al. Genes Expression Analyses of Sea-Island Cotton (Gossypium barbadense L.) during Fiber Development. Plant Cell Rep. 2007, 26, 1309–1320. [Google Scholar] [CrossRef] [PubMed]
  34. Qin, Y.; Sun, H.; Hao, P.; Wang, H.; Wang, C.; Ma, L.; Wei, H.; Yu, S. Transcriptome Analysis Reveals Differences in the Mechanisms of Fiber Initiation and Elongation between Long- and Short-Fiber Cotton (Gossypium hirsutum L.) Lines. BMC Genom. 2019, 20, 633. [Google Scholar] [CrossRef] [Green Version]
  35. Li, P.-T.; Wang, M.; Lu, Q.-W.; Ge, Q.; Rashid, M.H.O.; Liu, A.-Y.; Gong, J.-W.; Shang, H.-H.; Gong, W.-K.; Li, J.-W.; et al. Comparative Transcriptome Analysis of Cotton Fiber Development of Upland Cotton (Gossypium hirsutum) and Chromosome Segment Substitution Lines from G. hirsutum × G. barbadense. BMC Genom. 2017, 18, 705. [Google Scholar] [CrossRef] [Green Version]
  36. Li, X.; Wu, M.; Liu, G.; Pei, W.; Zhai, H.; Yu, J.; Zhang, J.; Yu, S. Identification of Candidate Genes for Fiber Length Quantitative Trait Loci through RNA-Seq and Linkage and Physical Mapping in Cotton. BMC Genom. 2017, 18, 427. [Google Scholar] [CrossRef] [PubMed] [Green Version]
  37. Naoumkina, M.; Thyssen, G.N.; Fang, D.D. RNA-Seq Analysis of Short Fiber Mutants Ligon-Lintless-1 (Li1) and -2 (Li2) Revealed Important Role of Aquaporins in Cotton (Gossypium hirsutum L.) Fiber Elongation. BMC Plant Biol. 2015, 15, 65. [Google Scholar] [CrossRef] [Green Version]
  38. Gilbert, M.K.; Kim, H.J.; Tang, Y.; Naoumkina, M.; Fang, D.D. Comparative Transcriptome Analysis of Short Fiber Mutants Ligon-Lintless 1 and 2 Reveals Common Mechanisms Pertinent to Fiber Elongation in Cotton (Gossypium hirsutum L.). PLoS ONE 2014, 9, e95554. [Google Scholar] [CrossRef]
  39. Islam, M.S.; Fang, D.D.; Thyssen, G.N.; Delhom, C.D.; Liu, Y.; Kim, H.J. Comparative Fiber Property and Transcriptome Analyses Reveal Key Genes Potentially Related to High Fiber Strength in Cotton (Gossypium hirsutum L.) Line MD52ne. BMC Plant Biol. 2016, 16, 36. [Google Scholar] [CrossRef] [Green Version]
  40. Jiang, X.; Fan, L.; Li, P.; Zou, X.; Zhang, Z.; Fan, S.; Gong, J.; Yuan, Y.; Shang, H. Co-Expression Network and Comparative Transcriptome Analysis for Fiber Initiation and Elongation Reveal Genetic Differences in Two Lines from Upland Cotton CCRI70 RIL Population. PeerJ 2021, 9, e11812. [Google Scholar] [CrossRef]
  41. Hovav, R.; Chaudhary, B.; Udall, J.A.; Flagel, L.; Wendel, J.F. Parallel Domestication, Convergent Evolution and Duplicated Gene Recruitment in Allopolyploid Cotton. Genetics 2008, 179, 1725–1733. [Google Scholar] [CrossRef] [PubMed] [Green Version]
  42. Bolger, A.M.; Lohse, M.; Usadel, B. Trimmomatic: A Flexible Trimmer for Illumina Sequence Data. Bioinformatics 2014, 30, 2114–2120. [Google Scholar] [CrossRef] [PubMed] [Green Version]
  43. Gamblin, T.; LeGendre, M.; Collette, M.R.; Lee, G.L.; Moody, A.; De Supinski, B.R.; Futral, S. The Spack Package Manager: Bringing Order to HPC Software Chaos. In Proceedings of the SC15: International Conference for High-Performance Computing, Networking, Storage and Analysis, Austin, TX, USA, 15–20 November 2015; pp. 1–12. [Google Scholar]
  44. Paterson, A.H.; Wendel, J.F.; Gundlach, H.; Guo, H.; Jenkins, J.; Jin, D.; Llewellyn, D.; Showmaker, K.C.; Shu, S.; Udall, J.; et al. Repeated Polyploidization of Gossypium Genomes and the Evolution of Spinnable Cotton Fibres. Nature 2012, 492, 423–427. [Google Scholar] [CrossRef] [PubMed] [Green Version]
  45. Page, J.T.; Gingle, A.R.; Udall, J.A. PolyCat: A Resource for Genome Categorization of Sequencing Reads from Allopolyploid Organisms. G3 2013, 3, 517–525. [Google Scholar] [CrossRef] [PubMed] [Green Version]
  46. Bray, N.L.; Pimentel, H.; Melsted, P.; Pachter, L. Erratum: Near-Optimal Probabilistic RNA-Seq Quantification. Nat. Biotechnol. 2016, 34, 888. [Google Scholar] [CrossRef] [PubMed] [Green Version]
  47. R Core Team. R: A Language and Environment for Statistical Computing; R Foundation for Statistical Computing: Vienna, Austria, 2022. [Google Scholar]
  48. Love, M.I.; Huber, W.; Anders, S. Moderated Estimation of Fold Change and Dispersion for RNA-Seq Data with DESeq2. Genome Biol. 2014, 15, 550. [Google Scholar] [CrossRef] [PubMed] [Green Version]
  49. Benjamini, Y.; Hochberg, Y. Controlling the False Discovery Rate: A Practical and Powerful Approach to Multiple Testing. J. R. Stat. Soc. Series B Stat. Methodol. 1995, 57, 289–300. [Google Scholar] [CrossRef]
  50. Krassowski, M.; Arts, M.; Lagger, C.; Max. Krassowski/Complex-Upset: v1.3.5; 2022. [Google Scholar]
  51. Wickham, H. ggplot2: Elegant Graphics for Data Analysis; Springer: New York, NY, USA, 2016; ISBN 9783319242774. [Google Scholar]
  52. Wickham, H.; Averick, M.; Bryan, J.; Chang, W.; McGowan, L.; François, R.; Grolemund, G.; Hayes, A.; Henry, L.; Hester, J.; et al. Welcome to the Tidyverse. J. Open Source Softw. 2019, 4, 1686. [Google Scholar] [CrossRef] [Green Version]
  53. Bache; Wickham. Magrittr: A Forward-Pipe Operator for R; R package Version.
  54. Dowle; Srinivasan; Gorecki. Chirico Package “Data. Table”; Extension of Data.
  55. Pantano DEGreport: Report of DEG Analysis; R Package Version, NJ, USA.
  56. Langfelder, P.; Horvath, S. WGCNA: An R Package for Weighted Correlation Network Analysis. BMC Bioinform. 2008, 9, 559. [Google Scholar] [CrossRef] [Green Version]
  57. Langfelder, P.; Luo, R.; Oldham, M.C.; Horvath, S. Is My Network Module Preserved and Reproducible? PLoS Comput. Biol. 2011, 7, e1001057. [Google Scholar] [CrossRef] [Green Version]
  58. Hu, G.; Hovav, R.; Grover, C.E.; Faigenboim-Doron, A.; Kadmon, N.; Page, J.T.; Udall, J.A.; Wendel, J.F. Evolutionary Conservation and Divergence of Gene Coexpression Networks in Gossypium (cotton) Seeds. Genome Biol. Evol. 2016, 8, 3765–3783. [Google Scholar]
  59. Yip, A.M.; Horvath, S. Gene Network Interconnectedness and the Generalized Topological Overlap Measure. BMC Bioinform. 2007, 8, 22. [Google Scholar] [CrossRef] [PubMed] [Green Version]
  60. Alexa, A.; Rahnenfuhrer, J. TopGo: Enrichment Analysis for Gene Ontology; 2016. [Google Scholar]
  61. Lee, C.M.; Kafle, K.; Belias, D.W.; Park, Y.B.; Glick, R.E.; Haigler, C.H.; Kim, S.H. Comprehensive Analysis of Cellulose Content, Crystallinity, and Lateral Packing in Gossypium hirsutum and Gossypium barbadense Cotton Fibers Using Sum Frequency Generation, Infrared and Raman Spectroscopy, and X-ray Diffraction. Cellulose 2015, 22, 971–989. [Google Scholar] [CrossRef]
  62. Salnikov, V.V.; Grimson, M.J.; Seagull, R.W.; Haigler, C.H. Localization of Sucrose Synthase and Callose in Freeze-Substituted Secondary-Wall-Stage Cotton Fibers. Protoplasma 2003, 221, 175–184. [Google Scholar] [CrossRef] [PubMed]
  63. Lee, Y.-R.J. Cytoskeletal Motors in Arabidopsis. Sixty-One Kinesins and Seventeen Myosins. Plant Physiol. 2004, 136, 3877–3883. [Google Scholar] [CrossRef] [PubMed] [Green Version]
  64. Augustine, R.C.; Vidali, L.; Kleinman, K.P.; Bezanilla, M. Actin Depolymerizing Factor Is Essential for Viability in Plants, and Its Phosphoregulation Is Important for Tip Growth. Plant J. 2008, 54, 863–875. [Google Scholar] [CrossRef] [Green Version]
  65. Cosgrove, D.J. Plant Expansins: Diversity and Interactions with Plant Cell Walls. Curr. Opin. Plant Biol. 2015, 25, 162–172. [Google Scholar] [CrossRef] [Green Version]
  66. Suarez, C.; Carroll, R.T.; Burke, T.A.; Christensen, J.R.; Bestul, A.J.; Sees, J.A.; James, M.L.; Sirotkin, V.; Kovar, D.R. Profilin Regulates F-Actin Network Homeostasis by Favoring Formin over Arp2/3 Complex. Dev. Cell 2015, 32, 43–53. [Google Scholar] [CrossRef] [Green Version]
  67. Tuttle, J.R.; Nah, G.; Duke, M.V.; Alexander, D.C.; Guan, X.; Song, Q.; Chen, Z.J.; Scheffler, B.E.; Haigler, C.H. Metabolomic and Transcriptomic Insights into How Cotton Fiber Transitions to Secondary Wall Synthesis, Represses Lignification, and Prolongs Elongation. BMC Genom. 2015, 16, 477. [Google Scholar] [CrossRef] [Green Version]
  68. Salih, H.; Gong, W.; He, S.; Sun, G.; Sun, J.; Du, X. Genome-Wide Characterization and Expression Analysis of MYB Transcription Factors in Gossypium hirsutum. BMC Genet. 2016, 17, 129. [Google Scholar] [CrossRef] [Green Version]
  69. Zhang, J.; Huang, G.-Q.; Zou, D.; Yan, J.-Q.; Li, Y.; Hu, S.; Li, X.-B. The Cotton (Gossypium hirsutum) NAC Transcription Factor (FSN1) as a Positive Regulator Participates in Controlling Secondary Cell Wall Biosynthesis and Modification of Fibers. New Phytol. 2018, 217, 625–640. [Google Scholar] [CrossRef] [Green Version]
  70. McCurdy, D.W.; Kovar, D.R.; Staiger, C.J. Actin and Actin-Binding Proteins in Higher Plants. Protoplasma 2001, 215, 89–104. [Google Scholar] [CrossRef]
  71. Desprez, T.; Juraniec, M.; Crowell, E.F.; Jouy, H.; Pochylova, Z.; Parcy, F.; Höfte, H.; Gonneau, M.; Vernhettes, S. Organization of Cellulose Synthase Complexes Involved in Primary Cell Wall Synthesis in Arabidopsis thaliana. Proc. Natl. Acad. Sci. USA 2007, 104, 15572–15577. [Google Scholar] [CrossRef] [Green Version]
  72. Liu, Q.; Talbot, M.; Llewellyn, D.J. Pectin Methylesterase and Pectin Remodelling Differ in the Fibre Walls of Two Gossypium Species with Very Different Fibre Properties. PLoS ONE 2013, 8, e65131. [Google Scholar] [CrossRef] [PubMed] [Green Version]
  73. Hovav, R.; Udall, J.A.; Chaudhary, B.; Hovav, E.; Flagel, L.; Hu, G.; Wendel, J.F. The Evolution of Spinnable Cotton Fiber Entailed Prolonged Development and a Novel Metabolism. PLoS Genet. 2008, 4, e25. [Google Scholar] [CrossRef] [PubMed] [Green Version]
  74. Chaudhary, B.; Hovav, R.; Flagel, L.; Mittler, R.; Wendel, J.F. Parallel Expression Evolution of Oxidative Stress-Related Genes in Fiber from Wild and Domesticated Diploid and Polyploid Cotton (Gossypium). BMC Genom. 2009, 10, 378. [Google Scholar] [CrossRef] [PubMed] [Green Version]
  75. Xu, Y.; Magwanga, R.O.; Cai, X.; Zhou, Z.; Wang, X.; Wang, Y.; Zhang, Z.; Jin, D.; Guo, X.; Wei, Y.; et al. Deep Transcriptome Analysis Reveals Reactive Oxygen Species (ROS) Network Evolution, Response to Abiotic Stress, and Regulation of Fiber Development in Cotton. Int. J. Mol. Sci. 2019, 20, 1863. [Google Scholar] [CrossRef] [Green Version]
  76. Seagull, R.W. Cytoskeletal Involvement in Cotton Fiber Growth and Development. Micron 1993, 24, 643–660. [Google Scholar] [CrossRef]
  77. Bartolini, F.; Gundersen, G.G. Formins and Microtubules. Biochim. Biophys. Acta 2010, 1803, 164–173. [Google Scholar] [CrossRef] [Green Version]
  78. Zheng, H.; von Mollard, G.F.; Kovaleva, V.; Stevens, T.H.; Raikhel, N.V. The Plant Vesicle-Associated SNARE AtVTI1a Likely Mediates Vesicle Transport from the Trans-Golgi Network to the Prevacuolar Compartment. Mol. Biol. Cell 1999, 10, 2251–2264. [Google Scholar] [CrossRef] [Green Version]
  79. Meagher, R.B.; Fechheimer, M. The Arabidopsis Cytoskeletal Genome. Arab. Book 2003, 2, e0096. [Google Scholar] [CrossRef] [Green Version]
  80. Preuss, M.L.; Kovar, D.R.; Lee, Y.-R.J.; Staiger, C.J.; Delmer, D.P.; Liu, B. A Plant-Specific Kinesin Binds to Actin Microfilaments and Interacts with Cortical Microtubules in Cotton Fibers. Plant Physiol. 2004, 136, 3945–3955. [Google Scholar] [CrossRef] [Green Version]
  81. Chen, X.; Irani, N.G.; Friml, J. Clathrin-Mediated Endocytosis: The Gateway into Plant Cells. Curr. Opin. Plant Biol. 2011, 14, 674–682. [Google Scholar] [CrossRef]
  82. Huang, S.; Qu, X.; Zhang, R. Plant Villins: Versatile Actin Regulatory Proteins. J. Integr. Plant Biol. 2015, 57, 40–49. [Google Scholar] [CrossRef] [PubMed]
  83. Huang, Y.; Wang, J.; Zhang, L.; Zuo, K. A Cotton Annexin Protein AnxGb6 Regulates Fiber Elongation through Its Interaction with Actin 1. PLoS ONE 2013, 8, e66160. [Google Scholar] [CrossRef] [PubMed] [Green Version]
  84. Ma, Z.; He, S.; Wang, X.; Sun, J.; Zhang, Y.; Zhang, G.; Wu, L.; Li, Z.; Liu, Z.; Sun, G.; et al. Resequencing a Core Collection of Upland Cotton Identifies Genomic Variation and Loci Influencing Fiber Quality and Yield. Nat. Genet. 2018, 50, 803–813. [Google Scholar] [CrossRef]
  85. Qin, Y.-M.; Hu, C.-Y.; Zhu, Y.-X. The Ascorbate Peroxidase Regulated by H2O2 and Ethylene Is Involved in Cotton Fiber Cell Elongation by Modulating ROS Homeostasis. Plant Signal. Behav. 2008, 3, 194–196. [Google Scholar] [CrossRef] [Green Version]
  86. Gao, Z.; Sun, W.; Wang, J.; Zhao, C.; Zuo, K. GhbHLH18 Negatively Regulates Fiber Strength and Length by Enhancing Lignin Biosynthesis in Cotton Fibers. Plant Sci. 2019, 286, 7–16. [Google Scholar] [CrossRef]
  87. Niu, Q.; Tan, K.; Zang, Z.; Xiao, Z.; Chen, K.; Hu, M.; Luo, M. Modification of Phytosterol Composition Influences Cotton Fiber Cell Elongation and Secondary Cell Wall Deposition. BMC Plant Biol. 2019, 19, 208. [Google Scholar] [CrossRef] [PubMed] [Green Version]
  88. Deng, T.; Yao, H.; Wang, J.; Wang, J.; Xue, H.; Zuo, K. GhLTPG1, a Cotton GPI-Anchored Lipid Transfer Protein, Regulates the Transport of Phosphatidylinositol Monophosphates and Cotton Fiber Elongation. Sci. Rep. 2016, 6, 26829. [Google Scholar] [CrossRef] [Green Version]
  89. Shan, C.-M.; Shangguan, X.-X.; Zhao, B.; Zhang, X.-F.; Chao, L.-M.; Yang, C.-Q.; Wang, L.-J.; Zhu, H.-Y.; Zeng, Y.-D.; Guo, W.-Z.; et al. Control of Cotton Fibre Elongation by a Homeodomain Transcription Factor GhHOX3. Nat. Commun. 2014, 5, 5519. [Google Scholar] [CrossRef] [Green Version]
  90. Qin, L.-X.; Chen, Y.; Zeng, W.; Li, Y.; Gao, L.; Li, D.-D.; Bacic, A.; Xu, W.-L.; Li, X.-B. The Cotton β-Galactosyltransferase 1 (GalT1) That Galactosylates Arabinogalactan Proteins Participates in Controlling Fiber Development. Plant J. 2017, 89, 957–971. [Google Scholar] [CrossRef] [Green Version]
  91. Thyssen, G.N.; Fang, D.D.; Turley, R.B.; Florane, C.B.; Li, P.; Mattison, C.P.; Naoumkina, M. A Gly65Val Substitution in an Actin, GhACT_LI1, Disrupts Cell Polarity and F-Actin Organization Resulting in Dwarf, Lintless Cotton Plants. Plant J. 2017, 90, 111–121. [Google Scholar] [CrossRef] [Green Version]
  92. Lee, J.; Burns, T.H.; Light, G.; Sun, Y.; Fokar, M.; Kasukabe, Y.; Fujisawa, K.; Maekawa, Y.; Allen, R.D. Xyloglucan Endotransglycosylase/hydrolase Genes in Cotton and Their Role in Fiber Elongation. Planta 2010, 232, 1191–1205. [Google Scholar] [CrossRef]
  93. Maris, A.; Kaewthai, N.; Eklöf, J.M.; Miller, J.G.; Brumer, H.; Fry, S.C.; Verbelen, J.-P.; Vissenberg, K. Differences in Enzymic Properties of Five Recombinant Xyloglucan Endotransglucosylase/hydrolase (XTH) Proteins of Arabidopsis thaliana. J. Exp. Bot. 2011, 62, 261–271. [Google Scholar] [CrossRef] [Green Version]
  94. Madson, M.; Dunand, C.; Li, X.; Verma, R.; Vanzin, G.F.; Caplan, J.; Shoue, D.A.; Carpita, N.C.; Reiter, W.-D. The MUR3 Gene of Arabidopsis Encodes a Xyloglucan Galactosyltransferase That Is Evolutionarily Related to Animal Exostosins. Plant Cell 2003, 15, 1662–1670. [Google Scholar] [CrossRef] [Green Version]
  95. Amos, R.A.; Mohnen, D. Critical Review of Plant Cell Wall Matrix Polysaccharide Glycosyltransferase Activities Verified by Heterologous Protein Expression. Front. Plant Sci. 2019, 10, 915. [Google Scholar] [CrossRef] [Green Version]
  96. Lv, F.; Wang, H.; Wang, X.; Han, L.; Ma, Y.; Wang, S.; Feng, Z.; Niu, X.; Cai, C.; Kong, Z.; et al. GhCFE1A, a Dynamic Linker between the ER Network and Actin Cytoskeleton, Plays an Important Role in Cotton Fibre Cell Initiation and Elongation. J. Exp. Bot. 2015, 66, 1877–1889. [Google Scholar] [CrossRef] [Green Version]
  97. Hu, G.; Grover, C.E.; Yuan, D.; Dong, Y.; Miller, E.; Conover, J.L.; Wendel, J.F. Evolution and Diversity of the Cotton Genome. In Cotton Precision Breeding; Rahman, M.-U., Zafar, Y., Zhang, T., Eds.; Springer International Publishing: Cham, Switzerland, 2021; pp. 25–78. ISBN 9783030645045. [Google Scholar]
  98. Wendel, J.F.; Grover, C.E. Taxonomy and Evolution of the Cotton Genus, Gossypium. In Cotton; Agronomy Monograph; American Society of Agronomy, Inc.: Madison, WI, USA; Crop Science Society of America, Inc.: Madison, WI, USA; Soil Science Society of America, Inc.: Madison, WI, USA, 2015; pp. 25–44. ISBN 9780891186267. [Google Scholar]
  99. Gallagher, J.P.; Grover, C.E.; Rex, K.; Moran, M.; Wendel, J.F. A New Species of Cotton from Wake Atoll, Gossypium Stephensii (Malvaceae). Syst. Bot. 2017, 42, 115–123. [Google Scholar] [CrossRef] [Green Version]
  100. Grover, C.E.; Zhu, X.; Grupp, K.K.; Jareczek, J.J.; Gallagher, J.P.; Szadkowski, E.; Seijo, J.G.; Wendel, J.F. Molecular Confirmation of Species Status for the Allopolyploid Cotton Species, Gossypium Ekmanianum Wittmack. Genet. Resour. Crop Evol. 2015, 62, 103–114. [Google Scholar] [CrossRef] [Green Version]
  101. Brubaker, C.L.; Wendel, J.F. Reevaluating the Origin of Domesticated Cotton (Gossypium hirsutum; Malvaceae) Using Nuclear Restriction Fragment Length Polymorphisms (RFLPs). Am. J. Bot. 1994, 81, 1309–1326. [Google Scholar] [CrossRef]
  102. Kohel, R.J.; Richmond, T.R.; Lewis, C.F. Genetics of Flowering Response in Cotton. VI. Flowering Behavior of Gossypium hirsutum L. and G. barbadense L. Hybrids. Crop. Sci. 1974, 14, 696–699. [Google Scholar] [CrossRef]
  103. Lewis, C.F.; Richmond, T.R. The Genetics of Flowering Response in Cotton. II. Inheritance of Flowering Response in a Gossypium barbadense Cross. Genetics 1960, 45, 79–85. [Google Scholar] [CrossRef] [PubMed]
  104. Bitocchi, E.; Rau, D.; Bellucci, E.; Rodriguez, M.; Murgia, M.L.; Gioia, T.; Santo, D.; Nanni, L.; Attene, G.; Papa, R. Beans (Phaseolus Ssp.) as a Model for Understanding Crop Evolution. Front. Plant Sci. 2017, 8, 722. [Google Scholar] [CrossRef] [PubMed] [Green Version]
  105. Graham, B.P.; Haigler, C.H. Microtubules Exert Early, Partial, and Variable Control of Cotton Fiber Diameter. Planta 2021, 253, 47. [Google Scholar] [CrossRef] [PubMed]
  106. Jiang, C.; Wright, R.J.; El-Zik, K.M.; Paterson, A.H. Polyploid Formation Created Unique Avenues for Response to Selection in Gossypium (cotton). Proc. Natl. Acad. Sci. USA 1998, 95, 4419–4424. [Google Scholar] [CrossRef] [Green Version]
  107. Lacape, J.-M.; Nguyen, T.-B.; Courtois, B.; Belot, J.-L.; Giband, M.; Gourlot, J.-P.; Gawryziak, G.; Roques, S.; Hau, B. QTL Analysis of Cotton Fiber Quality Using Multiple Gossypium hirsutum Gossypium barbadense Backcross Generations. Crop Sci. 2005, 45, 123–140. [Google Scholar] [CrossRef]
  108. Said, J.I.; Song, M.; Wang, H.; Lin, Z.; Zhang, X.; Fang, D.D.; Zhang, J. A Comparative Meta-Analysis of QTL between Intraspecific Gossypium hirsutum and Interspecific G. hirsutum × G. barbadense Populations. Mol. Genet. Genom. 2015, 290, 1003–1025. [Google Scholar] [CrossRef]
  109. Yoo, M.-J.; Szadkowski, E.; Wendel, J.F. Homoeolog Expression Bias and Expression Level Dominance in Allopolyploid Cotton. Heredity 2013, 110, 171–180. [Google Scholar] [CrossRef] [Green Version]
  110. Chaudhary, B.; Flagel, L.; Stupar, R.M.; Udall, J.A.; Verma, N.; Springer, N.M.; Wendel, J.F. Reciprocal Silencing, Transcriptional Bias and Functional Divergence of Homeologs in Polyploid Cotton (Gossypium). Genetics 2009, 182, 503–517. [Google Scholar] [CrossRef] [Green Version]
  111. Flagel, L.; Udall, J.; Nettleton, D.; Wendel, J. Duplicate Gene Expression in Allopolyploid Gossypium Reveals Two Temporally Distinct Phases of Expression Evolution. BMC Biol. 2008, 6, 16. [Google Scholar] [CrossRef] [Green Version]
  112. Bao, Y.; Hu, G.; Grover, C.E.; Conover, J.; Yuan, D.; Wendel, J.F. Unraveling Cis and Trans Regulatory Evolution during Cotton Domestication. Nat. Commun. 2019, 10, 5399. [Google Scholar] [CrossRef] [PubMed] [Green Version]
Figure 1. Differential gene expression between fiber samples of G. barbadense (AD2) and G. hirsutum (AD1). Comparisons of four developmental timepoints (5, 10, 15, and 20 days post-anthesis) were conducted (a) within AD2, (b) within AD1, and between (c) wild AD1 versus wild AD2, and (d) domesticated AD1 versus domesticated AD2. Arrows indicate the direction of comparison from test to reference. Red indicates genes that are more highly expressed. Blue indicates genes that are lowlier expressed.
Genes 14 01301 g001
Figure 2. Upset plots comparing DGE overlaps in G. hirsutum (AD1) and G. barbadense (AD2) wild and domesticated accessions between developmental timepoints. (a) Upregulated genes at 10 vs. 5 days post anthesis (DPA); (b) Downregulated genes at 10 vs. 5 DPA; (c) Upregulated genes at 15 vs. 10 DPA; (d) Downregulated genes at 15 vs. 10 DPA; (e) Upregulated genes at 20 vs. 15 DPA; and (f) Downregulated genes at 20 vs. 15 DPA. Set sizes (i.e., the number of genes in each category) are displayed on the left side of each plot, and the intersections are displayed above. The total number of genes in each intersection category (denoted by the black connected dots) is listed above the bar, and each bar is colored based on the homoeolog composition (A vs. D) of that interaction category. Sets are named based on which species are involved (i.e., “AD1” or “AD2”), the DPA(s) under consideration (i.e., 5, 10, 15, and/or 20), the condition (i.e., w = wild, d = domesticated) and whether the set represents up- or downregulated genes. In all instances, the latter DPA is contrasted with the earlier DPA.
Genes 14 01301 g002
Figure 3. Eigengene expression patterns for nine modules of interest in the meta-coexpression network. Expression patterns are given for G. hirsutum (AD1, blue) and G. barbadense (AD2, green) for both domesticated (light) and wild (dark) accessions. Numbers on the x-axis labels denote the timepoints for the sample. Error bars indicate standard error. Module numbers are derived from WGCNA; modules with higher numbers are composed of fewer genes. Significance with respect to domestication and/or development is given in Supplementary Table S9.
Genes 14 01301 g003
Figure 4. Eigengene expression patterns for modules of interest in (a) the G. hirsutum (AD1) species network and (b) the G. barbadense (AD2) species coexpression network. Expression patterns are given for both wild (dark) and domesticated (light) accessions. Numbers on the x-axis labels denote the timepoints for the sample. Error bars indicate standard error. Module numbers are derived from WGCNA; modules with higher numbers are composed of fewer genes. Significance with respect to domestication and/or development is given in Supplementary Table S9.
Genes 14 01301 g004
Figure 5. Correspondence of significant modules in the G. hirsutum (AD1, vertical axis) and G. barbadense (AD2, horizontal axis) networks. Numbers in each cell indicate the number of genes shared between the corresponding AD1 (row) and AD2 (column) modules. Cell shading denotes the significance of correspondence based on Fisher’s exact test, with darker coloring indicating higher levels of correspondence, as measured by −log10 (p-value).
Genes 14 01301 g005
Figure 6. Two tests of module preservation. On the left, medianRank, indicating the preservation of G. barbadense (AD2) modules compared to G. hirsutum (AD1) modules. Low medianRank scores indicate high preservation. On the right, ZSummary, indicates the preservation of G. barbadense (AD2) modules compared to G. hirsutum (AD1) modules. High ZSummary scores indicate high preservation. Modules below the red dashed line at 10 are considered not well preserved.
Genes 14 01301 g006
Table 1. Accessions sampled. Accessions sharing the same [species + domestication] status were used as biological replicates.
SpeciesAccessionDomestication Status
Gossypium hirsutumCRB252domesticated
Maxxadomesticated
TM1domesticated
TX665wild
TX2094wild
TX2095wild
Gossypium barbadensePima S6domesticated
Pima S7domesticated
Phy76domesticated
GB0303wild
GPS52wild
K101wild
Table 2. DGE gene number results. Differential expression comparisons for G. barbadense and G. hirsutum, between wild and domesticated or among DPA. Columns indicate the number of genes differentially expressed at p-adjusted < 0.05. Numbers in parentheses indicate the number of genes up and downregulated for that comparison (up: down).
MaterialDPAG. barbadenseG. hirsutumInterspeciesDPA
wild10 vs. 05823 (641:182)11,112 (7463:3649)8570 (4425:4145)5
15 vs. 10939 (369:570)1400 (1067:333)4075 (2265:1810)10
20 vs. 155037 (3754:1283)18,437 (7585:10852)11,177 (4728:6449)15
9473 (6038:3435)20
domesticated10 vs. 05649 (565:84)10,838 (7920:2918)8617 (3832:4785)5
15 vs. 101203 (689:514)5544 (2959:2585)14,190 (5857:8333)10
20 vs. 152169 (1623:546)8025 (3771:4254)21,028 (8922:12106)15
14,970 (6919:8051)20
wild versus domesticated5413 (88:325)1250 (409:841)
10822 (197:625)7073 (3473:3600)
152430 (1278:1152)12,696 (6098:6598)
203943 (1276:2667)3608 (1995:1613)
Table 3. The modular composition of A- and D-homoeologs in G hirsutum (AD1) and G. barbadense (AD2). Solo homoeologs are placed in a module, while the other homoeolog is placed in a different module. A- and D-dominant modules are those modules that are significantly biased toward the A- or D-subgenome.
MetaAD1AD2AD1-AD2 Consensus
Total module genes63,67562,08461,93457,019
Solo A-homoeolog19,976 (31.4%)19,857 (32.0%)23,726 (38.3%)22,171 (38.9%)
Solo D-homoeolog19,945 (31.3%)19,834 (31.9%)23,668 (38.2%)22,210 (39.0%)
Homoeolog pairs11,877 (37.3%)11,198 (36.1%)7270 (23.5%)6319 (22.2%)
Total modules587656165
A-dominant module7355
D-dominant module 5156
Disclaimer/Publisher’s Note: The statements, opinions and data contained in all publications are solely those of the individual author(s) and contributor(s) and not of MDPI and/or the editor(s). MDPI and/or the editor(s) disclaim responsibility for any injury to people or property resulting from any ideas, methods, instructions or products referred to in the content.

