
Pilot Study Showing Feasibility of Phosphoproteomic Profiling of Pathway-Level Molecular Alterations in Barrett’s Esophagus

 , , , , , and
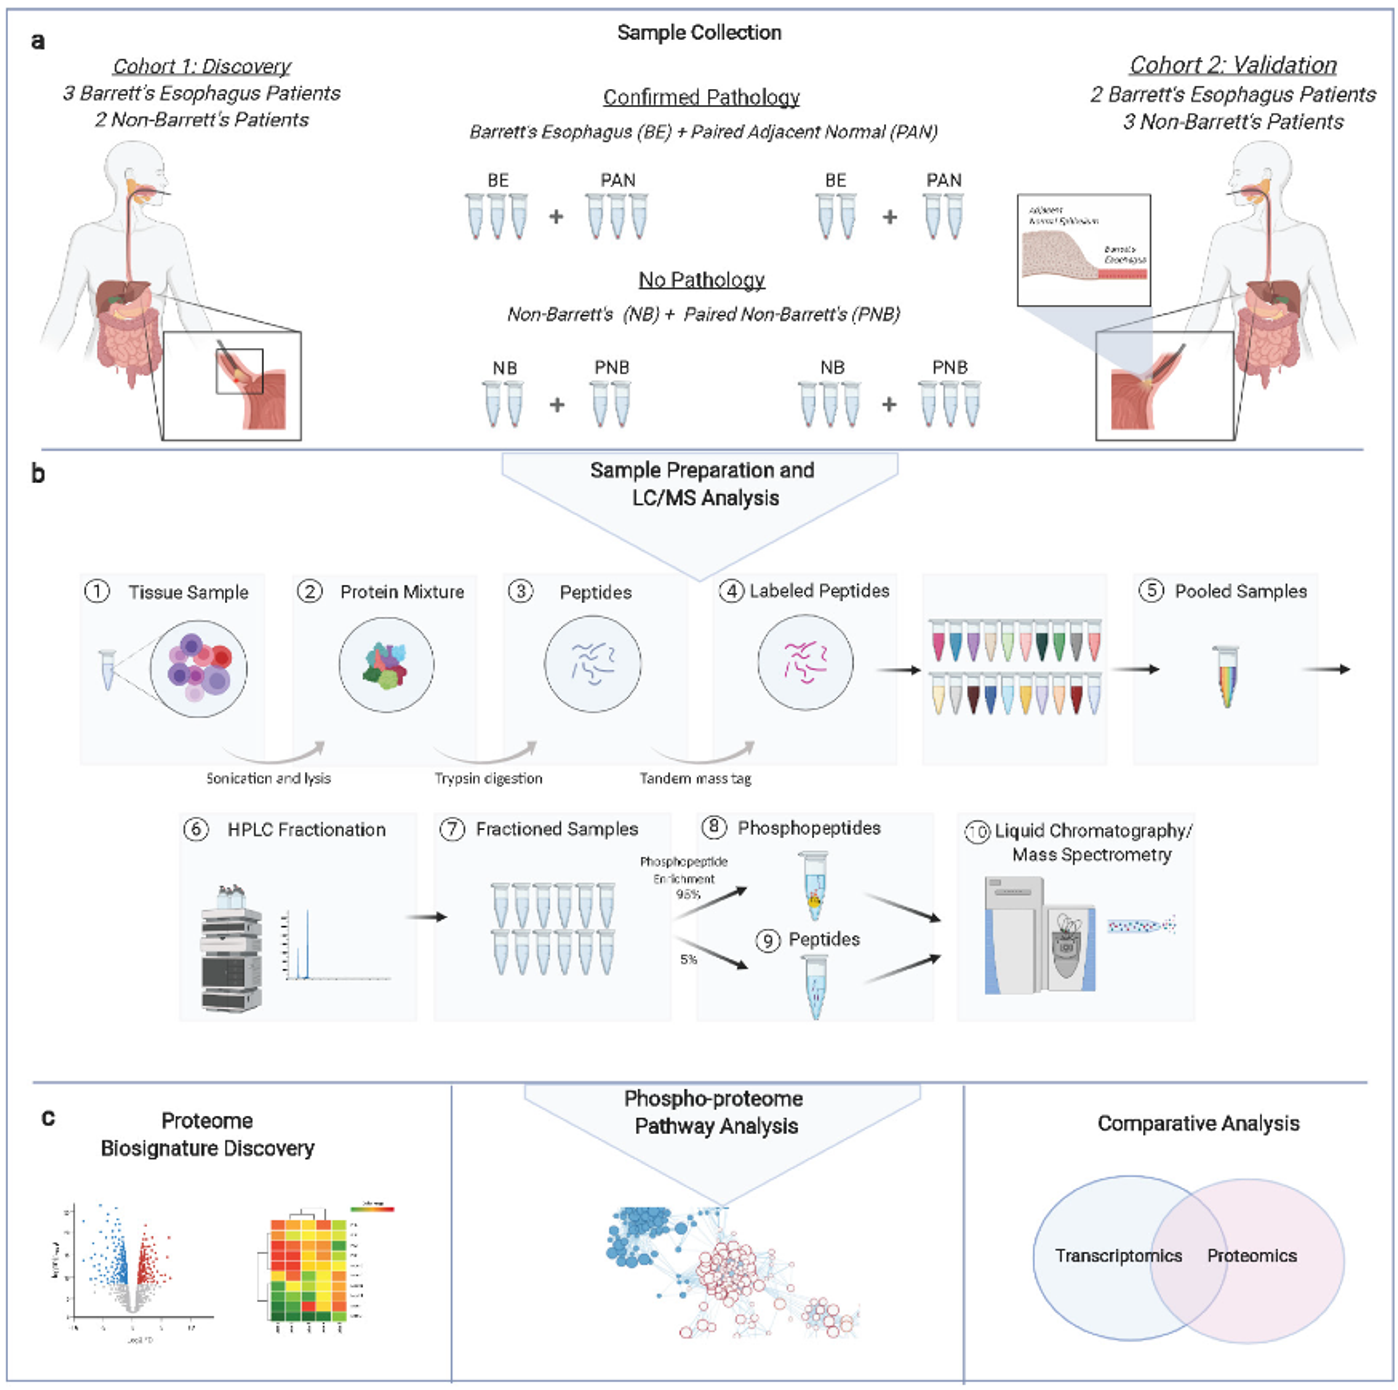
Abstract
:1. Introduction
2. Materials and Methods
3. Results
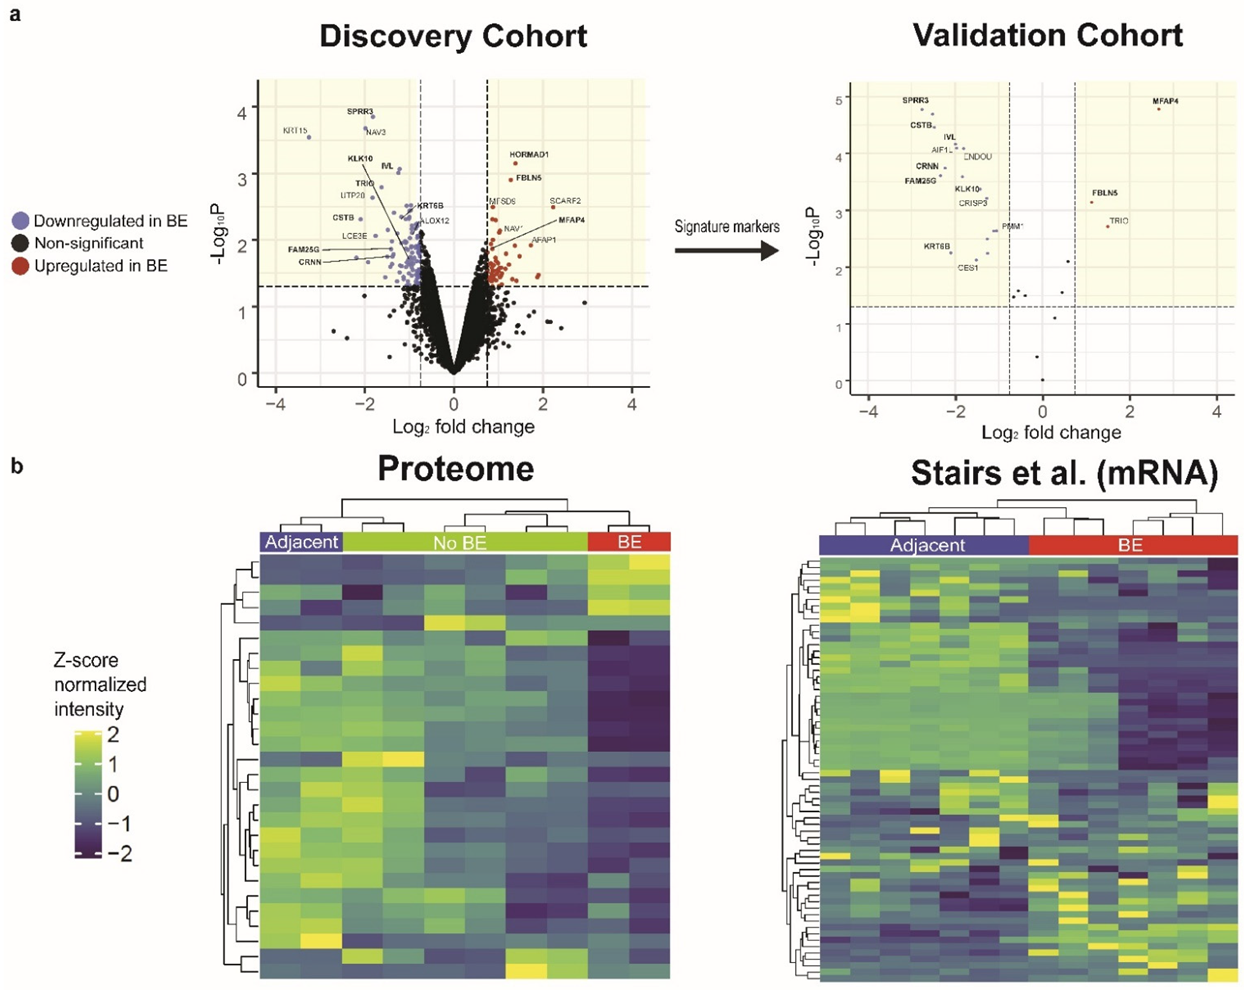
3.1. Comparative Proteomic Profiling Reveals a Differential Disease Signature Reproducibly Associated with BE
3.2. Validation of BE Expression Signature in a Second Patient Cohort
3.3. Comparative Proteomic Analysis Reveals Pathway-Level Alterations in BE
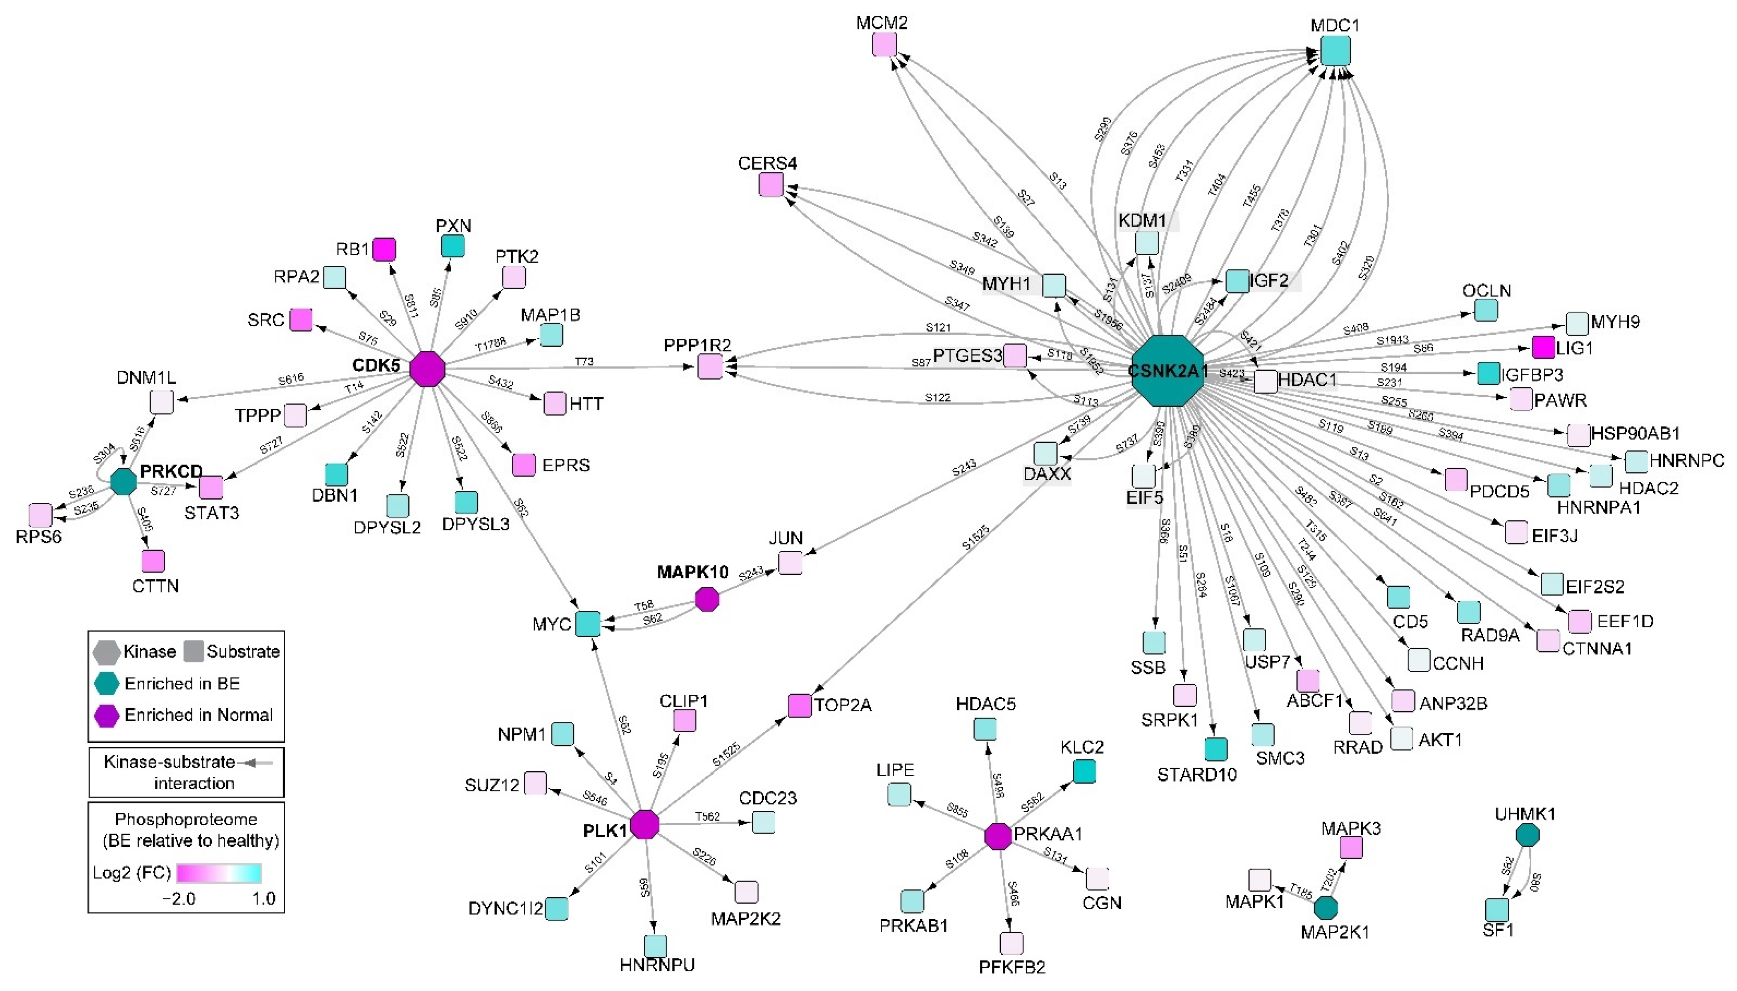
3.4. Characterization of Differential Signaling Pathways by Phosphoproteomics
3.5. Pathway Analysis of Combined Cohorts via Proteomics and Phosphoproteomics
3.6. Pathway-Level Comparison of Phosphoproteomic Profiles to Previous Transcriptomic Studies
3.7. Non-BE and Adjacent Normal Comparison Reveal Early Reactive Changes to Environmental Factors
4. Discussion
Supplementary Materials
Author Contributions
Funding
Institutional Review Board Statement
Informed Consent Statement
Data Availability Statement
Acknowledgments
Conflicts of Interest
References
- Siegel, R.; Naishadham, D.; Jemal, A. Cancer Statistics, 2013. CA A Cancer J. Clin. 2013, 63, 11–30. [Google Scholar] [CrossRef] [PubMed] [Green Version]
- Smyth, E.C.; Lagergren, J.; Fitzgerald, R.C.; Lordick, F.; Shah, M.A.; Lagergren, P.; Cunningham, D. Oesophageal Cancer. Nat. Rev. Dis. Primers 2017, 3, 17048. [Google Scholar] [CrossRef] [PubMed]
- Reid, B.J.; Paulson, T.G.; Li, X. Genetic Insights in Barrett’s Esophagus and Esophageal Adenocarcinoma. Gastroenterology 2015, 149, 1142–1152.e3. [Google Scholar] [CrossRef] [PubMed] [Green Version]
- Bellizzi, A.M.; Odze, R.D. Histopathology of Barrett’s Esophagus: A Review for the Practicing Gastroenterologist. Tech. Gastrointest. Endosc. 2010, 12, 69–81. [Google Scholar] [CrossRef]
- Eluri, S.; Shaheen, N.J. Barrett’s Esophagus: Diagnosis and Management. Gastrointest. Endosc. 2017, 85, 889–903. [Google Scholar] [CrossRef] [Green Version]
- Naini, B.V.; Chak, A.; Ali, M.A.; Odze, R.D. Barrett’s Oesophagus Diagnostic Criteria: Endoscopy and Histology. Best Pract. Res. Clin. Gastroenterol. 2015, 29, 77–96. [Google Scholar] [CrossRef]
- Bortz, J.H.; Friedrich-Nel, H. The Adenoma–Carcinoma Sequence, Management and Treatment of Colon Cancer. In CT Colonography for Radiographers; Bortz, J.H., Ramlaul, A., Munro, L., Eds.; Springer International Publishing: Cham, Switzerland, 2016; pp. 211–219. ISBN 978-3-319-29377-6. [Google Scholar]
- Qureshi, A.P.; Stachler, M.D.; Haque, O.; Odze, R.D. Biomarkers for Barrett’s Esophagus—A Contemporary Review. Expert Rev. Mol. Diagn. 2018, 18, 939–946. [Google Scholar] [CrossRef]
- O’Neill, J.R.; Pak, H.-S.; Pairo-Castineira, E.; Save, V.; Paterson-Brown, S.; Nenutil, R.; Vojtěšek, B.; Overton, I.; Scherl, A.; Hupp, T.R. Quantitative Shotgun Proteomics Unveils Candidate Novel Esophageal Adenocarcinoma (EAC)-Specific Proteins. Mol. Cell Proteom. 2017, 16, 1138–1150. [Google Scholar] [CrossRef] [Green Version]
- Cantin, G.T.; Shock, T.R.; Park, S.K.; Madhani, H.D.; Yates, J.R. Optimizing TiO2-Based Phosphopeptide Enrichment for Automated Multidimensional Liquid Chromatography Coupled to Tandem Mass Spectrometry. Anal. Chem. 2007, 79, 4666–4673. [Google Scholar] [CrossRef] [Green Version]
- Ritchie, M.E.; Phipson, B.; Wu, D.; Hu, Y.; Law, C.W.; Shi, W.; Smyth, G.K. Limma Powers Differential Expression Analyses for RNA-Sequencing and Microarray Studies. Nucleic Acids Res. 2015, 43, e47. [Google Scholar] [CrossRef]
- Korotkevich, G.; Sukhov, V.; Budin, N.; Shpak, B.; Artyomov, M.; Sergushichev, A. Fast Gene Set Enrichment Analysis. bioRxiv 2021. [CrossRef] [Green Version]
- Davis, S. GEOquery: A bridge between the Gene Expression Omnibus (GEO) and BioConductor. Bioinformatics 2007, 14, 1846–1847. [Google Scholar] [CrossRef] [Green Version]
- Nancarrow, D.J.; Clouston, A.D.; Smithers, B.M.; Gotley, D.C.; Drew, P.A.; Watson, D.I.; Tyagi, S.; Hayward, N.K.; Whiteman, D.C. For the Australian Cancer Study and the Study of Digestive Health Whole Genome Expression Array Profiling Highlights Differences in Mucosal Defense Genes in Barrett’s Esophagus and Esophageal Adenocarcinoma. PLoS ONE 2011, 6, e22513. [Google Scholar] [CrossRef]
- Hyland, P.L.; Hu, N.; Rotunno, M.; Su, H.; Wang, C.; Wang, L.; Pfeiffer, R.M.; Gherman, B.; Giffen, C.; Dykes, C.; et al. Global Changes in Gene Expression of Barrett’s Esophagus Compared to Normal Squamous Esophagus and Gastric Cardia Tissues. PLoS ONE 2014, 9, e93219. [Google Scholar] [CrossRef] [PubMed] [Green Version]
- Stairs, D.B.; Nakagawa, H.; Klein-Szanto, A.; Mitchell, S.D.; Silberg, D.G.; Tobias, J.W.; Lynch, J.P.; Rustgi, A.K. Cdx1 and C-Myc Foster the Initiation of Transdifferentiation of the Normal Esophageal Squamous Epithelium toward Barrett’s Esophagus. PLoS ONE 2008, 3, e3534. [Google Scholar] [CrossRef] [PubMed] [Green Version]
- Blighe, K.; Rana, S.; Lewis, M. EnhancedVolcano: Publication-ready volcano plots with enhanced colouring and labeling. Bioconductor 2022, 1. [Google Scholar] [CrossRef]
- Warson, C.; Van de Bovenkamp, J.H.B.; Korteland-Van Male, A.M.; Büller, H.A.; Einerhand, A.W.C.; Ectors, N.L.E.Y.; Dekker, J. Barrett’s Esophagus Is Characterized by Expression of Gastric-Type Mucins (MUC5AC, MUC6) and TFF Peptides (TFF1 and TFF2), but the Risk of Carcinoma Development May Be Indicated by the Intestinal-Type Mucin, MUC2. Hum. Pathol. 2002, 33, 660–668. [Google Scholar] [CrossRef]
- Karp, N.A.; Huber, W.; Sadowski, P.G.; Charles, P.D.; Hester, S.V.; Lilley, K.S. Addressing Accuracy and Precision Issues in ITRAQ Quantitation. Mol. Cell Proteom. 2010, 9, 1885–1897. [Google Scholar] [CrossRef] [Green Version]
- Ow, S.Y.; Salim, M.; Noirel, J.; Evans, C.; Rehman, I.; Wright, P.C. ITRAQ Underestimation in Simple and Complex Mixtures: “The Good, the Bad and the Ugly”. J. Proteome Res. 2009, 8, 5347–5355. [Google Scholar] [CrossRef]
- Fukuda, T.; Daniel, K.; Wojtasz, L.; Toth, A.; Höög, C. A Novel Mammalian HORMA Domain-Containing Protein, HORMAD1, Preferentially Associates with Unsynapsed Meiotic Chromosomes. Exp. Cell Res. 2010, 316, 158–171. [Google Scholar] [CrossRef]
- Shin, Y.-H.; Choi, Y.; Erdin, S.U.; Yatsenko, S.A.; Kloc, M.; Yang, F.; Wang, P.J.; Meistrich, M.L.; Rajkovic, A. Hormad1 Mutation Disrupts Synaptonemal Complex Formation, Recombination, and Chromosome Segregation in Mammalian Meiosis. PLoS Genet. 2010, 6, e1001190. [Google Scholar] [CrossRef] [PubMed] [Green Version]
- Aung, P.P.; Oue, N.; Mitani, Y.; Nakayama, H.; Yoshida, K.; Noguchi, T.; Bosserhoff, A.K.; Yasui, W. Systematic Search for Gastric Cancer-Specific Genes Based on SAGE Data: Melanoma Inhibitory Activity and Matrix Metalloproteinase-10 Are Novel Prognostic Factors in Patients with Gastric Cancer. Oncogene 2006, 25, 2546–2557. [Google Scholar] [CrossRef] [PubMed] [Green Version]
- Ghazalpour, A.; Bennett, B.; Petyuk, V.A.; Orozco, L.; Hagopian, R.; Mungrue, I.N.; Farber, C.R.; Sinsheimer, J.; Kang, H.M.; Furlotte, N.; et al. Comparative Analysis of Proteome and Transcriptome Variation in Mouse. PLoS Genet. 2011, 7, e1001393. [Google Scholar] [CrossRef] [PubMed] [Green Version]
- Blum, B.C.; Mousavi, F.; Emili, A. Single-Platform ‘Multi-Omic’ Profiling: Unified Mass Spectrometry and Computational Workflows for Integrative Proteomics–Metabolomics Analysis. Mol. Omics 2018, 14, 307–319. [Google Scholar] [CrossRef] [PubMed] [Green Version]
- Sharma, R.; Quilty, F.; Gilmer, J.F.; Long, A.; Byrne, A.-M. Unconjugated Secondary Bile Acids Activate the Unfolded Protein Response and Induce Golgi Fragmentation via a Src-Kinase-Dependant Mechanism. Oncotarget 2016, 8, 967–978. [Google Scholar] [CrossRef] [Green Version]
- Tomaskovic-Crook, E.; Thompson, E.W.; Thiery, J.P. Epithelial to Mesenchymal Transition and Breast Cancer. Breast Cancer Res. 2009, 11, 213. [Google Scholar] [CrossRef] [Green Version]
- Chaw, S.Y.; Abdul Majeed, A.; Dalley, A.J.; Chan, A.; Stein, S.; Farah, C.S. Epithelial to Mesenchymal Transition (EMT) Biomarkers—E-Cadherin, Beta-Catenin, APC and Vimentin—In Oral Squamous Cell Carcinogenesis and Transformation. Oral Oncol. 2012, 48, 997–1006. [Google Scholar] [CrossRef]
- Vuoriluoto, K.; Haugen, H.; Kiviluoto, S.; Mpindi, J.-P.; Nevo, J.; Gjerdrum, C.; Tiron, C.; Lorens, J.B.; Ivaska, J. Vimentin Regulates EMT Induction by Slug and Oncogenic H-Ras and Migration by Governing Axl Expression in Breast Cancer. Oncogene 2011, 30, 1436–1448. [Google Scholar] [CrossRef] [Green Version]
- Zhong, Y.-Q.; Lin, Y.; Xu, Z. Expression of IFN-γ and IL-4 in the Esophageal Mucosa of Patients with Reflux Esophagitis and Barrett’s Esophagus and Their Relationship with Endoscopic and Histologic Grading. Dig. Dis. Sci. 2011, 56, 2865–2870. [Google Scholar] [CrossRef]
- Nguyen, G.H.; Schetter, A.J.; Chou, D.B.; Bowman, E.D.; Zhao, R.; Hawkes, J.E.; Mathe, E.A.; Kumamoto, K.; Zhao, Y.; Budhu, A.; et al. Inflammatory and MicroRNA Gene Expression as Prognostic Classifier of Barrett’s-Associated Esophageal Adenocarcinoma. Clin. Cancer Res. 2010, 16, 5824–5834. [Google Scholar] [CrossRef] [Green Version]
- Drané, P.; Brault, M.-E.; Cui, G.; Meghani, K.; Chaubey, S.; Detappe, A.; Parnandi, N.; He, Y.; Zheng, X.-F.; Botuyan, M.V.; et al. TIRR Regulates 53BP1 by Masking Its Histone Methyl-Lysine Binding Function. Nature 2017, 543, 211–216. [Google Scholar] [CrossRef] [PubMed] [Green Version]
- Yoshida, K.; Liu, H.; Miki, Y. Protein Kinase C δ Regulates Ser46 Phosphorylation of P53 Tumor Suppressor in the Apoptotic Response to DNA Damage. J. Biol. Chem. 2006, 281, 5734–5740. [Google Scholar] [CrossRef] [PubMed] [Green Version]
- Zhang, H.Y.; Hormi-Carver, K.; Zhang, X.; Spechler, S.J.; Souza, R.F. In Benign Barrett’s Epithelial Cells, Acid Exposure Generates Reactive Oxygen Species That Cause DNA Double-Strand Breaks. Cancer Res. 2009, 69, 9083–9089. [Google Scholar] [CrossRef] [Green Version]
- Dvorak, K.; Payne, C.M.; Chavarria, M.; Ramsey, L.; Dvorakova, B.; Bernstein, H.; Holubec, H.; Sampliner, R.E.; Guy, N.; Condon, A.; et al. Bile Acids in Combination with Low PH Induce Oxidative Stress and Oxidative DNA Damage: Relevance to the Pathogenesis of Barrett’s Oesophagus. Gut 2007, 56, 763–771. [Google Scholar] [CrossRef] [PubMed] [Green Version]
- Jiang, J.; Wakimoto, H.; Seidman, J.G.; Seidman, C.E. Allele-Specific Silencing of Mutant Myh6 Allele in Mice Suppresses Hypertrophic Cardiomyopathy. Science 2013, 342, 111–114. [Google Scholar] [CrossRef] [Green Version]
- Feng, X.; Ma, D.; Zhao, J.; Song, Y.; Zhu, Y.; Zhou, Q.; Ma, F.; Liu, X.; Zhong, M.; Liu, Y.; et al. UHMK1 Promotes Gastric Cancer Progression through Reprogramming Nucleotide Metabolism. EMBO J. 2020, 39, e102541. [Google Scholar] [CrossRef]
- Bhardwaj, V.; Horvat, A.; Korolkova, O.; Washington, M.K.; El-Rifai, W.; Dikalov, S.I.; Zaika, A.I. Prevention of DNA Damage in Barrett’s Esophageal Cells Exposed to Acidic Bile Salts. Carcinogenesis 2016, 37, 1161–1169. [Google Scholar] [CrossRef] [Green Version]
- Zaïr, Z.M.; Johnson, G.E.; Griffiths, A.P.; Jenkins, G.J. Diagnostic Correlation between the Expression of the DNA Repair Enzyme N-Methylpurine DNA Glycosylase and Esophageal Adenocarcinoma Onset: A Retrospective Pilot Study. Dis. Esophagus 2013, 26, 644–650. [Google Scholar] [CrossRef]
- Chen, X.; Ding, Y.W.; Yang, G.; Bondoc, F.; Lee, M.-J.; Yang, C.S. Oxidative Damage in an Esophageal Adenocarcinoma Model with Rats. Carcinogenesis 2000, 21, 257–263. [Google Scholar] [CrossRef] [Green Version]
- Gurzu, S.; Turdean, S.; Kovecsi, A.; Contac, A.O.; Jung, I. Epithelial-Mesenchymal, Mesenchymal-Epithelial, and Endothelial-Mesenchymal Transitions in Malignant Tumors: An Update. World J. Clin. Cases 2015, 3, 393–404. [Google Scholar] [CrossRef]


Publisher’s Note: MDPI stays neutral with regard to jurisdictional claims in published maps and institutional affiliations. |
© 2022 by the authors. Licensee MDPI, Basel, Switzerland. This article is an open access article distributed under the terms and conditions of the Creative Commons Attribution (CC BY) license (https://creativecommons.org/licenses/by/4.0/).
Share and Cite
Moore, J.; Hekman, R.; Blum, B.C.; Lawton, M.; Lehoux, S.; Stachler, M.; Pleskow, D.; Sawhney, M.S.; Cummings, R.D.; Emili, A.; et al. Pilot Study Showing Feasibility of Phosphoproteomic Profiling of Pathway-Level Molecular Alterations in Barrett’s Esophagus. Genes 2022, 13, 1215. https://doi.org/10.3390/genes13071215
Moore J, Hekman R, Blum BC, Lawton M, Lehoux S, Stachler M, Pleskow D, Sawhney MS, Cummings RD, Emili A, et al. Pilot Study Showing Feasibility of Phosphoproteomic Profiling of Pathway-Level Molecular Alterations in Barrett’s Esophagus. Genes. 2022; 13(7):1215. https://doi.org/10.3390/genes13071215
Chicago/Turabian StyleMoore, Jarrod, Ryan Hekman, Benjamin C. Blum, Matthew Lawton, Sylvain Lehoux, Matthew Stachler, Douglas Pleskow, Mandeep S. Sawhney, Richard D. Cummings, Andrew Emili, and et al. 2022. "Pilot Study Showing Feasibility of Phosphoproteomic Profiling of Pathway-Level Molecular Alterations in Barrett’s Esophagus" Genes 13, no. 7: 1215. https://doi.org/10.3390/genes13071215