Article

Next-Generation Sequencing Identifies Novel PMPCA Variants in Patients with Late-Onset Dominant Optic Atrophy

1
MitoLab Team, UMR CNRS 6015-INSERM U1083, Institut MitoVasc, SFR ICAT, Université d’Angers, 49933 Angers, France
2
Genetics and Immuno-Cell Therapy Team, Mohammed First University, Oujda 60000, Morocco
3
Departments of Biochemistry and Molecular Biology, University Hospital Angers, 49933 Angers, France
4
National Reference Centre for Inherited Sensory Diseases, University Hospital of Montpellier, University of Montpellier, 34000 Montpellier, France
5
Institut des Neurosciences de Montpellier, INSERM U1051, Université de Montpellier, 34000 Montpellier, France
6
Department of Genetics, AP-HP, Pitié-Salpêtrière University Hospital, 75013 Paris, France
7
Department of Ophthalmology, Nîmes University Hospital, CEDEX 9, 30900 Nîmes, France
8
Department of Ophthalmology, Hôpital Pierre Paul Riquet CHU Purpan, 31300 Toulouse, France
9
Departments of Genetics, University Hospital Angers, 49933 Angers, France
10
Service de Neurologie, University Hospital Angers, 49933 Angers, France
*
Author to whom correspondence should be addressed.
Genes 2022, 13(7), 1202; https://doi.org/10.3390/genes13071202
Submission received: 14 March 2022 / Revised: 11 April 2022 / Accepted: 1 July 2022 / Published: 5 July 2022
(This article belongs to the Collection Genotype-Phenotype Study in Disease)

Abstract

:
Dominant Optic Atrophy (DOA) is one of the most common inherited mitochondrial diseases, leading to blindness. It is caused by the chronic degeneration of the retinal ganglion cells (RGCs) and their axons forming the optic nerve. Until now, DOA has been mainly associated with genes encoding proteins involved in mitochondrial network dynamics. Using next-generation and exome sequencing, we identified for the first time heterozygous PMPCA variants having a causative role in the pathology of late-onset primary DOA in five patients. PMPCA encodes an α subunit of the mitochondrial peptidase (MPP), responsible for the cleavage and maturation of the mitochondrial precursor proteins imported from the cytoplasm into mitochondria. Recently, PMPCA has been identified as the gene responsible for Autosomal Recessive Cerebellar Ataxia type 2 (SCAR2) and another severe recessive mitochondrial disease. In this study, four PMPCA variants were identified, two are frameshifts (c.309delA and c.820delG) classified as pathogenic and two are missenses (c.1363G>A and c.1547G>A) classified with uncertain pathological significance. Functional assays on patients’ fibroblasts show a hyperconnection of the mitochondrial network and revealed that frameshift variants reduced α-MPP levels, while not significantly affecting the respiratory machinery. These results suggest that alterations in mitochondrial peptidase function can affect the fusion-fission balance, a key element in maintaining the physiology of retinal ganglion cells, and consequently lead to their progressive degeneration.

1. Introduction

Dominant optic atrophy (DOA, MIM *605290) is an inherited optic neuropathy with a prevalence estimated at 1 in 25,000 [1,2,3,4]. DOA affects visual acuity by altering the central visual field and color vision, due to a progressive loss of retinal ganglion cells (RGCs) and their axons that form the optic nerve, ensuring the transmission of visual information from the retina to the brain. Most patients have an age of onset in the first decade of life, some may experience functional blindness and others can be relatively asymptomatic [5]. DOA can be also a part of a syndromic condition called DOAplus in 20% of cases, with secondary symptoms affecting auditory, neuronal and muscular functions. Sixty to seventy per cent of DOA cases harbor pathogenic variants in the nuclear OPA1 gene [6], which was the first gene identified to cause DOA [7,8]. But recently, an increasing number of novel DOA genes were identified through the introduction of next-generation sequencing technologies [9], including OPA3, MFN2, SPG7, AFG3L2, DNM1L and SSBP1 [10,11,12,13,14,15,16,17]. These genes are all involved directly in mitochondrial function, mostly mitochondrial dynamics, with the exception of SSBP1, which is involved in mitochondrial DNA (mtDNA) replication. In addition, the WFS1 gene, responsible for Wolfram syndrome, is also responsible for DOA associated with neuro-sensorial deafness [18] and for isolated recessive isolated optic atrophy [19].
In mitochondria, the mitochondrial processing peptidase (MPP) plays the most important role in preprotein processing compared to other mitochondrial peptidases [20]. PMPCA (MIM * 613036), a nuclear gene localized on human chromosome 9q34.3, encodes the a-subunit of mitochondrial processing peptidase (a-MPP), a protein that participates in the cleavage of the mitochondrial targeting peptide of nuclear-encoded mitochondrial precursor proteins upon their import into mitochondria [21]. Without its function, abnormal nuclear-encoded mitochondrial precursor proteins accumulate inside mitochondria, disrupt mitochondrial functions and halt cell growth. In 2015, PMPCA has been identified as the gene responsible for Autosomal Recessive Cerebellar Ataxia type 2 (SCAR2), a severe mitochondrial disease and later for a Leigh-like syndrome with spastic ataxia [22,23,24,25].
In the present study, we identified for the first time, heterozygous variants of PMPCA in five families with primary DOA. Fibroblasts characterization shows a tendency to mitochondrial network hyperconnection in PMPCA patient fibroblasts and revealed decreased levels of PMPCA protein.

2. Materials and Methods

2.1. Consent for Genetic Investigations

Written informed consent to perform genetic analyses was obtained from each subject involved in this study, according to protocols approved by the Ethical Committees of the different Institutes involved in this study, and in agreement with the Declaration of Helsinki (Institutional Review Board Committee of the University Hospital of Angers, Authorization number: AC-2012-1507).

2.2. Genetic Analysis

Genomic DNA was extracted from peripheral blood cells from cohorts of DOA and sporadic cases of optic atrophy initially screened for OPA1, OPA3 and WFS1 exonic sequences and all pathogenic variants in the mitochondrial DNA responsible for Leber hereditary optic neuropathy (LHON). Negative cases were analyzed using a resequencing gene panel dedicated to the clinical molecular diagnosis of inherited optic neuropathies (ION). Further negative samples, among which was the first patient with a PMPCA variant (family 3), were analyzed using whole-exome sequencing. Then PMPCA molecular screening was included in the ION panel and led to the discovery of families 1, 2, 4 and 5. Library preparation, sequencing, bioinformatics and variants analysis were carried out as previously described [10,12].

2.3. Fibroblasts Study

Fibroblasts from PMPCA individuals P1: II:1 and P2: II:2 from families 1 and 3 respectively, were generated from skin biopsies and cultured in 2/3 Dulbecco’s Minimum Essential Medium (DMEM, Gibco) supplemented with 1/3 AmnioMAX (Gibco, Thermo Fisher, Waltham, MA, USA), 10% fetal calf serum (Lonza, Portsmouth, NH, USA) and 1% Penicillin-Streptomycin-Amphotericin B (Lonza). Respiratory chain enzymatic activities and western blots were assessed as described [12,25], using the following antibodies: PMPCA (Novus Biologicals, CO, USA, #NBP1-89126; 56kD), PMPCB (Novus Biologicals, #NBP1-92120; 56kD); OPA1 (Abcam, Cambridge, England, ab42364; 95 and 85kD); Citrate Synthase (Abcam ab96600; 52kD).

2.4. Time Lapse and Deconvolution Microscopy

To assess the mitochondrial network dynamic [26], cells were incubated for 20 min with MitoTracker Green FM (Invitrogen™, Thermo Fisher, Waltham, MA, USA) to visualize mitochondria (green). Coverslips were mounted in a housing and placed on the stage of an inverted wide-field microscope ECLIPSE Ti-E (Nikon, Tokyo, Japan) equipped with a 100× oil immersion objective (Nikon Plan Apo100×, Tokyo, Japan, N.A. 1.45) and a NEO sCOMS camera controlled by Metamorph7.7 software (Molecular Devices, Sunnyvale, CA, USA). A precision, piezoelectric driver mounted underneath the objective lens allowed faster Z-step movements, keeping the sample immobile while shifting the objective lens. 35-one image planes were acquired along the Z-axis at 0.1 mm increments. For mitochondrial network characterization, acquired images were iteratively deconvolved using Huygens Essential 14.06 version software (Scientific Volume Imaging, Hilversum, The Netherlands), with a maximum iteration score of 50 and a quality threshold of 0.01. Imaris 8.0 ® software (Oxford Instruments Brand Bitplane AG, Zurich, Switzerland) was used for 3D processing and morphometric analysis. Time-lapse images of 90 ms duration (5-sec interval) were acquired at a fixed temperature of 25 °C.

2.4.1. Immunofluorescence

Human skin fibroblasts were seeded at a density of ~90,000 cells per well in a six-well plate containing 20-mm coverslips and incubated overnight. Cells were fixed with 4% paraformaldehyde (PFA) in PBS for 15 min. After fixation, cells were quickly washed 3 times in PBS and then incubated in the blocking buffer (BF; PBS with 5% BSA) for 15 min. Coverslips were then washed in PBS three times and incubated overnight with primary antibody diluted in the BF at 4 °C on a rocking platform providing a gentle “wave” effect. Coverslips were then washed in BF three times for 5 min and subsequently incubated for 90 min at room temperature with goat anti-mouse Alexa 647 IgG (H+L) secondary antibody diluted in BF in a dark chamber. Finally, coverslips were washed in PBS twicefor 5 min and kept in PBS at 4 degrees up to the assembly for the STORM acquisition.
Immunodetection of nucleoids was achieved on fixed fibroblasts using antibodies against DNA (clone AC-30-10) Progen GmbH and co-stained with Citrate synthase antibodies. Image treatment was performed using Imaris spot detection software (Imaris 8.0 ®) to visualize and quantify mtDNA/nucleoid number per cell and mtDNA/nucleoid spacing within mitochondria. For mitophagy exploration, co-staining with autophagosome marker anti-microtubule-associated protein 1 light chain 3α (LC3, ab48394, 1:500; Abcam) and mitochondrial marker citrate synthase was performed. Images acquisitions were performed using deconvolution microscopy.

2.4.2. STORM Acquisition

For super-resolution imaging, the cavity of a clean single depression slide (Paul Marienfeld, Lauda-Königshofen, Germany) was filled with 50 μL of switching buffer (Abbelight, Paris, France) and covered by the coverslip, the sample side facing downward. The device was placed on the stage of an inverted motorized microscope NIKON ECLIPSE Ti-E (Nikon Instruments Europe, Amsterdam, The Netherlands) equipped with a CFI SR APO TIRF 100X ON1.49 objective, a Perfect Focus System and a total internal reflection fluorescence (TIRF) ILas2 module (Roper Scientific, Martinsried, Germany).
Acquisition of images was performed using Metamorph 7.7 software (Molecular Devices, CA, USA). Image sequences were acquired with a single-photon sensitive camera Evolve 128TM EMCCD 512 × 512 imaging array, 16 × 16 μm pixels (Photometrics, Tucson, AZ, USA). Acquisitions were performed at a fixed temperature of 25 °C in a dark heating chamber (Okolab NA, Pozzuoli, Italy). Phase contrast was first used for orientation and focus adjustment. Prior to STORM imaging, a multichannel TIRF fluorescence microscopy image was acquired for subsequent comparison with the STORM image. Images were acquired with an integration time of 60 ms per frame. The total acquisition time points for each sequence were adapted to the observed structure and to the labelling density (5000 to 20,000 frames). Images were analyzed and reconstructed using the WaveTracer module integrated into Metamorph software [27].

3. Results

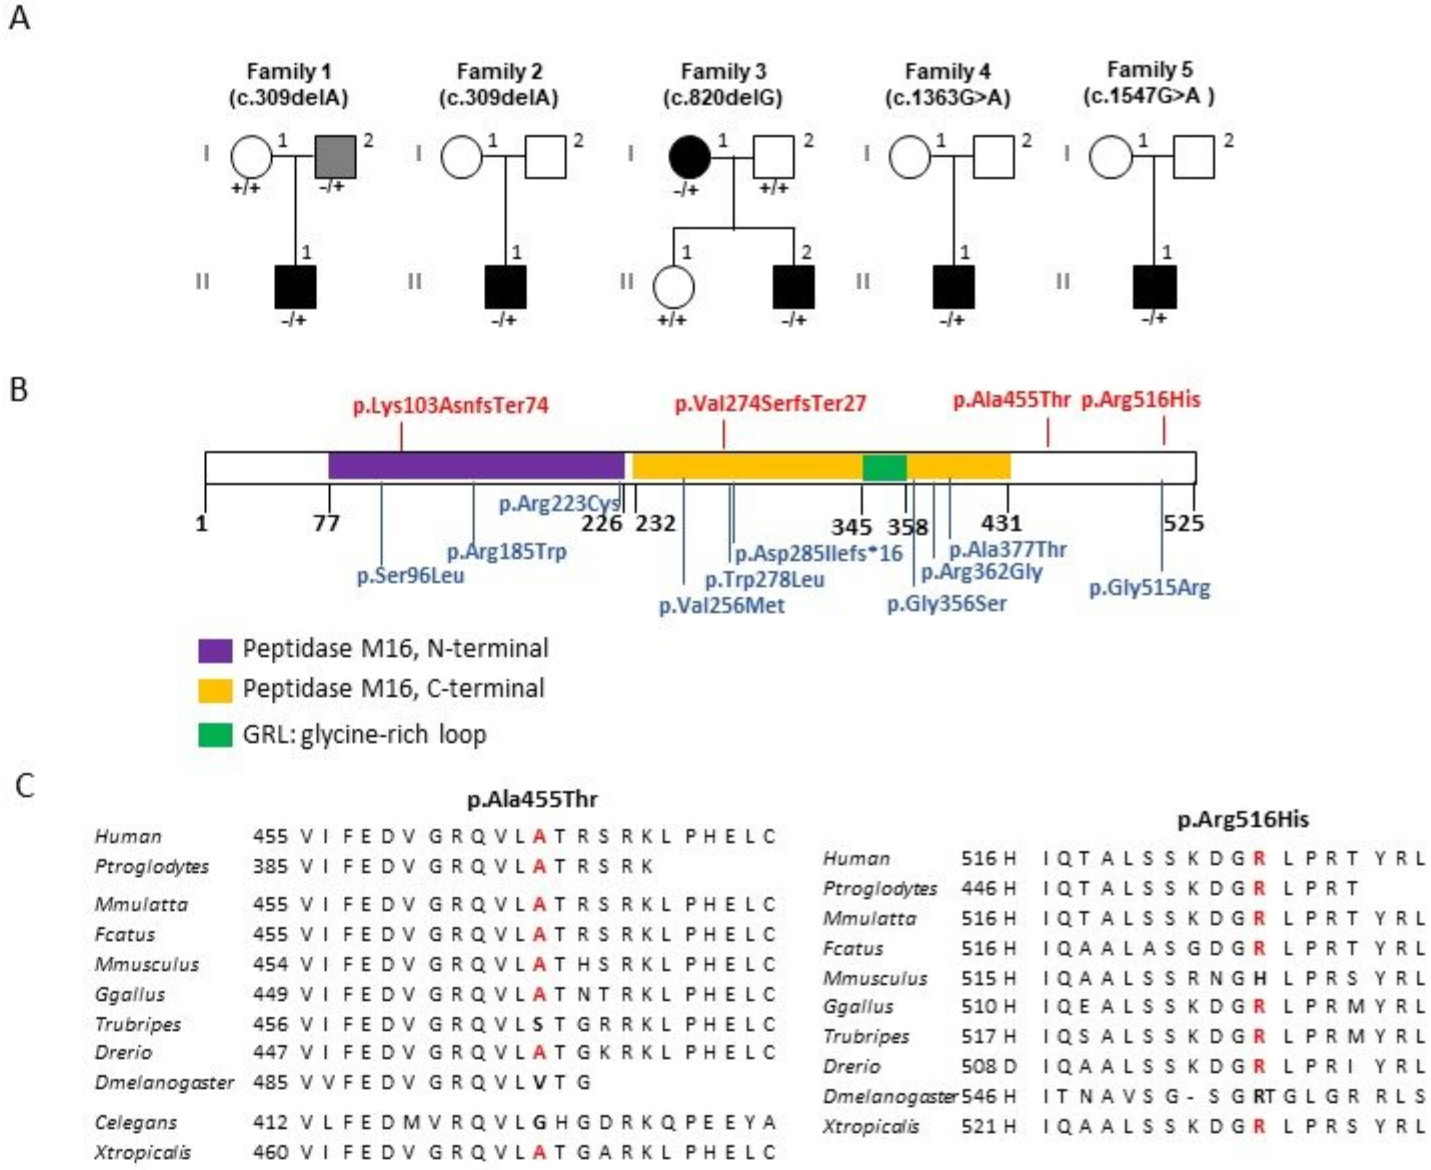
3.1. Identification of PMPCA Variants in Individuals with Primary Dominant Optic Atrophy

Using whole-exome sequencing, we screened for variants in unrelated patients presenting inherited optic neuropathies (ION) with a negative molecular diagnosis after analyzing OPA1, OPA3, WFS1, SPG7, AFG3L2, DNM1L, MFN2 exonic sequences, and pathogenic variants in the mitochondrial DNA responsible for LHON. After eliminating frequent (>1/10.000) and non-pathogenic variants, according to the Sift, Polyphen and Mutation-Taster prediction tools, a first heterozygous pathogenic variant was identified in PMPCA, which led to the inclusion of this gene in the ION panel. Three additional heterozygous PMPCA (NM_015160.3) variants were identified in four families (Figure 1A), two unreported and two being referenced with an allele frequency of 4.01 × 10⁻⁶ and 8.01 × 10⁻⁶ (Figure 1B, Table 1). Two variants (c.309delA and c.820delG) are pair base deletions causing a frameshift (p.(Lys103AsnfsTer74) and p.(Val274SerfsTer27)); and two are missense variants (c.1363G>A and c.1547G>A) causing the p.(Ala455Thr) and p.(Arg516His) amino-acid changes, respectively (Table 1), which are evolutionary well conserved throughout animal PMPCA sequences (Figure 1C). These variants were confirmed by Sanger sequencing and analyzed for segregation, whenever DNA samples were available (Figure 1A). The pathogenicity of the two missense PMPCA variants was assessed in silico using multiple prediction software, with results strongly supporting their deleterious and damaging effect (Table 2), although they were classified as class 3 variants by the ACMG prediction program (Table 1).

3.2. Clinical Manifestations of PMPCA Patients

All individuals included were referred to ophthalmology departments due to poor visual acuity. All patients were males aged between 30 and 69 years, who were primarily diagnosed with isolated dominant optic atrophy; three had normal brain MRI imaging. Patients II.1 from family 1 and II.1 from family 4 disclosed severe optic atrophy with visual acuities ranging from 0.5/10 to counting fingers (Table 1). Additional associations or problems were observed: multiple sclerosis for patient II.1 from family 4 and peripheral neuropathy for patient II.1 from family 2 (Table 1).

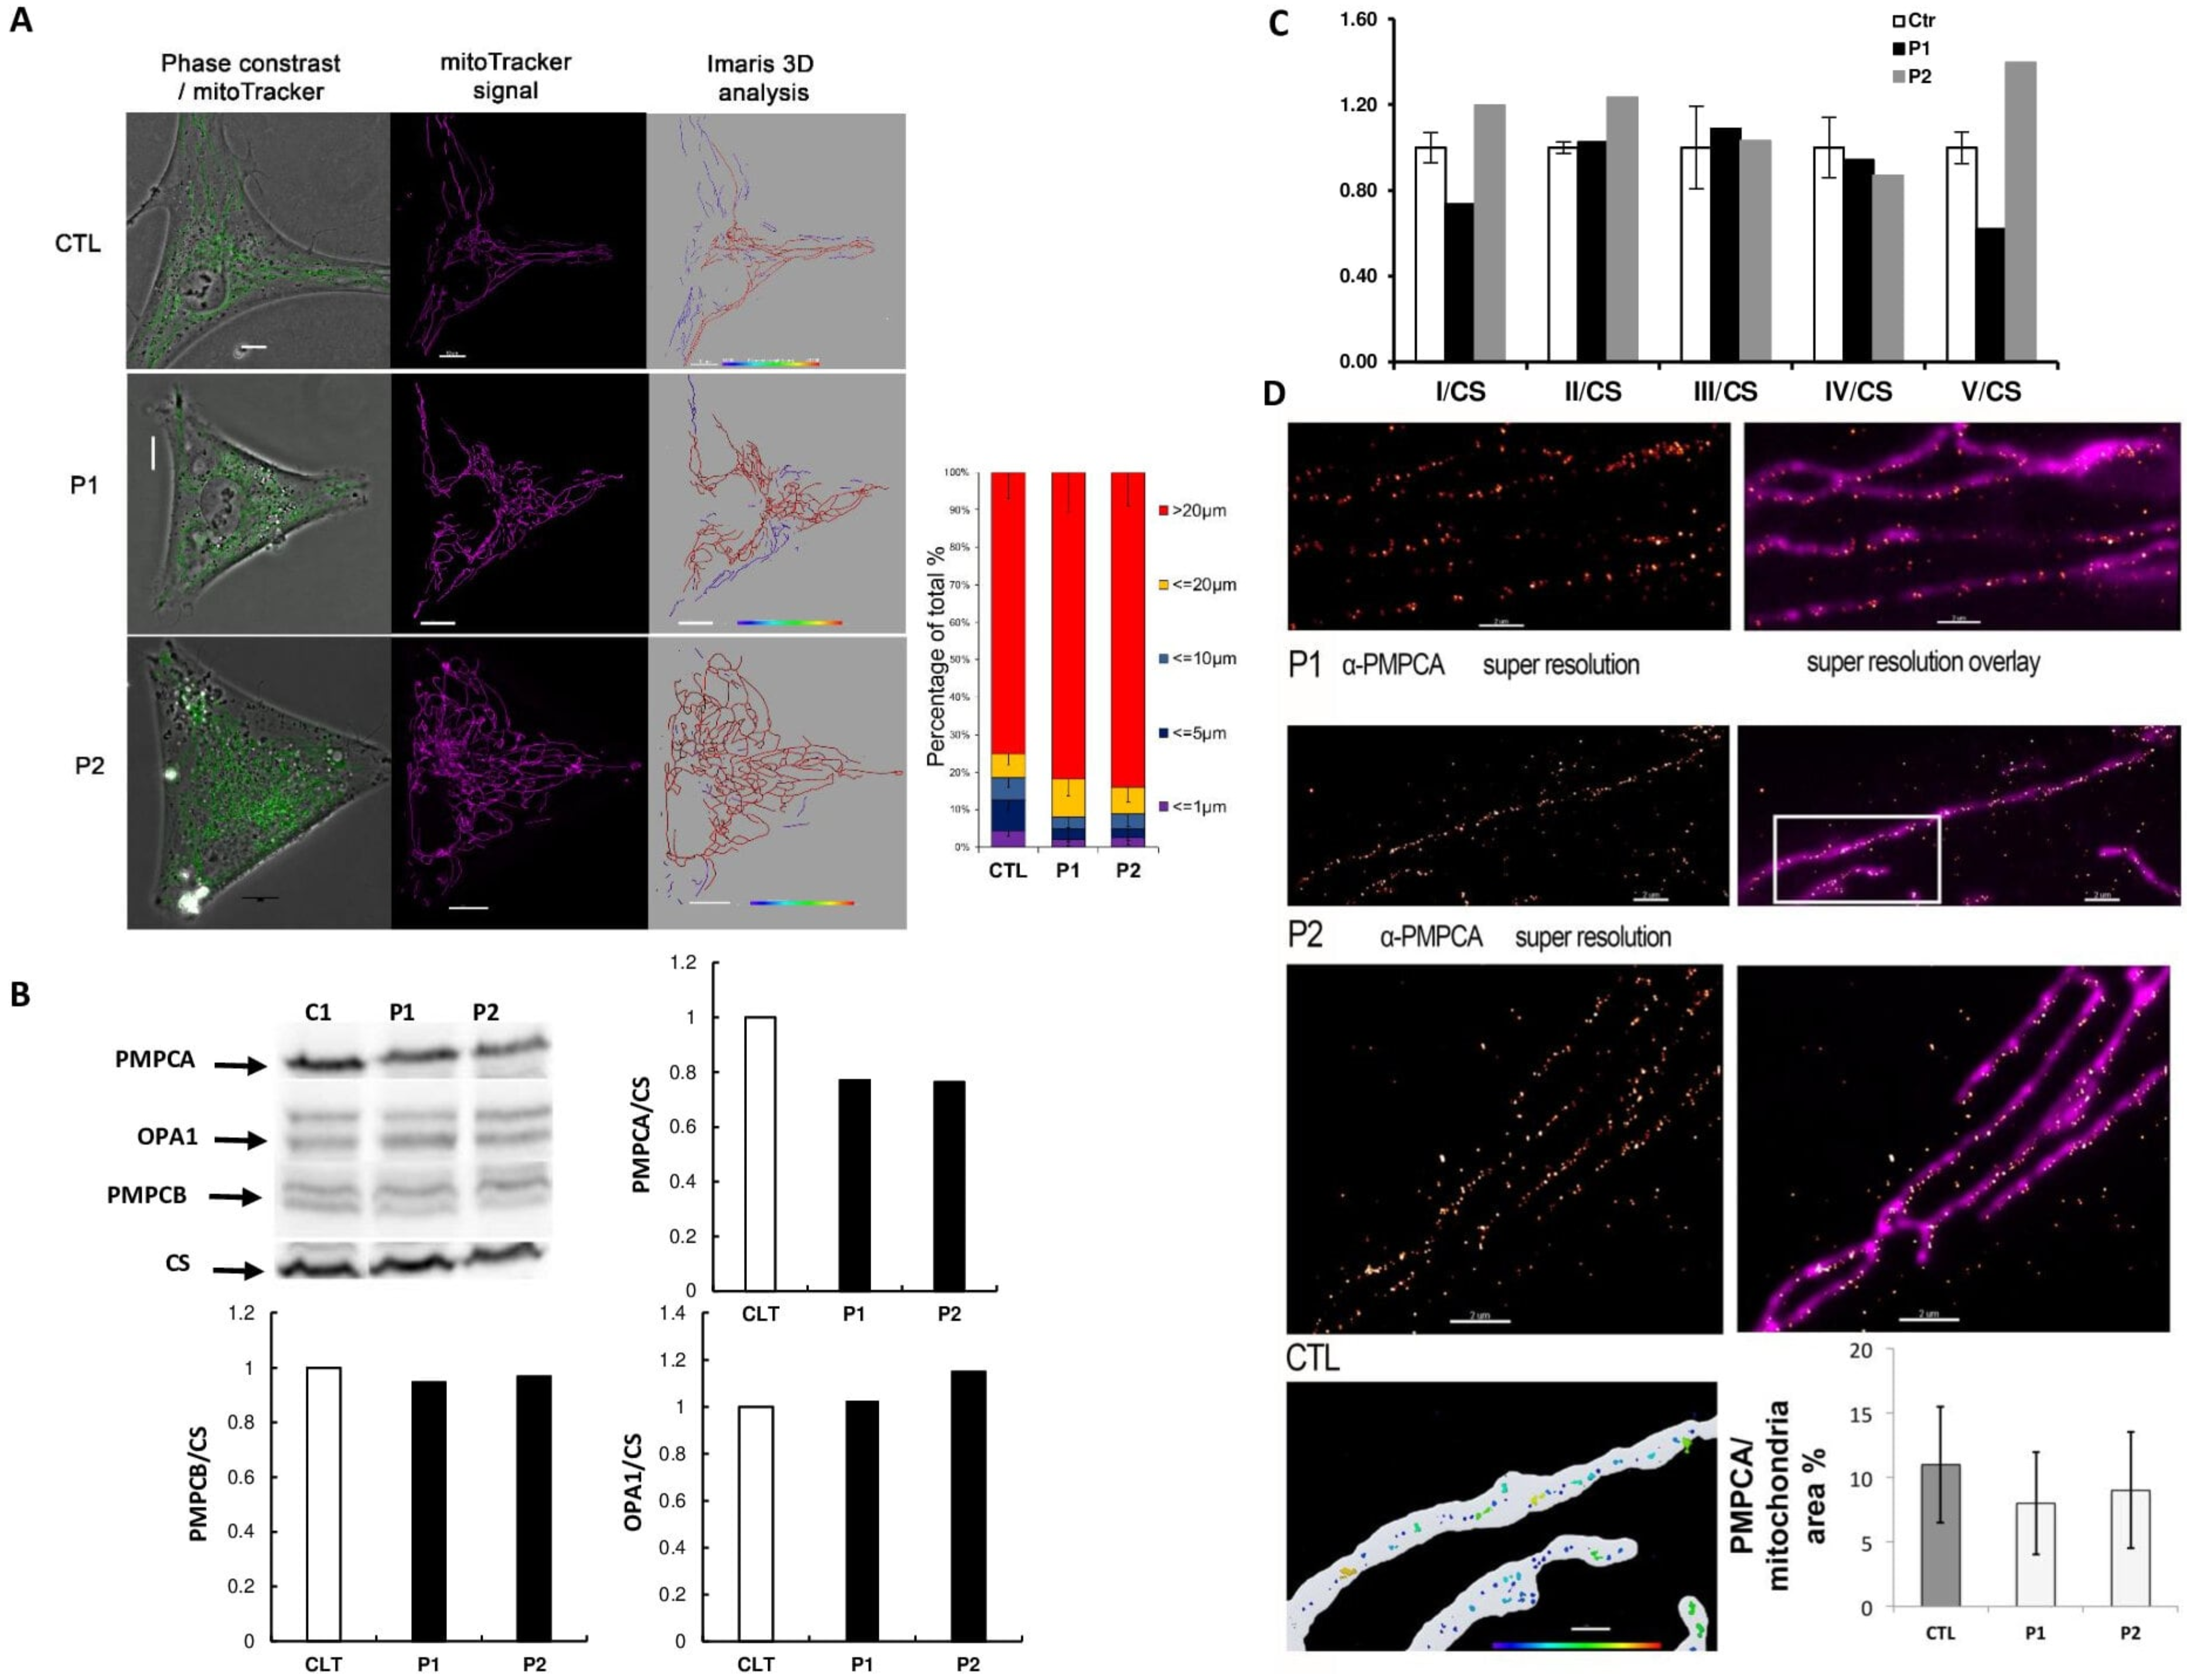
3.3. Functional Effects of PMPCA Variants

To evaluate the consequences of PMPCA variants on mitochondrial physiology, two fibroblast cell lines were derived from individuals P1: II:1 and P2: II:2 from families 1 and 3. Mitochondrial network overlaid on phase-contrast revealed hyperconnected structures in cells from PMPCA patients, compared to control (Figure 2A). Western blots experiments, using PMPCA, PMPCB, OPA1 and citrate synthase (CS) antibodies revealed a 25% reduction in PMPCA level, lower than expected for frameshift variants, and equal levels of PMPCB and OPA1 proteins (Figure 2B). Enzymatic activities of the respiratory chain complexes did not reveal a significant difference between control and mutated fibroblasts (Figure 2C). In addition, no alteration was noticed in the analysis of PMPCA distribution in the mitochondrial network (Figure 2D).

4. Discussion

Dominant optic atrophy is a heterogeneous group of diseases caused by selective loss of retinal ganglion cells (RGCs) and ascending degeneration of the optic nerve. In this study, we identified four heterozygous variants in PMPCA as a cause of DOA in five unrelated families. These variants are either novel or referenced with a very low frequency in the gnomAD database. The two missense variants are classified by the ACMG guidelines as variants of uncertain significance, although in silico analysis using the most common tools shows that these variants are probably damaging (Table 2) and were evolutionary well conserved in different animal species (Figure 1C). However functional studies are necessary to ascertain their full contribution to the disease.
Recessive pathogenic variants in PMPCA have been described in the context of non-progressive cerebellar ataxia and severe Leigh-like syndrome associated with spastic ataxia [22,23,24,25]. Thus, except for OPA1, all other DOA genes were initially identified as causing severe, essentially recessive, mitochondrial diseases, while dominant variants in these genes are causing DOA. Again, this is the case for PMPCA, for which we disclosed the involvement of heterozygous variants in a rather late-onset optic atrophy. Because, of the four variants identified, two were frameshifts classified as likely pathogenic, it should be advised to examine the parents of SCAR2 patients who are carriers of other frameshift variants. A similar situation has been observed for the SPG7 gene, with the initial identification of rather mild optic atrophy in recessive SPG7 patients with spastic paraplegia, followed later by the identification of dominant SPG7 variants in patients with restricted Dominant Optic Atrophy [10].
Interestingly, of the five patients identified with PMPCA variants, two had additional neurological symptoms, such as peripheral neuropathy for the index case of family 2 and multiple sclerosis for the index case from family 4. This is supported by previous observations that multisystemic manifestations, including neurological symptoms, are reported in up to 20% of OPA1 pathogenic variant carriers and in LHON patients [28,29,30,31,32]. Thus, functional alterations of PMPCA might predispose patients to the emergence of neurological symptoms, in addition to jeopardizing RGC function and survival.
PMPCA encodes the α subunit of the mitochondrial processing peptidase (MPP), which cleaves the targeting peptide of nuclear-encoded mitochondrial precursor proteins upon their import into mitochondria [21]. Our observation of PMPCA fibroblasts revealed a decreased level of PMPCA protein, although not reaching a 50% decrease, as would be expected for cells with a frameshift variant and deeply contrasting with the observation of a severe PMPCA depletion in SCAR2 patient lymphoblasts, associated with impaired frataxin production and processing [23,25]. In addition, a hyperconnected mitochondrial network was observed in PMPCA conditions, as already reported in fibroblasts from DNM1L and OPA3 patients affected by DOA [12,15]. Conversely, we did not disclose the alteration of the respiratory chain, nor the PMPCA distribution in the mitochondrial network, but some rare events at mitochondria-autophagosome contact sites are suggestive of increased mitophagy (data not shown).
In summary, we suggest heterozygous variants in PMPCA gene as new candidates for DOA. We also present a novel pathophysiological mechanism responsible for retinal ganglion cell degeneration, most likely milder than the one responsible for SCAR2 presentation, caused by bi-allelic PMPCA pathogenic variants.

5. Conclusions

In conclusion, we report the first DOA patients with heterozygous PMPCA variants, confirming the genetic heterogeneity of autosomal inherited optic neuropathies and the important role of mitochondrial import in the maintenance of retinal ganglion cell integrity.

Author Contributions

Conception and design of the study: P.A.-B. and G.L. Clinical investigation and phenotyping: I.M., F.M., F.V., L.J. and D.B. Acquisition and analysis of data: M.C., A.C., N.G., S.K., C.B., D.G., V.D.-D., V.P., P.A.-B. and P.R. Drafting a significant portion of the manuscript and figures: M.C., A.C. and G.L. All authors have read and agreed to the published version of the manuscript.

Funding

This research received no external funding.

Institutional Review Board Statement

The study was conducted in accordance with the protocols approved by the Ethical Committees of the different Institutes involved in this study, and in agreement with the Declaration of Helsinki (Institutional Review Board Committee of the University Hospital of Angers, Authorization number: AC-2012-1507).

Informed Consent Statement

Informed consent was obtained from all subjects involved in the study.

Acknowledgments

We are indebted to the financial support from the Université d’Angers, CHU d’Angers, the Région Pays de la Loire, Angers Loire Métropole, the Fondation Maladies Rares, Fondation pour la Recherche Médicale, Retina France, UNADEV, Association Française contre les Myopathies, Ouvrir Les Yeux, Kjer-France, Association ACO2 gene, Fondation de France and the Fondation VISIO.

Conflicts of Interest

All authors declare that they have no conflict of interest with the publication of the data presented here.

References

  1. Carelli, V.; Ross-Cisneros, F.N.; Sadun, A.A. Mitochondrial dysfunction as a cause of optic neuropathies. Prog. Retin. Eye Res. 2004, 23, 53–89. [Google Scholar] [CrossRef]
  2. Yu-Wai-Man, P.; Shankar, S.P.; Biousse, V.; Miller, N.R.; Bean, L.J.H.; Coffee, B.; Hegde, M.; Newman, N.J. Genetic screening for OPA1 and OPA3 mutations in patients with suspected inherited optic neuropathies. Ophthalmology 2011, 118, 558–563. [Google Scholar] [CrossRef] [Green Version]
  3. Lenaers, G.; Hamel, C.; Delettre, C.; Amati-Bonneau, P.; Procaccio, V.; Bonneau, D.; Reynier, P.; Milea, D. Dominant optic atrophy. Orphanet J. Rare Dis. 2012, 7, 46. [Google Scholar] [CrossRef] [Green Version]
  4. Newman, N.J.; Biousse, V. Hereditary optic neuropathies. Eye 2004, 18, 1144–1160. [Google Scholar] [CrossRef] [PubMed] [Green Version]
  5. Bagli, E.; Zikou, A.K.; Agnantis, N.; Kitsos, G. Mitochondrial Membrane Dynamics and Inherited Optic Neuropathies. In Vivo 2017, 31, 511–525. [Google Scholar]
  6. Le Roux, B.; Lenaers, G.; Zanlonghi, X.; Amati-Bonneau, P.; Chabrun, F.; Foulonneau, T.; Caignard, A.; Leruez, S.; Gohier, P.; Procaccio, V.; et al. OPA1: 516 unique variants and 831 patients registered in an updated centralized Variome database. Orphanet J. Rare Dis. 2019, 14, 214. [Google Scholar] [CrossRef]
  7. Alexander, C.; Votruba, M.; Pesch, U.E.A.; Thiselton, D.L.; Mayer, S.; Rodriguez, M.; Kellner, U.; Leo-kottler, B.; Auburger, G.; Bhattacharya, S.S.; et al. OPA1, encoding a dynamin-related GTPase, is mutated in autosomal dominant optic atrophy linked to chromosome 3q28. Nat. Genet. 2000, 26, 211–215. [Google Scholar] [CrossRef] [PubMed]
  8. Delettre, C.; Lenaers, G.; Pelloquin, L.; Belenguer, P.; Hamel, C.P. OPA1 (Kjer type) dominant optic atrophy: A novel mitochondrial disease. Mol. Genet. Metab. 2002, 75, 97–107. [Google Scholar] [CrossRef]
  9. Jurkute, N.; Majander, A.; Bowman, R.; Votruba, M.; Abbs, S.; Acheson, J.; Lenaers, G.; Amati-Bonneau, P.; Moosajee, M.; Arno, G.; et al. Clinical utility gene card for: Inherited optic neuropathies including next-generation sequencing-based approaches. Eur. J. Hum. Genet. 2019, 27, 494–502. [Google Scholar] [CrossRef]
  10. Charif, M.; Chevrollier, A.; Gueguen, N.; Bris, C.; Goudenège, D.; Desquiret-Dumas, V.; Leruez, S.; Colin, E.; Meunier, A.; Vignal, C.; et al. Mutations in the m-AAA proteases AFG3L2 and SPG7 are causing isolated dominant optic atrophy. Neurol. Genet. 2020, 6, e428. [Google Scholar] [CrossRef]
  11. Charif, M.; Roubertie, A.; Salime, S.; Mamouni, S.; Goizet, C.; Hamel, C.P.; Lenaers, G. A novel mutation of AFG3L2 might cause dominant optic atrophy in patients with mild intellectual disability. Front. Genet. 2015, 6, 311. [Google Scholar] [CrossRef] [PubMed] [Green Version]
  12. Gerber, S.; Charif, M.; Chevrollier, A.; Chaumette, T.; Angebault, C.; Kane, M.S.; Paris, A.; Alban, J.; Quiles, M.; Delettre, C.; et al. Mutations in DNM1L, as in OPA1, result indominant optic atrophy despite opposite effectson mitochondrial fusion and fission. Brain 2017, 140, 2586–2596. [Google Scholar] [CrossRef] [PubMed]
  13. Klebe, S.; Depienne, C.; Gerber, S.; Challe, G.; Anheim, M.; Charles, P.; Fedirko, E.; Lejeune, E.; Cottineau, J.; Brusco, A.; et al. Spastic paraplegia gene 7 in patients with spasticity and/or optic neuropathy. Brain 2012, 135, 2980–2993. [Google Scholar] [CrossRef]
  14. Piro-Mégy, C.; Sarzi, E.; Tarrés-Solé, A.; Péquignot, M.; Hensen, F.; Quilès, M.; Manes, G.; Chakraborty, A.; Sénéchal, A.; Bocquet, B.; et al. Dominant mutations in mtDNA maintenance gene SSBP1 cause optic atrophy and foveopathy. J. Clin. Investig. 2020, 130, 143–156. [Google Scholar] [CrossRef]
  15. Reynier, P.; Amati-Bonneau, P.; Verny, C.; Olichon, A.; Simard, G.; Guichet, A.; Bonnemains, C.; Malecaze, F.; Malinge, M.C.; Pelletier, J.B.; et al. OPA3 gene mutations responsible for autosomal dominant optic atrophy and cataract. J. Med. Genet. 2004, 41, e110. [Google Scholar] [CrossRef] [PubMed] [Green Version]
  16. Rouzier, C.; Bannwarth, S.; Chaussenot, A.; Chevrollier, A.; Verschueren, A.; Bonello-Palot, N.; Fragaki, K.; Cano, A.; Pouget, J.; Pellissier, J.F.; et al. The MFN2 gene is responsible for mitochondrial DNA instability and optic atrophy “plus” phenotype. Brain 2012, 135, 23–34. [Google Scholar] [CrossRef] [PubMed] [Green Version]
  17. Lenaers, G.; Neutzner, A.; Le Dantec, Y.; Jüschke, C.; Xiao, T.; Decembrini, S.; Swirski, S.; Kieninger, S.; Agca, C.; Kim, U.S.; et al. Dominant optic atrophy: Culprit mitochondria in the optic nerve. Prog. Retin. Eye Res. 2021, 83, 100935. [Google Scholar] [CrossRef] [PubMed]
  18. Rendtorff, N.D.; Lodahl, M.; Boulahbel, H.; Johansen, I.R.; Pandya, A.; Welch, K.O.; Norris, V.W.; Arnos, K.S.; Bitner-Glindzicz, M.; Emery, S.B.; et al. Identification of p.A684V missense mutation in the WFS1 gene as a frequent cause of autosomal dominant optic atrophy and hearing impairment. Am. J. Med. Genet. Part A 2011, 155, 1298–1313. [Google Scholar] [CrossRef] [Green Version]
  19. Grenier, J.; Meunier, I.; Daien, V.; Baudoin, C.; Halloy, F.; Bocquet, B.; Blanchet, C.; Delettre, C.; Esmenjaud, E.; Roubertie, A.; et al. WFS1 in Optic Neuropathies: Mutation Findings in Nonsyndromic Optic Atrophy and Assessment of Clinical Severity. Ophthalmology 2016, 123, 1989–1998. [Google Scholar] [CrossRef]
  20. Gakh, O.; Cavadini, P.; Isaya, G. Mitochondrial processing peptidases. Biochim. Biophys. Acta—Mol. Cell Res. 2002, 1592, 63–77. [Google Scholar] [CrossRef] [Green Version]
  21. Teixeira, P.F.; Glaser, E. Processing peptidases in mitochondria and chloroplasts. Biochim. Biophys. Acta—Mol. Cell Res. 2013, 1833, 360–370. [Google Scholar] [CrossRef] [Green Version]
  22. Choquet, K.; Zurita-Rendón, O.; La Piana, R.; Yang, S.; Dicaire, M.J.; Boycott, K.M.; Majewski, J.; Shoubridge, E.A.; Brais, B.; Tétreault, M. Autosomal recessive cerebellar ataxia caused by a homozygous mutation in PMPCA. Brain 2016, 139, e19. [Google Scholar] [CrossRef] [Green Version]
  23. Joshi, M.; Anselm, I.; Shi, J.; Bale, T.A.; Towne, M.; Schmitz-Abe, K.; Crowley, L.; Giani, F.C.; Kazerounian, S.; Markianos, K.; et al. Mutations in the substrate binding glycine-rich loop of the mitochondrial processing peptidase-α protein (PMPCA) cause a severe mitochondrial disease. Mol. Case Stud. 2016, 2, a000786. [Google Scholar] [CrossRef] [PubMed] [Green Version]
  24. Takahashi, Y.; Kubota, M.; Kosaki, R.; Kosaki, K.; Ishiguro, A. A severe form of autosomal recessive spinocerebellar ataxia associated with novel PMPCA variants. Brain Dev. 2020, 43, 464–469. [Google Scholar] [CrossRef] [PubMed]
  25. Jobling, R.K.; Assoum, M.; Gakh, O.; Blaser, S.; Raiman, J.A.; Mignot, C.; Roze, E.; Dürr, A.; Brice, A.; Lévy, N.; et al. PMPCA mutations cause abnormal mitochondrial protein processing in patients with non-progressive cerebellar ataxia. Brain 2015, 138, 1505–1517. [Google Scholar] [CrossRef] [Green Version]
  26. Codron, P.; Cassereau, J.; Vourc’h, P.; Veyrat-Durebex, C.; Blasco, H.; Kane, S.; Procaccio, V.; Letournel, F.; Verny, C.; Lenaers, G.; et al. Primary fibroblasts derived from sporadic amyotrophic lateral sclerosis patients do not show ALS cytological lesions. Amyotroph. Lateral Scler. Front. Degener. 2018, 19, 446–456. [Google Scholar] [CrossRef]
  27. Kechkar, A.; Nair, D.; Heilemann, M.; Choquet, D.; Sibarita, J.B. Real-Time Analysis and Visualization for Single-Molecule Based Super-Resolution Microscopy. PLoS ONE 2013, 8, e62918. [Google Scholar] [CrossRef]
  28. Amati-Bonneau, P.; Valentino, M.L.; Reynier, P.; Gallardo, M.E.; Bornstein, B.; Boissière, A.; Campos, Y.; Rivera, H.; De La Aleja, J.G.; Carroccia, R.; et al. OPA1 mutations induce mitochondrial DNA instability and optic atrophy “plus” phenotypes. Brain 2008, 131, 338–351. [Google Scholar] [CrossRef] [PubMed] [Green Version]
  29. Amati-bonneau, P.; Odent, S.; Derrien, C.; Pasquier, L.; Malthiéry, Y.; Reynier, P.; Bonneau, D. The association of autosomal dominant optic atrophy and moderate deafness may be due to the R445H mutation in the OPA1 gene. Am. J. Ophthalmol. 2003, 136, 1170–1171. [Google Scholar] [CrossRef]
  30. Hudson, G.; Amati-bonneau, P.; Blakely, E.L.; Stewart, J.D.; He, L.; Schaefer, A.M.; Griffiths, P.G.; Ahlqvist, K.; Suomalainen, A.; Reynier, P.; et al. Mutation of OPA1 causes dominant optic atrophy with external ophthalmoplegia, ataxia, deafness and multiple mitochondrial DNA deletions: A novel disorder of mtDNA maintenance. Brain 2008, 131, 329–337. [Google Scholar] [CrossRef] [PubMed]
  31. Yu-Wai-Man, P.; Votruba, M.; Burté, F.; La Morgia, C.; Barboni, P.; Carelli, V. A neurodegenerative perspective on mitochondrial optic neuropathies. Acta Neuropathol. 2016, 132, 789–806. [Google Scholar] [CrossRef] [PubMed] [Green Version]
  32. Priglinger, C.; Klopstock, T.; Rudolph, G.; Priglinger, S.G. Leber’s Hereditary Optic Neuropathy. Klin. Monbl. Augenheilkd. 2019, 236, 1271–1282. [Google Scholar] [CrossRef] [PubMed]
Figure 1. PMPCA pedigrees and amino acid change localization. (A): Description of the pedigrees with PMPCA (NM_015160.3) variants and their segregation among the families. (B): The structure of the PMPCA protein with the amino acid changes associated with DOA on the top, and associated with Spinocerebellar ataxia, autosomal recessive 2 (SCAR2) and a progressive mitochondrial encephalopathy, on the bottom. (C): Evolutionary conservation of the p.Ala455 and p.Arg516 residues (in red) and their neighbor amino acids in eukaryotic PMPCA protein sequences of metazoans and invertebrates.
Genes 13 01202 g001
Figure 2. Mitochondrial dynamic and PMPCA distribution studies of fibroblasts from control and PMPCA mutated patients. (A): Representative fluorescent images of mitochondrial network structure overlaid on phase-contrast (on the left) showed a mitochondrial network hyperconnection in PMPCA fibroblasts. Mitochondrial volume (in purple on black background in the middle) was assessed using the Mitotracker Green fluorescent signal by Imaris software and color-coded on the right. The inset illustrates the classification code. To present the changes in mitochondrial morphology in patients’ cells, types of mitochondria were classified into 5 groups according to mitochondrial length: blobs < 1 μm; fragmented < 5 μm; tubular < 10 μm; filamentous < 20 μm; mitochondrial network > 20 um. Bar graphs show the distribution of the mitochondrial population of Control, P1 and P2. Mean ± SEM. Scale bar: 10 μm. (B): Western blots (left) against PMPCA, PMPCB, OPA1 and citrate synthase (CS) on control (C1) and two patients’ (P1 and P2) fibroblasts reveal decreased levels of PMPCA and equal levels of PMPCB and OPA1 in the pathological conditions, as shown on the histogram (right). (C): Enzymatic activities of the respiratory complexes (CI to CV) from the control and the PMPCA mutated fibroblast strains related to the citrate synthase (CS) enzymatic activity, did not reveal a significant difference between control and mutated fibroblasts. Biochemical data were generated using the two-tailed paired t-test. Results are Mean ± S.E.M. from four independent experiments. (D): Single-molecule localization microscopy dSTORM was used to analyze PMPCA distribution, correlated to total internal reflection fluorescence TIRF microscopy for mitochondrial staining. Using Imaris 8.0 ® software, the dSTORM PMPCA immunofluorescence signal was used to quantify their mitochondrial surface protein distribution.
Genes 13 01202 g002
Table 1. Clinical and Molecular Data of the PMPCA Patients.
FamilyPatientSexAgeVAOther SymptomsBrain MRIORF ChangeProtein Changers #Gnomad Freq.ACMG Classification
1(II.1)M30counting fingers-normalc.309delAp.(Lys103AsnfsTer74)unknown-PVS1 and PM2
Class 5
2(II.1)M53 peripheral neuropathynormal
3(II.2)M454/10-normalc.820delGp.(Val274SerfsTer27)rs7774451984.01 × 10−6 PVS1 and PM2
Class 5
4(II.1)M350.5/10multiple sclerosisNDc.1363G>Ap.(Ala455Thr)unknown-PM2 and BP4
Class 3
5(II.1)M696/10-NDc.1547G>Ap.(Arg516His)rs7681967118.01 × 10−6 PM2
Class 3
Abbreviations: VA: visual acuity; M: male; rs #: reference sequence number; gnomAD Freq.: Frequency in the Genome Aggregation Database; ACMG: American College of Medical Genetics and Genomics PVS1: Null variant (nonsense, frameshift, canonical ±1 or 2 splice sites, initiation codon, single or multiexon deletion) in a gene where LOF is a known mechanism of disease. (Pathogenic, Very Strong). PM2: Absent from controls (or at extremely low frequency if recessive) in Exome Sequencing Project, 1000 Genomes Project, or Exome Aggregation Consortium. (Pathogenic, Moderate). BP4: Multiple lines of computational evidence suggest no impact on gene or gene product (conservation, evolutionary, splicing impact, etc.) (Benign, Supporting).
Table 2. In Silico Analysis of PMPCA Missense Variants.
VariantPolyphenSIFTMutationTasterFATHMM-MKLLRTPROVEANDANN
c.1363G>A (p.Ala455Thr)0.568
possibly damaging
0.492
tolerated
0.9999
disease-causing
0.9334
damaging
0
deleterious
−2.46, −2.42, −2.78
damaging
0.9956
damaging
c.1547G>A (p.Arg516His)0.017
benign
0.025
damaging
0.9999
disease-causing
0.9669
damaging
9.9999 × 10⁻⁷
neutral
−2.83, −2.53
damaging
0.9982
damaging
Publisher’s Note: MDPI stays neutral with regard to jurisdictional claims in published maps and institutional affiliations.

