
WGCNA Analysis Identifies the Hub Genes Related to Heat Stress in Seedling of Rice (Oryza sativa L.)

 and
and 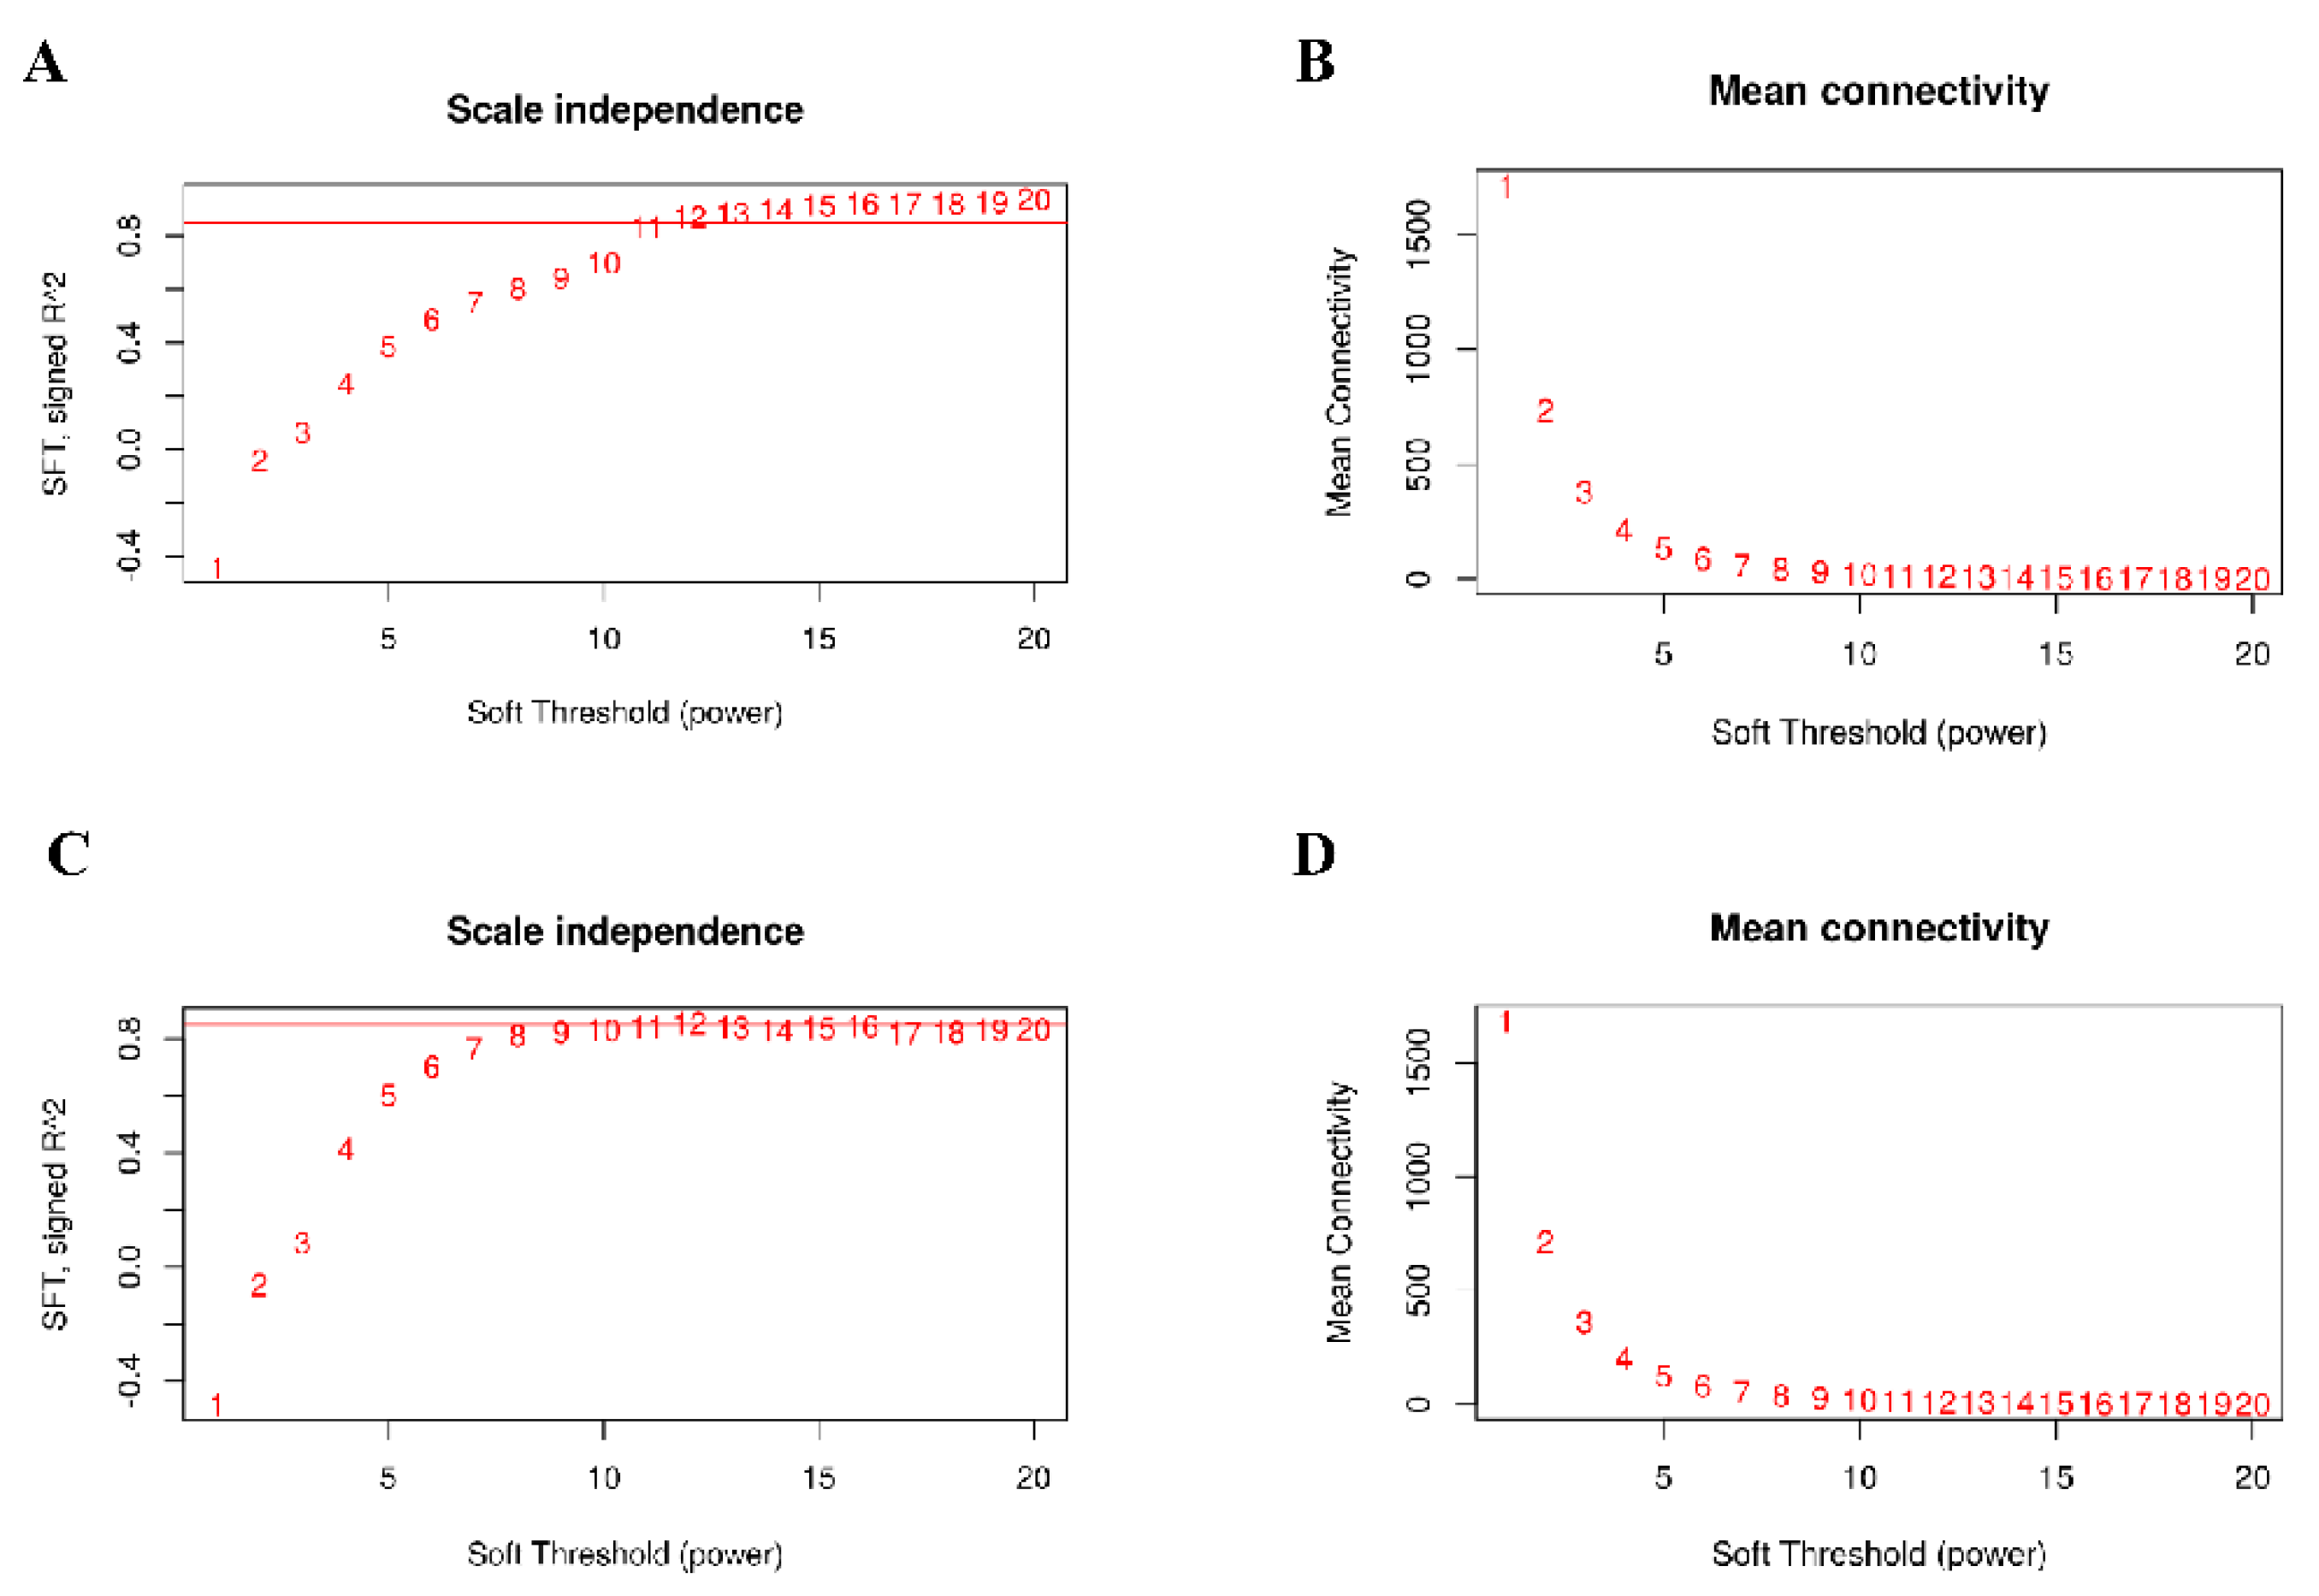
Abstract
:1. Introduction
2. Materials and Methods
2.1. Rice Varieties and HS
2.2. Acquisition and Standardization of Transcriptome Data
2.3. Construction of WGCNA Co–Expression Network
2.4. Identification and Analysis of Vital Modules and Key Genes
2.5. Function Enrichment and Visualization of Key Genes
2.6. Selection of Candidate Hub Genes
3. Results
3.1. Data Processing
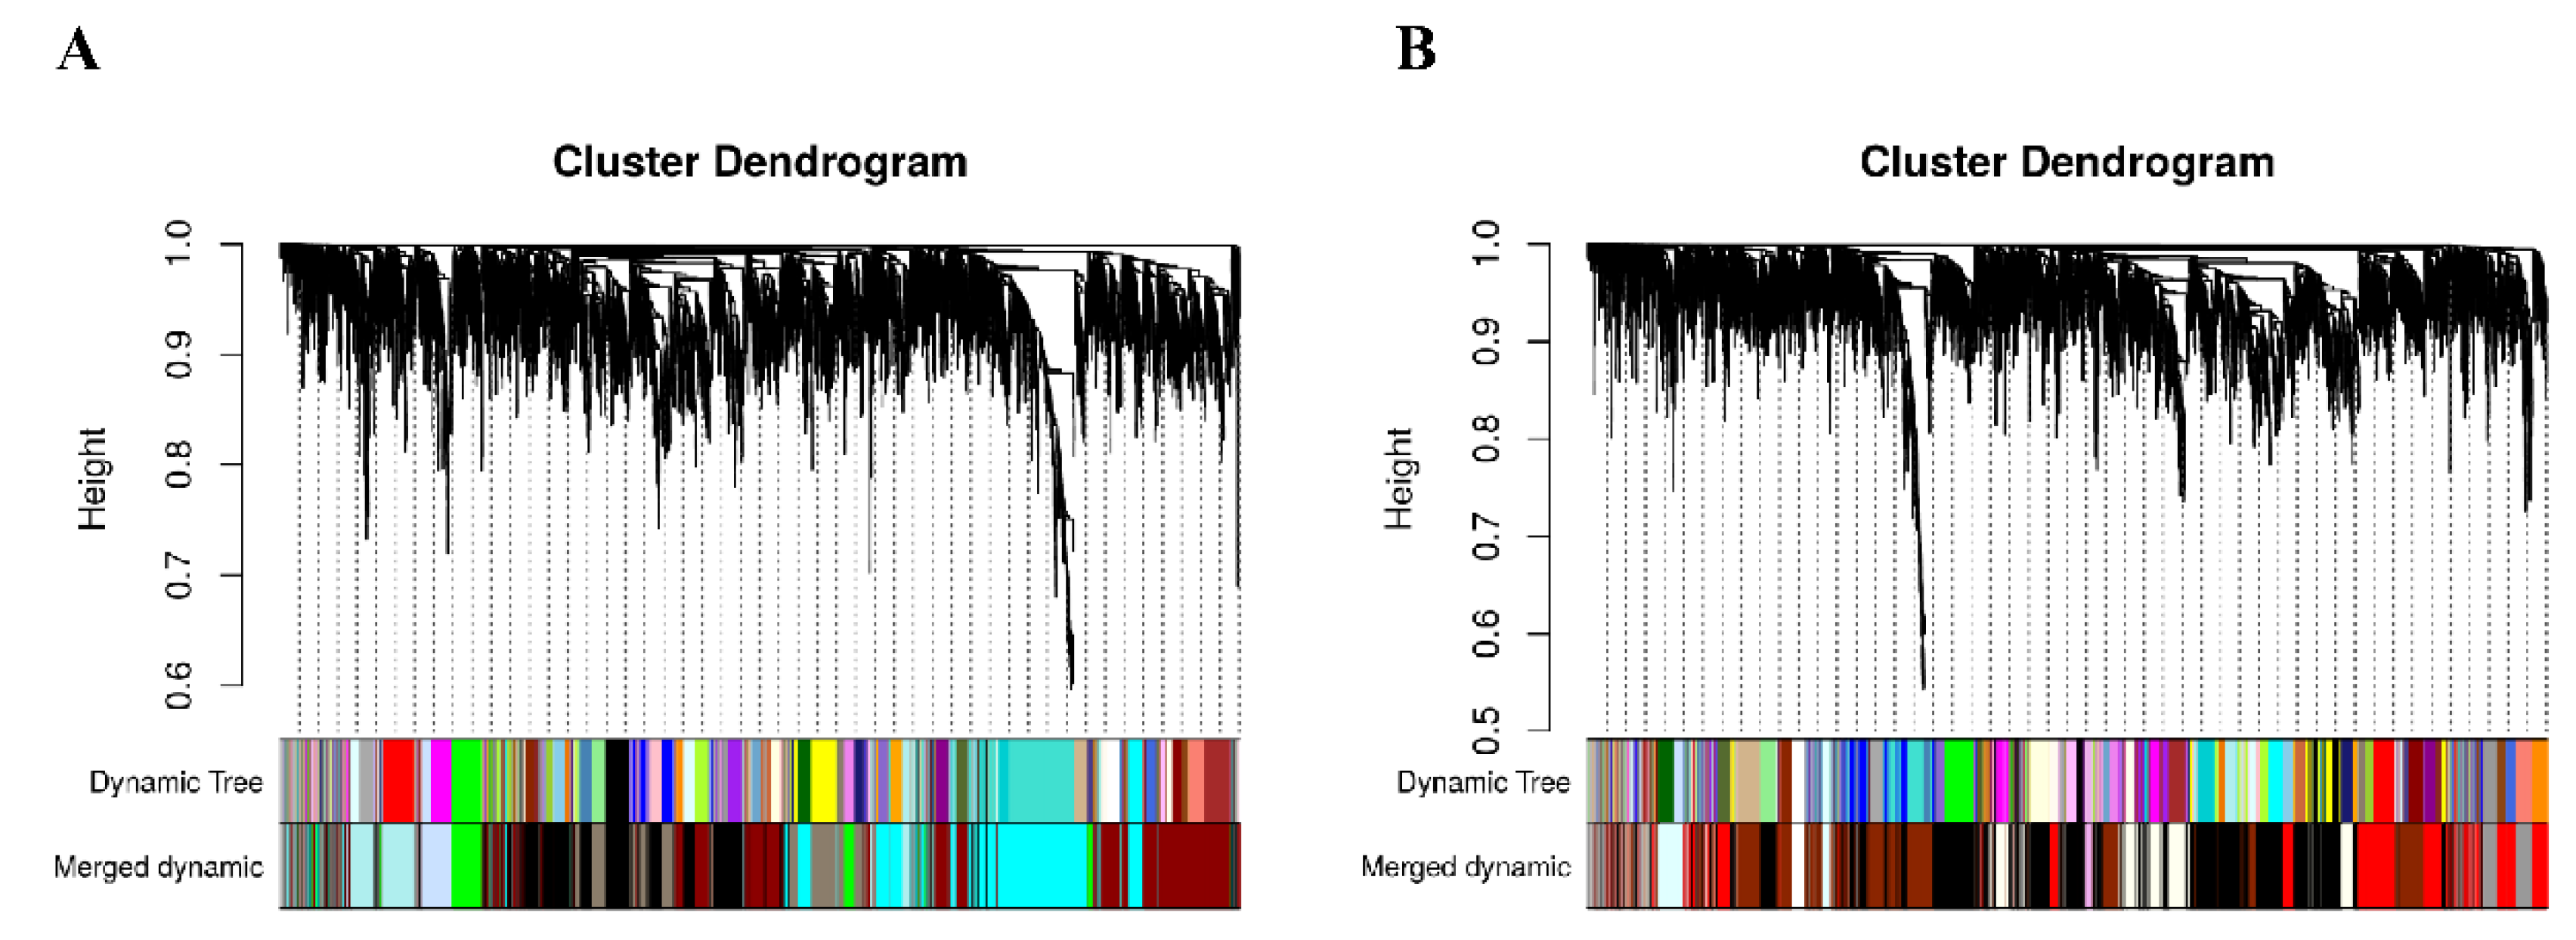
3.2. Construction of Co–Expression Network by WGCNA
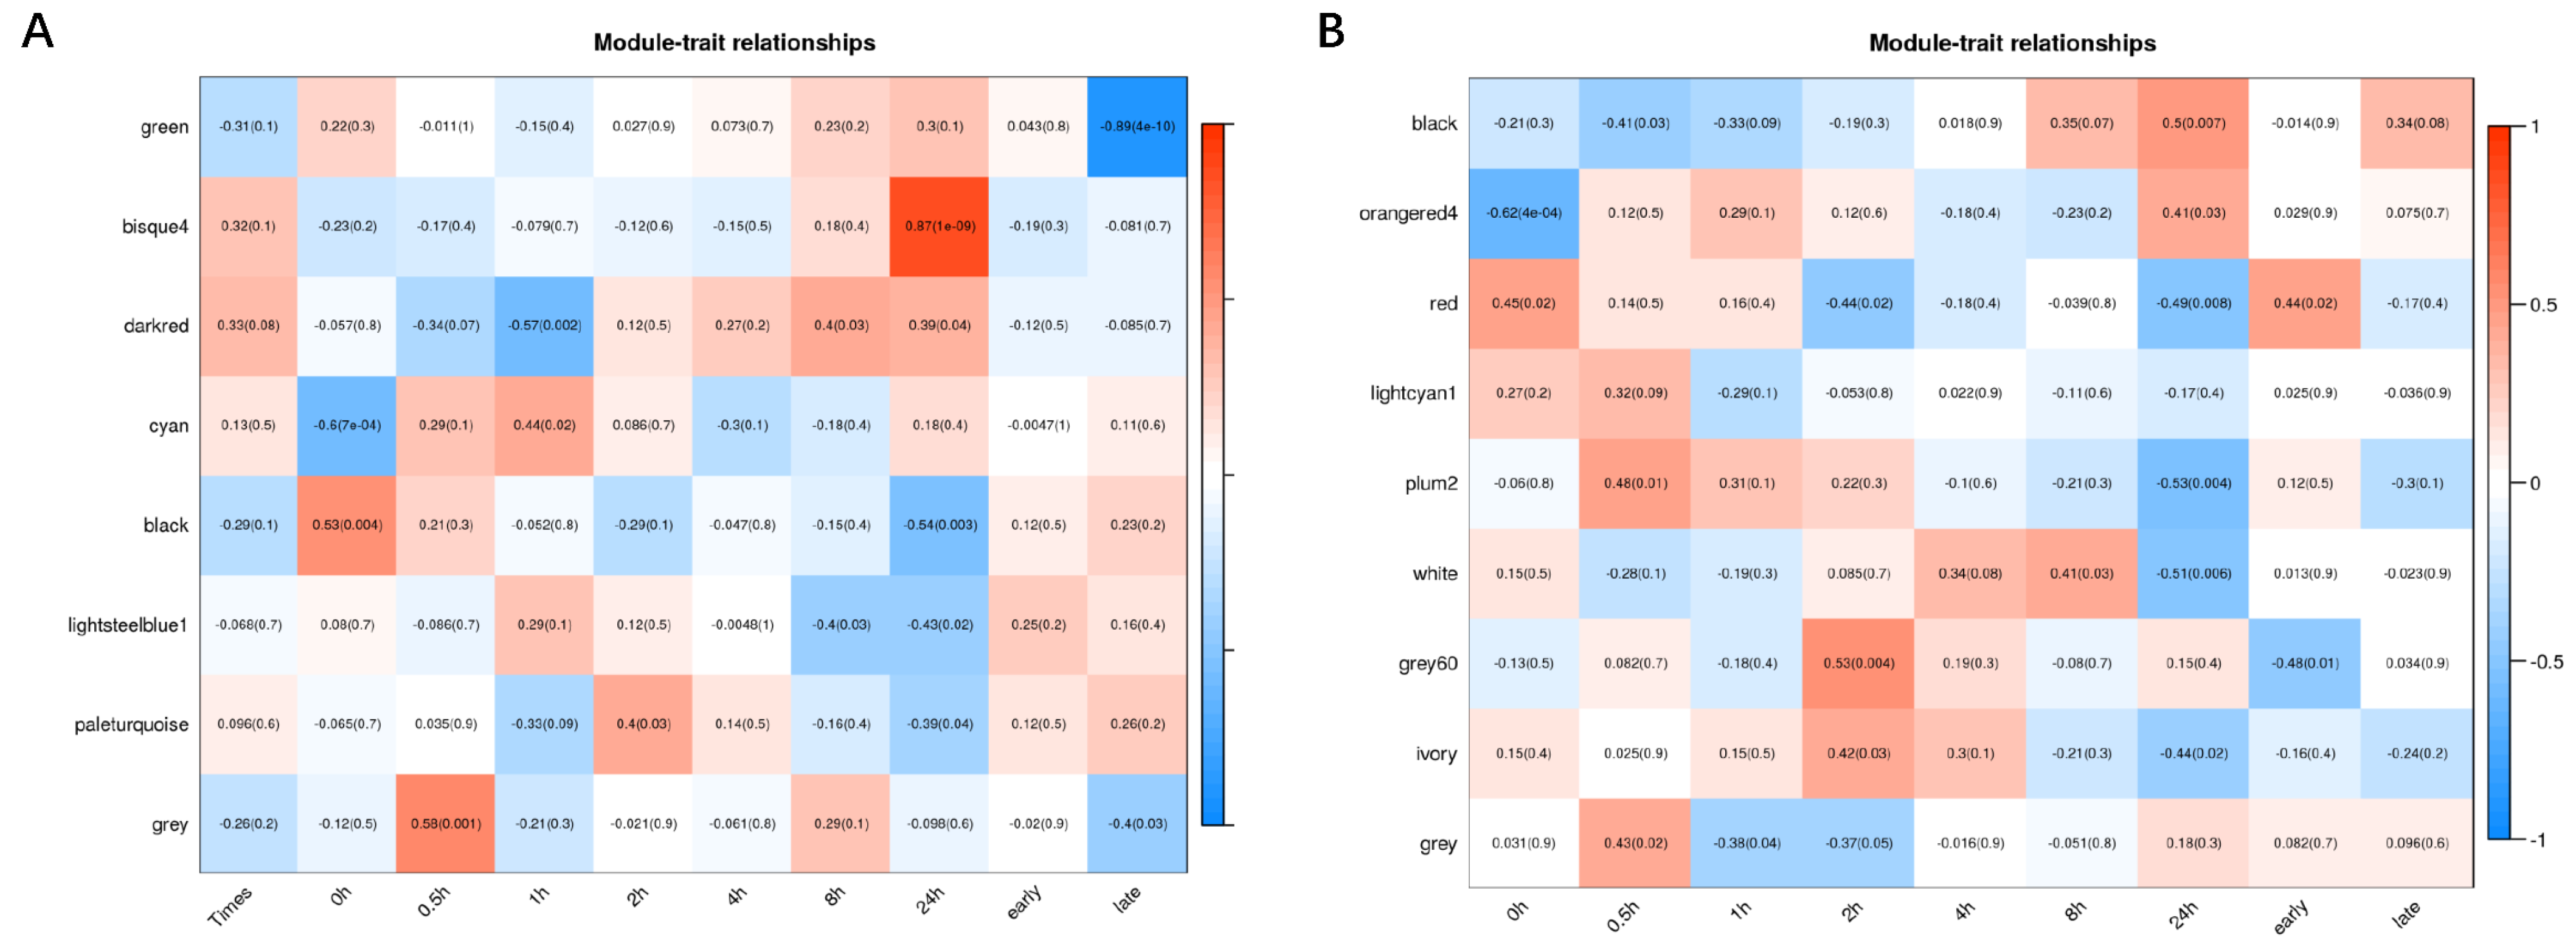
3.3. Modules Associated with Differences between IR64 and Koshihikari after HS
3.4. Classification and Analysis of HS–Related Known–Genes
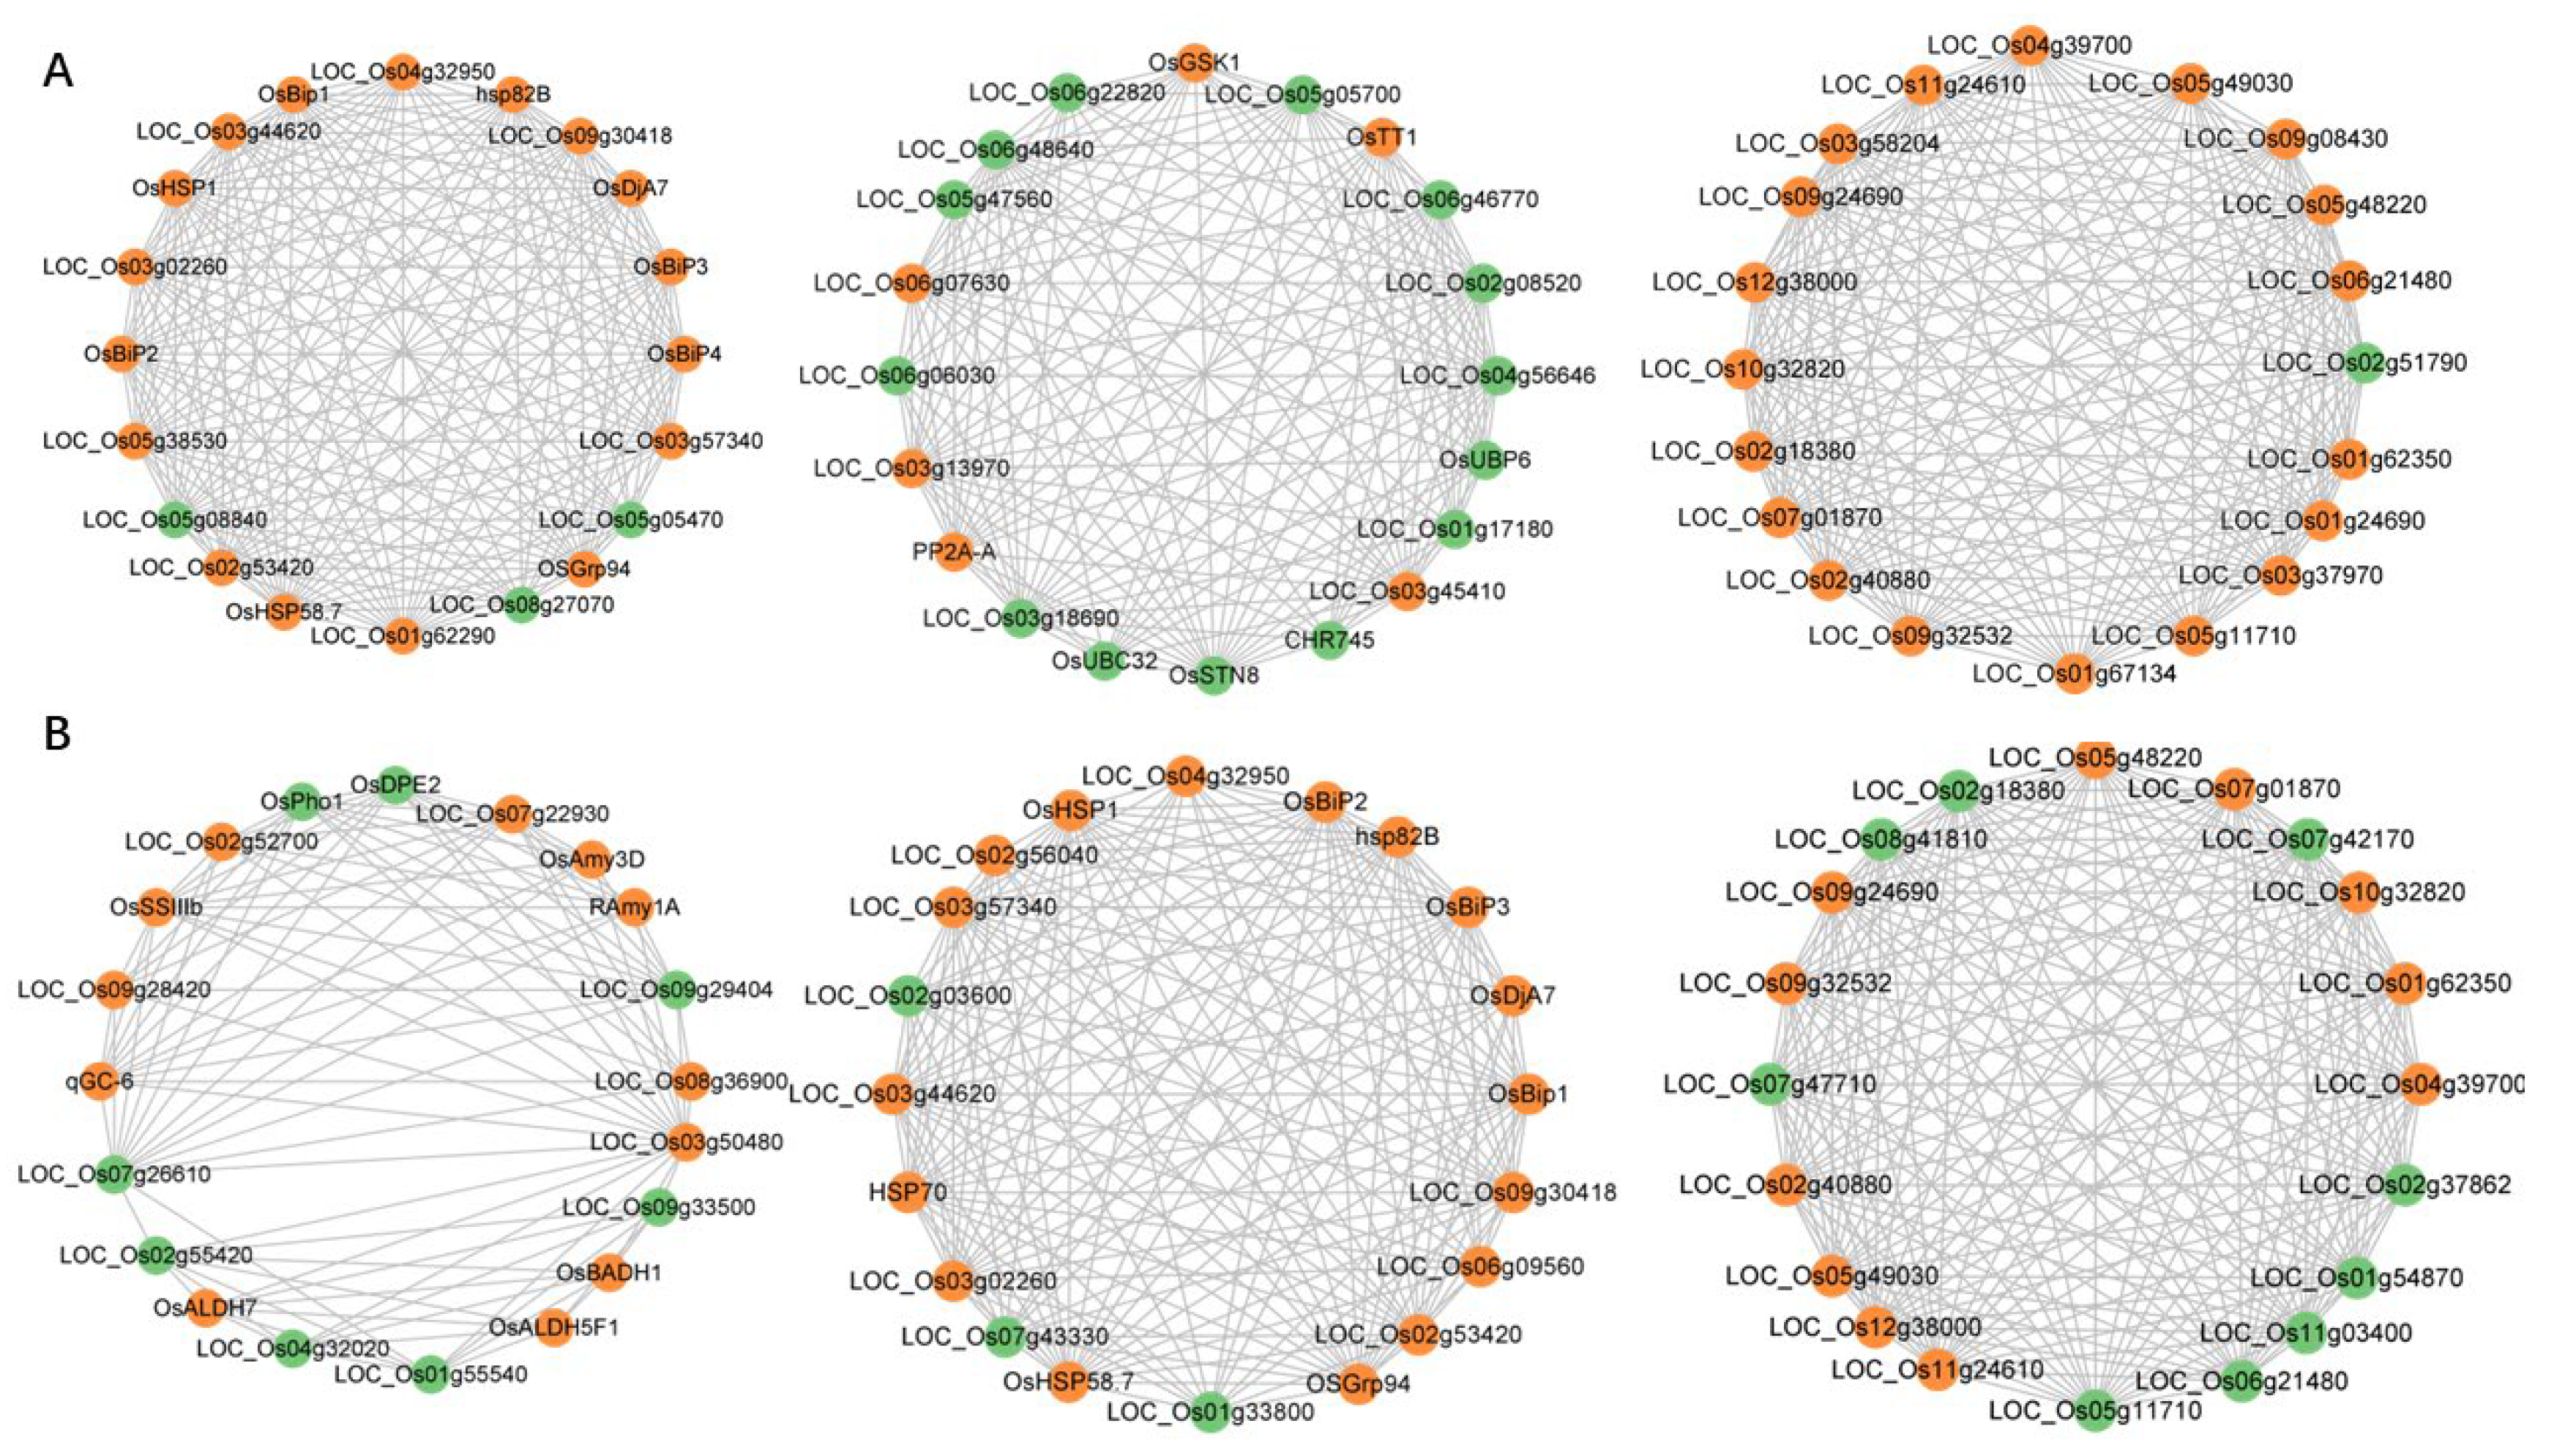
3.5. Candidate–Hub Gene Analysis of IR64 and Koshihikari
4. Discussion
5. Conclusions
Supplementary Materials
Author Contributions
Funding
Institutional Review Board Statement
Informed Consent Statement
Data Availability Statement
Conflicts of Interest
References
- Deutsch, C.A.; Tewksbury, J.J.; Tigchelaar, M.; Battisti, D.S.; Merrill, S.C.; Huey, R.B.; Naylor, R.L. Increase in crop losses to insect pests in a warming climate. Science 2018, 361, 916–919. [Google Scholar] [CrossRef] [Green Version]
- Khan, S.; Anwar, S.; Ashraf, M.Y.; Khaliq, B.; Sun, M.; Hussain, S.; Gao, Z.Q.; Noor, H.; Alam, S. Mechanisms and adaptation strategies to improve heat tolerance in rice. Plants 2019, 8, 508. [Google Scholar] [CrossRef] [Green Version]
- Essemine, J.; Ammar, S.; Bouzid, S. Impact of heat stress on germination and growth in higher plants: Physiological, biochemical and molecular repercussions and mechanisms of defence. J. Biol. Sci. 2010, 10, 565–572. [Google Scholar] [CrossRef] [Green Version]
- Sita, K.; Sehgal, A.; HanumanthaRao, B.; Nair, R.M.; Prasad, P.V.V.; Kumar, S.; Gaur, P.M.; Farooq, M.; Siddique, K.H.M.; Varshney, R.K.; et al. Food legumes and rising temperatures: Effects, adaptive functional mechanisms specific to reproductive growth stage and strategies to improve heat tolerance. Front. Plant Sci. 2017, 8, 1658. [Google Scholar] [CrossRef] [PubMed] [Green Version]
- Xu, Y.F.; Chu, C.C.; Yao, S.G. The impact of high–temperature stress on rice: Challenges and solutions. Crop J. 2021, 9, 963–976. [Google Scholar] [CrossRef]
- Wu, H.C.; Bulgakov, V.P.; Jinn, T.L. Pectin methylesterases: Cell wall remodeling proteins are required for plant response to heat stress. Front. Plant Sci. 2018, 9, 1612. [Google Scholar] [CrossRef] [Green Version]
- Sewelam, N.; Kazan, K.; Schenk, P.M. Global plant stress signaling: Reactive oxygen species at the cross–road. Front. Plant Sci. 2016, 7, 187. [Google Scholar] [CrossRef] [Green Version]
- Yun, Y.C.; Hua, D.; Li, N.Y.; Zhi, Q.W.; Shao, C.Z.; Jian, C.Y. Effect of heat stress during meiosis on grain yield of rice cultivars differing in heat tolerance and its physiological mechanism. Acta Agron. Sin. 2008, 34, 2134–2142. [Google Scholar]
- Zeng, B.P.; Kang, K.; Wang, H.J.; Pan, B.Y.; Xu, C.D.; Tang, B.; Zhang, D.W. Effect of glycogen synthase and glycogen phosphorylase knockdown on the expression of glycogen– and insulin–related genes in the rice brown planthopper Nilaparvata lugens. Comp. Biochem. Physiol. Part D Genom. Proteom. 2020, 33, 100652. [Google Scholar] [CrossRef] [PubMed]
- Zhang, W.L.; Yan, C.Q.; Li, M.; Yang, L.; Ma, B.J.; Meng, H.Y.; Xie, L.; Chen, J.P. Transcriptome analysis reveals the response of iron homeostasis to early feeding by small brown planthopper in rice. J. Agric. Food Chem. 2017, 65, 1093–1101. [Google Scholar] [CrossRef]
- Kircher, M.; Kelso, J. High-throughput DNA sequencing–concepts and limitations. Bioessays 2010, 32, 524–536. [Google Scholar] [CrossRef] [PubMed]
- Chen, G.; Ning, B.; Shi, T. Single–cell RNA–seq technologies and related computational data analysis. Front. Genet. 2019, 10, 317. [Google Scholar] [CrossRef]
- Bharti, K.K.; Singh, P.K. Hybrid dimension reduction by integrating feature selection with feature extraction method for text clustering. Expert Syst. Appl. 2015, 42, 3105–3114. [Google Scholar] [CrossRef]
- Perkins, A.D.; Langston, M.A. Threshold selection in gene co–expression networks using spectral graph theory techniques. BMC Bioinform. 2009, 10, S4. [Google Scholar] [CrossRef] [PubMed] [Green Version]
- Wang, Z.Q.; Yang, C.L.; Chen, H.; Wang, P.; Wang, P.T.; Song, C.P.; Zhang, X.; Wang, D.J. Multi–gene co–expression can improve comprehensive resistance to multiple abiotic stresses in Brassica napus L. Plant Sci. 2018, 274, 410–419. [Google Scholar] [CrossRef] [PubMed]
- Contreras-López, O.; Moyano, T.C.; Soto, D.C.; Gutiérrez, R.A. Step-by-step construction of gene co–expression networks from high–throughput Arabidopsis RNA sequencing data. Root Dev. 2018, 1761, 275–301. [Google Scholar]
- Wang, J.X.; Zhang, X.T.; Shi, M.L.; Gao, L.J.; Niu, X.F.; Te, R.G.; Chen, L.; Zhang, W.W. Metabolomic analysis of the salt–sensitive mutants reveals changes in amino acid and fatty acid composition important to long–term salt stress in Synechocystis sp. PCC 6803. Funct. Integr. Genom. 2014, 14, 431–440. [Google Scholar] [CrossRef]
- Zhang, B.; Horvath, S. A general framework for weighted gene co–expression network analysis. Stat. Appl. Genet. Mol. Biol. 2005, 4, 17. [Google Scholar] [CrossRef] [PubMed]
- Ackermann, M.; Strimmer, K. A general modular framework for gene set enrichment analysis. BMC Bioinform. 2009, 10, 47. [Google Scholar] [CrossRef] [Green Version]
- Xiong, Q.; Ancona, N.; Hauser, E.R.; Mukherjee, S.; Furey, T.S. Integrating genetic and gene expression evidence into genome–wide association analysis of gene sets. Genome Res. 2012, 22, 386–397. [Google Scholar] [CrossRef] [PubMed] [Green Version]
- Jafarzadegan, M.; Safi-Esfahani, F.; Beheshti, Z. Combining hierarchical clustering approaches using the PCA method. Expert Syst. Appl. 2019, 137, 1–10. [Google Scholar] [CrossRef]
- Ruan, J.H.; Dean, A.K.; Zhang, W.X. A general co–expression network–based approach to gene expression analysis: Comparison and applications. BMC Syst. Biol. 2010, 4, 8. [Google Scholar] [CrossRef] [Green Version]
- Langfelder, P.; Horvath, S. WGCNA: An R package for weighted correlation network analysis. BMC Bioinform. 2008, 9, 559. [Google Scholar] [CrossRef] [Green Version]
- Chauhan, B.S.; Mahajan, G.; Sardana, V.; Timsina, J.; Jat, M.L. Productivity and sustainability of the rice–wheat cropping system in the Indo–Gangetic Plains of the Indian subcontinent: Problems, opportunities, and strategies. Adv. Agron. 2012, 117, 315–369. [Google Scholar]
- Asibi, A.E.; Chai, Q.; Coulter, J.A. Rice blast: A disease with implications for global food security. Agronomy 2019, 9, 451. [Google Scholar] [CrossRef] [Green Version]
- Ko, D.K.; Brandizzi, F. Network-based approaches for understanding gene regulation and function in plants. Plant J. 2020, 104, 302–317. [Google Scholar] [CrossRef]
- Lee, D.K.; Ahn, S.; Cho, H.Y.; Yun, H.Y.; Park, J.H.; Lim, J.; Lee, J.; Kwon, S.W. Metabolic response induced by parasitic plant–fungus interactions hinder amino sugar and nucleotide sugar metabolism in the host. Sci. Rep. 2016, 6, 37434. [Google Scholar] [CrossRef] [Green Version]
- Liu, X.Z.; Huang, B.R. Heat stress injury in relation to membrane lipid peroxidation in creeping bentgrass. Crop Sci. 2000, 40, 503–510. [Google Scholar] [CrossRef]
- Stobrawa, K.; Lorenc-Plucińska, G. Changes in carbohydrate metabolism in fine roots of the native European black poplar (Populus nigra L.) in a heavy–metal–polluted environment. Sci. Total Environ. 2007, 373, 157–165. [Google Scholar] [CrossRef]
- Sharma, K.D.; Patil, G.; Kiran, A. Characterization and differential expression of sucrose and starch metabolism genes in contrasting chickpea (Cicer arietinum L.) genotypes under low temperature. J. Genet. 2021, 100, 71. [Google Scholar] [CrossRef]
- Li, X.Y.; Wang, C.X.; Cheng, J.Y.; Zhang, J.; da Silva, J.A.T.; Liu, X.Y.; Duan, X.; Li, T.L.; Sun, H.M. Transcriptome analysis of carbohydrate metabolism during bulblet formation and development in Lilium davidii var. unicolor. BMC Plant Biol. 2014, 14, 358. [Google Scholar] [CrossRef] [PubMed] [Green Version]
- Zhang, C.H.; Shen, Z.J.; Zhang, Y.P.; Han, J.; Ma, R.J.; Korir, N.K.; Yu, M.L. Cloning and expression of genes related to the sucrose–metabolizing enzymes and carbohydrate changes in peach. Acta Physiol. Plant. 2013, 35, 589–602. [Google Scholar] [CrossRef]
- Silva, C.F.; Sartorelli, E.F.; Castilho, A.C.S.; Satrapa, R.A.; Puelker, R.Z.; Razza, E.M.; Ticianelli, J.S.; Eduardo, H.P.; Loureiro, B.; Barros, C.M. Effects of heat stress on development, quality and survival of Bos indicus and Bos taurus embryos produced in vitro. Theriogenology 2013, 79, 351–357. [Google Scholar] [CrossRef] [Green Version]
- Sharkey, T.D. Effects of moderate heat stress on photosynthesis: Importance of thylakoid reactions, Rubisco deactivation, reactive ox Koshihikarien species, and thermotolerance provided by isoprene. Plant Cell Environ. 2005, 28, 269–277. [Google Scholar] [CrossRef]
- Yan, K.; Chen, P.; Shao, H.; Zhang, L.; Xu, G. Effects of short–term high temperature on photosynthesis and photosystem II performance in sorghum. J. Agron. Crop Sci. 2011, 197, 400–408. [Google Scholar] [CrossRef]
- Ferreira, S.; Hjernø, K.; Larsen, M.; Wingsle, G.; Larsen, P.; Fey, S.; Roepstorff, P.; Salomé Pais, M. Proteome profiling of Populus euphratica Oliv. upon heat stress. Ann. Bot. 2006, 98, 361–377. [Google Scholar] [CrossRef] [PubMed] [Green Version]
- Akbarian, A.; Michiels, J.; Degroote, J.; Majdeddin, M.; Golian, A.; Smet, S.T. Association between heat stress and oxidative stress in poultry; mitochondrial dysfunction and dietary interventions with phytochemicals. J. Anim. Sci. Biotechnol. 2016, 7, 37. [Google Scholar] [CrossRef] [PubMed] [Green Version]
- Rossi, S.; Chapman, C.; Yuan, B.; Huang, B.R. Glutamate acts as a repressor for heat–induced leaf senescence involving chlorophyll degradation and amino acid metabolism in creeping bentgrass. Grass Res. 2021, 1, 4. [Google Scholar] [CrossRef]
- Baillo, E.H.; Kimotho, R.J.; Zhang, Z.B.; Xu, P. Transcription factors associated with abiotic and biotic stress tolerance and their potential for crops improvement. Genes 2019, 10, 771. [Google Scholar] [CrossRef] [Green Version]
- Gilad, Y.; Rifkin, S.A.; Pritchard, J.K. Revealing the architecture of gene regulation: The promise of eQTL studies. Trends Genet. 2008, 24, 408–415. [Google Scholar] [CrossRef] [Green Version]
- Zhang, L.N.; Zhang, L.C.; Xia, C.; Zhao, G.Y.; Liu, J.; Jia, J.Z.; Kong, X.Y. A novel wheat bZIP transcription factor, TabZIP60, confers multiple abiotic stress tolerances in transgenic Arabidopsis. Physiol. Plant 2015, 153, 538–554. [Google Scholar] [CrossRef]
- Cheng, Z.Y.; Luan, Y.T.; Meng, J.S.; Sun, J.; Tao, J.; Zhao, D.Q. WRKY transcription factor response to high–temperature stress. Plants 2021, 10, 2211. [Google Scholar] [CrossRef] [PubMed]
- Moin, M.; Bakshi, A.; Saha, A.; Dutta, M.; Madhav, S.M.; Kirti, P.B. Rice ribosomal protein large subunit genes and their spatio–temporal and stress regulation. Front. Plant Sci. 2016, 7, 1284. [Google Scholar] [CrossRef] [PubMed] [Green Version]
- Chen, X.H.; Lin, S.K.; Liu, Q.L.; Huang, J.; Zhang, W.F.; Lin, L.; Wang, Y.F.; Ke, Y.Q.; He, H.Q. Expression and interaction of small heat shock proteins (sHsps) in rice in response to heat stress. Biochim. Biophys. Acta Proteins Proteom. 2014, 1844, 818–828. [Google Scholar] [CrossRef] [PubMed]
- Voos, W. Chaperone–protease networks in mitochondrial protein homeostasis. Biochim. Biophys. Acta Mol. Cell Res. 2013, 1833, 388–399. [Google Scholar] [CrossRef] [Green Version]
- Zhang, X.W.; Rerksiri, W.; Liu, A.L.; Zhou, X.Y.; Xiong, H.R.; Xiang, J.H.; Chen, X.B.; Xiong, X.Y. Transcriptome profile reveals heat response mechanism at molecular and metabolic levels in rice flag leaf. Gene 2013, 530, 185–192. [Google Scholar] [CrossRef]
- Sarkar, N.K.; Kim, Y.K.; Grover, A. Rice sHsp genes: Genomic organization and expression profiling under stress and development. BMC Genom. 2009, 10, 393. [Google Scholar] [CrossRef] [Green Version]
- Chen, X.Q.; Wang, Z.Y.; Tang, R.; Wang, L.N.; Chen, C.H.; Ren, Z.H. Genome-wide identification and expression analysis of Hsf and Hsp gene families in cucumber (Cucumis sativus L.). Plant Growth Regul. 2021, 95, 223–239. [Google Scholar] [CrossRef]
- Liu, Y.H.; Li, J.J.; Zhu, Y.L.; Jones, A.; Rose, R.J.; Song, Y.H. Heat stress in legume seed setting: Effects, causes, and future prospects. Front. Plant Sci. 2019, 10, 938. [Google Scholar] [CrossRef] [Green Version]
- Guo, M.; Liu, J.H.; Ma, X.; Luo, D.X.; Gong, Z.H.; Lu, M.H. The plant heat stress transcription factors (HSFs): Structure, regulation, and function in response to abiotic stresses. Front. Plant Sci. 2016, 7, 114. [Google Scholar] [CrossRef] [Green Version]
- Yu, D.; Lim, J.; Wang, X.L.; Liang, F.M.; Xiao, G.H. Enhanced construction of gene regulatory networks using hub gene information. BMC Bioinform. 2017, 18, 186. [Google Scholar] [CrossRef] [Green Version]
- Yamamoto, T.; Mori, Y.; Ishibashi, T.; Uchiyama, Y.; Ueda, T.; Ando, T.; Hashimoto, J.; Kimura, S.; Sakaguchi, K. Interaction between proliferating cell nuclear antigen (PCNA) and a DnaJ induced by DNA damage. J. Plant Res. 2005, 118, 91–97. [Google Scholar] [CrossRef]
- Zhu, X.B.; Liang, S.H.; Yin, J.J.; Yuan, C.; Wang, J.; Li, W.T.; He, M.; Wang, J.C.; Chen, W.L.; Ma, B.T.; et al. The DnaJ OsDjA7/8 is essential for chloroplast development in rice (Oryza sativa). Gene 2015, 10, 11–19. [Google Scholar] [CrossRef]
- Zhong, X.H.; Yang, J.X.; Shi, Y.L.; Wang, X.L.; Wang, G.L. The DnaJ protein OsDjA6 negatively regulates rice innate immunity to the blast fungus Magnaporthe oryzae. Mol. Plant Pathol. 2018, 19, 607–614. [Google Scholar] [CrossRef] [PubMed] [Green Version]
- Wu, Y.H.; Luo, L.X.; Chen, L.K.; Tao, X.X.; Huang, M.; Wang, H.; Chen, Z.Q.; Xiao, W.M. Chromosome mapping, molecular cloning and expression analysis of a novel gene response for leaf width in rice. Biochem. Biophys. Res. Commun. 2016, 480, 394–401. [Google Scholar] [CrossRef] [PubMed]
- Thao, N.P.; Chen, L.; Nakashima, A.; Hara, S.I.; Umemura, K.; Takahashi, A.; Shirasu, K.; Kawasaki, T.; Shimamoto, K. RAR1 and HSP90 form a complex with Rac/Rop GTPase and function in innate–immune responses in rice. Plant Cell 2007, 19, 4035–4045. [Google Scholar] [CrossRef] [Green Version]
- Jacob, P.; Hirt, H.; Bendahmane, A. The heat-shock protein/chaperone network and multiple stress resistance. Plant Biotechnol. J. 2017, 15, 405–414. [Google Scholar] [CrossRef]
- Koh, S.; Lee, S.C.; Kim, M.K.; Koh, J.H.; Lee, S.; An, G.; Choe, S.; Kim, S.R. T–DNA tagged knockout mutation of rice OsGSK1, an orthologue of Arabidopsis BIN2, with enhanced tolerance to various abiotic stresses. Plant Mol. Biol. 2007, 65, 453–466. [Google Scholar] [CrossRef]
- Zhang, C.; Bai, M.Y.; Chong, K. Brassinosteroid–mediated regulation of agronomic traits in rice. Plant Cell Rep. 2014, 33, 683–696. [Google Scholar] [CrossRef] [PubMed]
- Li, X.M.; Chao, D.Y.; Wu, Y.; Huang, X.H.; Chen, K.; Cui, L.G.; Su, L.; Ye, W.W.; Chen, H.; Chen, H.C.; et al. Natural alleles of a proteasome α2 subunit gene contribute to thermotolerance and adaptation of African rice. Nat. Genet. 2015, 47, 827–833. [Google Scholar] [CrossRef]
- Kotchoni, S.O.; Bartels, D. Water stress induces the up–regulation of a specific set of genes in plants: Aldehyde dehydrogenase as an example. Bulg. J. Plant Physiol. Spec. 2003, 2003, 37–51. [Google Scholar]
- Mitsuya, S.; Yokota, Y.; Fujiwara, T.; Mori, N.; Takabe, T. OsBADH1 is possibly involved in acetaldehyde oxidation in rice plant peroxisomes. FEBS Lett. 2009, 583, 3625–3629. [Google Scholar] [CrossRef] [PubMed] [Green Version]
- Hasthanasombut, S.; Paisarnwipatpong, N.; Triwitayakorn, K.; Kirdmanee, C.; Supaibulwatana, K. Expression of OsBADH1 gene in Indica rice (Oryza sativa L.) in correlation with salt, plasmolysis, temperature and light stresses. Plant Omics J. 2011, 4, 400–407. [Google Scholar]
- Hasthanasombut, S.; Ntui, V.; Supaibulwatana, K.; Mii, M.; Nakamura, I. Expression of Indica rice OsBADH1 gene under salinity stress in transgenic tobacco. Plant Biotechnol. Rep. 2010, 4, 75–83. [Google Scholar] [CrossRef]
- Thompson, M.; Gamage, D.; Hirotsu, N.; Martin, A.; Seneweera, S. Effects of elevated carbon dioxide on photosynthesis and carbon partitioning: A perspective on root sugar sensing and hormonal crosstalk. Front. Physiol. 2017, 8, 578. [Google Scholar] [CrossRef] [Green Version]
- Pagare, S.; Bhatia, M.; Tripathi, N.; Pagare, S.; Bansal, Y.K. Secondary metabolites of plants and their role: Overview. Curr. Trends Biotechnol. Pharm. 2015, 9, 293–304. [Google Scholar]
- Yang, L.; Wen, K.S.; Ruan, X.; Zhao, Y.X.; Wei, F.; Wang, Q. Response of plant secondary metabolites to environmental factors. Molecules 2018, 23, 762. [Google Scholar] [CrossRef] [Green Version]
- Mahajan, M.; Kuiry, R.; Pal, P.K. Understanding the consequence of environmental stress for accumulation of secondary metabolites in medicinal and aromatic plants. J. Appl. Res. Med. Aromat. Plants 2020, 18, 100255. [Google Scholar] [CrossRef]
- Santos-Garcia, D.; Mestre-Rincon, N.; Zchori-Fein, E.; Morin, S. Inside out: Microbiota dynamics during host–plant adaptation of whiteflies. ISME J. 2020, 14, 847–856. [Google Scholar] [CrossRef] [PubMed] [Green Version]
- Massonnet, M.; Morales-Cruz, A.; Figueroa-Balderas, R.; Lawrence, D.P.; Baumgartner, K.; Cantu, D. Condition-dependent co-regulation of genomic clusters of virulence factors in the grapevine trunk pathogen Neofusicoccum parvum. Mol. Plant Pathol. 2018, 19, 21–34. [Google Scholar] [CrossRef] [Green Version]
- Ibrahim, M.F.M.; Faisal, A.; Shehata, S.A. Calcium chloride alleviates water stress in sunflower plants through modifying some physio-biochemical parameters. Am.–Eurasian J. Agric. Environ. Sci. 2016, 16, 677–693. [Google Scholar]


Publisher’s Note: MDPI stays neutral with regard to jurisdictional claims in published maps and institutional affiliations. |
© 2022 by the authors. Licensee MDPI, Basel, Switzerland. This article is an open access article distributed under the terms and conditions of the Creative Commons Attribution (CC BY) license (https://creativecommons.org/licenses/by/4.0/).
Share and Cite
Wang, Y.; Wang, Y.; Liu, X.; Zhou, J.; Deng, H.; Zhang, G.; Xiao, Y.; Tang, W. WGCNA Analysis Identifies the Hub Genes Related to Heat Stress in Seedling of Rice (Oryza sativa L.). Genes 2022, 13, 1020. https://doi.org/10.3390/genes13061020
Wang Y, Wang Y, Liu X, Zhou J, Deng H, Zhang G, Xiao Y, Tang W. WGCNA Analysis Identifies the Hub Genes Related to Heat Stress in Seedling of Rice (Oryza sativa L.). Genes. 2022; 13(6):1020. https://doi.org/10.3390/genes13061020
Chicago/Turabian StyleWang, Yubo, Yingfeng Wang, Xiong Liu, Jieqiang Zhou, Huabing Deng, Guilian Zhang, Yunhua Xiao, and Wenbang Tang. 2022. "WGCNA Analysis Identifies the Hub Genes Related to Heat Stress in Seedling of Rice (Oryza sativa L.)" Genes 13, no. 6: 1020. https://doi.org/10.3390/genes13061020