
Bisphenol A Exposure Changes the Transcriptomic and Proteomic Dynamics of Human Retinoblastoma Y79 Cells

 , , , and
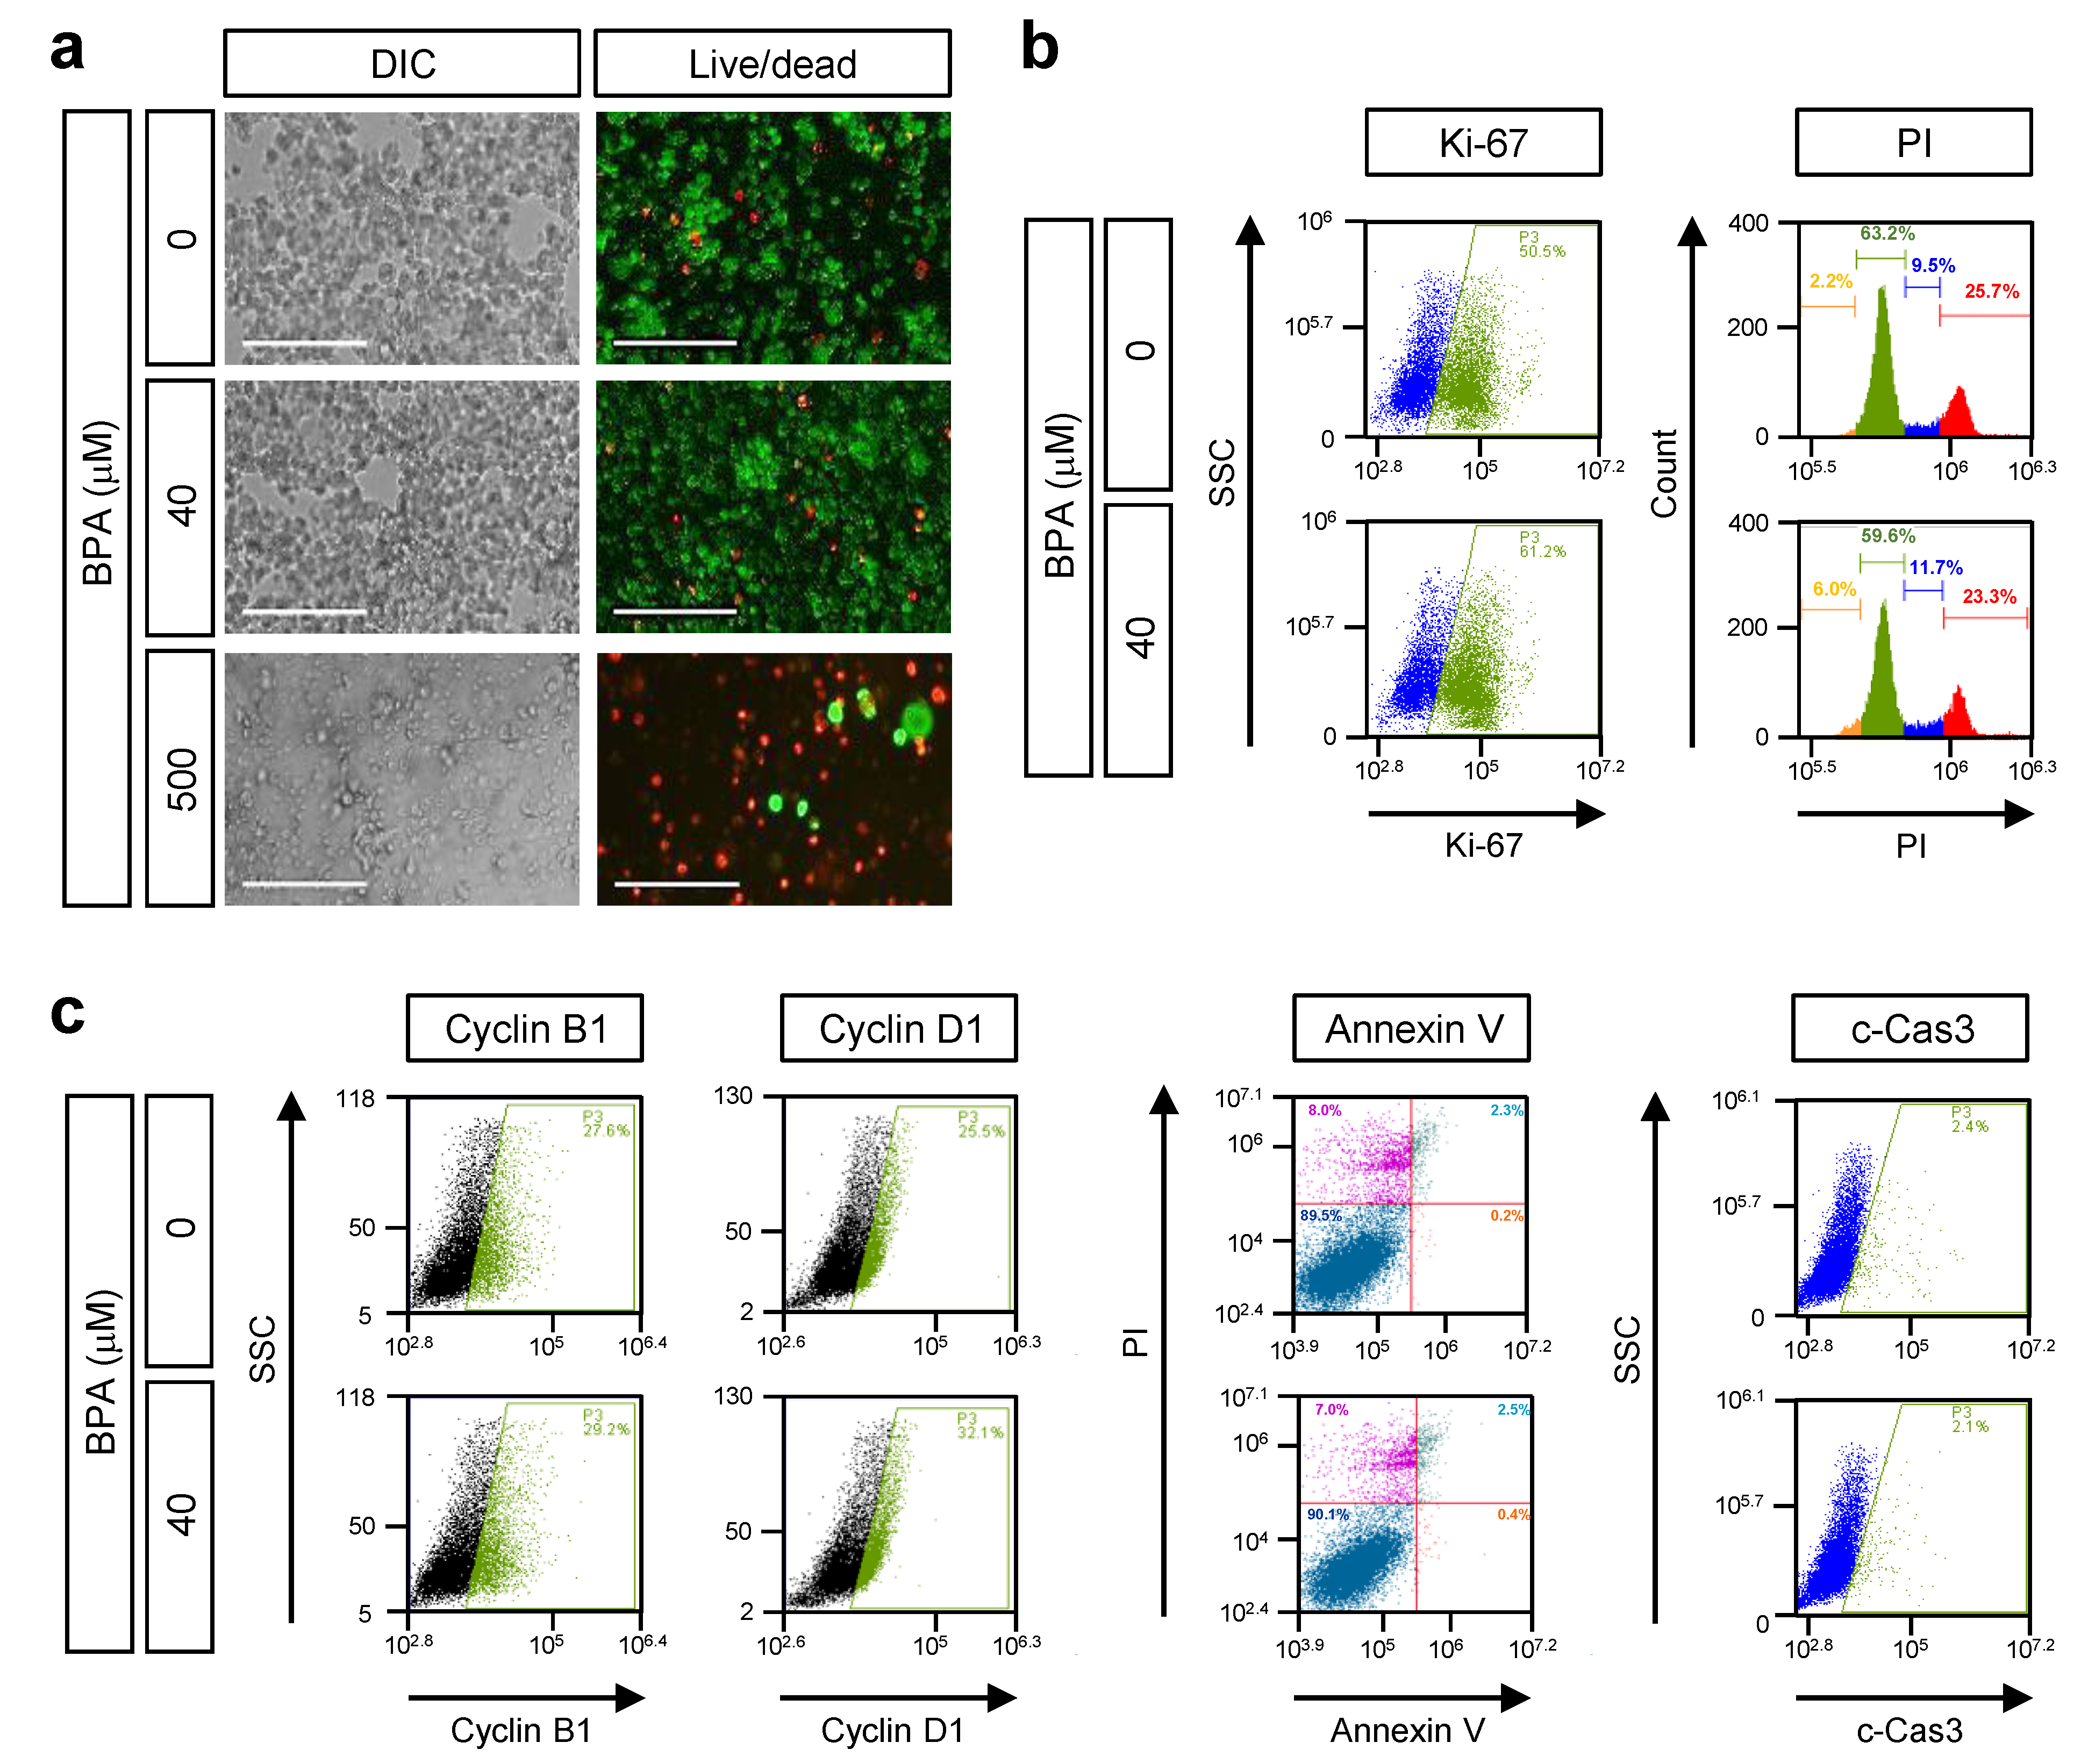
Abstract
:1. Introduction
2. Materials and Methods
2.1. Chemicals and Reagents
2.2. Cell Culture
2.3. Cell Viability Assay
2.4. Morphological Change and Live/Dead Cell Assay
2.5. Annexin V-FITC/Propidium Iodide (PI) Apoptosis Assay
2.6. Cell Cycle Analysis
2.7. Immuno-Staining and Flowcytometry Analysis
2.8. Total RNA Isolation and RNA-Sequencing
2.9. Bioinformatical Analysis
2.10. Protein Sample Preparation and 2-DE
2.11. MALDI-TOF-MS and Protein Quantification
2.12. Western Blot
2.13. Statistical ANALYSES
3. Results
3.1. The Effect of BPA on Cell Growth and Death in Human Retinoblastoma, Y79
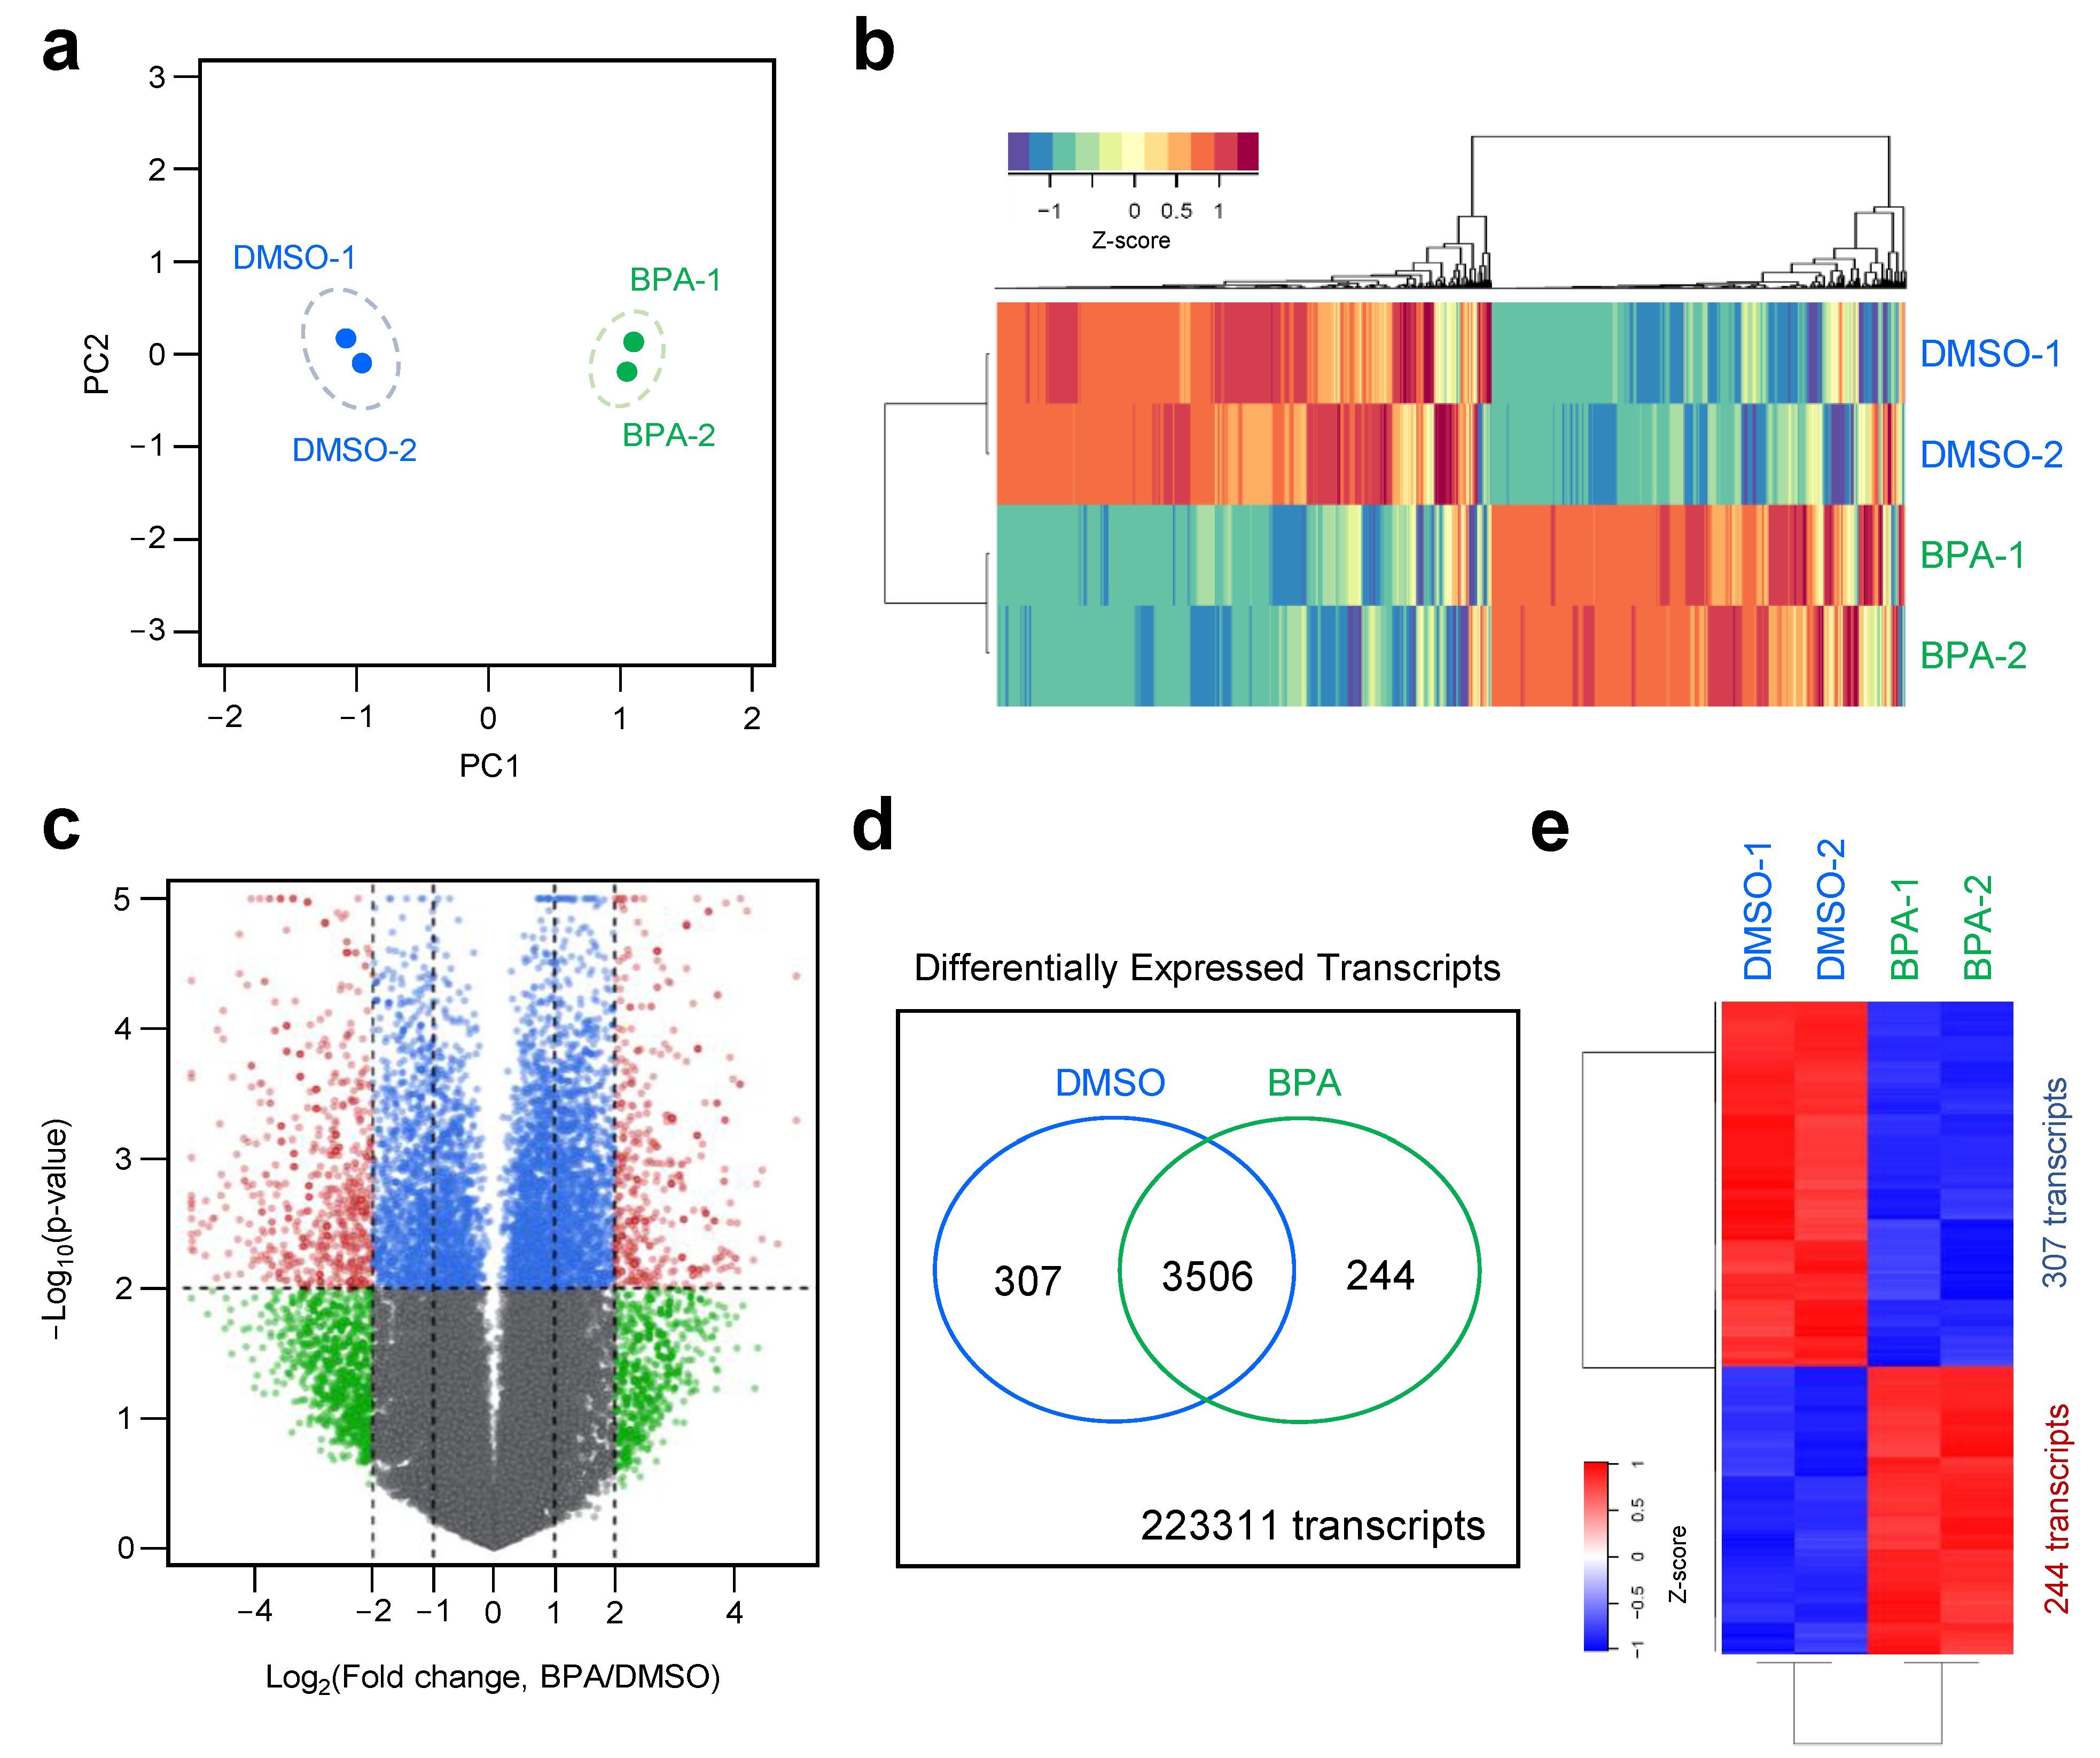
3.2. Dynamic Transcriptome Profiling of BPA-Treated Y79 Retinoblastoma Cell Line
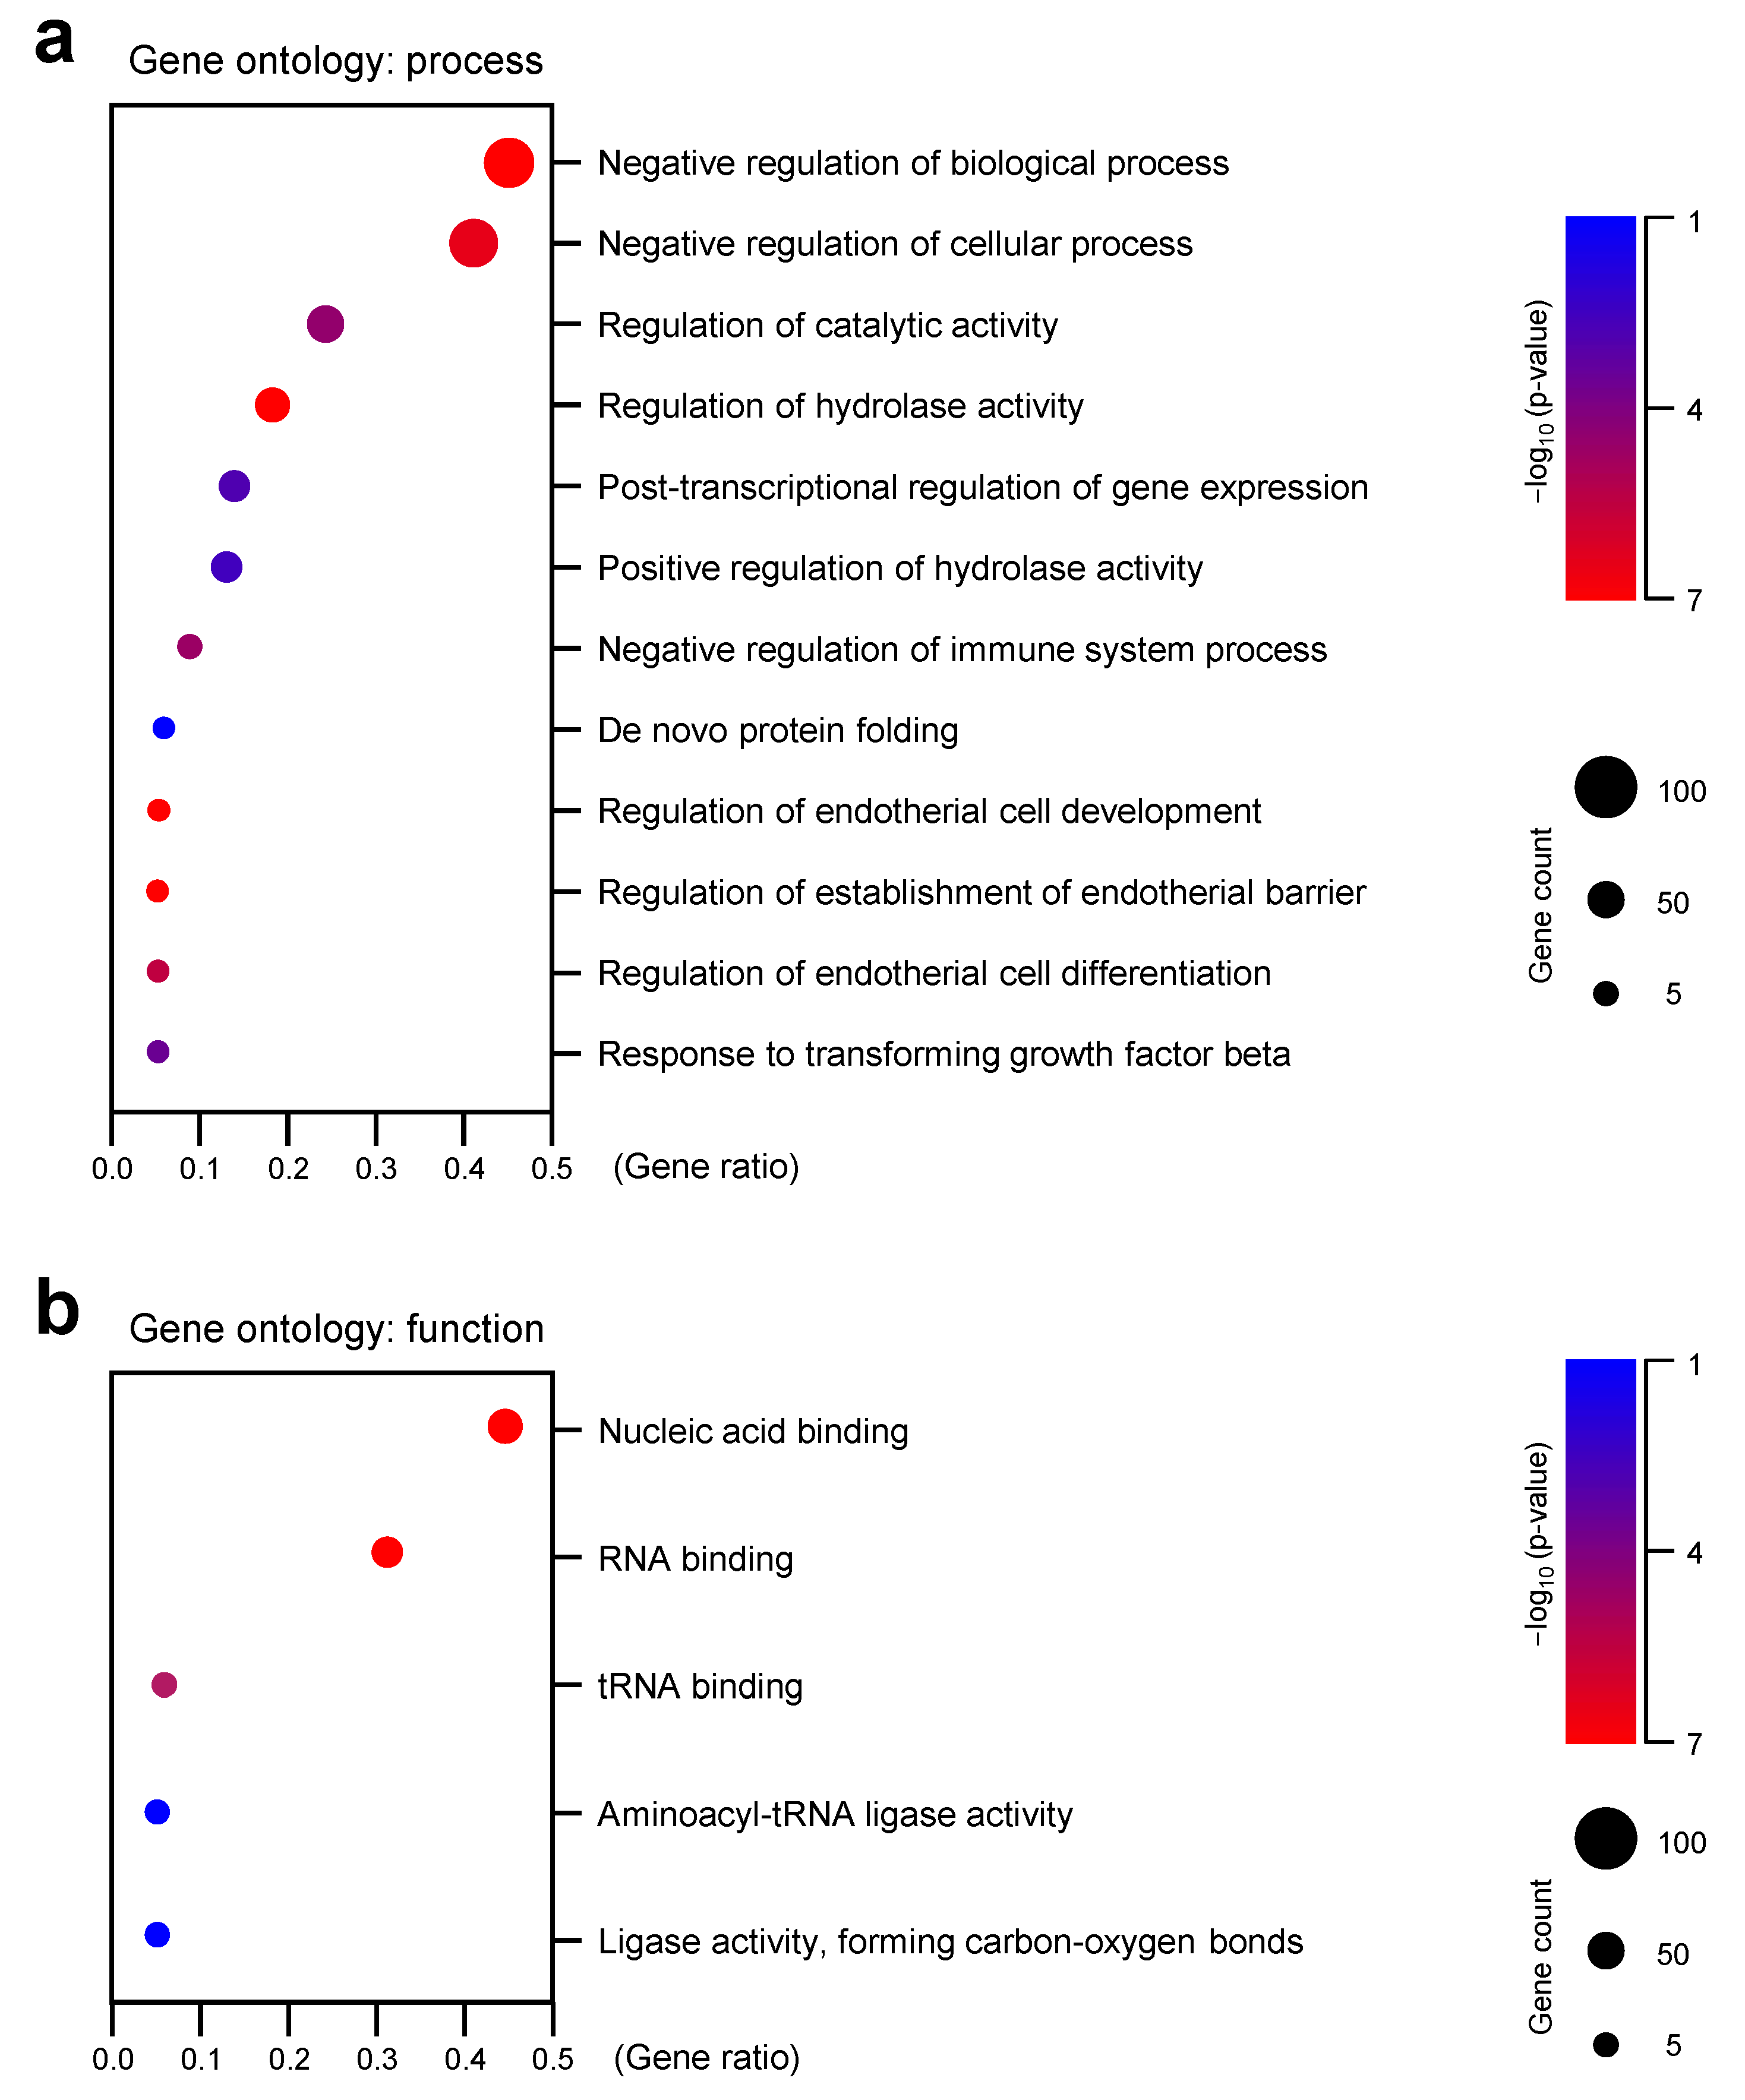
3.3. Gene Ontology (GO) Analysis Revealed That BPA Treatment Changed Gene Expression Sets Related with RNA Processing
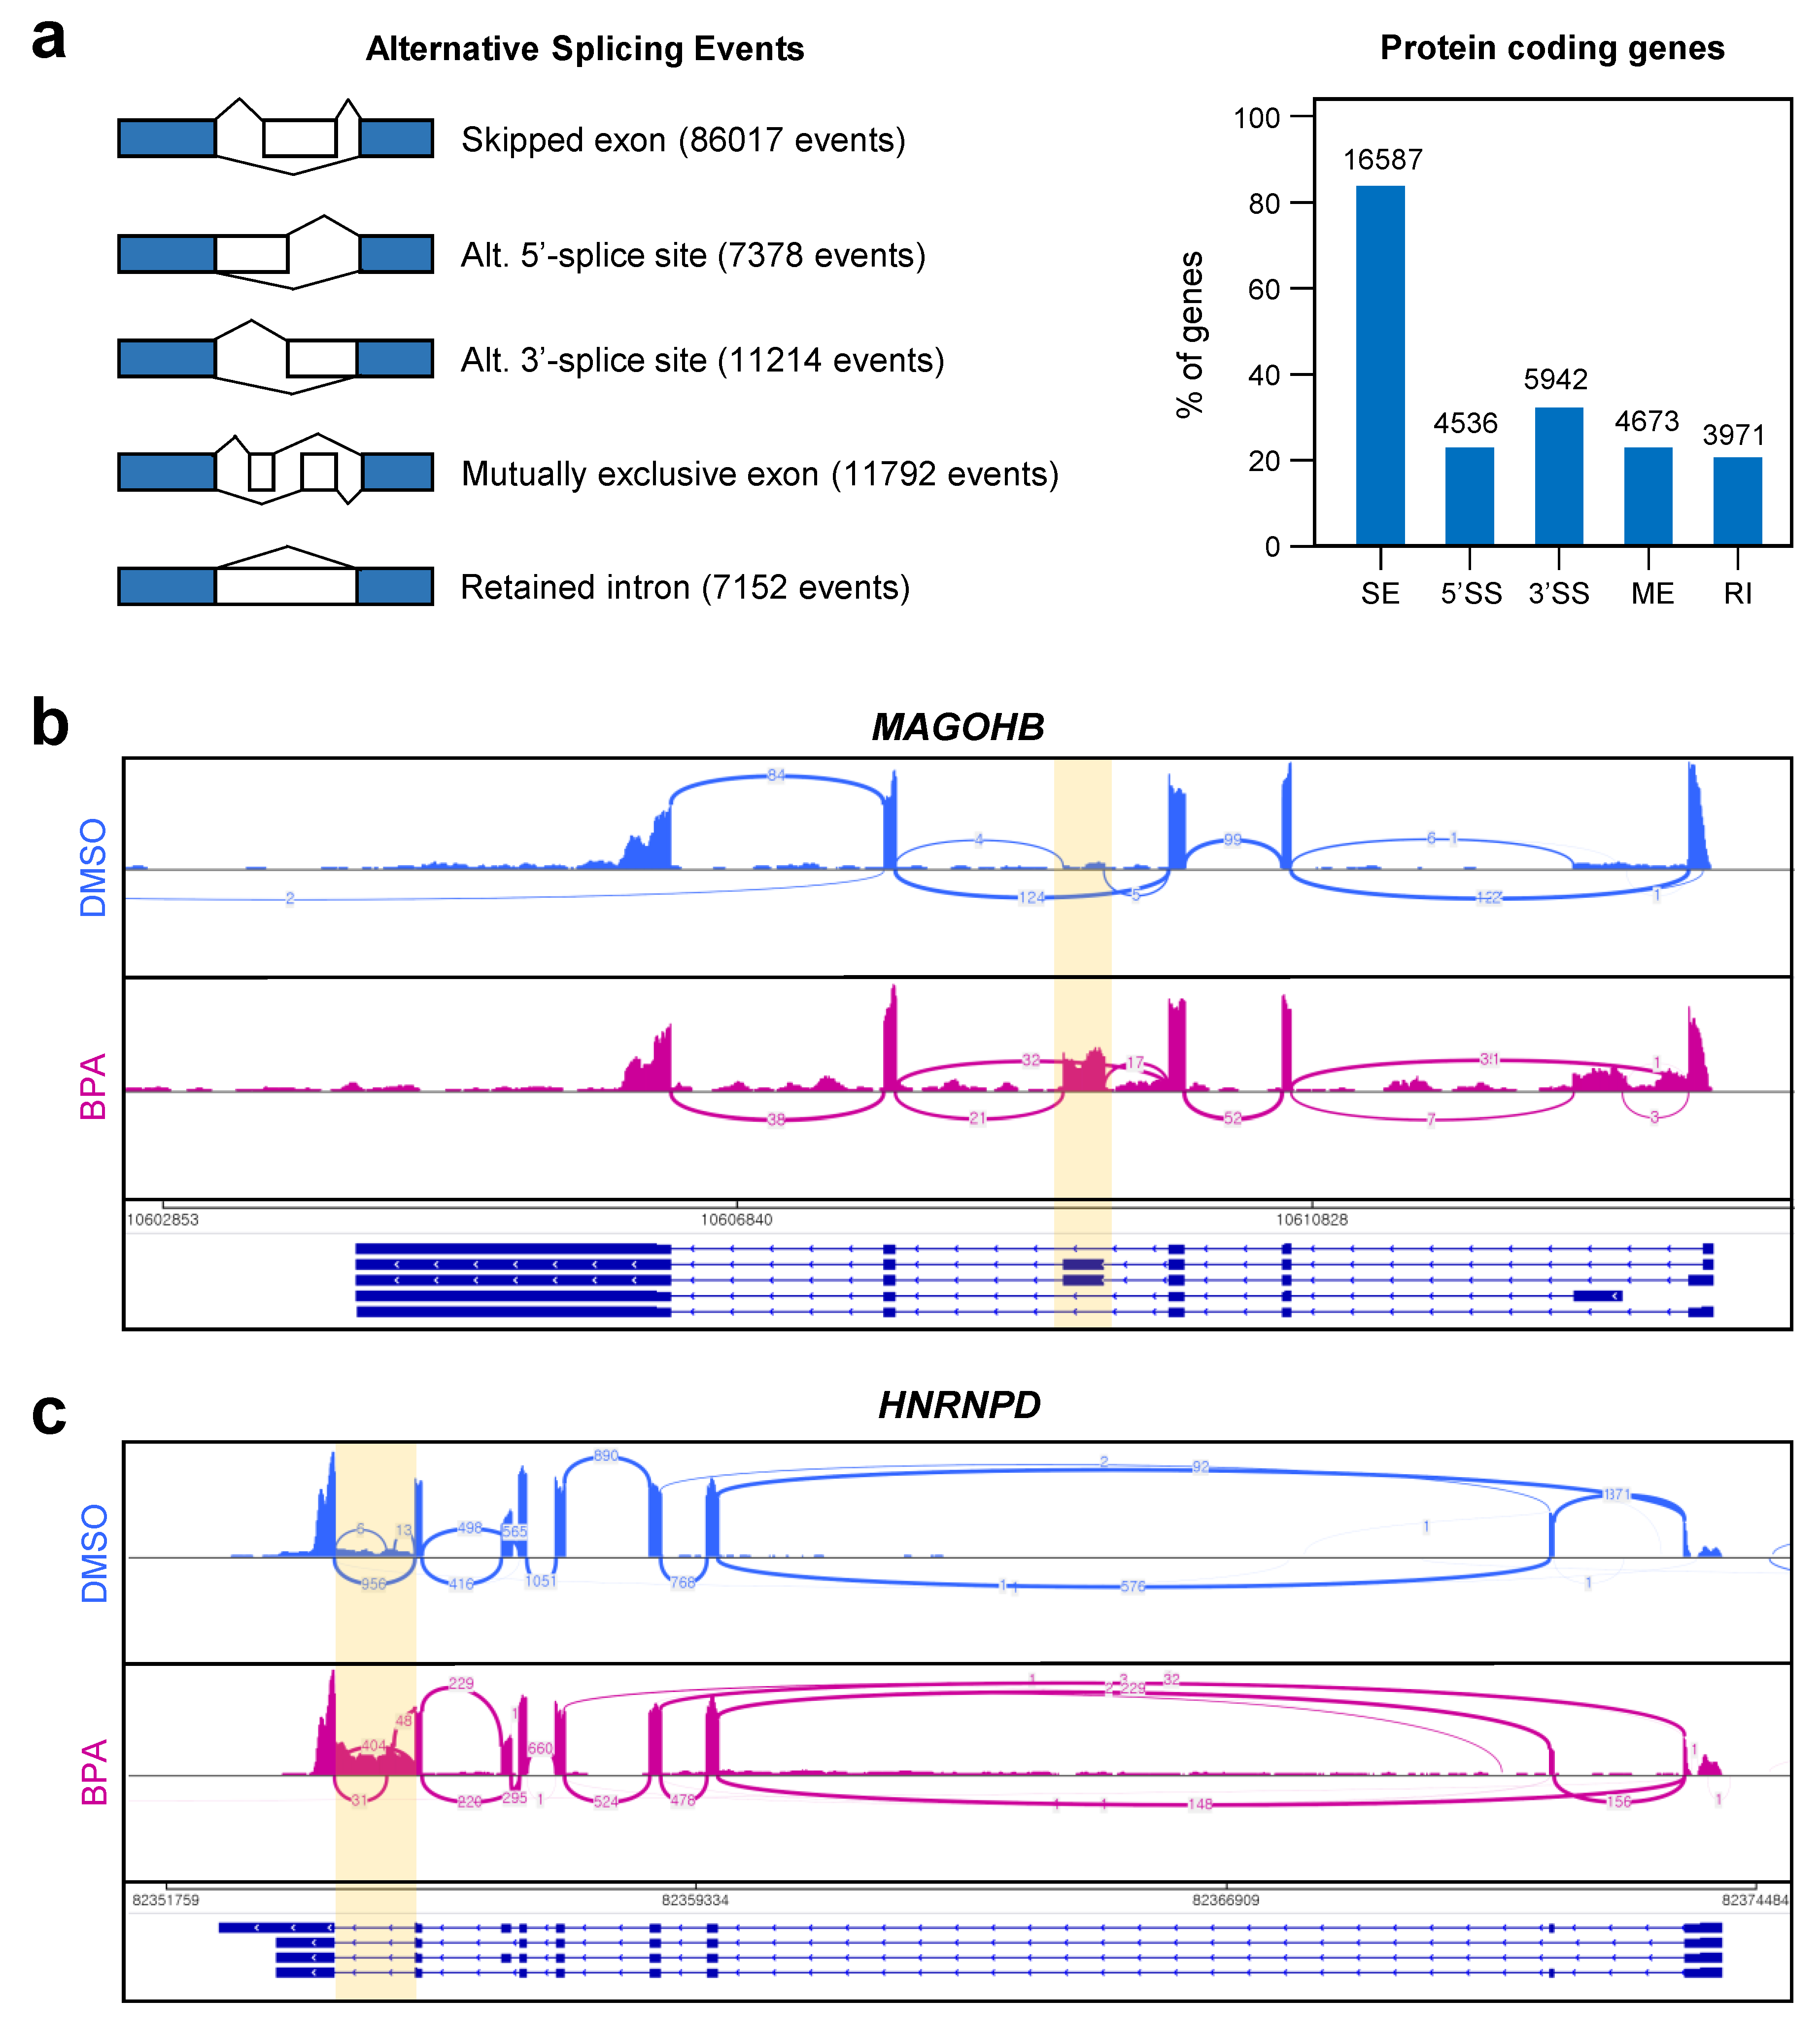
3.4. Abnormal Alternative Splicing Events Were Markedly Increased by BPA Treatment in Y79 Retinoblastoma Cells
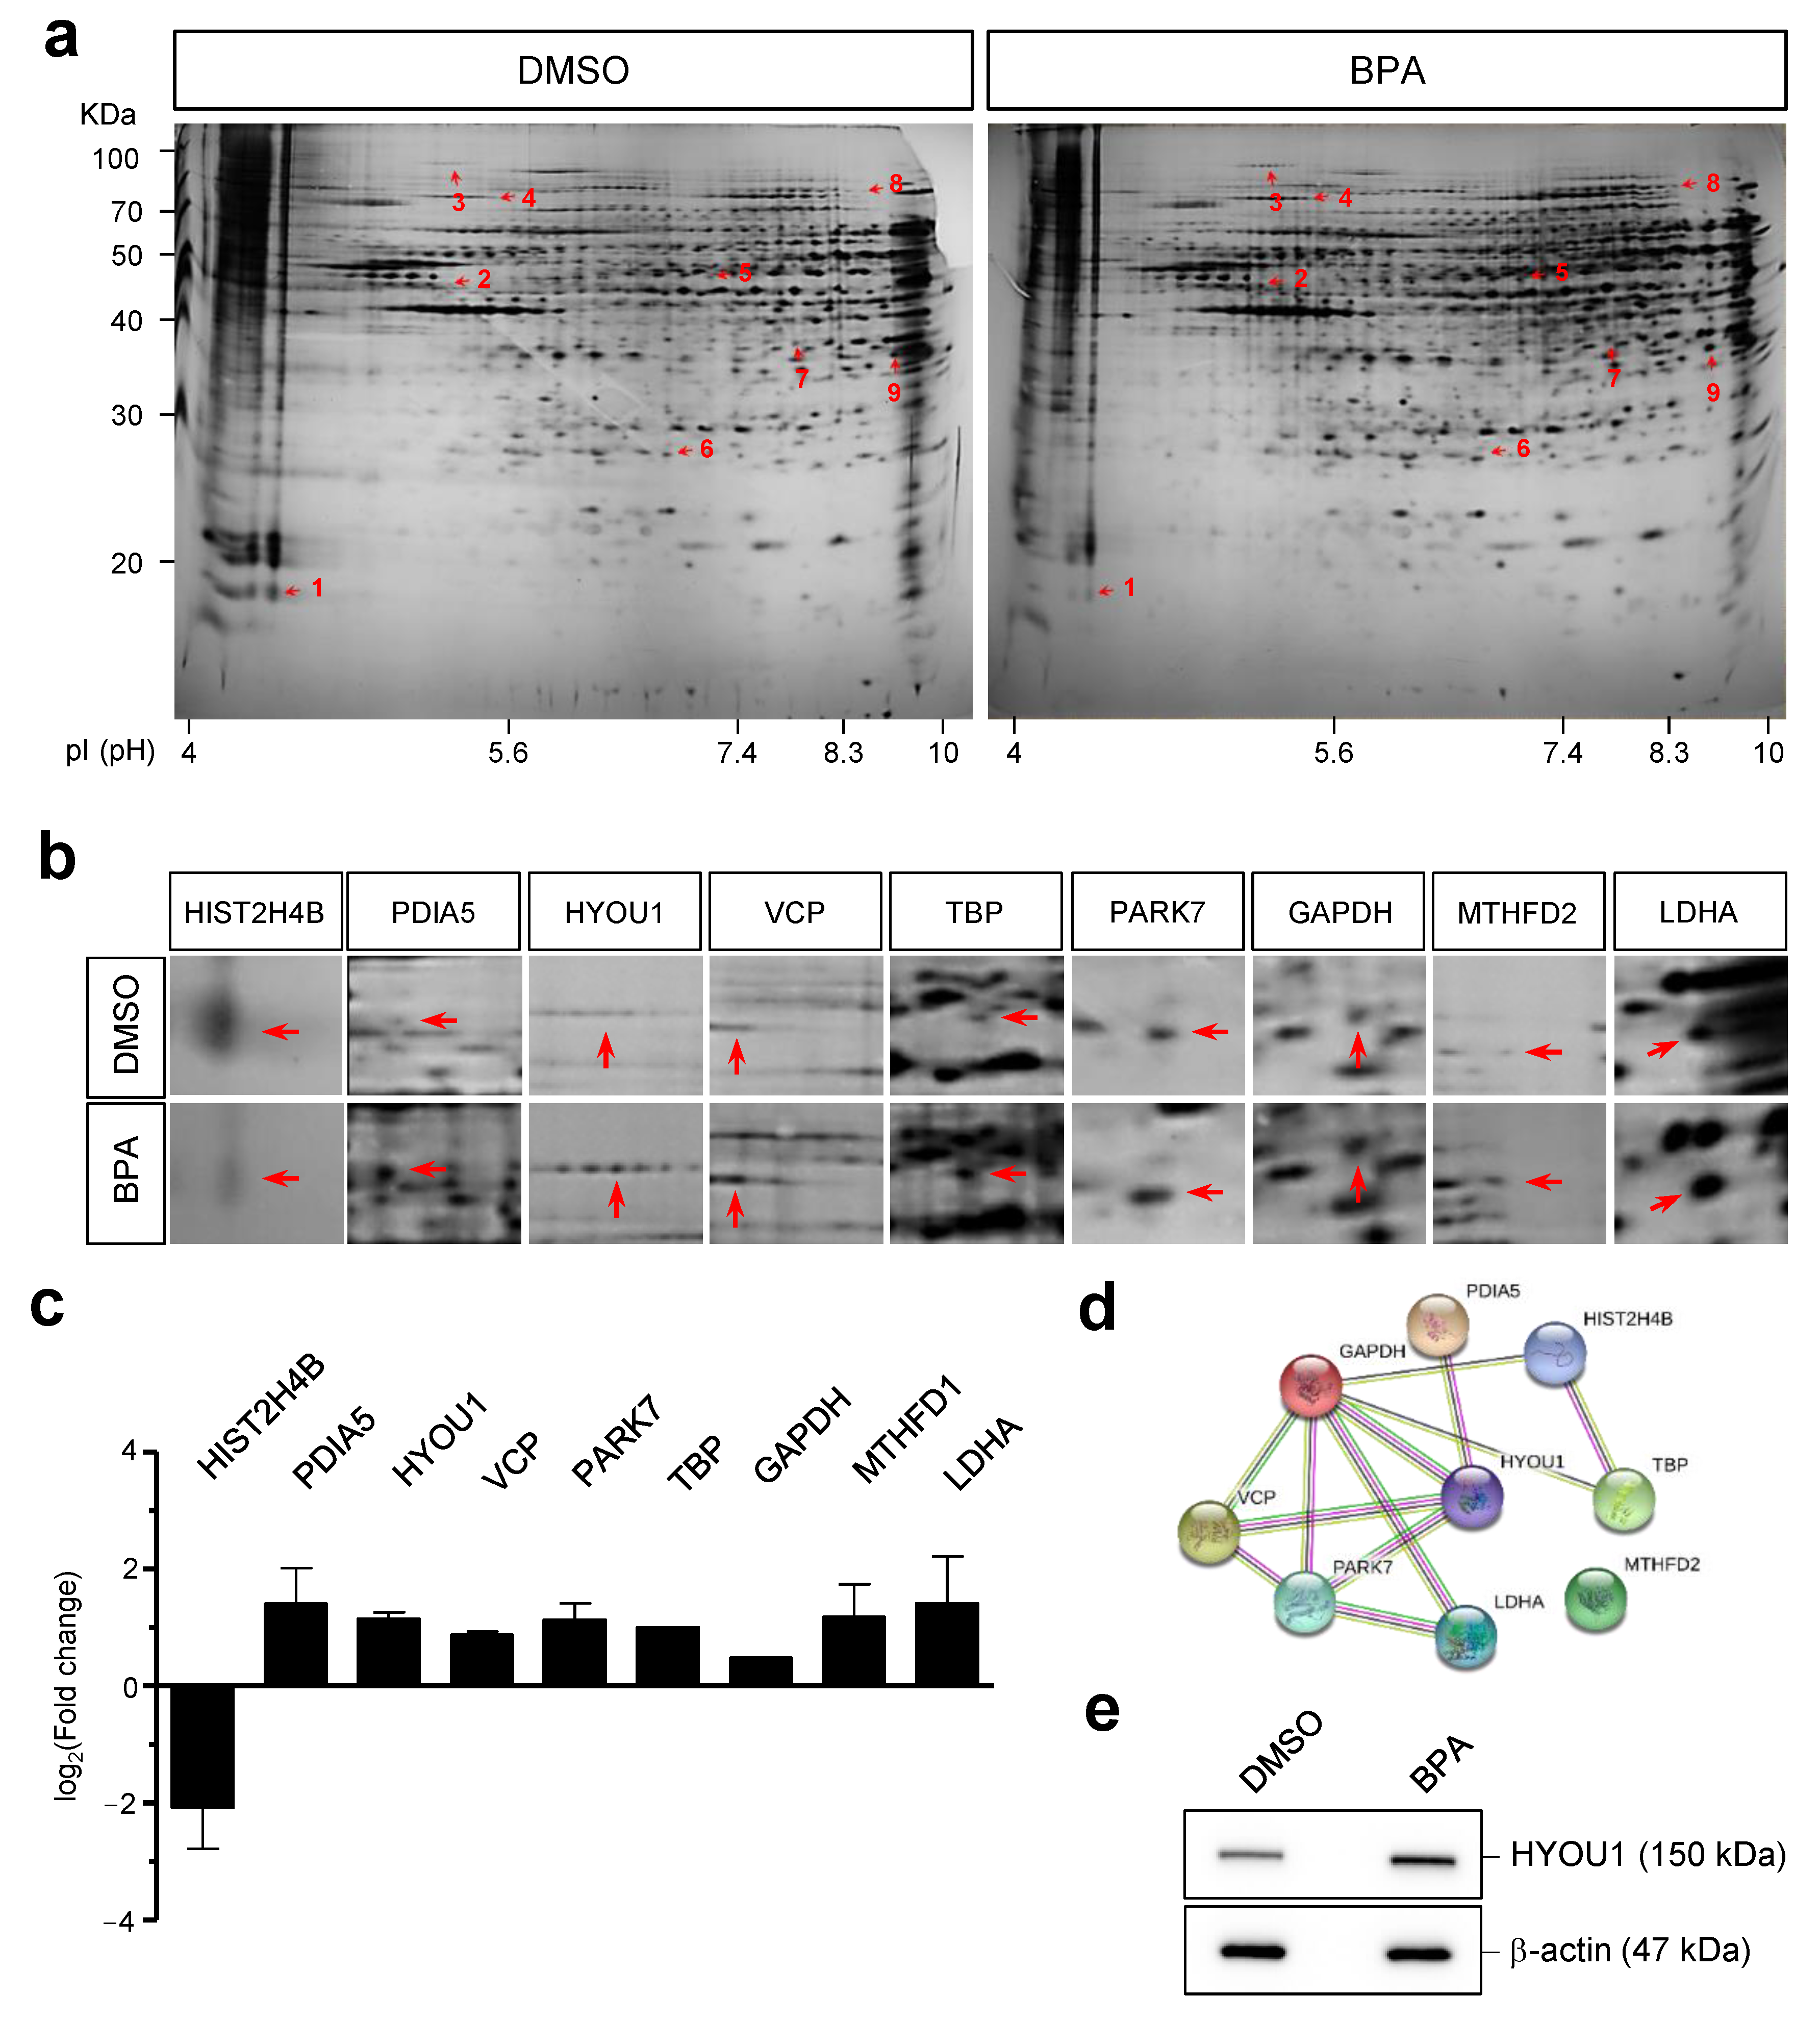
3.5. Adverse Effects of BPA Revealed by Proteomic Analysis in Y79 Retinoblastoma Cells
4. Discussion
5. Conclusions
Supplementary Materials
Author Contributions
Funding
Institutional Review Board Statement
Informed Consent Statement
Data Availability Statement
Conflicts of Interest
Abbreviations
| BPA | Bisphenol A |
| RNA-seq | RNA sequencing |
| MAGOHB | Mago Homolog B |
| HNRNPD | Heterogeneous Nuclear Ribonucleoprotein D |
| ABCF3 | ATP binding cassette subfamily F member 3 |
| HDAC1 | Histone Deacetylase 1 |
| RELA | RELA proto-oncogene |
| HNRNPM | Heterogeneous Nuclear Ribonucleoprotein M |
| FUS | Fused in sarcoma |
| RBM3 | RNA Binding Motif Protein 3 |
| PDIA5 | Protein Disulfide Isomerase Family A Member 5 |
| HYOU1 | Hypoxia Upregulated 1 |
| MTHFD2 | Methylenetetrahydrofolate Dehydrogenase (NADP+ Dependent) 2 |
| LDHA | Lactate Dehydrogenase A |
| TBP | TATA-Box Binding Protein |
| PARK7 | Parkinsonism-Associated Deglycase |
| GAPDH | Glyceraldehyde-3-Phosphate Dehydrogenase |
| VCP | Valosin Containing Protein |
| HIST2H4B | H4 Clustered Histone 15 |
| GO | Gene ontology |
References
- Vandenberg, L.N.; Chahoud, I.; Heindel, J.J.; Padmanabhan, V.; Paumgartten, F.J.; Schoenfelder, G. Urinary, circulating, and tissue biomonitoring studies indicate widespread exposure to bisphenol A. Environ. Health Perspect. 2010, 118, 1055–1070. [Google Scholar] [CrossRef] [Green Version]
- Wang, Z.Y.; Lu, J.; Zhang, Y.Z.; Zhang, M.; Liu, T.; Qu, X.L. Effect of Bisphenol A on invasion ability of human trophoblastic cell line BeWo. Int. J. Clin. Exp. Pathol. 2015, 8, 14355–14364. [Google Scholar] [PubMed]
- Mendonca, K.; Hauser, R.; Calafat, A.M.; Arbuckle, T.E.; Duty, S.M. Bisphenol A concentrations in maternal breast milk and infant urine. Int. Arch. Occup. Environ. Health 2014, 87, 13–20. [Google Scholar] [CrossRef]
- Ikezuki, Y.; Tsutsumi, O.; Takai, Y.; Kamei, Y.; Taketani, Y. Determination of bisphenol A concentrations in human biological fluids reveals significant early prenatal exposure. Hum. Reprod. 2002, 17, 2839–2841. [Google Scholar] [CrossRef] [PubMed] [Green Version]
- Diamanti-Kandarakis, E.; Bourguignon, J.P.; Giudice, L.C.; Hauser, R.; Prins, G.S.; Soto, A.M.; Zoeller, R.T.; Gore, A.C. Endocrine-disrupting chemicals: An Endocrine Society scientific statement. Endocr. Rev. 2009, 30, 293–342. [Google Scholar] [CrossRef]
- Ehrlich, S.; Williams, P.L.; Missmer, S.A.; Flaws, J.A.; Berry, K.F.; Calafat, A.M.; Ye, X.; Petrozza, J.C.; Wright, D.; Hauser, R. Urinary bisphenol A concentrations and implantation failure among women undergoing in vitro fertilization. Environ. Health Perspect. 2012, 120, 978–983. [Google Scholar] [CrossRef] [Green Version]
- de Aguiar Greca, S.C.; Kyrou, I.; Pink, R.; Randeva, H.; Grammatopoulos, D.; Silva, E.; Karteris, E. Involvement of the Endocrine-Disrupting Chemical Bisphenol A (BPA) in Human Placentation. J. Clin. Med. 2020, 9, 405. [Google Scholar] [CrossRef] [PubMed] [Green Version]
- Kil, K.H.; Kim, M.R.; Kim, J.H.; Cho, H.H. Perinatal exposure to di-ethyl-hexyl phthalate via parenteral route induced polycystic ovarian syndrome-like genetic and pathologic changes in F1 offspring mice. Mol. Cell. Toxicol. 2019, 15, 19–30. [Google Scholar] [CrossRef]
- Rezg, R.; El-Fazaa, S.; Gharbi, N.; Mornagui, B. Bisphenol A and human chronic diseases: Current evidences, possible mechanisms, and future perspectives. Environ. Int. 2014, 64, 83–90. [Google Scholar] [CrossRef] [PubMed]
- Charisiadis, P.; Andrianou, X.D.; van der Meer, T.P.; den Dunnen, W.F.A.; Swaab, D.F.; Wolffenbuttel, B.H.R.; Makris, K.C.; van Vliet-Ostaptchouk, J.V. Possible Obesogenic Effects of Bisphenols Accumulation in the Human Brain. Sci. Rep. 2018, 8, 8186. [Google Scholar] [CrossRef] [Green Version]
- Khadrawy, Y.A.; Noor, N.A.; Mourad, I.M.; Ezz, H.S. Neurochemical impact of bisphenol A in the hippocampus and cortex of adult male albino rats. Toxicol. Ind. Health 2016, 32, 1711–1719. [Google Scholar] [CrossRef]
- Kundakovic, M.; Gudsnuk, K.; Franks, B.; Madrid, J.; Miller, R.L.; Perera, F.P.; Champagne, F.A. Sex-specific epigenetic disruption and behavioral changes following low-dose in utero bisphenol A exposure. Proc. Natl. Acad. Sci. USA 2013, 110, 9956–9961. [Google Scholar] [CrossRef] [PubMed] [Green Version]
- Rubin, B.S. Bisphenol A: An endocrine disruptor with widespread exposure and multiple effects. J. Steroid Biochem. Mol. Biol. 2011, 127, 27–34. [Google Scholar] [CrossRef]
- Lancet, WHO’s global air-quality guidelines. Lancet 2006, 368, 1302. [CrossRef]
- Torricelli, A.A.; Matsuda, M.; Novaes, P.; Braga, A.L.; Saldiva, P.H.; Alves, M.R.; Monteiro, M.L. Effects of ambient levels of traffic-derived air pollution on the ocular surface: Analysis of symptoms, conjunctival goblet cell count and mucin 5AC gene expression. Environ. Res. 2014, 131, 59–63. [Google Scholar] [CrossRef] [PubMed]
- Yang, Q.; Li, K.; Li, D.; Zhang, Y.; Liu, X.; Wu, K. Effects of fine particulate matter on the ocular surface: An in vitro and in vivo study. Biomed. Pharmacother. 2019, 117, 109177. [Google Scholar] [CrossRef]
- Keren, H.; Lev-Maor, G.; Ast, G. Alternative splicing and evolution: Diversification, exon definition and function. Nat. Rev. Genet. 2010, 11, 345–355. [Google Scholar] [CrossRef]
- Sveen, A.; Kilpinen, S.; Ruusulehto, A.; Lothe, R.A.; Skotheim, R.I. Aberrant RNA splicing in cancer; expression changes and driver mutations of splicing factor genes. Oncogene 2016, 35, 2413–2427. [Google Scholar] [CrossRef]
- Byun, J.A.; Heo, Y.; Kim, Y.O.; Pyo, M.Y. Bisphenol A-induced downregulation of murine macrophage activities in vitro and ex vivo. Environ. Toxicol. Pharmacol. 2005, 19, 19–24. [Google Scholar] [CrossRef]
- Gong, X.; Xie, H.; Li, X.; Wu, J.; Lin, Y. Bisphenol A induced apoptosis and transcriptome differences of spermatogonial stem cells in vitro. Acta Biochim. Biophys. Sin. (Shanghai) 2017, 49, 780–791. [Google Scholar] [CrossRef] [PubMed] [Green Version]
- Zhu, H.; Xiao, X.; Zheng, J.; Zheng, S.; Dong, K.; Yu, Y. Growth-promoting effect of bisphenol A on neuroblastoma in vitro and in vivo. J. Pediatr. Surg. 2009, 44, 672–680. [Google Scholar] [CrossRef]
- Vandenberg, L.N.; Maffini, M.V.; Sonnenschein, C.; Rubin, B.S.; Soto, A.M. Bisphenol-A and the great divide: A review of controversies in the field of endocrine disruption. Endocr. Rev. 2009, 30, 75–95. [Google Scholar] [CrossRef]
- Saxena, R.; Srivastava, S.; Trivedi, D.; Anand, E.; Joshi, S.; Gupta, S.K. Impact of environmental pollution on the eye. Acta Ophthalmol. Scand. 2003, 81, 491–494. [Google Scholar] [CrossRef]
- Gupta, P.D.M.A. Minor to Chronic Eye Disorders Due to Environmental Pollution. J. Ocul. Infect. Inflamm. 2018, 2, 1000108. [Google Scholar]
- Wang, E.; Aifantis, I. RNA Splicing and Cancer. Trends Cancer 2020, 6, 631–644. [Google Scholar] [CrossRef] [PubMed]
- Faustino, N.A.; Cooper, T.A. Pre-mRNA splicing and human disease. Genes Dev. 2003, 17, 419–437. [Google Scholar] [CrossRef] [PubMed] [Green Version]
- Kahles, A.; Lehmann, K.-V.; Toussaint, N.C.; Hüser, M.; Stark, S.G.; Sachsenberg, T.; Stegle, O.; Kohlbacher, O.; Sander, C.; Rätsch, G.; et al. Comprehensive Analysis of Alternative Splicing Across Tumors from 8705 Patients. Cancer Cell 2018, 34, 211–224.e6. [Google Scholar] [CrossRef] [PubMed] [Green Version]
- Nilsen, T.W. The spliceosome: The most complex macromolecular machine in the cell? Bioessays 2003, 25, 1147–1149. [Google Scholar] [CrossRef]
- Brady, L.K.; Wang, H.; Radens, C.M.; Bi, Y.; Radovich, M.; Maity, A.; Ivan, C.; Ivan, M.; Barash, Y.; Koumenis, C. Transcriptome analysis of hypoxic cancer cells uncovers intron retention in EIF2B5 as a mechanism to inhibit translation. PLoS Biol. 2017, 15, e2002623. [Google Scholar] [CrossRef]
- Cho, V.; Mei, Y.; Sanny, A.; Chan, S.; Enders, A.; Bertram, E.M.; Tan, A.; Goodnow, C.C.; Andrews, T.D. The RNA-binding protein hnRNPLL induces a T cell alternative splicing program delineated by differential intron retention in polyadenylated RNA. Genome Biol. 2014, 15, R26. [Google Scholar] [CrossRef] [Green Version]
- Wong, J.J.; Ritchie, W.; Ebner, O.A.; Selbach, M.; Wong, J.W.; Huang, Y.; Gao, D.; Pinello, N.; Gonzalez, M.; Baidya, K.; et al. Orchestrated intron retention regulates normal granulocyte differentiation. Cell 2013, 154, 583–595. [Google Scholar] [CrossRef] [PubMed] [Green Version]
- Braunschweig, U.; Barbosa-Morais, N.L.; Pan, Q.; Nachman, E.N.; Alipanahi, B.; Gonatopoulos-Pournatzis, T.; Frey, B.; Irimia, M.; Blencowe, B.J. Widespread intron retention in mammals functionally tunes transcriptomes. Genome Res. 2014, 24, 1774–1786. [Google Scholar] [CrossRef] [PubMed]
- Wong, J.J.; Au, A.Y.; Ritchie, W.; Rasko, J.E. Intron retention in mRNA: No longer nonsense: Known and putative roles of intron retention in normal and disease biology. Bioessays 2016, 38, 41–49. [Google Scholar] [CrossRef]
- Dvinge, H.; Bradley, R.K. Widespread intron retention diversifies most cancer transcriptomes. Genome Med. 2015, 7, 45. [Google Scholar] [CrossRef] [PubMed] [Green Version]
- Jung, H.; Lee, D.; Lee, J.; Park, D.; Kim, Y.J.; Park, W.Y.; Hong, D.; Park, P.J.; Lee, E. Intron retention is a widespread mechanism of tumor-suppressor inactivation. Nat. Genet. 2015, 47, 1242–1248. [Google Scholar] [CrossRef]
- Boehm, V.; Gehring, N.H. Exon Junction Complexes: Supervising the Gene Expression Assembly Line. Trends Genet. 2016, 32, 724–735. [Google Scholar] [CrossRef] [PubMed]
- Singh, K.K.; Wachsmuth, L.; Kulozik, A.E.; Gehring, N.H. Two mammalian MAGOH genes contribute to exon junction complex composition and nonsense-mediated decay. RNA Biol. 2013, 10, 1291–1298. [Google Scholar] [CrossRef] [Green Version]
- Stricker, T.P.; Brown, C.D.; Bandlamudi, C.; McNerney, M.; Kittler, R.; Montoya, V.; Peterson, A.; Grossman, R.; White, K.P. Robust stratification of breast cancer subtypes using differential patterns of transcript isoform expression. PLoS Genet. 2017, 13, e1006589. [Google Scholar] [CrossRef]
- Loflin, P.; Chen, C.Y.; Shyu, A.B. Unraveling a cytoplasmic role for hnRNP D in the in vivo mRNA destablization directed by the AU-rich element. Genes Dev. 1999, 13, 1884–1897. [Google Scholar] [CrossRef] [PubMed] [Green Version]
- Gouble, A.G.S.; Meggetto, F.; Mercier, P.; Delsol, G.; Morello, D. A New Player in Oncogenesis_ AUF1 hnRNPD Overexpression Leads to tumorogenesis in transgenic mice. Cancer Res. 2002, 62, 1489–1495. [Google Scholar]
- Hovhannisyan, R.H.; Carstens, R.P. Heterogeneous ribonucleoprotein m is a splicing regulatory protein that can enhance or silence splicing of alternatively spliced exons. J. Biol. Chem. 2007, 282, 36265–36274. [Google Scholar] [CrossRef] [Green Version]
- West, K.O.; Scott, H.M.; Torres-Odio, S.; West, A.P.; Patrick, K.L.; Watson, R.O. The Splicing Factor hnRNP M is a Critical Regulator of Innate Immune Gene Expression in Macrophages. Cell Rep. 2019, 29, 1594–1609.e5. [Google Scholar] [CrossRef]
- Courtney, S.C.; Di, H.; Stockman, B.M.; Liu, H.; Scherbik, S.V.; Brinton, M.A. Identification of novel host cell binding partners of Oas1b, the protein conferring resistance to flavivirus-induced disease in mice. J. Virol. 2012, 86, 7953–7963. [Google Scholar] [CrossRef] [PubMed] [Green Version]
- Lagger, G.; O’Carroll, D.; Rembold, M.; Khier, H.; Tischler, J.; Weitzer, G.; Schuettengruber, B.; Hauser, C.; Brunmeir, R.; Jenuwein, T.; et al. Essential function of histone deacetylase 1 in proliferation control and CDK inhibitor repression. EMBO J. 2002, 21, 2672–2681. [Google Scholar] [CrossRef] [PubMed] [Green Version]
- Hayden, M.S.; Ghosh, S. Shared principles in NF-kappaB signaling. Cell 2008, 132, 344–362. [Google Scholar] [CrossRef] [PubMed] [Green Version]
- Yamaguchi, A.; Takanashi, K. FUS interacts with nuclear matrix-associated protein SAFB1 as well as Matrin3 to regulate splicing and ligand-mediated transcription. Sci. Rep. 2016, 6, 35195. [Google Scholar] [CrossRef] [Green Version]
- Reber, S.; Stettler, J.; Filosa, G.; Colombo, M.; Jutzi, D.; Lenzken, S.C.; Schweingruber, C.; Bruggmann, R.; Bachi, A.; Barabino, S.M.; et al. Minor intron splicing is regulated by FUS and affected by ALS-associated FUS mutants. EMBO J. 2016, 35, 1504–1521. [Google Scholar] [CrossRef] [PubMed]
- Rappsilber, J.; Ryder, U.; Lamond, A.I.; Mann, M. Large-scale proteomic analysis of the human spliceosome. Genome Res. 2002, 12, 1231–1245. [Google Scholar] [CrossRef] [Green Version]
- Zhou, R.B.; Lu, X.L.; Zhang, C.Y.; Yin, D.C. RNA binding motif protein 3_ a potential biomarker in cancer and therapeutic target in neuroprotection. Oncotarget 2017, 8, 22235–22250. [Google Scholar] [CrossRef] [Green Version]
- Koh, E.J.; Hwang, S.Y. Multi-omics approaches for understanding environmental exposure and human health. Mol. Cell. Toxicol. 2019, 15, 1–7. [Google Scholar] [CrossRef]
- Kim, M.J.; Kim, C.H.; Seo, Y.J.; An, M.J.; Lee, J.H.; Shin, G.S.; Hwang, J.Y.; Park, J.; Kim, J.Y.; Hwang, S.Y.; et al. Transcriptome dynamics of alternative splicing events revealed early phase of apoptosis induced by methylparaben in H1299 human lung carcinoma cells. Arch. Toxicol. 2020, 94, 127–140. [Google Scholar] [CrossRef]
- Arrington, D.D.; Schnellmann, R.G. Targeting of the molecular chaperone oxygen-regulated protein 150 (ORP150) to mitochondria and its induction by cellular stress. Am. J. Physiol. Cell Physiol. 2008, 294, C641–C650. [Google Scholar] [CrossRef] [PubMed] [Green Version]
- Ozawa, K.K.K.; Tamatani, M.; Takatsuji, K.; Tsukamoto, Y.K.S.; Yanagi, H.; Stern, D.E.Y.; Tsujimoto, Y.O.S.; Tohyama, M. 150-kDa Oxygen-regulated Protein (ORP150) Suppresses Hypoxia-induced apoptotic cell death. J. Biol. Chem. 1999, 274, 6397–6404. [Google Scholar] [CrossRef] [PubMed] [Green Version]
- Yang, T.Y.; Wu, Y.J.; Chang, C.I.; Chiu, C.C.; Wu, M.L. The Effect of Bornyl cis-4-Hydroxycinnamate on Melanoma Cell Apoptosis Is Associated with Mitochondrial Dysfunction and Endoplasmic Reticulum Stress. Int. J. Mol. Sci. 2018, 19, 1370. [Google Scholar] [CrossRef] [PubMed] [Green Version]
- Matsushita, K.; Matsuyama, T.; Nishimura, H.; Takaoka, T.; Kuwabara, K.; Tsukamoto, Y.; Sugita, M.; Ogawa, S. Marked, sustained expression of a novel 150-kDa oxygen-regulated stress protein, in severely ischemic mouse neurons. Brain Res. Mol. Brain Res. 1998, 60, 98–106. [Google Scholar] [CrossRef]
- Miyagi, T.; Hori, O.; Koshida, K.; Egawa, M.; Kato, H.; Kitagawa, Y.; Ozawa, K.; Ogawa, S.; Namiki, M. Antitumor effect of reduction of 150-kDa oxygen-regulated protein expression on human prostate cancer cells. Int. J. Urol. 2002, 9, 577–585. [Google Scholar] [CrossRef]
- Kim, S.J.; Jin, J.; Kim, Y.J.; Kim, Y.; Yu, H.G. Retinal proteome analysis in a mouse model of oxygen-induced retinopathy. J. Proteome Res. 2012, 11, 5186–5203. [Google Scholar] [CrossRef]
- Beatty, S.; Koh, H.; Phil, M.; Henson, D.; Boulton, M. The role of oxidative stress in the pathogenesis of age-related macular degeneration. Surv. Ophthalmol. 2000, 45, 115–134. [Google Scholar] [CrossRef] [Green Version]
- Lin, Y.; Sun, X.; Qiu, L.; Wei, J.; Huang, Q.; Fang, C.; Ye, T.; Kang, M.; Shen, H.; Dong, S. Exposure to bisphenol A induces dysfunction of insulin secretion and apoptosis through the damage of mitochondria in rat insulinoma (INS-1) cells. Cell Death Dis. 2013, 4, e460. [Google Scholar] [CrossRef] [Green Version]
- Pontelli, R.C.N.; Souza, M.C.O.; Fantucci, M.Z.; de Andrade, M.; Rocha, E.M. The role of endocrine disruptors in ocular surface diseases. Med. Hypotheses 2019, 122, 157–164. [Google Scholar] [CrossRef]


Publisher’s Note: MDPI stays neutral with regard to jurisdictional claims in published maps and institutional affiliations. |
© 2021 by the authors. Licensee MDPI, Basel, Switzerland. This article is an open access article distributed under the terms and conditions of the Creative Commons Attribution (CC BY) license (http://creativecommons.org/licenses/by/4.0/).
Share and Cite
Kim, C.-H.; Kim, M.J.; Park, J.; Kim, J.; Kim, J.-Y.; An, M.-J.; Shin, G.-S.; Lee, H.-M.; Kim, J.-W. Bisphenol A Exposure Changes the Transcriptomic and Proteomic Dynamics of Human Retinoblastoma Y79 Cells. Genes 2021, 12, 264. https://doi.org/10.3390/genes12020264
Kim C-H, Kim MJ, Park J, Kim J, Kim J-Y, An M-J, Shin G-S, Lee H-M, Kim J-W. Bisphenol A Exposure Changes the Transcriptomic and Proteomic Dynamics of Human Retinoblastoma Y79 Cells. Genes. 2021; 12(2):264. https://doi.org/10.3390/genes12020264
Chicago/Turabian StyleKim, Chul-Hong, Mi Jin Kim, Jinhong Park, Jinho Kim, Ji-Young Kim, Mi-Jin An, Geun-Seup Shin, Hyun-Min Lee, and Jung-Woong Kim. 2021. "Bisphenol A Exposure Changes the Transcriptomic and Proteomic Dynamics of Human Retinoblastoma Y79 Cells" Genes 12, no. 2: 264. https://doi.org/10.3390/genes12020264