Unmasking Intra-Tumoral Heterogeneity and Clonal Evolution in NF1-MPNST

 ,
, 
Abstract
:1. Introduction
2. Materials and Methods
2.1. Study Approvals
2.2. Sample Collection
2.3. Histology
2.4. Sequencing and Bioinformatics Analysis
2.4.1. Library Construction and Sequencing
2.4.2. IDT Exome Sequencing Variant Detection
2.4.3. Copy Number Analysis
2.4.4. Inference of Clonal Phylogeny
2.4.5. RNA Sequence Preprocessing
2.4.6. Gene Differential Expression Analysis
2.4.7. Pathway Analysis
3. Results
3.1. Patient Information
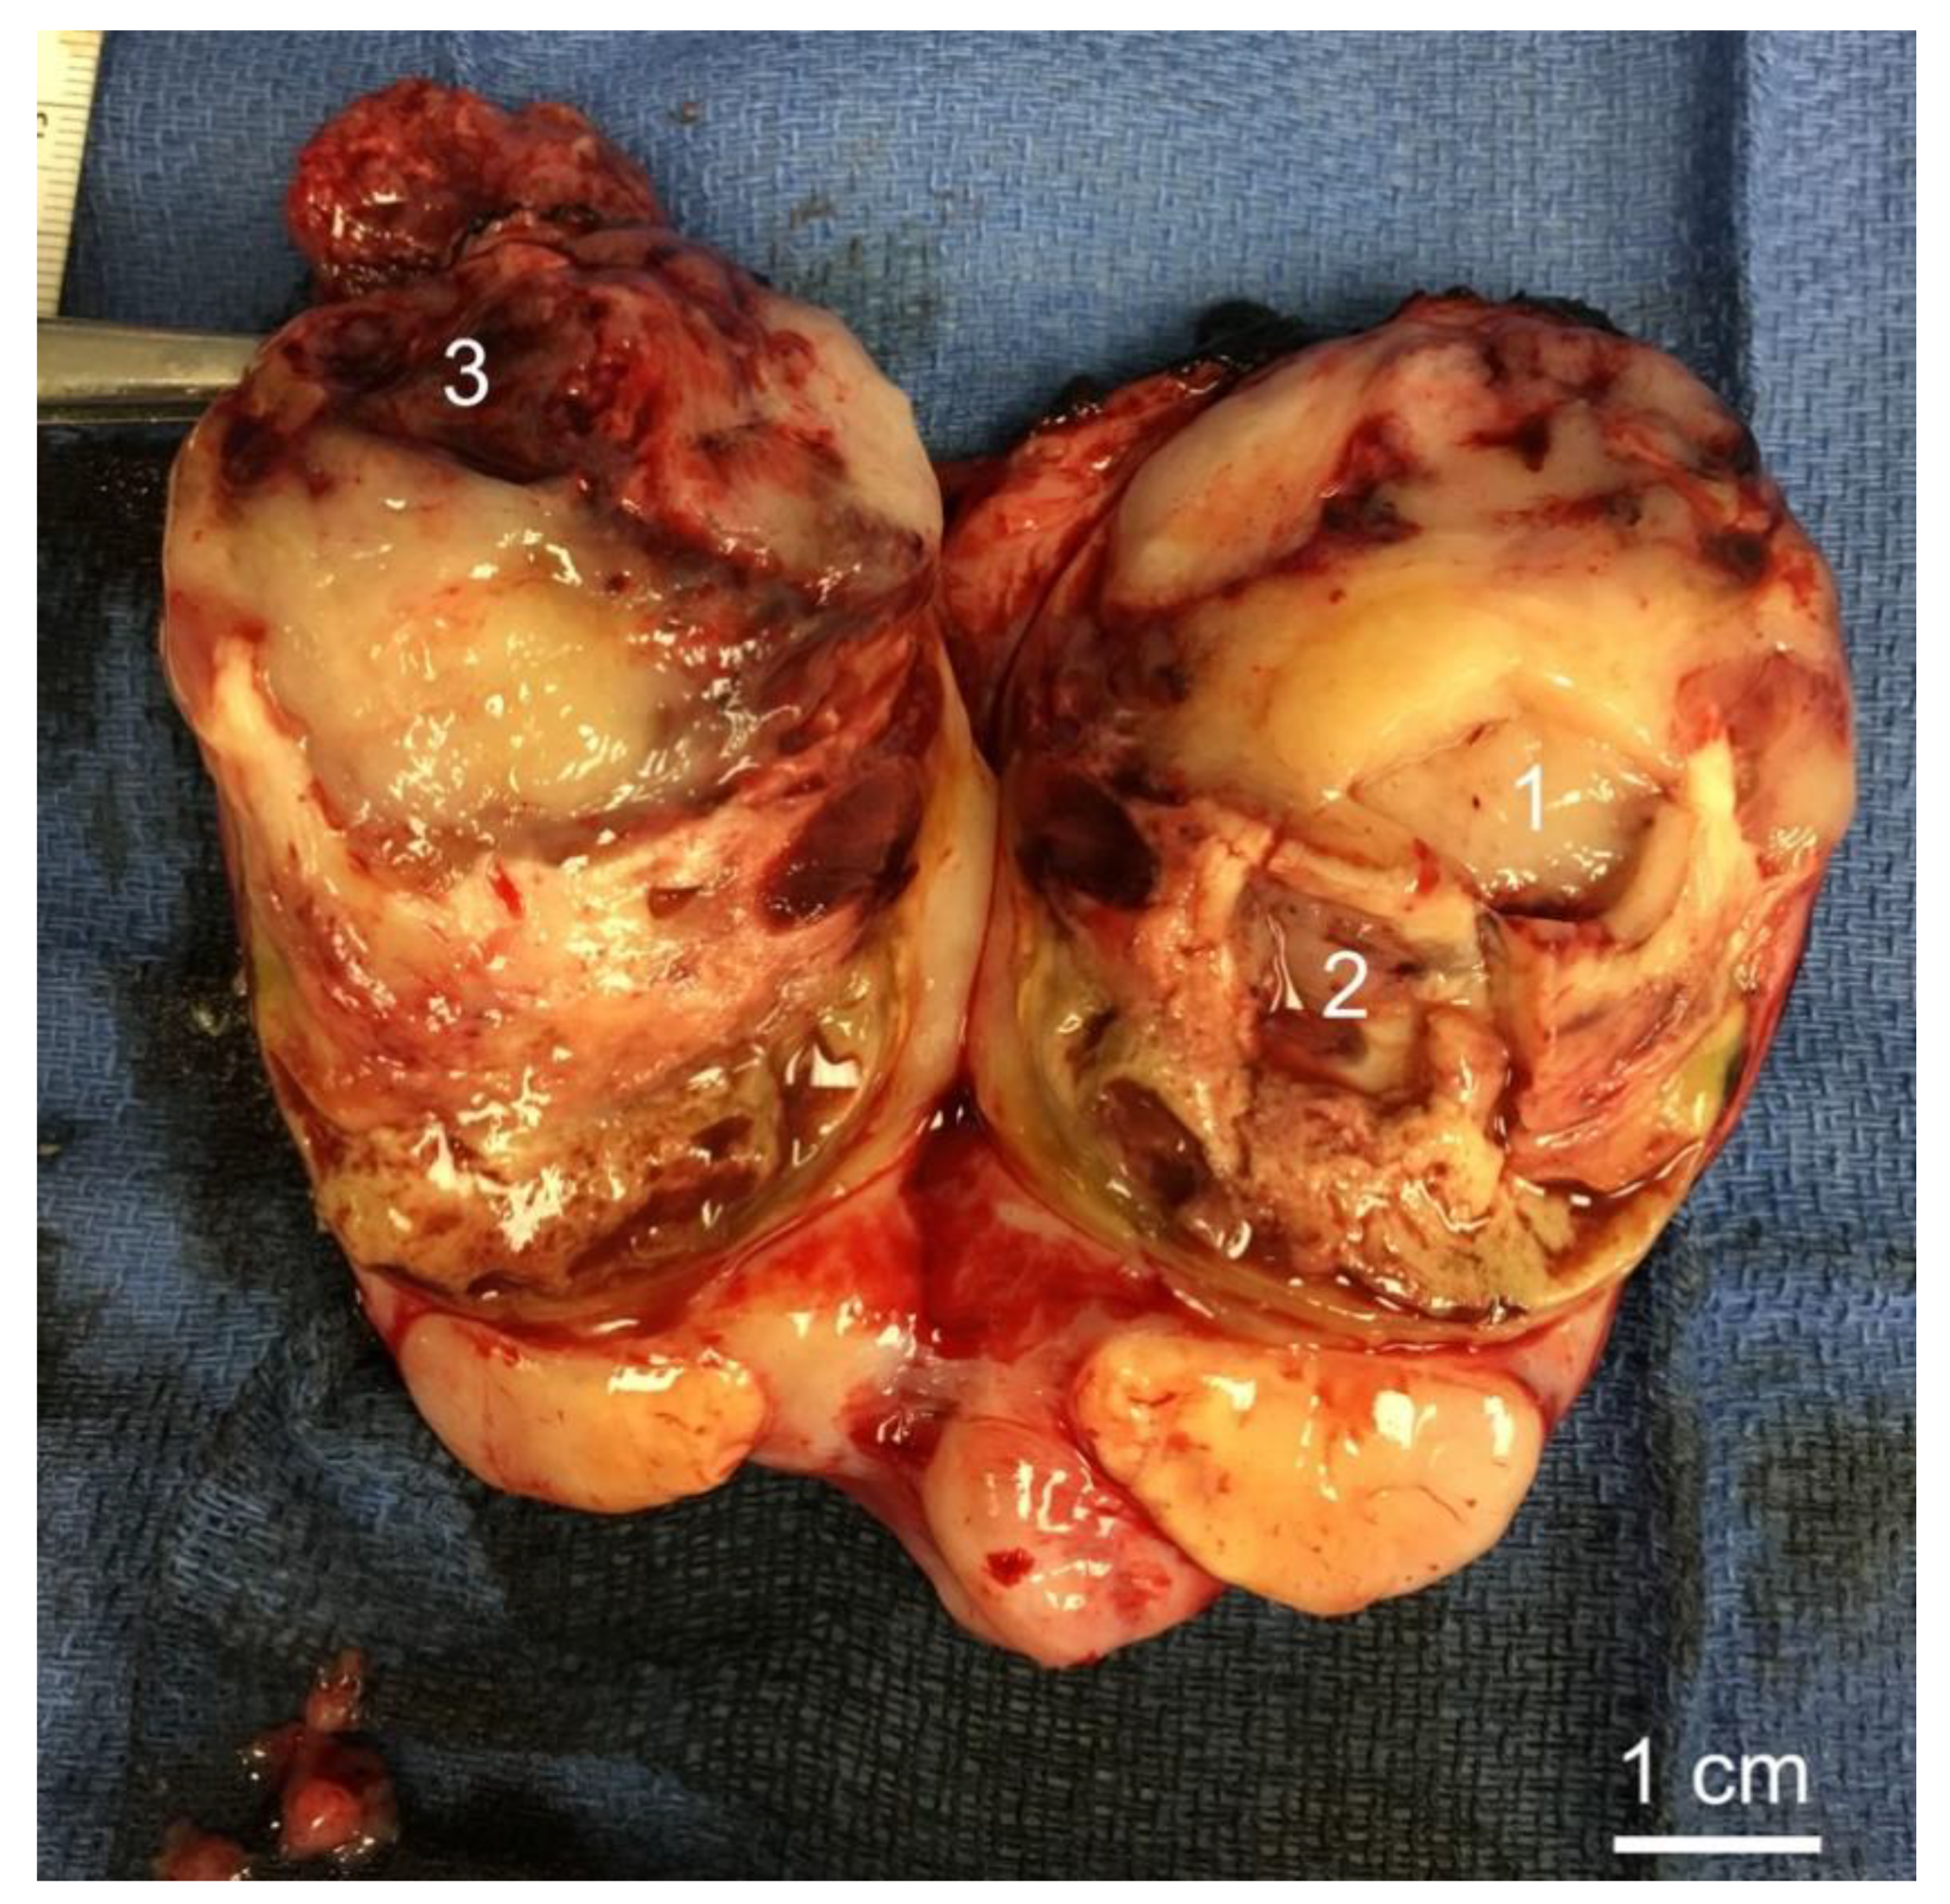
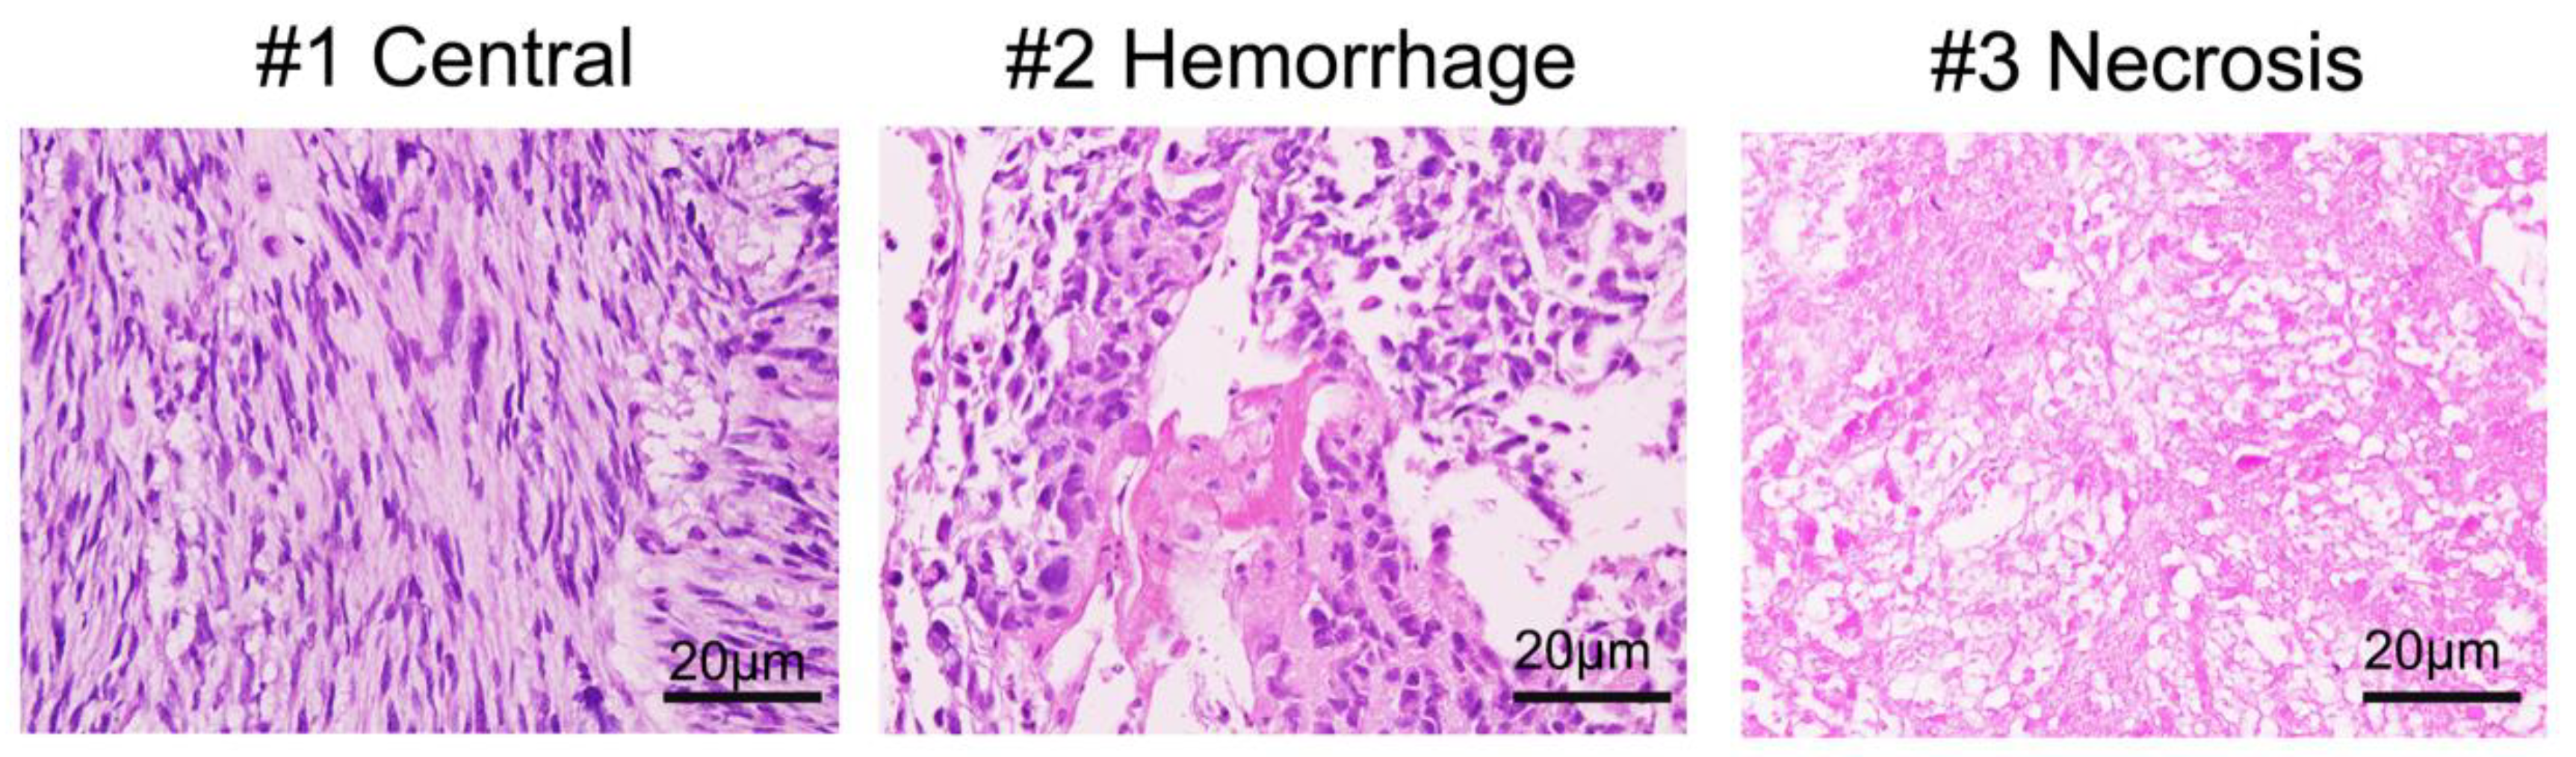
3.2. Histology of Biopsy Sites
3.3. Whole Exome Sequencing (WES), RNA Sequencing (RNA-Seq), and Copy Number Analysis
4. Discussion
5. Conclusions
Supplementary Materials
Author Contributions
Funding
Conflicts of Interest
References
- Eilber, F.C.; Brennan, M.F.; Eilber, F.R.; Dry, S.M.; Singer, S.; Kattan, M.W. Validation of the Postoperative Nomogram for 12-Year Sarcoma-Specific Mortality. Cancer 2004, 101, 2270–2275. [Google Scholar] [CrossRef] [PubMed]
- Ng, V.Y.; Scharschmidt, T.J.; Mayerson, J.L.; Fisher, J.L. Incidence and Survival in Sarcoma in the United States: A Focus on Musculoskeletal Lesions. Anticancer Res. 2013, 33, 2597–2604. [Google Scholar] [PubMed]
- Evans, D.G.R.; Baser, M.E.; McGaughran, J.; Sharif, S.; Howard, E.; Moran, A. Malignant peripheral nerve sheath tumours in neurofibromatosis 1. J. Med. Genet. 2002, 39, 311–314. [Google Scholar] [CrossRef] [PubMed] [Green Version]
- Ducatman, B.S.; Scheithauer, B.W.; Piepgras, D.G.; Reiman, H.M.; Ilstrup, D.M. Malignant Peripheral Nerve Sheath Tumors. A Clinicopathologic Study of 120 Cases. Cancer 1986, 57, 2006–2021. [Google Scholar] [CrossRef]
- Porter, D.E.; Prasad, V.; Foster, L.; Dall, G.F.; Birch, R.; Grimer, R.J. Survival in malignant peripheral nerve sheath tumours: A comparison between sporadic and neurofibromatosis type 1-associated tumours. Sarcoma 2009, 2009, 1–5. [Google Scholar] [CrossRef]
- Zou, C.; Smith, K.D.; Liu, J.; Lahat, G.; Myers, S.; Wang, W.L.; Zhang, W.; McCutcheon, I.E.; Slopis, J.M.; Lazar, A.J.; et al. Clinical, pathological, and molecular variables predictive of malignant peripheral nerve sheath tumor outcome. Ann. Surg. 2009, 249, 1014–1022. [Google Scholar] [CrossRef]
- LaFemina, J.; Qin, L.X.; Moraco, N.H.; Antonescu, C.R.; Fields, R.C.; Crago, A.M.; Brennan, M.F.; Singer, S. Oncologic outcomes of sporadic, neurofibromatosis-associated, and radiation-induced malignant peripheral nerve sheath tumors. Ann. Surg. Oncol. 2013, 20, 66–72. [Google Scholar] [CrossRef]
- Farid, M.; Demicco, E.G.; Garcia, R.; Ahn, L.; Merola, P.R.; Cioffi, A.; Maki, R.G. Malignant Peripheral Nerve Sheath Tumors. Oncologist 2014, 19, 193–201. [Google Scholar] [CrossRef] [Green Version]
- Anghileri, M.; Miceli, R.; Fiore, M.; Mariani, L.; Ferrari, A.; Mussi, C.; Lozza, L.; Collini, P.; Olmi, P.; Casali, P.G.; et al. Malignant Peripheral Nerve Sheath Tumors: Prognostic Factors and Survival in a Series of Patients Treated at a Single Institution. Cancer 2006, 107, 1065–1074. [Google Scholar] [CrossRef]
- Stucky, C.C.; Johnson, K.N.; Gray, R.J.; Pockaj, B.A.; Ocal, I.T.; Rose, P.S.; Wasif, N. Malignant peripheral nerve sheath tumors (MPNST): The Mayo Clinic experience. Ann. Surg. Oncol. 2012, 19, 878–885. [Google Scholar] [CrossRef]
- Ferner, R.E.; Gutmann, D.H. International Consensus Statement on Malignant Peripheral Nerve Sheath Tumors in Neurofibromatosis. Cancer Res. 2002, 62, 1573–1577. [Google Scholar]
- Kroep, J.R.; Ouali, M.; Gelderblom, H.; Le Cesne, A.; Dekker, T.J.; Van Glabbeke, M.; Hogendoorn, P.C.; Hohenberger, P. First-Line Chemotherapy for Malignant Peripheral Nerve Sheath Tumor (MPNST) versus Other Histological Soft Tissue Sarcoma Subtypes and as a Prognostic Factor for MPNST: An EORTC Soft Tissue and Bone Sarcoma Group Study. Ann. Oncol. 2011, 22, 207–214. [Google Scholar] [CrossRef] [PubMed]
- James, A.W.; Shurell, E.; Singh, A.; Dry, S.M.; Eilber, F.C. Malignant Peripheral Nerve Sheath Tumor. Surg. Oncol. Clin. N. Am. 2016, 25, 789–802. [Google Scholar] [CrossRef] [PubMed]
- Cichowski, K.; Shih, T.S.; Schmitt, E.; Santiago, S.; Reilly, K.; McLaughlin, M.E.; Bronson, R.T.; Jacks, T. Mouse Models of Tumor Development in Neurofibromatosis Type 1. Science 1999, 286, 2172–2176. [Google Scholar] [CrossRef] [PubMed]
- Vogel, K.S.; Klesse, L.J.; Velasco-Miguel, S.; Meyers, K.; Rushing, E.J.; Parada, L.F. Mouse Tumor Model for Neurofibromatosis Type 1. Science 1999, 286, 2176–2179. [Google Scholar] [CrossRef]
- Bradtmoller, M.; Hartmann, C.; Zietsch, J.; Jäschke, S.; Mautner, V.F.; Kurtz, A.; Park, S.J.; Baier, M.; Harder, A.; Reuss, D.; et al. Impaired Pten Expression in Human Malignant Peripheral Nerve Sheath Tumours. PLoS ONE 2012. [Google Scholar] [CrossRef]
- Keng, V.W.; Rahrmann, E.P.; Watson, A.L.; Tschida, B.R.; Moertel, C.L.; Jessen, W.J.; Rizvi, T.A.; Collins, M.H.; Ratner, N.; Largaespada, D.A. PTEN and NF1 inactivation in Schwann cells produces a severe phenotype in the peripheral nervous system that promotes the development and malignant progression of peripheral nerve sheath tumors. Cancer Res. 2012, 72, 3405–3413. [Google Scholar] [CrossRef] [Green Version]
- Gregorian, C.; Nakashima, J.; Dry, S.M.; Nghiemphu, P.L.; Smith, K.B.; Ao, Y.; Dang, J.; Lawson, G.; Mellinghoff, I.K.; Mischel, P.S.; et al. PTEN dosage is essential for neurofibroma development and malignant transformation. Proc. Natl. Acad. Sci. USA 2009, 106, 19479–19484. [Google Scholar] [CrossRef] [Green Version]
- Kourea, H.P.; Orlow, I.; Scheithauer, B.W.; Cordon-Cardo, C.; Woodruff, J.M. Deletions of the INK4A gene occur in malignant peripheral nerve sheath tumors but not in neurofibromas. Am. J. Path. 1999, 155, 1855–1860. [Google Scholar] [CrossRef] [Green Version]
- Lu, H.C.; Eulo, V.; Apicelli, A.J.; Pekmezci, M.; Tao, Y.; Luo, J.; Hirbe, A.C.; Dahiya, S. Aberrant ATRX protein expression is associated with poor overall survival in NF1-MPNST. Oncotarget 2018, 9, 23018–23028. [Google Scholar] [CrossRef] [Green Version]
- Lee, W.; Teckie, S.; Wiesner, T.; Ran, L.; Prieto Granada, C.N.; Lin, M.; Zhu, S.; Cao, Z.; Liang, Y.; Sboner, A.; et al. PRC2 is recurrently inactivated through EED or SUZ12 loss in malignant peripheral nerve sheath tumors. Nat. Genet. 2014, 46, 1227–1232. [Google Scholar] [CrossRef] [PubMed] [Green Version]
- Holtkamp, N.; Okuducu, A.F.; Mucha, J.; Afanasieva, A.; Hartmann, C.; Atallah, I.; Estevez-Schwarz, L.; Mawrin, C.; Friedrich, R.E.; Mautner, V.F.; et al. Mutation and expression of PDGFRA and KIT in malignant peripheral nerve sheath tumors, and its implications for imatinib sensitivity. Carcinogenesis 2006, 27, 664–671. [Google Scholar] [CrossRef] [PubMed] [Green Version]
- DeClue, J.E.; Heffelfinger, S.; Benvenuto, G.; Ling, B.; Li, S.; Rui, W.; Vass, W.C.; Viskochil, D.; Ratner, N. Epidermal growth factor receptor expression in neurofibromatosis type 1-related tumors and NF1 animal models. J. Clin. Investig. 2000, 105, 1233–1241. [Google Scholar] [CrossRef] [PubMed] [Green Version]
- Yang, J.; Ylipää, A.; Sun, Y.; Zheng, H.; Chen, K.; Nykter, M.; Trent, J.; Ratner, N.; Lev, D.C.; Zhang, W. Genomic and molecular characterization of malignant peripheral nerve sheath tumor identifies the IGF1R pathway as a primary target for treatment. Clin. Cancer Res. 2011, 17, 7563–7573. [Google Scholar] [CrossRef] [Green Version]
- Symposium on Linkage of von Recklinghausen Neurofibromatosis (NF1). Closing in on the gene for von Recklinghausen neurofibromatosis. Genomics 1987, 1, 335–383.
- Talevich, E.; Shain, A.H.; Botton, T.; Bastian, B.C. CNVkit: Genome-Wide Copy Number Detection and Visualization from Targeted DNA Sequencing. PLoS Comput. Biol. 2016, 12, e1004873. [Google Scholar] [CrossRef]
- Li, H. Aligning sequence reads, clone sequences and assembly contigs with BWA-MEM. arXiv Preprint 2013, arXiv:1303.3997. [Google Scholar]
- Chen, X.; Schulz-Trieglaff, O.; Shaw, R.; Barnes, B.; Schlesinger, F.; Källberg, M.; Cox, A.J.; Kruglyak, S.; Saunders, C.T. Manta: Rapid detection of structural variants and indels for germline and cancer sequencing applications. Bioinformatics 2015, 32, 1220–1222. [Google Scholar] [CrossRef]
- Koboldt, D.C.; Zhang, Q.; Larson, D.E.; Shen, D.; McLellan, M.D.; Lin, L.; Miller, C.A.; Mardis, E.R.; Ding, L.; Wilson, R.K. VarScan 2: Somatic mutation and copy number alteration discovery in cancer by exome sequencing. Genome Res. 2012, 22, 568–576. [Google Scholar] [CrossRef] [Green Version]
- Kim, S.; Scheffler, K.; Halpern, A.L.; Bekritsky, M.A.; Noh, E.; Källberg, M.; Chen, X.; Kim, Y.; Beyter, D.; Krusche, P.; et al. Strelka2: Fast and accurate calling of germline and somatic variants. Nat. Methods 2018, 15, 591–594. [Google Scholar] [CrossRef]
- Cibulskis, K.; Lawrence, M.S.; Carter, S.L.; Sivachenko, A.; Jaffe, D.; Sougnez, C.; Gabriel, S.; Meyerson, M.; Lander, E.S.; Getz, G. Sensitive detection of somatic point mutations in impure and heterogeneous cancer samples. Nat. Biotechnol. 2013, 31, 213–219. [Google Scholar] [CrossRef] [PubMed]
- Ye, K.; Schulz, M.H.; Long, Q.; Apweiler, R.; Ning, Z. Pindel: A pattern growth approach to detect break points of large deletions and medium sized insertions from paired-end short reads. Bioinformatics (Oxford, England) 2009, 25, 2865–2871. [Google Scholar] [CrossRef] [PubMed]
- McLaren, W.; Gil, L.; Hunt, S.E.; Riat, H.S.; Ritchie, G.R.; Thormann, A.; Flicek, P.; Cunningham, F. The Ensembl Variant Effect Predictor. Genome Biol. 2016, 17. [Google Scholar] [CrossRef] [PubMed] [Green Version]
- Bioconductor: Genomic Visualizations in R. Available online: https://bioconductor.org/packages/release/bioc/html/GenVisR.html (accessed on 24 February 2020).
- Bamford, S.; Dawson, E.; Forbes, S.; Clements, J.; Pettett, R.; Dogan, A.; Flanagan, A.; Teague, J.; Futreal, P.A.; Stratton, M.R.; et al. The COSMIC (Catalogue of Somatic Mutations in Cancer) database and website. Br. J. Cancer 2004, 91, 355–358. [Google Scholar] [CrossRef]
- Landrum, M.J.; Lee, J.M.; Benson, M.; Brown, G.; Chao, C.; Chitipiralla, S.; Gu, B.; Hart, J.; Hoffman, D.; Hoover, J.; et al. ClinVar: Public archive of interpretations of clinically relevant variants. Nucleic Acids Res. 2016, 44, 862–868. [Google Scholar] [CrossRef] [Green Version]
- Pauline, C.; Ng, S.H. SIFT: Predicting amino acid changes that affect protein function. Nucleic Acids Res. 2003, 31, 3812–3814. [Google Scholar]
- Adzhubei, I.A.; Schmidt, S.; Peshkin, L.; Ramensky, V.E.; Gerasimova, A.; Bork, P.; Kondrashov, A.S.; Sunyaev, S.R. A method and server for predicting damaging missense mutations. Nat Methods 2010, 7, 248–249. [Google Scholar] [CrossRef] [Green Version]
- Miller, C.A.; White, B.S.; Dees, N.D.; Griffith, M.; Welch, J.S.; Griffith, O.L.; Vij, R.; Tomasson, M.H.; Graubert, T.A.; Walter, M.J.; et al. SciClone: Inferring clonal architecture and tracking the spatial and temporal patterns of tumor evolution. PLoS Comput. Biol. 2014. [Google Scholar] [CrossRef]
- Dang, H.X.; White, B.S.; Foltz, S.M.; Miller, C.A.; Luo, J.; Fields, R.C.; Maher, C.A. ClonEvol: Clonal ordering and visualization in cancer sequencing. Ann. Oncol. 2017, 28, 3076–3082. [Google Scholar] [CrossRef]
- Xing, Y.; Yu, T.; Wu, Y.N.; Roy, M.; Kim, J.; Lee, C. An expectation-maximization algorithm for probabilistic reconstructions of full-length isoforms from splice graphs. Nucleic Acids Res. 2006, 34, 3150–3160. [Google Scholar] [CrossRef] [Green Version]
- Robinson, M.D.; McCarthy, D.J.; Smyth, G.K. edgeR: A Bioconductor package for differential expression analysis of digital gene expression data. Bioinformatics 2010, 26, 139–140. [Google Scholar] [CrossRef] [PubMed] [Green Version]
- Warnes, G.R.; Bolker, B.; Bonebakker, L.; Gentleman, R.; Huber, W.; Liaw, A.; Lumley, T.; Maechler, M.; Magnusson, A.; Moeller, S.; et al. gplots: Various R Programming Tools for Plotting Data. Seattle, WA, USA, 2015. Available online: https://www.scienceopen.com/document?vid=0e5d8e31-1fe4-492f-a3d8-8cd71b2b8ad9 (accessed on 29 April 2020).
- Partek Flow Documentation: Gene-specific Analysis. Available online: https://documentation.partek.com/display/FLOWDOC/Gene-specific+Analysis (accessed on 24 February 2020).
- Thomas, P.D.; Campbell, M.J.; Kejariwal, A.; Mi, H.; Karlak, B.; Daverman, R.; Diemer, K.; Muruganujan, A.; Narechania, A. PANTHER: A library of protein families and subfamilies indexed by function. Genome Res. 2003, 13, 2129–2141. [Google Scholar] [CrossRef] [PubMed] [Green Version]
- Guillou, L.; Coindre, J.M.; Bonichon, F.; Nguyen, B.B.; Terrier, P.; Collin, F.; Vilain, M.O.; Mandard, A.M.; Le Doussal, V.; Leroux, A.; et al. Comparative study of the National Cancer Institute and French Federation of Cancer Centers Sarcoma Group grading systems in a population of 410 adult patients with soft tissue sarcoma. J. Clin. Oncol. 1997, 15, 350–362. [Google Scholar] [CrossRef] [PubMed]
- Gao, J.; Aksoy, B.A.; Dogrusoz, U.; Dresdner, G.; Gross, B.; Sumer, S.O.; Sun, Y.; Jacobsen, A.; Sinha, R.; Larsson, E.; et al. Integrative analysis of complex cancer genomics and clinical profiles using the cBioPortal. Sci. Signal 2013. [Google Scholar] [CrossRef] [Green Version]
- Wang, T.; Wang, H.; Yang, S.; Guo, H.; Zhang, B.; Guo, H.; Wang, L.; Zhu, G.; Zhang, Y.; Zhou, H.; et al. Association of APEX1 and OGG1 gene polymorphisms with breast cancer risk among Han women in the Gansu Province of China. BMC Med. Genet. 2018, 19, 67. [Google Scholar] [CrossRef] [Green Version]
- Kim, H.B.; Lim, H.J.; Lee, H.J.; Park, J.H.; Park, S.G. Evaluation and Clinical Significance of Jagged-1-activated Notch Signaling by APEX1 in Colorectal Cancer. Anticancer Res. 2019, 39, 6097–6105. [Google Scholar] [CrossRef]
- Kim, H.B.; Cho, W.J.; Choi, N.G.; Kim, S.S.; Park, J.H.; Lee, H.J.; Park, S.G. Clinical implications of APEX1 and Jagged1 as chemoresistance factors in biliary tract cancer. Ann. Surg. Treat. Res. 2017, 92, 15–22. [Google Scholar] [CrossRef] [Green Version]
- Blazquez, L.; Emmett, W.; Faraway, R.; Pineda, J.M.B.; Bajew, S.; Gohr, A.; Haberman, N.; Sibley, C.R.; Bradley, R.K.; Irimia, M.; et al. Exon Junction Complex Shapes the Transcriptome by Repressing Recursive Splicing. Mol. Cell 2018, 72, 496–509. [Google Scholar] [CrossRef]
- Shen, Y.N.; Bae, I.S.; Park, G.H.; Choi, H.S.; Lee, K.H.; Kim, S.H. MicroRNA-196b enhances the radiosensitivity of SNU-638 gastric cancer cells by targeting RAD23B. Biomed. Pharmacother. 2018, 105, 362–369. [Google Scholar] [CrossRef]
- Linge, A.; Maurya, P.; Friedrich, K.; Baretton, G.B.; Kelly, S.; Henry, M.; Clynes, M.; Larkin, A.; Meleady, P. Identification and functional validation of RAD23B as a potential protein in human breast cancer progression. J. Proteome Res. 2014, 13, 3212–3222. [Google Scholar] [CrossRef]
- Luo, C.; Cheng, Y.; Liu, Y.; Chen, L.; Liu, L.; Wei, N.; Xie, Z.; Wu, W.; Feng, Y. SRSF2 Regulates Alternative Splicing to Drive Hepatocellular Carcinoma Development. Cancer Res. 2017, 77, 1168–1178. [Google Scholar] [CrossRef] [PubMed] [Green Version]
- Liang, Y.; Tebaldi, T.; Rejeski, K.; Joshi, P.; Stefani, G.; Taylor, A.; Song, Y.; Vasic, R.; Maziarz, J.; Balasubramanian, K. SRSF2 mutations drive oncogenesis by activating a global program of aberrant alternative splicing in hematopoietic cells. Leukemia 2018, 32, 2659–2671. [Google Scholar] [CrossRef] [PubMed]
- Gu, L.; Lu, L.; Zhou, D.; Liu, Z. Long Noncoding RNA BCYRN1 Promotes the Proliferation of Colorectal Cancer Cells via Up-Regulating NPR3 Expression. Cell Physiol. Biochem. 2018, 48, 2337–2349. [Google Scholar] [CrossRef]
- Li, X.; Li, J.; Li, F. P21 activated kinase 4 binds translation elongation factor eEF1A1 to promote gastric cancer cell migration and invasion. Oncol. Rep. 2017, 37, 2857–2864. [Google Scholar] [CrossRef]
- Shi, N.; Chen, X.; Liu, R.; Wang, D.; Su, M.; Wang, Q.; He, A.; Gu, H. Eukaryotic elongation factors 2 promotes tumor cell proliferation and correlates with poor prognosis in ovarian cancer. Tissue Cell 2018, 53, 53–60. [Google Scholar] [CrossRef] [PubMed]
- Wang, H.; He, Z.; Xia, L.; Zhang, W.; Xu, L.; Yue, X.; Ru, X.; Xu, Y. PSMB4 overexpression enhances the cell growth and viability of breast cancer cells leading to a poor prognosis. Oncol. Rep. 2018, 40, 2343–2352. [Google Scholar] [CrossRef] [Green Version]
- Liu, R.; Lu, S.; Deng, Y.; Yang, S.; He, S.; Cai, J.; Qiang, F.; Chen, C.; Zhang, W.; Zhao, S.; et al. PSMB4 expression associates with epithelial ovarian cancer growth and poor prognosis. Arch. Gynecol. Obstet. 2016, 293, 1297–1307. [Google Scholar] [CrossRef]
- Xu, X.; Xiong, X.; Sun, Y. The role of ribosomal proteins in the regulation of cell proliferation, tumorigenesis, and genomic integrity. Sci. China Life Sci. 2016, 59, 656–672. [Google Scholar] [CrossRef]
- Nallar, S.C.; Kalvakolanu, D.V. Regulation of snoRNAs in Cancer: Close Encounters with Interferon. J. Interferon Cytokine Res. 2013, 33, 189–198. [Google Scholar] [CrossRef] [Green Version]
- Falaleeva, M.; Welden, J.R.; Duncan, M.J.; Stamm, S. C/D-box snoRNAs form methylating and non-methylating ribonucleoprotein complexes: Old dogs show new tricks. Bioessays 2017, 39. [Google Scholar] [CrossRef]
- Dong, X.; Han, Y.; Sun, Z.; Xu, J. Actin γ 1, a new skin cancer pathogenic gene, identified by the biological feature-based classification. J. Cell Biochem. 2018, 119, 1406–1419. [Google Scholar] [CrossRef] [PubMed]
- Luo, Y.; Kong, F.; Wang, Z.; Chen, D.; Liu, Q.; Wang, T.; Xu, R.; Wang, X.; Yang, J.Y. Loss of ASAP3 destabilizes cytoskeletal protein ACTG1 to suppress cancer cell migration. Mol. Med. Rep. 2014, 9, 387–394. [Google Scholar] [CrossRef] [PubMed] [Green Version]
- Munschauer, M.; Nguyen, C.T.; Sirokman, K.; Hartigan, C.R.; Hogstrom, L.; Engreitz, J.M.; Ulirsch, J.C.; Fulco, C.P.; Subramanian, V.; Chen, J.; et al. The NORAD lncRNA assembles a topoisomerase complex critical for genome stability. Nature 2018, 561, 132–136. [Google Scholar] [CrossRef] [PubMed] [Green Version]
- Liang, L.; Li, Q.; Huang, L.Y.; Li, D.W.; Wang, Y.W.; Li, X.X.; Cai, S.J. Loss of ARHGDIA expression is associated with poor prognosis in HCC and promotes invasion and metastasis of HCC cells. Int. J. Oncol. 2014, 45, 659–666. [Google Scholar] [CrossRef] [PubMed] [Green Version]
- Riihilä, P.; Viiklepp, K.; Nissinen, L.; Farshchian, M.; Kallajoki, M.; Kivisaari, A.; Meri, S.; Peltonen, J.; Peltonen, S.; Kähäri, V.M. Tumour-cell-derived complement components C1r and C1s promote growth of cutaneous squamous cell carcinoma. Br. J. Dermatol. 2020, 182, 658–670. [Google Scholar] [CrossRef] [PubMed]
- Wheeler, L.J.; Watson, Z.L.; Qamar, L.; Yamamoto, T.M.; Post, M.D.; Berning, A.A.; Spillman, M.A.; Behbakht, K.; Bitler, B.G. CBX2 identified as driver of anoikis escape and dissemination in high grade serous ovarian cancer. Oncogenesis 2018, 7, 92. [Google Scholar] [CrossRef] [Green Version]
- Liu, J.; Shen, J.X.; Wu, H.T.; Li, X.L.; Wen, X.F.; Du, C.W.; Zhang, G.J. Collagen 1A1 (COL1A1) promotes metastasis of breast cancer and is a potential therapeutic target. Discov. Med. 2018, 25, 211–223. [Google Scholar]
- Menendez, J.A.; Lupu, R. Fatty acid synthase and the lipogenic phenotype in cancer pathogenesis. Nat. Rev. Cancer 2007, 7, 763–777. [Google Scholar] [CrossRef]
- Kamil, M.; Shinsato, Y.; Higa, N.; Hirano, T.; Idogawa, M.; Takajo, T.; Minami, K.; Shimokawa, M.; Yamamoto, M.; Kawahara, K.; et al. High filamin-C expression predicts enhanced invasiveness and poor outcome in glioblastoma multiforme. Br. J. Cancer 2019, 120, 819–826. [Google Scholar] [CrossRef] [Green Version]
- Zhu, Y.; Kakinuma, N.; Wang, Y.; Kiyama, R. Kank proteins: A new family of ankyrin-repeat domain-containing proteins. Biochim. Biophys. Act 2008, 1780, 128–133. [Google Scholar] [CrossRef]
- Trussart, C.; Pirlot, C.; Di Valentin, E.; Piette, J.; Habraken, Y. Melanoma antigen-D2 controls cell cycle progression and modulates the DNA damage response. Biochem. Pharmacol. 2018, 153, 217–229. [Google Scholar] [CrossRef] [PubMed]
- Wang, P.C.; Hu, Z.Q.; Zhou, S.L.; Zhan, H.; Zhou, Z.J.; Luo, C.B.; Huang, X.W. Downregulation of MAGE family member H1 enhances hepatocellular carcinoma progression and serves as a biomarker for patient prognosis. Future Oncol. 2018, 14, 1177–1186. [Google Scholar] [CrossRef] [PubMed]
- Qu, K.; Wang, Z.; Fan, H.; Li, J.; Liu, J.; Li, P.; Liang, Z.; An, H.; Jiang, Y.; Lin, Q.; et al. MCM7 promotes cancer progression through cyclin D1-dependent signaling and serves as a prognostic marker for patients with hepatocellular carcinoma. Cell Death Dis 2017, 8, e2603. [Google Scholar] [CrossRef] [PubMed]
- Nguyen, A.T.; Chia, J.; Ros, M.; Hui, K.M.; Saltel, F.; Bard, F. Organelle Specific O-Glycosylation Drives MMP14 Activation, Tumor Growth, and Metastasis. Cancer Cell 2017, 32, 639–653. [Google Scholar] [CrossRef] [Green Version]
- Hu, G.; Zhang, J.; Xu, F.; Deng, H.; Zhang, W.; Kang, S.; Liang, W. Stomatin-like protein 2 inhibits cisplatin-induced apoptosis through MEK/ERK signaling and the mitochondrial apoptosis pathway in cervical cancer cells. Cancer Sci. 2018, 109, 1357–1368. [Google Scholar] [CrossRef] [Green Version]
- Du, W.L.; Fang, Q.; Chen, Y.; Teng, J.W.; Xiao, Y.S.; Xie, P.; Jin, B.; Wang, J.Q. Effect of silencing the T-Box transcription factor TBX2 in prostate cancer PC3 and LNCaP cells. Mol. Med. Rep. 2017, 16, 6050–6058. [Google Scholar] [CrossRef] [Green Version]
- Czerwińska, P.; Mazurek, S.; Wiznerowicz, M. The complexity of TRIM28 contribution to cancer. J. Biomed. Sci. 2017, 29, 63. [Google Scholar] [CrossRef]
- Lan, B.; Chai, S.; Wang, P.; Wang, K. VCP/p97/Cdc48, A Linking of Protein Homeostasis and Cancer Therapy. Curr. Mol. Med. 2017, 17, 608–618. [Google Scholar] [CrossRef]
- Hwang, W.; Chiu, Y.F.; Kuo, M.H.; Lee, K.L.; Lee, A.C.; Yu, C.C.; Chang, J.L.; Huang, W.C.; Hsiao, S.H.; Lin, S.E.; et al. Expression of Neuroendocrine Factor VGF in Lung Cancer Cells Confers Resistance to EGFR Kinase Inhibitors and Triggers Epithelial-to-Mesenchymal Transition. Cancer Res. 2017, 77, 3013–3026. [Google Scholar] [CrossRef] [Green Version]
- De Blasio, A.; Vento, R.; Di Fiore, R. Mcl-1 targeting could be an intriguing perspective to cure cancer. J. Cell Physiol. 2018, 233, 8482–8498. [Google Scholar] [CrossRef]
- Louie, S.M.; Grossman, E.A.; Crawford, L.A.; Ding, L.; Camarda, R.; Huffman, T.R.; Miyamoto, D.K.; Goga, A.; Weerapana, E.; Nomura, D.K. GSTP1 Is a Driver of Triple-Negative Breast Cancer Cell Metabolism and Pathogenicity. Cell Chem. Biol. 2016, 23, 567–578. [Google Scholar] [CrossRef] [PubMed] [Green Version]
- Bianchi, M.; Crinelli, R.; Giacomini, E.; Carloni, E.; Radici, L.; Scarpa, E.S.; Tasini, F.; Magnani, M. A negative feedback mechanism links UBC gene expression to ubiquitin levels by affecting RNA splicing rather than transcription. Sci. Rep. 2019, 9, 18556. [Google Scholar] [CrossRef] [PubMed] [Green Version]
- Lin, L.; Li, X.; Pan, C.; Lin, W.; Shao, R.; Liu, Y.; Zhang, J.; Luo, Y.; Qian, K.; Shi, M.; et al. ATXN2L upregulated by epidermal growth factor promotes gastric cancer cell invasiveness and oxaliplatin resistance. Cell Death Dis. 2019, 10, 173. [Google Scholar] [CrossRef] [PubMed]
- Livingstone, C. IGF2 and cancer. Endocr. Relat. Cancer 2013, 20, 321–339. [Google Scholar] [CrossRef] [PubMed] [Green Version]
- Feng, W.; Wang, C.; Liang, C.; Yang, H.; Chen, D.; Yu, X.; Zhao, W.; Geng, D.; Li, S.; Chen, Z.; et al. The Dysregulated Expression of KCNQ1OT1 and Its Interaction with Downstream Factors miR-145/CCNE2 in Breast Cancer Cells. Cell Physiol. Biochem. 2018, 49, 432–446. [Google Scholar] [CrossRef]
- Zhang, Y.; Hu, J.F.; Wang, H.; Cui, J.; Gao, S.; Hoffman, A.R.; Li, W. CRISPR Cas9-guided chromatin immunoprecipitation identifies miR483 as an epigenetic modulator of IGF2 imprinting in tumors. Oncotarget 2017, 8, 34177–34190. [Google Scholar] [CrossRef] [Green Version]
- Gong, C.Y.; Tang, R.; Nan, W.; Zhou, K.S.; Zhang, H.H. Role of SNHG16 in human cancer. Clin. Chim. Acta 2020, 503, 175–180. [Google Scholar] [CrossRef]
- Gerlinger, M.; Horswell, S.; Larkin, J.; Rowan, A.J.; Salm, M.P.; Varela, I.; Fisher, R.; McGranahan, N.; Matthews, N.; Santos, C.R.; et al. Genomic architecture and evolution of clear cell renal cell carcinomas defined by multiregion sequencing. Nat. Genet. 2014, 46, 225–233. [Google Scholar] [CrossRef]
- Yates, L.R.; Gerstung, M.; Knappskog, S.; Desmedt, C.; Gundem, G.; Van Loo, P.; Aas, T.; Alexandrov, L.B.; Larsimont, D.; Davies, H.; et al. Subclonal diversification of primary breast cancer revealed by multiregion sequencing. Nat. Med. 2015, 21, 751–759. [Google Scholar] [CrossRef]
- Hao, J.J.; Lin, D.C.; Dinh, H.Q.; Mayakonda, A.; Jiang, Y.Y.; Chang, C.; Jiang, Y.; Lu, C.C.; Shi, Z.Z.; Xu, X.; et al. Spatial intratumoral heterogeneity and temporal clonal evolution in esophageal squamous cell carcinoma. Nat. Genet. 2016, 48, 1500–1507. [Google Scholar] [CrossRef]
- Jamal-Hanjani, M.; Wilson, G.A.; McGranahan, N.; Birkbak, N.J.; Watkins, T.B.K.; Veeriah, S.; Shafi, S.; Johnson, D.H.; Mitter, R.; Rosenthal, R.; et al. Tracking the evolution of non-small-cell lung cancer. N. Engl. J. Med. 2017, 376, 2109–2121. [Google Scholar] [CrossRef] [PubMed] [Green Version]
- Harbst, K.; Lauss, M.; Cirenajwis, H.; Isaksson, K.; Rosengren, F.; Törngren, T.; Kvist, A.; Johansson, M.C.; Vallon-Christersson, J.; Baldetorp, B.; et al. Multiregion whole-exome sequencing uncovers the genetic evolution and mutational heterogeneity of early-stage metastatic melanoma. Cancer Res. 2016, 76, 4765–4774. [Google Scholar] [CrossRef] [PubMed] [Green Version]
- Peacock, J.D.; Pridgeon, M.G.; Tovar, E.A.; Essenburg, C.J.; Bowman, M.; Madaj, Z.; Koeman, J.; Boguslawski, E.A.; Grit, J.; Dodd, R.D.; et al. Genomic Status of MET Potentiates Sensitivity to MET and MEK Inhibition in NF1-Related Malignant Peripheral Nerve Sheath Tumors. Cancer Res. 2018, 78, 3672–3678. [Google Scholar] [CrossRef] [PubMed] [Green Version]
- Carriό, M.; Gel, B.; Terribas, E.; Zucchiatti, A.C.; Moliné, T.; Rosas, I.; Teulé, Á.; Ramón, Y.; Cajal, S.; López-Gutiérrez, J.C.; et al. Analysis of intratumor heterogeneity in Neurofibromatosis type 1 plexiform neurofibromas and neurofibromas with atypical features: Correlating histological and genomic findings. Hum. Mutat. 2018, 39, 1112–1125. [Google Scholar] [CrossRef] [PubMed]
- Nackley, A.G.; Shabalina, S.A.; Tchivileva, I.E.; Satterfield, K.; Korchynskyi, O.; Makarov, S.S.; Maixner, W.; Diatchenko, L. Human catechol-O-methyltransferase haplotypes modulate protein expression by altering mRNA secondary structure. Science 2006, 314, 1930–1933. [Google Scholar] [CrossRef] [PubMed] [Green Version]
- Kimchi-Sarfaty, C.; Oh, J.M.; Kim, I.W.; Sauna, Z.E.; Calcagno, A.M.; Ambudkar, S.V.; Gottesman, M.M. A “silent” polymorphism in the MDR1 gene changes substrate specificity. Science 2007, 315, 525–528. [Google Scholar] [CrossRef] [Green Version]
- Kudla, G.; Murray, A.W.; Tollervey, D.; Plotkin, J.B. Coding-sequence determinants of gene expression in Escherichia coli. Science 2009, 324, 255–258. [Google Scholar] [CrossRef] [Green Version]
- Sauna, Z.E.; Kimchi-Sarfaty, C. Understanding the contribution of synonymous mutations to human disease. Nat. Rev. Genet. 2011, 12, 683–691. [Google Scholar] [CrossRef]
- Pey, J.; San José-Eneriz, E.; Ochoa, M.C.; Apaolaza, I.; de Atauri, P.; Rubio, A.; Cendoya, X.; Miranda, E.; Garate, L.; Cascante, M.; et al. In-silico gene essentiality analysis of polyamine biosynthesis reveals APRT as a potential target in cancer. Sci. Rep. 2017, 7, 14358. [Google Scholar] [CrossRef] [Green Version]
- Shen, L.; Ke, Q.; Chai, J.; Zhang, C.; Qiu, L.; Peng, F.; Deng, X.; Luo, Z. PAG1 promotes the inherent radioresistance of laryngeal cancer cells via activation of STAT3. Exp. Cell Res. 2018, 370, 127–136. [Google Scholar] [CrossRef]
- Agarwal, S.; Ghosh, R.; Chen, Z.; Lakoma, A.; Gunaratne, P.H.; Kim, E.S.; Shohet, J.M. Transmembrane adaptor protein PAG1 is a novel tumor suppressor in neuroblastoma. Oncotarget 2016, 7, 24018–24026. [Google Scholar] [CrossRef] [PubMed] [Green Version]
- Jiang, D.; Hu, B.; Wei, L.; Xiong, Y.; Wang, G.; Ni, T.; Zong, C.; Ni, R.; Lu, C. High expression of vacuolar protein sorting 4B (VPS4B) is associated with accelerated cell proliferation and poor prognosis in human hepatocellular carcinoma. Pathol. Res. Pract. 2015, 211, 240–247. [Google Scholar] [CrossRef] [PubMed]
- Liu, Y.; Lv, L.; Xue, Q.; Wan, C.; Ni, T.; Chen, B.; Liu, Y.; Zhou, Y.; Ni, R.; Mao, G. Vacuolar protein sorting 4B, an ATPase protein positively regulates the progression of NSCLC via promoting cell division. Mol. Cell Biochem. 2013, 381, 163–171. [Google Scholar] [CrossRef] [PubMed]
- Lin, H.H.; Li, X.; Chen, J.L.; Sun, X.; Cooper, F.N.; Chen, Y.R.; Zhang, W.; Chung, Y.; Li, A.; Cheng, C.T.; et al. Identification of an AAA ATPase VPS4B-dependent pathway that modulates epidermal growth factor receptor abundance and signaling during hypoxia. Mol. Cell Biol. 2012, 32, 1124–1138. [Google Scholar] [CrossRef] [PubMed] [Green Version]
- Hazawa, M.; Lin, D.C.; Handral, H.; Xu, L.; Chen, Y.; Jiang, Y.Y.; Mayakonda, A.; Ding, L.W.; Meng, X.; Sharma, A.; et al. ZNF750 is a lineage-specific tumour suppressor in squamous cell carcinoma. Oncogene 2017, 36, 2243–2254. [Google Scholar] [CrossRef] [PubMed] [Green Version]
- Zhang, P.; He, Q.; Lei, Y.; Li, Y.; Wen, X.; Hong, M.; Zhang, J.; Ren, X.; Wang, Y.; Yang, X.; et al. m6A-mediated ZNF750 repression facilitates nasopharyngeal carcinoma progression. Cell Death Dis. 2018, 5, 1169. [Google Scholar] [CrossRef] [Green Version]
- Feng, T.; Sun, L.; Qi, W.; Pan, F.; Lv, J.; Guo, J.; Zhao, S.; Ding, A.; Qiu, W. Prognostic significance of Tspan9 in gastric cancer. Mol. Clin. Oncol. 2016, 5, 231–236. [Google Scholar] [CrossRef] [Green Version]
- Qi, Y.; Lv, J.; Liu, S.; Sun, L.; Wang, Y.; Li, H.; Qi, W.; Qiu, W. TSPAN9 and EMILIN1 synergistically inhibit the migration and invasion of gastric cancer cells by increasing TSPAN9 expression. BMC Cancer 2019, 19, 630. [Google Scholar] [CrossRef]
- Xiao, T.; Li, W.; Wang, X.; Xu, H.; Yang, J.; Wu, Q.; Huang, Y.; Geradts, J.; Jiang, P.; Fei, T.; et al. Estrogen-regulated feedback loop limits the efficacy of estrogen receptor–targeted breast cancer therapy. Proc. Natl. Acad. Sci. USA 2018, 115, 7869–7878. [Google Scholar] [CrossRef] [Green Version]
- Smith, H.W.; Hirukawa, A.; Sanguin-Gendreau, V.; Nandi, I.; Dufour, C.R.; Zuo, D.; Tandoc, K.; Leibovitch, M.; Singh, S.; Rennhack, J.P.; et al. An ErbB2/c-Src axis links bioenergetics with PRC2 translation to drive epigenetic reprogramming and mammary tumorigenesis. Nat. Commun. 2019, 10. [Google Scholar] [CrossRef]
- Yang, C.C.; Fazli, L.; Loguercio, S.; Zharkikh, I.; Aza-Blanc, P.; Gleave, M.E.; Wolf, D.A. Downregulation of c-SRC kinase CSK promotes castration resistant prostate cancer and pinpoints a novel disease subclass. Oncotarget 2015, 6, 22060–22071. [Google Scholar] [CrossRef] [PubMed] [Green Version]
- Guiducci, C.; Di Carlo, E.; Parenza, M.; Hitt, M.; Giovarelli, M.; Musiani, P.; Colombo, M.P. Intralesional injection of adenovirus encoding CC chemokine ligand 16 inhibits mammary tumor growth and prevents metastatic-induced death after surgical removal of the treated primary tumor. J. Immunol. 2004, 172, 4026–4036. [Google Scholar] [CrossRef] [PubMed]
- Paulsson, K. Genomic heterogeneity in acute leukemia. Cytogenet. Genome Res. 2013, 139, 174–180. [Google Scholar] [CrossRef] [PubMed]
- Saadatpour, A.; Guo, G.; Orkin, S.H.; Yuan, G.C. Characterizing heterogeneity in leukemic cells using single-cell gene expression analysis. Genome Biol. 2014, 15, 525. [Google Scholar] [CrossRef] [Green Version]
- Navin, N.; Kendall, J.; Troge, J.; Andrews, P.; Rodgers, L.; McIndoo, J.; Cook, K.; Stepansky, A.; Levy, D.; Esposito, D.; et al. Tumor evolution inferred by single cell sequencing. Nature 2011, 472, 90–94. [Google Scholar] [CrossRef] [Green Version]
- Xu, X.; Hou, Y.; Yin, X.; Bao, L.; Tang, A.; Song, L.; Li, F.; Tsang, S.; Wu, K.; Wu, H.; et al. Single-cell exome sequencing reveals single-nucleotide mutation characteristics of a kidney tumor. Cell 2012, 148, 886–895. [Google Scholar] [CrossRef] [Green Version]


| Age at Diagnosis, Years | Sex | Tumor Location | Tumor Size/Grade | Surgical Margin Status | Disease Status | Metastasis | Adjuvant Treatment | OS *, Months |
|---|---|---|---|---|---|---|---|---|
| 40 | Male | Left neck | 10.2 cm, Grade 3 1 | Negative | Recurred | Lung | None | 33 |
| Gene Symbol | p-Value (1 vs. 2) | Fold Change (1 vs. 2) | p-Value (1 vs. 3) | Fold Change (1 vs. 3) | p-Value (2 vs. 3) | Fold Change (2 vs. 3) |
|---|---|---|---|---|---|---|
| EEF1A1 | 2.04 × 10−84 | −3.32 | 3.33 × 10⁻¹⁶ | 2.20 | 1.35 × 10−119 | 7.31 |
| RPS27 | 4.32 × 10⁻²⁴ | −2.51 | 7.64 × 10⁻¹³ | 3.01 | 4.27 × 10−46 | 7.55 |
| RPS27A | 1.69 × 10⁻¹² | −2.62 | 9.42 × 10−05 | 2.27 | 4.16 × 10⁻²¹ | 5.95 |
| H3C3 | 7.46 × 10⁻¹² | −4.51 | 5.05 × 10−04 | 11.2 | 5.54 × 10−09 | 50.6 |
| RPLP1 | 2.36 × 10⁻¹⁰ | −2.57 | 7.25 × 10−04 | 2.13 | 2.43 × 10⁻¹⁷ | 5.48 |
| SNORD13 | 3.24 × 10⁻¹⁰ | 3.00 | 8.25 × 10−62 | −4.91 | 3.52 × 10−66 | −14.8 |
| RPLP0 | 1.05 × 10−09 | −2.26 | 1.60 × 10−04 | 2.09 | 1.73 × 10⁻¹⁸ | 4.72 |
| TPI1 | 1.65 × 10−08 | −2.27 | 5.61 × 10−04 | 2.08 | 6.52 × 10⁻¹⁶ | 4.72 |
| RPL23AP42 | 3.77 × 10−07 | −2.21 | 8.40 × 10−04 | 2.16 | 8.65 × 10⁻¹⁴ | 4.78 |
| RPS23 | 5.34 × 10−06 | −2.46 | 1.17 × 10−03 | 2.92 | 9.16 × 10⁻¹¹ | 7.19 |
| MT-TI | 4.64 × 10−05 | 3.44 | 1.19 × 10⁻¹⁵ | −3.67 | 6.36 × 10⁻²⁰ | −12.6 |
| SNORA81 | 2.28 × 10−04 | 33.3 | 4.00 × 10⁻¹¹ | −3.39 | 5.12 × 10−07 | −11.3 |
| RNY1 | 2.45 × 10−04 | 2.65 | 4.67 × 10⁻²⁴ | −4.71 | 8.10 × 10⁻²⁷ | −12.5 |
| RNVU1-31 | 5.00 × 10−04 | −4.18 | 3.83 × 10⁻¹⁴ | −17.7 | 7.07 × 10⁻¹³ | −4.23 |
| MT-TM | 6.37 × 10−04 | 3.70 | 2.29 × 10−07 | −2.89 | 2.69 × 10⁻¹¹ | −10.7 |
| TMSB4XP6 | 1.16 × 10−03 | 3.19 | 2.89 × 10−04 | −2.15 | 7.91 × 10−09 | −6.87 |
| (a) | |||||||
|---|---|---|---|---|---|---|---|
| Gene | Area | Genomic Location | Variant | Amino Acid Change | Functional Domain Affected | Gene Expression Altered | Pathogenicity Prediction |
| C2orf91 | 1 | Chr2:41953024 | missense | p.(Arg91Ile) | N | NA | Possibly damaging |
| CCL16 | 1 | Chr17:35978161 | missense | p.(Cys60Ser) | Y | NA | Probably damaging |
| PAG1 | 1 | Chr8:80984896 | synonymous | p.(Pro252=) | Y | NA | Unknown |
| VPS13D | 1 | Chr1:12283596 | missense | p.(Phe1832Val) | N | - | Probably damaging |
| VPS4B | 1 | Chr18:63400074 | missense | p.(Lys255Thr) | Y | NA | Probably damaging |
| ZNF750 | 1 | Chr17:82830337 | synonymous | p.(Pro659=) | N | NA | Unknown |
| RIMBP3C | 2 | Chr22:21546513 | missense | p.(Arg1488Ser) | N | NA | Possibly Damaging |
| SPATA31A5 | 2 | Chr9:60919364 | missense | p.(Leu970Phe) | N | - | Possibly Damaging |
| CCDC27 | 3 | Chr1:3752496 | synonymous | p.(Ile5=) | N | + | Unknown |
| LETM2 | 3 | Chr8:38400906 | synonymous | p.(Leu279=) | Y | + | Unknown |
| NTRK2 | 3 | Chr9:84670796 | missense | p.(Trp16Cys) | N | NA | Possibly Damaging |
| (b) | |||||
|---|---|---|---|---|---|
| Gene | Area | Genomic Location | Variant | Amino Acid Change | Functional Domain Affected |
| CSK | 2 | Chr15:74798671 | frameshift | p.(Glu25fs) | Y |
| TSPAN9 | 2 | Chr12:3283047 | frameshift | p.(Leu218fs) | Y |
| (c) | |||||
|---|---|---|---|---|---|
| Gene | Area | Genomic Location | Variant | Gene Expression Altered | IMPACT |
| MAP3K2 | 1 | Chr2:127387525 | intron | - | Modifier |
| RIPK3 | 1 | Chr14:24332669 or Chr14:24332869 | downstream gene | + | Modifier |
| RNPS1 | 1 | Chr16:2266329 | intron | - | Modifier |
| SNX32 | 1 | Chr11:65832561 | upstream gene | - | Modifier |
| AC138649.1 | 2 | Chr15:22768761 | intron | NA | Modifier |
| FAM157B | 2 | Chr9:138231054 | non-coding transcript exon | + | Modifier |
| FANCD2P2 | 2 | Chr3:11871392 | non-coding transcript exon | + | Modifier |
| LAIR1 | 2 | Chr19:54358582 | intron | NA | Modifier |
| NFAM1 | 2 | Chr22:42432412 | upstream gene | + | Modifier |
| TET2 | 2 | Chr4:105241954 | intron | NA | Modifier |
| TMEM114 | 2 | Chr16:8569715 | 3 prime UTR | NA | Modifier |
| MOCS2 | 3 | Chr5:53109455 | 5 prime UTR | - | Unknown |
| PSMB2 | 3 | Chr1:35641574 | 5 prime UTR | NA | Modifier |
| RUFY1 | 3 | Chr5:179608552 | intron | - | Modifier |
| WDR6 | 3 | Chr3:49005134 | upstream gene | NA | Modifier |
| Z82190.2 | 3 | Chr22:31821630 | intron | NA | Modifier |
| Location | Chromosome | Start Position | End Position | Raw Copy Number | Genes | Role in Tumorigenesis |
|---|---|---|---|---|---|---|
| Area1 | chr17 | 81509970 | 81523847 | 3.151914 | ACTG1 | Anti-apoptosis, motility [64,65] |
| Area1 | chr17 | 81887843 | 81891586 | 3.151914 | ALYREF | Genomic stability [66] |
| Area1 | chr14 | 20455190 | 20457772 | 4.883921 | APEX1 | Base-excision repair [49] |
| Area1 | chr17 | 81867720 | 81871406 | 3.151914 | ARHGDIA | Invasiveness, metastasis [67] |
| Area1 | chr12 | 7080208 | 7092607 | 5.842557 | C1R | Inflammation [68] |
| Area1 | chr17 | 79778131 | 79787983 | 3.109085 | CBX2 | Transcription [69] |
| Area1 | chr17 | 50183288 | 50201632 | 3.060268 | COL1A1 | Metastasis [70] |
| Area1 | chr17 | 82078332 | 82098332 | 3.562293 | FASN | Metabolism [71] |
| Area1 | chr7 | 128830376 | 128859274 | 3.66148 | FLNC | Invasiveness [72] |
| Area1 | chr17 | 82050690 | 82057470 | 3.562293 | GPS1 | COP9 signalosome subunit/ubiquitin-proteasome pathway |
| Area1 | chr19 | 11164266 | 11197791 | 7.563794 | KANK2 | Cytoskeleton formation [73] |
| Area1 | chrX | 54807598 | 54816012 | 3.320925 | MAGED2 | Cell-cycle regulator [74] |
| Area1 | chrX | 55452104 | 55453566 | 3.320925 | MAGEH1 | Proliferation [75] |
| Area1 | chr7 | 100092727 | 100101940 | 4.16605 | MCM7 | Proliferation [76] |
| Area1 | chr14 | 22836556 | 22849027 | 4.136412 | MMP14 | Invasiveness, metastasis [77] |
| Area1 | chr14 | 39175182 | 39183218 | 3.038443 | PNN | Splicing [51] |
| Area1 | chr9 | 107283136 | 107332194 | 14.61502 | RAD23B | Nucleotide-excision repair [53] |
| Area1 | chr18 | 49488452 | 49492523 | 3.095593 | RPL17 | Ribosome biogenesis, protein translation [61] |
| Area1 | chrX | 54814369 | 54814497 | 3.320925 | SNORA11 | Maturation of ribosomal RNA [62] |
| Area1 | chr7 | 102194075 | 102194164 | 4.159154 | SNORA48 | Maturation of ribosomal RNA |
| Area1 | chr2 | 5692666 | 5701385 | 3.929294 | SOX11 | Transcription |
| Area1 | chr17 | 76734114 | 76737374 | 3.109085 | SRSF2 | Splicing [54] |
| Area1 | chr9 | 35099775 | 35103195 | 3.374564 | STOML2 | Anti-apoptosis [78] |
| Area1 | chr17 | 61399895 | 61409466 | 3.52571 | TBX2 | Transcription [79] |
| Area1 | chr19 | 58544090 | 58550722 | 3.012426 | TRIM28 | Proliferation [80] |
| Area1 | chr9 | 35056063 | 35073249 | 3.374564 | VCP | Protein degradation [81] |
| Area1 | chr7 | 101162508 | 101165593 | 4.159154 | VGF | Transcription [82] |
| Area2 | chr2 | 47335314 | 47335514 | 4.114423 | BCYRN1 | Transcription [56] |
| Area2 | chr6 | 73515749 | 73523797 | 3.582945 | EEF1A1 | Translation [57] |
| Area2 | chr19 | 3976055 | 3985469 | 3.359182 | EEF2 | Translation [58] |
| Area2 | chr1 | 150574550 | 150579738 | 4.140715 | MCL1 | Anti-apoptosis [83] |
| Area2 | chr1 | 151399533 | 151401944 | 4.140715 | PSMB4 | Proteasomal function [59] |
| Area2 | chr11 | 67583594 | 67586660 | 3.211531 | GSTP1 | Metabolism [84] |
| Area2 | chr15 | 65296050 | 65296166 | 3.976034 | RNU5A-1 | RNA processing |
| Area2 | chr15 | 65304676 | 65304792 | 3.976034 | RNU5B-1 | RNA processing |
| Area2 | chr7 | 148983754 | 148983856 | 3.383375 | RNY3 | RNA processing |
| Area2 | chr13 | 27251308 | 27256691 | 6.141368 | RPL21 | Ribosome biogenesis, protein translation |
| Area2 | chr9 | 19375714 | 19380254 | 3.739665 | RPS6 | Ribosome biogenesis, protein translation |
| Area2 | chr2 | 24273613 | 24273741 | 4.326829 | SCARNA21 | RNA processing |
| Area2 | chr15 | 78091171 | 78091297 | 3.898802 | SNORA63 | Maturation of ribosomal RNA |
| Area2 | chr1 | 12221147 | 12221271 | 3.552826 | SNORA70 | Maturation of ribosomal RNA |
| Area2 | chr2 | 10446713 | 10446849 | 4.496897 | SNORA80B | Maturation of ribosomal RNA |
| Area2 | chr12 | 124911603 | 124917368 | 3.034233 | UBC | Ubiquitin homeostasis [85] |
| Area3 | chr16 | 28823034 | 28837237 | 5.159031 | ATXN2L | Stress granule regulator [86] |
| Area3 | chr9 | 136862118 | 136866286 | 3.830137 | EDF1 | Transcription |
| Area3 | chr11 | 2129111 | 2141238 | 7.774932 | IGF2 | Proliferation [87] |
| Area3 | chr11 | 2608327 | 2699994 | 7.774932 | KCNQ1OT1 | Transcription [88] |
| Area3 | chr11 | 2134133 | 2134209 | 7.774932 | MIR483 | Transcription [89] |
| Area3 | chr9 | 127447673 | 127451405 | 3.212283 | RPL12 | Ribosome biogenesis, protein translation |
| Area3 | chr19 | 49487553 | 49492308 | 3.051258 | RPL13A | Ribosome biogenesis, protein translation |
| Area3 | chr19 | 48615327 | 48619536 | 3.174325 | RPL18 | Ribosome biogenesis, protein translation |
| Area3 | chr1 | 6181268 | 6209389 | 3.792397 | RPL22 | Ribosome biogenesis, protein translation |
| Area3 | chr17 | 74203581 | 74210655 | 3.363835 | RPL38 | Ribosome biogenesis, protein translation |
| Area3 | chr11 | 809646 | 812880 | 3.117378 | RPLP2 | Ribosome biogenesis, protein translation |
| Area3 | chr19 | 49496364 | 49499689 | 3.051258 | RPS11 | Ribosome biogenesis, protein translation |
| Area3 | chr19 | 39433206 | 39435948 | 3.408557 | RPS16 | Ribosome biogenesis, protein translation |
| Area3 | chr16 | 1962051 | 1964860 | 3.301972 | RPS2 | Ribosome biogenesis, protein translation |
| Area3 | chr19 | 8321157 | 8323340 | 3.044231 | RPS28 | Ribosome biogenesis, protein translation |
| Area3 | chr17 | 76557765 | 76565348 | 3.374444 | SNHG16 | Transcription [90] |
| Area3 | chr16 | 1962333 | 1962466 | 3.301972 | SNORA10 | Maturation of ribosomal RNA |
| Area3 | chr2 | 30187433 | 30187566 | 3.83836 | SNORA10B | Maturation of ribosomal RNA |
| Area3 | chr9 | 136726104 | 136726234 | 3.830137 | SNORA17B | Maturation of ribosomal RNA |
| Area3 | chrY | 16138247 | 16138379 | 3.968437 | SNORA20 | Maturation of ribosomal RNA |
| Area3 | chr16 | 1965183 | 1965310 | 3.301972 | SNORA78 | Maturation of ribosomal RNA |
| Area3 | chr19 | 10109756 | 10109835 | 5.45924 | SNORD105B | Ribosomal RNA modification [63] |
| Area3 | chr19 | 49490614 | 49490699 | 3.051258 | SNORD33 | Ribosomal RNA modification |
| Area3 | chr14 | 21397291 | 21397401 | 3.835309 | SNORD8 | Ribosomal RNA modification |
| Area3 | chr14 | 21392149 | 21392253 | 3.835309 | SNORD9 | Ribosomal RNA modification |
© 2020 by the authors. Licensee MDPI, Basel, Switzerland. This article is an open access article distributed under the terms and conditions of the Creative Commons Attribution (CC BY) license (http://creativecommons.org/licenses/by/4.0/).
Share and Cite
Moon, C.-I.; Tompkins, W.; Wang, Y.; Godec, A.; Zhang, X.; Pipkorn, P.; Miller, C.A.; Dehner, C.; Dahiya, S.; Hirbe, A.C. Unmasking Intra-Tumoral Heterogeneity and Clonal Evolution in NF1-MPNST. Genes 2020, 11, 499. https://doi.org/10.3390/genes11050499
Moon C-I, Tompkins W, Wang Y, Godec A, Zhang X, Pipkorn P, Miller CA, Dehner C, Dahiya S, Hirbe AC. Unmasking Intra-Tumoral Heterogeneity and Clonal Evolution in NF1-MPNST. Genes. 2020; 11(5):499. https://doi.org/10.3390/genes11050499
Chicago/Turabian StyleMoon, Chang-In, William Tompkins, Yuxi Wang, Abigail Godec, Xiaochun Zhang, Patrik Pipkorn, Christopher A. Miller, Carina Dehner, Sonika Dahiya, and Angela C. Hirbe. 2020. "Unmasking Intra-Tumoral Heterogeneity and Clonal Evolution in NF1-MPNST" Genes 11, no. 5: 499. https://doi.org/10.3390/genes11050499