A Gene-Set Enrichment and Protein–Protein Interaction Network-Based GWAS with Regulatory SNPs Identifies Candidate Genes and Pathways Associated with Carcass Traits in Hanwoo Cattle

 , ,
, ,
Abstract
:1. Introduction
2. Materials and Methods
2.1. Animals and Phenotypes
2.2. SNP Genotyping, Imputation, and Filtering for Regulatory SNPs
2.3. Genome-Wide Association Analysis, Heritability, and Variance Component Estimation
2.4. Gene-Set Enrichment Analysis and Protein–Protein Interaction Analysis
3. Results and Discussion
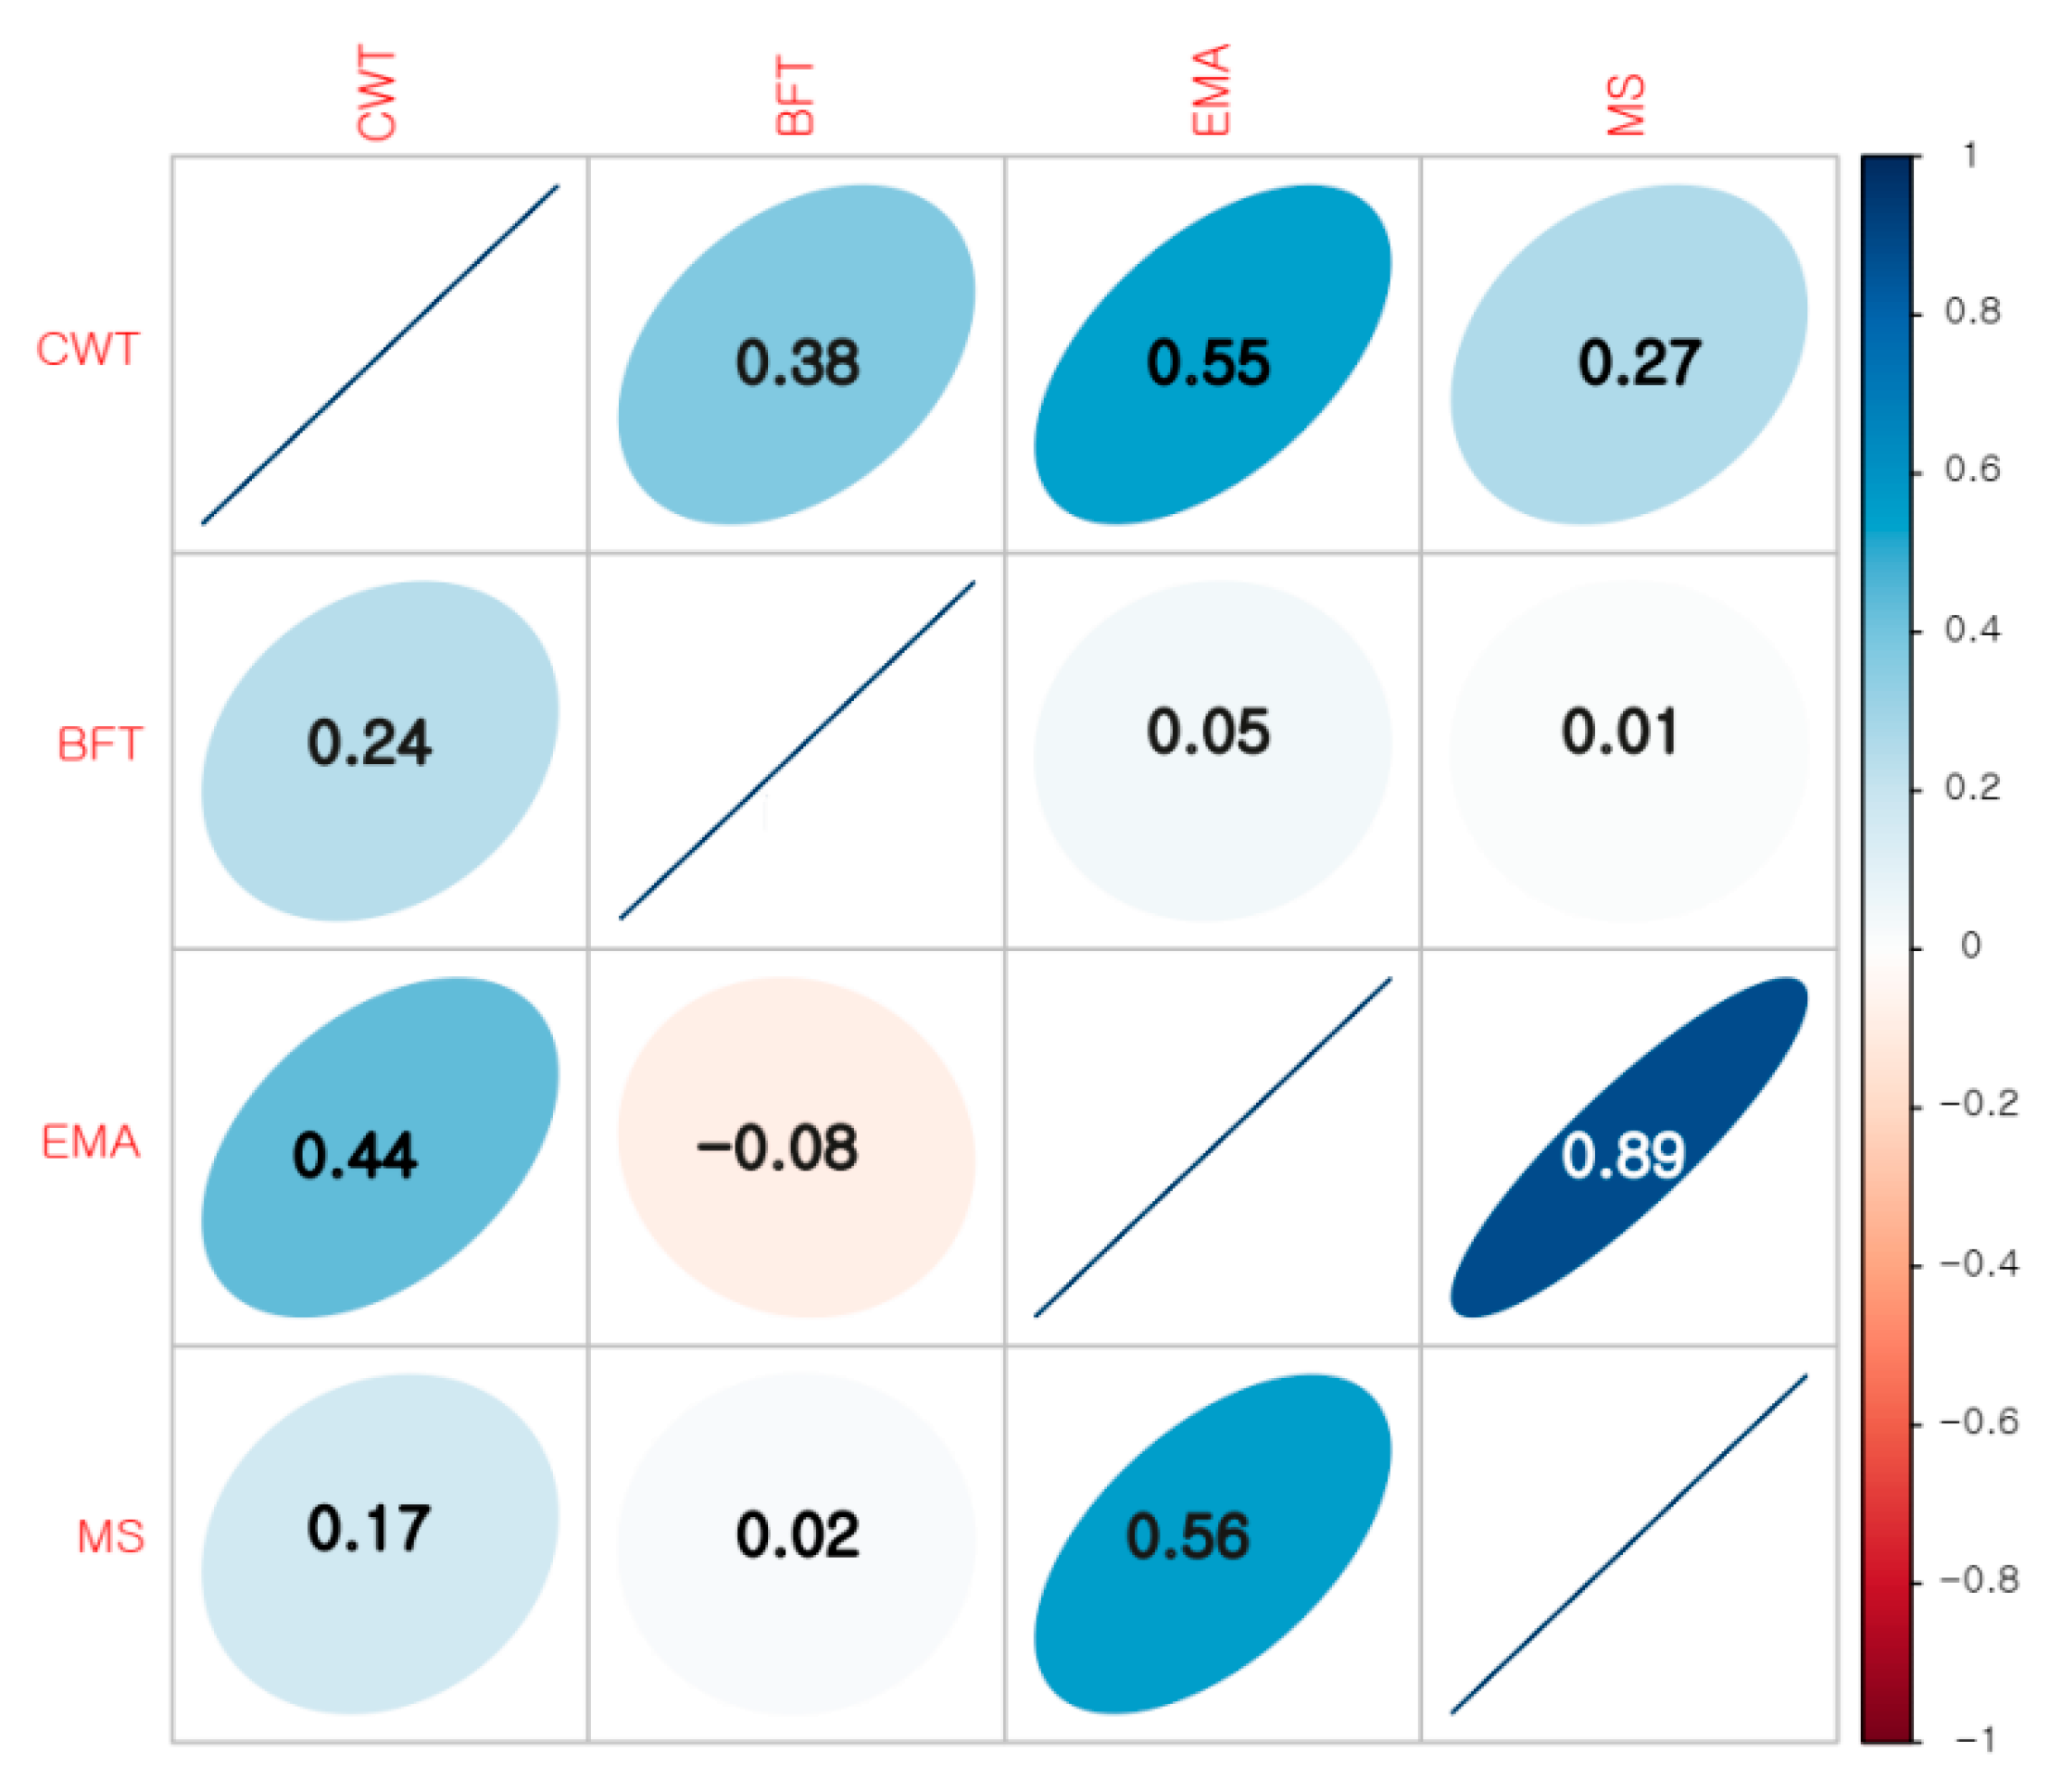
3.1. Phenotypes and Genomic Heritability Estimates
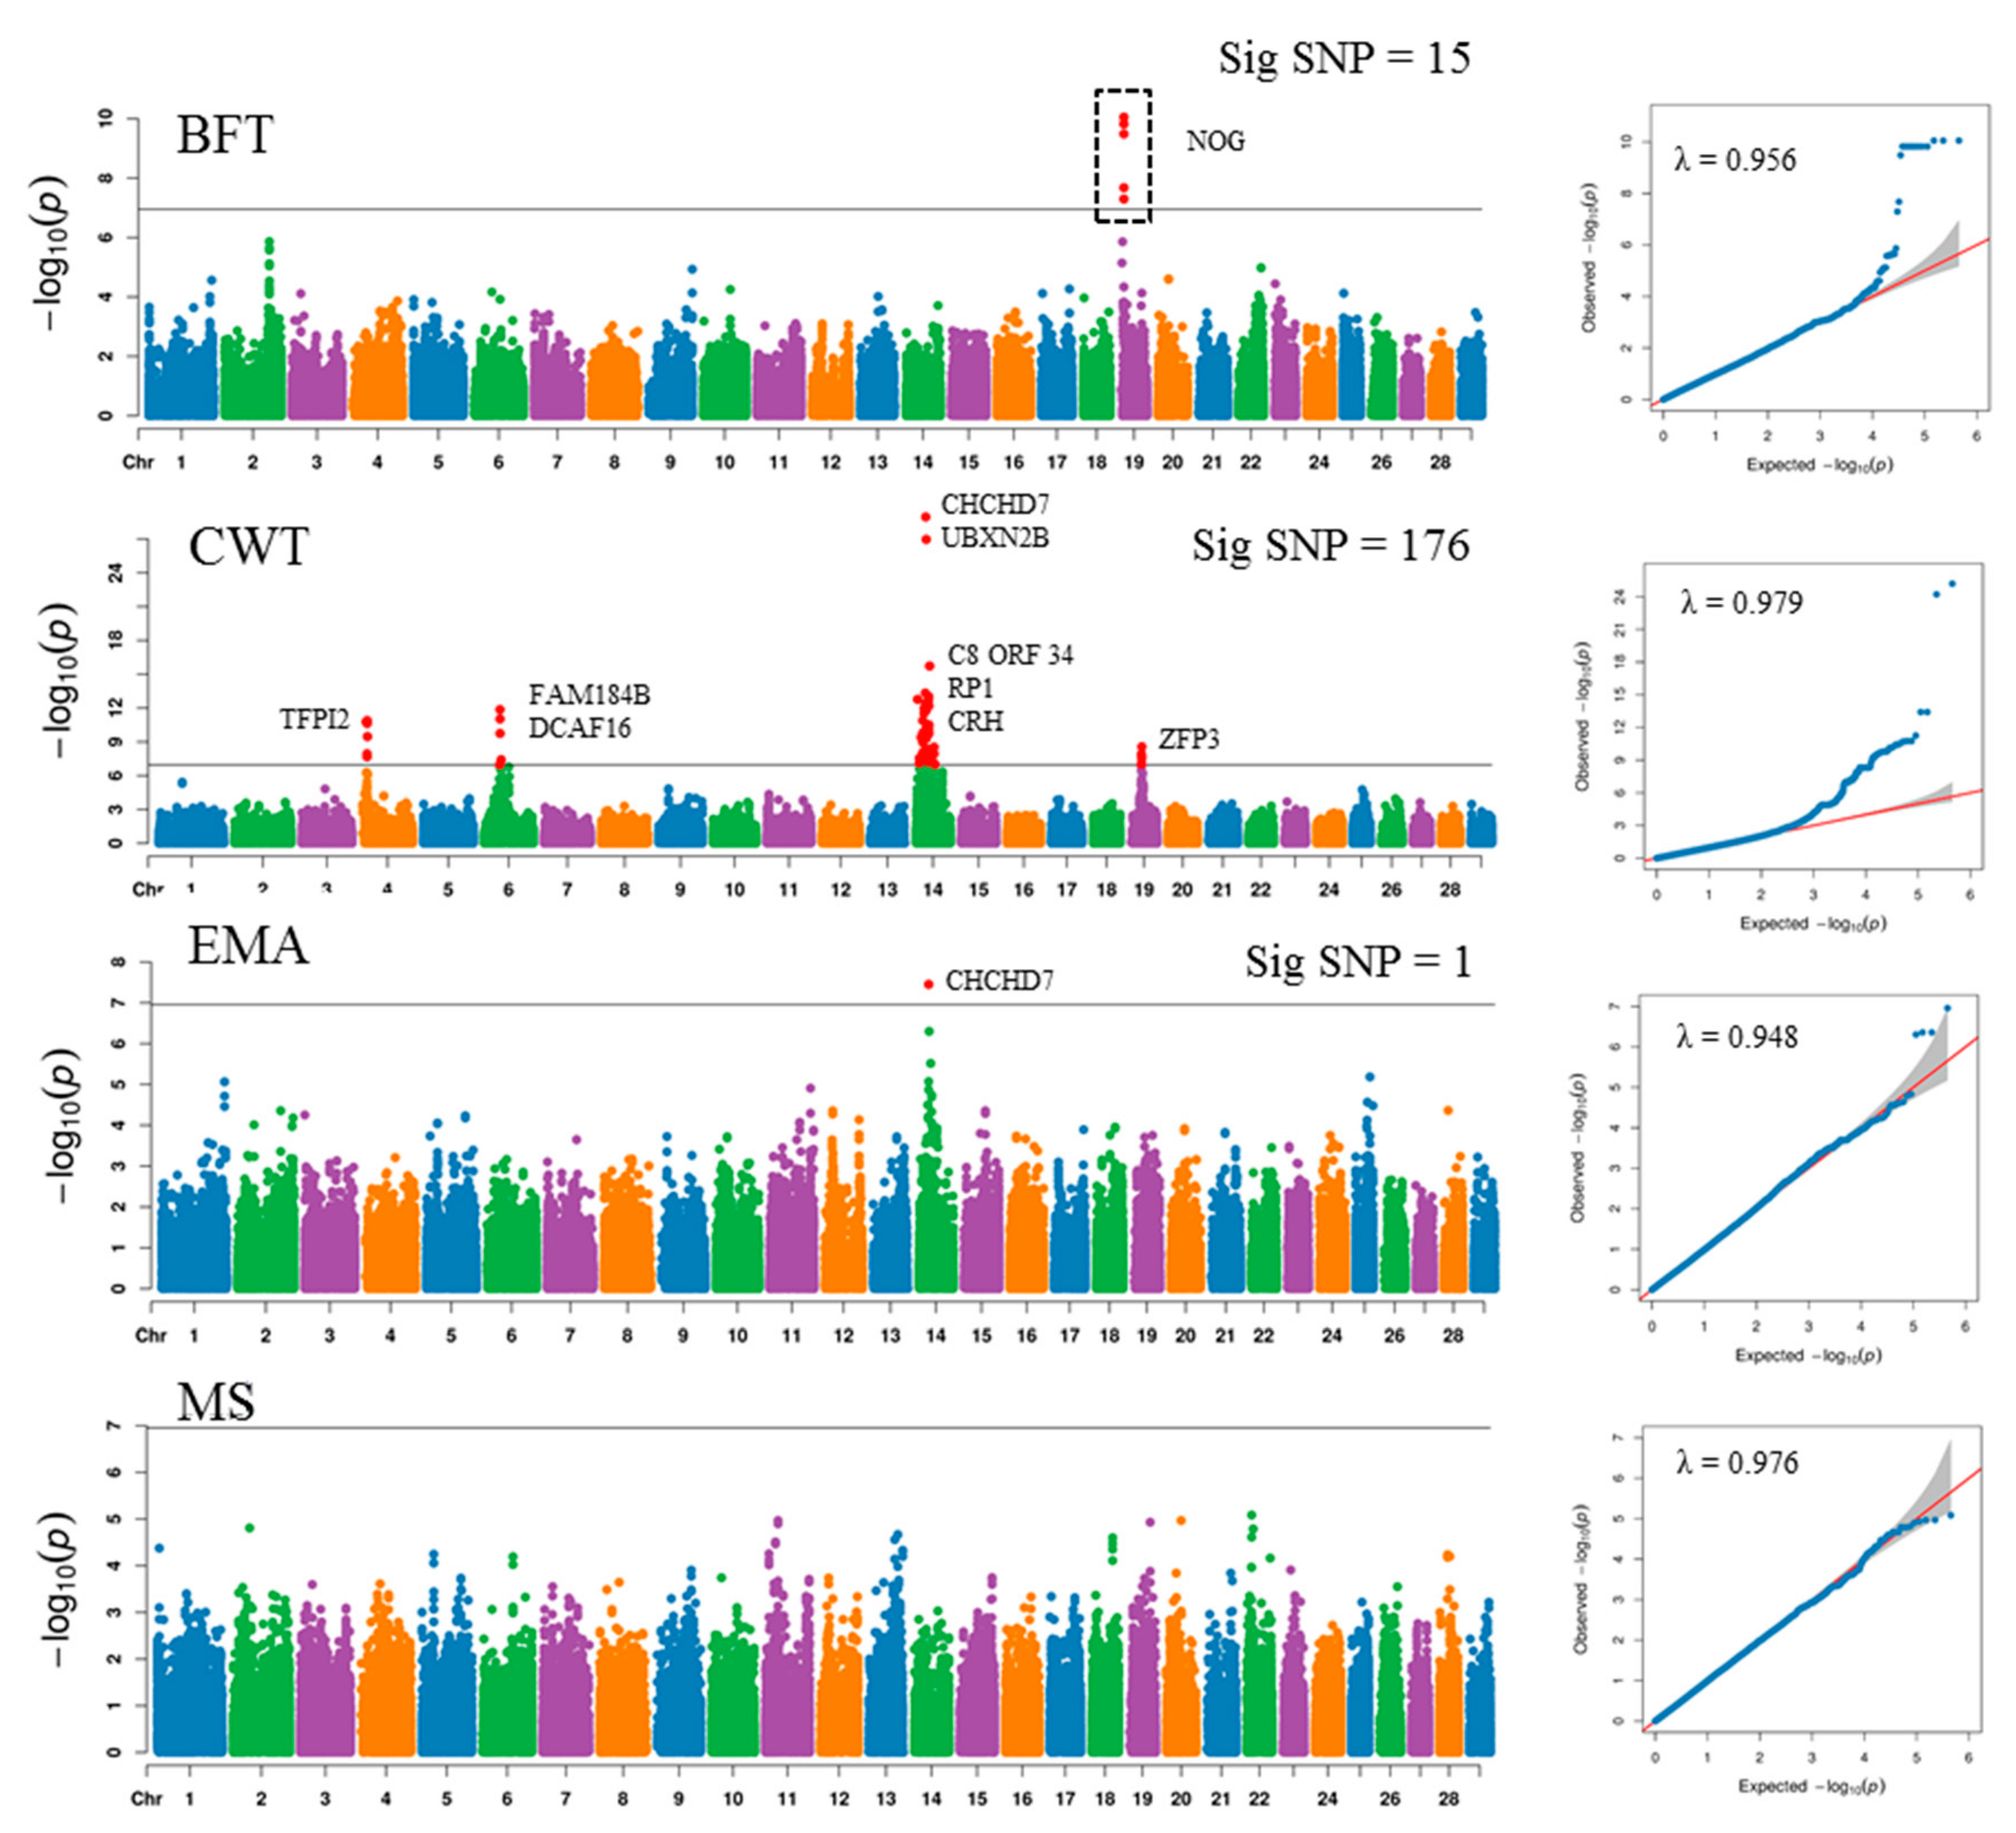
3.2. Genome-Wide Association Study
3.3. Contribution of Genomic Variants
3.4. Gene-Set Enrichment and Protein–Protein Interaction Network Analysis Analyses
3.5. Calcium Signaling Pathway
3.6. ECM Receptor Interaction, PI3K-Akt Signaling, and Pathways in Cancer
3.7. Other Important Pathways and Terms Enriched
4. Conclusions
Supplementary Materials
Author Contributions
Funding
Acknowledgments
Conflicts of Interest
References
- Bhuiyan, M.S.A.; Lim, D.; Park, M.; Lee, S.; Kim, Y.; Gondro, C.; Park, B.; Lee, S. Functional partitioning of genomic variance and genome-wide association study for carcass traits in Korean Hanwoo cattle using imputed sequence level SNP data. Front. Genet. 2018, 9. [Google Scholar] [CrossRef]
- Jo, C.; Cho, S.; Chang, J.; Nam, K. Keys to production and processing of Hanwoo beef: A perspective of tradition and science. Anim. Front. 2012, 2, 32–38. [Google Scholar] [CrossRef]
- Mehrban, H.; Lee, D.H.; Moradi, M.H.; IlCho, C.; Naserkheil, M.; Ibáñez-Escriche, N. Predictive performance of genomic selection methods for carcass traits in Hanwoo beef cattle: Impacts of the genetic architecture. Genet. Sel. Evol. 2017, 49, 1. [Google Scholar] [CrossRef] [Green Version]
- Lee, S.-H.; Park, B.-H.; Sharma, A.; Dang, C.-G.; Lee, S.-S.; Choi, T.-J.; Choy, Y.-H.; Kim, H.-C.; Jeon, K.-J.; Kim, S.-D. Hanwoo cattle: Origin, domestication, breeding strategies and genomic selection. J. Anim. Sci. Technol. 2014, 56, 2. [Google Scholar] [CrossRef] [PubMed] [Green Version]
- Srikanth, K.; Lee, E.; Kwon, A.; Jang, G.; Chung, H. Association of a single nucleotide polymorphism in the calneuron 1 gene on meat quality and carcass traits in Hanwoo (Bos taurus coreanae). J. Anim. Plant Sci. 2018, 28, 651–655. [Google Scholar]
- Kwon, A.; Srikanth, K.; Lee, E.; Kim, S.; Chung, H. Confirmation of genotypic effects for the bovine APM1 gene on marbling in Hanwoo cattle. J. Anim. Sci. Technol. 2016, 58, 15. [Google Scholar] [CrossRef] [PubMed] [Green Version]
- Fan, H.; Wu, Y.; Zhou, X.; Xia, J.; Zhang, W.; Song, Y.; Liu, F.; Chen, Y.; Zhang, L.; Gao, X. Pathway-based genome-wide association studies for two meat production traits in Simmental cattle. Sci. Rep. 2015, 5, 18389. [Google Scholar] [CrossRef] [Green Version]
- Lee, S.H.; Choi, B.H.; Lim, D.; Gondro, C.; Cho, Y.M.; Dang, C.G.; Sharma, A.; Jang, G.W.; Lee, K.T.; Yoon, D. Genome-wide association study identifies major loci for carcass weight on BTA14 in Hanwoo (Korean cattle). PLoS ONE 2013, 8, e74677. [Google Scholar] [CrossRef] [Green Version]
- Hyeong, K.-E.; Lee, Y.-M.; Kim, Y.-S.; Nam, K.; Jo, C.; Lee, K.-H.; Lee, J.-E.; Kim, J.-J. A whole genome association study on meat palatability in Hanwoo. Asian Australas. J. Anim. Sci. 2014, 27, 1219. [Google Scholar] [CrossRef] [Green Version]
- Dang, C.; Cho, S.; Sharma, A.; Kim, H.; Jeon, G.; Yeon, S.; Hong, S.; Park, B.; Kang, H.; Lee, S. Genome-wide association study for Warner-Bratzler shear force and sensory traits in Hanwoo (Korean cattle). Asian Australas. J. Anim. Sci. 2014, 27, 1328. [Google Scholar] [CrossRef] [Green Version]
- Lee, S.; Choi, B.; Cho, S.; Lim, D.; Choi, T.; Park, B.; Lee, J.; Gondro, C.; Sharma, A.; Dang, C. Genome-wide association study identifies three loci for intramuscular fat in Hanwoo (Korean cattle). Livest. Sci. 2014, 165, 27–32. [Google Scholar] [CrossRef]
- Koufariotis, L.; Chen, Y.-P.P.; Bolormaa, S.; Hayes, B.J. Regulatory and coding genome regions are enriched for trait associated variants in dairy and beef cattle. BMC Genom. 2014, 15, 436. [Google Scholar] [CrossRef] [PubMed] [Green Version]
- Dadousis, C.; Pegolo, S.; Rosa, G.; Gianola, D.; Bittante, G.; Cecchinato, A. Pathway-based genome-wide association analysis of milk coagulation properties, curd firmness, cheese yield, and curd nutrient recovery in dairy cattle. J. Dairy Sci. 2017, 100, 1223–1231. [Google Scholar] [CrossRef] [PubMed]
- Crawford, L.; Zeng, P.; Mukherjee, S.; Zhou, X. Detecting epistasis with the marginal epistasis test in genetic mapping studies of quantitative traits. PLoS Genet. 2017, 13, e1006869. [Google Scholar] [CrossRef] [Green Version]
- Hirschhorn, J.N. Genomewide association studies—Illuminating biologic pathways. N. Engl. J. Med. 2009, 360, 1699. [Google Scholar] [CrossRef] [Green Version]
- Gambra, R.; Peñagaricano, F.; Kropp, J.; Khateeb, K.; Weigel, K.; Lucey, J.; Khatib, H. Genomic architecture of bovine κ-casein and β-lactoglobulin. J. Dairy Sci. 2013, 96, 5333–5343. [Google Scholar] [CrossRef] [Green Version]
- De Almeida Santana, M.H.; Junior, G.A.O.; Cesar, A.S.M.; Freua, M.C.; da Costa Gomes, R.; e Silva, S.D.L.; Leme, P.R.; Fukumasu, H.; Carvalho, M.E.; Ventura, R.V. Copy number variations and genome-wide associations reveal putative genes and metabolic pathways involved with the feed conversion ratio in beef cattle. J. Appl. Genet. 2016, 57, 495–504. [Google Scholar] [CrossRef] [Green Version]
- Lin, P.-L.; Yu, Y.-W.; Chung, R.-H. Pathway analysis incorporating protein-protein interaction networks identified candidate pathways for the seven common diseases. PLoS ONE 2016, 11, e0162910. [Google Scholar] [CrossRef]
- Alvarez-Castro, J.M.; Le Rouzic, A.; Carlborg, Ö. How to perform meaningful estimates of genetic effects. PLoS Genet. 2008, 4, e1000062. [Google Scholar] [CrossRef] [Green Version]
- Phillips, P.C. Epistasis—The essential role of gene interactions in the structure and evolution of genetic systems. Nat. Rev. Genet. 2008, 9, 855. [Google Scholar] [CrossRef] [Green Version]
- Dadousis, C.; Pegolo, S.; Rosa, G.J.; Bittante, G.; Cecchinato, A. Genome-wide association and pathway-based analysis using latent variables related to milk protein composition and cheesemaking traits in dairy cattle. J. Dairy Sci. 2017, 100, 9085–9102. [Google Scholar] [CrossRef] [PubMed]
- Wang, L.; Jia, P.; Wolfinger, R.D.; Chen, X.; Zhao, Z. Gene set analysis of genome-wide association studies: Methodological issues and perspectives. Genomics 2011, 98, 1–8. [Google Scholar] [CrossRef] [PubMed] [Green Version]
- Brodie, A.; Azaria, J.R.; Ofran, Y. How far from the SNP may the causative genes be? Nucleic Acids Res. 2016, 44, 6046–6054. [Google Scholar] [CrossRef] [PubMed]
- Yano, K.; Yamamoto, E.; Aya, K.; Takeuchi, H.; Lo, P.-C.; Hu, L.; Yamasaki, M.; Yoshida, S.; Kitano, H.; Hirano, K. Genome-wide association study using whole-genome sequencing rapidly identifies new genes influencing agronomic traits in rice. Nat. Genet. 2016, 48, 927. [Google Scholar] [CrossRef] [PubMed]
- Ha, N.-T.; Gross, J.J.; van Dorland, A.; Tetens, J.; Thaller, G.; Schlather, M.; Bruckmaier, R.; Simianer, H. Gene-based mapping and pathway analysis of metabolic traits in dairy cows. PLoS ONE 2015, 10, e0122325. [Google Scholar] [CrossRef] [PubMed] [Green Version]
- Pickrell, J.K.; Marioni, J.C.; Pai, A.A.; Degner, J.F.; Engelhardt, B.E.; Nkadori, E.; Veyrieras, J.-B.; Stephens, M.; Gilad, Y.; Pritchard, J.K. Understanding mechanisms underlying human gene expression variation with RNA sequencing. Nature 2010, 464, 768. [Google Scholar] [CrossRef] [PubMed]
- Hindorff, L.A.; Sethupathy, P.; Junkins, H.A.; Ramos, E.M.; Mehta, J.P.; Collins, F.S.; Manolio, T.A. Potential etiologic and functional implications of genome-wide association loci for human diseases and traits. Proc. Natl. Acad. Sci. USA 2009, 106, 9362–9367. [Google Scholar] [CrossRef] [Green Version]
- Kindt, A.S.; Navarro, P.; Semple, C.A.; Haley, C.S. The genomic signature of trait-associated variants. BMC Genom. 2013, 14, 108. [Google Scholar] [CrossRef] [Green Version]
- Bhuiyan, M.; Kim, H.; Lee, D.; Lee, S.; Cho, S.; Yang, B.; Kim, S.; Lee, S. Genetic parameters of carcass and meat quality traits in different muscles (longissimus dorsi and semimembranosus) of Hanwoo (Korean cattle). J. Anim. Sci. 2017, 95, 3359–3369. [Google Scholar]
- Loh, P.-R.; Danecek, P.; Palamara, P.F.; Fuchsberger, C.; Reshef, Y.A.; Finucane, H.K.; Schoenherr, S.; Forer, L.; McCarthy, S.; Abecasis, G.R. Reference-based phasing using the haplotype reference consortium panel. Nat. Genet. 2016, 48, 1443. [Google Scholar] [CrossRef] [Green Version]
- Das, S.; Forer, L.; Schönherr, S.; Sidore, C.; Locke, A.E.; Kwong, A.; Vrieze, S.I.; Chew, E.Y.; Levy, S.; McGue, M. Next-generation genotype imputation service and methods. Nat. Genet. 2016, 48, 1284. [Google Scholar] [CrossRef] [PubMed] [Green Version]
- Al Kalaldeh, M.; Gibson, J.; Duijvesteijn, N.; Daetwyler, H.D.; MacLeod, I.; Moghaddar, N.; Lee, S.H.; van der Werf, J.H. Using imputed whole-genome sequence data to improve the accuracy of genomic prediction for parasite resistance in Australian sheep. Genet. Sel. Evol. 2019, 51, 32. [Google Scholar] [CrossRef] [PubMed] [Green Version]
- Bedhane, M.; van der Werf, J.; Gondro, C.; Duijvesteijn, N.; Lim, D.; Park, B.; Park, M.N.; Hee, R.S.; Clark, S. Genome-wide association study of meat quality traits in Hanwoo beef cattle using imputed whole-genome sequence data. Front. Genet. 2019, 10, 1235. [Google Scholar] [CrossRef]
- Elsik, C.G.; Unni, D.R.; Diesh, C.M.; Tayal, A.; Emery, M.L.; Nguyen, H.N.; Hagen, D.E. Bovine genome database: New tools for gleaning function from the Bos taurus genome. Nucleic Acids Res. 2015, 44, D834–D839. [Google Scholar] [CrossRef] [Green Version]
- Cingolani, P.; Platts, A.; Wang, L.L.; Coon, M.; Nguyen, T.; Wang, L.; Land, S.J.; Lu, X.; Ruden, D.M. A program for annotating and predicting the effects of single nucleotide polymorphisms, SnpEff: SNPs in the genome of Drosophila melanogaster strain w1118; iso-2; iso-3. Fly 2012, 6, 80–92. [Google Scholar] [CrossRef] [PubMed] [Green Version]
- Ruden, D.M.; Cingolani, P.; Patel, V.M.; Coon, M.; Nguyen, T.; Land, S.J.; Lu, X. Using Drosophila melanogaster as a model for genotoxic chemical mutational studies with a new program, SnpSift. Front. Genet. 2012, 3, 35. [Google Scholar]
- Hou, L.; Zhao, H. A review of post-GWAS prioritization approaches. Front. Genet. 2013, 4. [Google Scholar] [CrossRef] [PubMed] [Green Version]
- Purcell, S.; Chang, C. PLINK 1.9. URL. Available online: https://www.cog-genomics.org/plink2 (accessed on 23 October 2019).
- Yang, J.; Lee, S.H.; Goddard, M.E.; Visscher, P.M. GCTA: A tool for genome-wide complex trait analysis. Am. J. Hum. Genet. 2011, 88, 76–82. [Google Scholar] [CrossRef] [PubMed] [Green Version]
- Yin, L. CMplot: Circle Manhattan Plot. 2018. Available online: https://github.com/YinLiLin/R-CMplot (accessed on 26 October 2019).
- Zeng, J.; Xue, A.; Jiang, L.; Lloyd-Jones, L.R.; Wu, Y.; Wang, H.; Zheng, Z.; Yengo, L.; Kemper, K.E.; Goddard, M.E. Bayesian analysis of GWAS summary data reveals differential signatures of natural selection across human complex traits and functional genomic categories. bioRxiv 2019, 752527. [Google Scholar] [CrossRef]
- Erbe, M.; Hayes, B.; Matukumalli, L.; Goswami, S.; Bowman, P.; Reich, C.; Mason, B.; Goddard, M. Improving accuracy of genomic predictions within and between dairy cattle breeds with imputed high-density single nucleotide polymorphism panels. J. Dairy Sci. 2012, 95, 4114–4129. [Google Scholar] [CrossRef] [Green Version]
- Ashburner, M.; Ball, C.A.; Blake, J.A.; Botstein, D.; Butler, H.; Cherry, J.M.; Davis, A.P.; Dolinski, K.; Dwight, S.S.; Eppig, J.T. Gene ontology: Tool for the unification of biology. Nat. Genet. 2000, 25, 25–29. [Google Scholar] [CrossRef] [PubMed] [Green Version]
- Ogata, H.; Goto, S.; Sato, K.; Fujibuchi, W.; Bono, H.; Kanehisa, M. KEGG: Kyoto encyclopedia of genes and genomes. Nucleic Acids Res. 1999, 27, 29–34. [Google Scholar] [CrossRef] [PubMed] [Green Version]
- Young, M.D.; Wakefield, M.J.; Smyth, G.K.; Oshlack, A. Gene ontology analysis for RNA-seq: Accounting for selection bias. Genome Biol. 2010, 11, R14. [Google Scholar] [CrossRef] [PubMed] [Green Version]
- Szklarczyk, D.; Franceschini, A.; Wyder, S.; Forslund, K.; Heller, D.; Huerta-Cepas, J.; Simonovic, M.; Roth, A.; Santos, A.; Tsafou, K.P. STRING v10: Protein–protein interaction networks, integrated over the tree of life. Nucleic Acids Res. 2014, 43, D447–D452. [Google Scholar] [CrossRef] [PubMed]
- Bindea, G.; Mlecnik, B.; Hackl, H.; Charoentong, P.; Tosolini, M.; Kirilovsky, A.; Fridman, W.-H.; Pagès, F.; Trajanoski, Z.; Galon, J. ClueGO: A Cytoscape plug-in to decipher functionally grouped gene ontology and pathway annotation networks. Bioinformatics 2009, 25, 1091–1093. [Google Scholar] [CrossRef] [PubMed] [Green Version]
- Roh, S.-H.; Kim, C.-Y.; Won, Y.-S.; Park, C.-J.; Lee, S.-S.; Lee, J.-G. Studies on genetic parameter estimation and sire selection to ultrasound measurement traits of Hanwoo. J. Anim. Sci. Technol. 2010, 52, 1–8. [Google Scholar] [CrossRef] [Green Version]
- Hwang, J.M.; Cheong, J.K.; Kim, S.S.; Jung, B.H.; Koh, M.J.; Kim, H.C.; Choy, Y.H. Genetic analysis of ultrasound and carcass measurement traits in a regional Hanwoo steer population. Asian Australas. J. Anim. Sci. 2014, 27, 457. [Google Scholar] [CrossRef] [Green Version]
- Do, C.; Park, B.; Kim, S.; Choi, T.; Yang, B.; Park, S.; Song, H. Genetic parameter estimates of carcass traits under national scale breeding scheme for beef cattle. Asian Australas. J. Anim. Sci. 2016, 29, 1083. [Google Scholar] [CrossRef]
- Kim, J.; Kim, D.; Lee, J.; Lee, C. Genetic relationship between carcass traits and carcass price of Korean cattle. Asian Australas. J. Anim. Sci. 2010, 23, 848–854. [Google Scholar] [CrossRef]
- Hwang, J.-M.; Kim, S.; Choy, Y.-H.; Yoon, H.-B.; Park, C.-J. Genetic parameter estimation of carcass traits of Hanwoo steers. J. Anim. Sci. Technol. 2008, 50, 613–620. [Google Scholar]
- Choi, T.; Alam, M.; Cho, C.; Lee, J.; Park, B.; Kim, S.; Koo, Y.; Roh, S. Genetic parameters for yearling weight, carcass traits, and primal-cut yields of Hanwoo cattle. J. Anim. Sci. 2015, 93, 1511–1521. [Google Scholar] [CrossRef] [PubMed]
- Smith, T.; Domingue, J.; Paschal, J.; Franke, D.; Bidner, T.; Whipple, G. Genetic parameters for growth and carcass traits of Brahman steers. J. Anim. Sci. 2007, 85, 1377–1384. [Google Scholar] [CrossRef] [PubMed]
- Hirooka, H.; Groen, A.F.; Matsumoto, M. Genetic parameters for growth and carcass traits in Japanese Brown cattle estimated from field records. J. Anim. Sci. 1996, 74, 2112–2116. [Google Scholar] [CrossRef] [PubMed] [Green Version]
- Son, J.; Lee, D. Estimation of genetic correlations and selection responses for carcass traits between ultrasound and real carcass measurements in Hanwoo cows. J. Anim. Sci. Technol. 2013, 55, 501–508. [Google Scholar] [CrossRef] [Green Version]
- Schork, A.J.; Thompson, W.K.; Pham, P.; Torkamani, A.; Roddey, J.C.; Sullivan, P.F.; Kelsoe, J.R.; O’Donovan, M.C.; Furberg, H.; Schork, N.J. All SNPs are not created equal: Genome-wide association studies reveal a consistent pattern of enrichment among functionally annotated SNPs. PLoS Genet. 2013, 9, e1003449. [Google Scholar] [CrossRef] [PubMed]
- Yang, J.; Manolio, T.A.; Pasquale, L.R.; Boerwinkle, E.; Caporaso, N.; Cunningham, J.M.; de Andrade, M.; Feenstra, B.; Feingold, E.; Hayes, M.G. Genome partitioning of genetic variation for complex traits using common SNPs. Nat. Genet. 2011, 43, 519. [Google Scholar] [CrossRef]
- Nishimura, S.; Watanabe, T.; Mizoshita, K.; Tatsuda, K.; Fujita, T.; Watanabe, N.; Sugimoto, Y.; Takasuga, A. Genome-wide association study identified three major QTL for carcass weight including the PLAG1-CHCHD7 QTN for stature in Japanese Black cattle. BMC Genet. 2012, 13, 40. [Google Scholar] [CrossRef] [Green Version]
- Karim, L.; Takeda, H.; Lin, L.; Druet, T.; Arias, J.A.; Baurain, D.; Cambisano, N.; Davis, S.R.; Farnir, F.; Grisart, B. Variants modulating the expression of a chromosome domain encompassing PLAG1 influence bovine stature. Nat. Genet. 2011, 43, 405. [Google Scholar] [CrossRef]
- Utsunomiya, Y.T.; Do Carmo, A.S.; Carvalheiro, R.; Neves, H.H.; Matos, M.C.; Zavarez, L.B.; O’Brien, A.M.P.; Sölkner, J.; McEwan, J.C.; Cole, J.B. Genome-wide association study for birth weight in Nellore cattle points to previously described orthologous genes affecting human and bovine height. BMC Genet. 2013, 14, 52. [Google Scholar] [CrossRef] [Green Version]
- De Camargo, G.M.; Costa, R.B.; Lucia, G.; Regitano, L.C.; Baldi, F.; Tonhati, H. Polymorphisms in TOX and NCOA2 genes and their associations with reproductive traits in cattle. Reprod. Fertil. Dev. 2015, 27, 523–528. [Google Scholar] [CrossRef]
- Fortes, M.; Lehnert, S.; Bolormaa, S.; Reich, C.; Fordyce, G.; Corbet, N.; Whan, V.; Hawken, R.; Reverter, A. Finding genes for economically important traits: Brahman cattle puberty. Anim. Prod. Sci. 2012, 52, 143–150. [Google Scholar] [CrossRef]
- Lindholm-Perry, A.K.; Kuehn, L.A.; Oliver, W.T.; Sexten, A.K.; Miles, J.R.; Rempel, L.A.; Cushman, R.A.; Freetly, H.C. Adipose and muscle tissue gene expression of two genes (NCAPG and LCORL) located in a chromosomal region associated with cattle feed intake and gain. PLoS ONE 2013, 8, e80882. [Google Scholar] [CrossRef] [PubMed] [Green Version]
- Setoguchi, K.; Furuta, M.; Hirano, T.; Nagao, T.; Watanabe, T.; Sugimoto, Y.; Takasuga, A. Cross-breed comparisons identified a critical 591-kb region for bovine carcass weight QTL (CW-2) on chromosome 6 and the Ile-442-Met substitution in NCAPG as a positional candidate. BMC Genet. 2009, 10, 43. [Google Scholar] [CrossRef] [PubMed] [Green Version]
- Setoguchi, K.; Watanabe, T.; Weikard, R.; Albrecht, E.; Kühn, C.; Kinoshita, A.; Sugimoto, Y.; Takasuga, A. The SNP c. 1326T > G in the non-SMC condensin I complex, subunit G (NCAPG) gene encoding a p. Ile442Met variant is associated with an increase in body frame size at puberty in cattle. Anim. Genet. 2011, 42, 650–655. [Google Scholar] [CrossRef]
- Eberlein, A.; Takasuga, A.; Setoguchi, K.; Pfuhl, R.; Flisikowski, K.; Fries, R.; Klopp, N.; Fürbass, R.; Weikard, R.; Kühn, C. Dissection of genetic factors modulating fetal growth in cattle indicates a substantial role of the non-SMC condensin I complex, subunit G (NCAPG) gene. Genetics 2009, 183, 951–964. [Google Scholar] [CrossRef] [Green Version]
- Sawant, A.; Chanda, D.; Isayeva, T.; Tsuladze, G.; Garvey, W.T.; Ponnazhagan, S. Noggin is novel inducer of mesenchymal stem cell adipogenesis implications for bone health and obesity. J. Biol. Chem. 2012, 287, 12241–12249. [Google Scholar] [CrossRef] [Green Version]
- Tizioto, P.C.; Decker, J.E.; Taylor, J.F.; Schnabel, R.D.; Mudadu, M.A.; Silva, F.L.; Mourão, G.B.; Coutinho, L.L.; Tholon, P.; Sonstegard, T.S. Genome scan for meat quality traits in Nelore beef cattle. Physiol. Genom. 2013, 45, 1012–1020. [Google Scholar] [CrossRef] [Green Version]
- Moser, G.; Lee, S.H.; Hayes, B.J.; Goddard, M.E.; Wray, N.R.; Visscher, P.M. Simultaneous discovery, estimation and prediction analysis of complex traits using a Bayesian mixture model. PLoS Genet. 2015, 11, e1004969. [Google Scholar] [CrossRef]
- Gomes, R.D.C.; Silva, S.D.L.; Carvalho, M.E.; Rezende, F.M.D.; Pinto, L.F.B.; Santana, M.H.D.A.; Stella, T.R.; Meirelles, F.V.; Rossi Júnior, P.; Leme, P.R. Protein synthesis and degradation gene SNPs related to feed intake, feed efficiency, growth, and ultrasound carcass traits in Nellore cattle. Embrapa Gado De Corte Artigo Em Periódico Indexado ALICE 2013, 12, 2923–2936. [Google Scholar] [CrossRef]
- Ciechanover, A.; Orian, A.; Schwartz, A.L. The ubiquitin-mediated proteolytic pathway: Mode of action and clinical implications. J. Cell. Biochem. 2000, 77, 40–51. [Google Scholar] [CrossRef]
- Nguyen, L.K.; Kolch, W.; Kholodenko, B.N. When ubiquitination meets phosphorylation: A systems biology perspective of EGFR/MAPK signalling. Cell Commun. Signal. 2013, 11, 52. [Google Scholar] [CrossRef] [PubMed] [Green Version]
- Mateescu, R.G.; Garrick, D.J.; Reecy, J.M. Network analysis reveals putative genes affecting meat quality in Angus cattle. Front. Genet. 2017, 8, 171. [Google Scholar] [CrossRef] [PubMed] [Green Version]
- Rolf, M.; Taylor, J.; Schnabel, R.; McKay, S.; McClure, M.; Northcutt, S.; Kerley, M.; Weaber, R. Genome-wide association analysis for feed efficiency in Angus cattle. Anim. Genet. 2012, 43, 367–374. [Google Scholar] [CrossRef] [PubMed] [Green Version]
- Sadkowski, T.; Jank, M.; Zwierzchowski, L.; Oprządek, J.; Motyl, T. Comparison of skeletal muscle transcriptional profiles in dairy and beef breeds bulls. J. Appl. Genet. 2009, 50, 109–123. [Google Scholar] [CrossRef]
- Li, J.; Zhang, L.-P.; Gan, Q.-F.; Li, J.-Y.; Gao, H.-J.; Yuan, Z.-R.; Gao, X.; Chen, J.-B.; Xu, S.-Z. Association of CAST gene polymorphisms with carcass and meat quality traits in Chinese commercial cattle herds. Asian Australas. J. Anim. Sci. 2010, 23, 1405–1411. [Google Scholar] [CrossRef]
- Lee, S.-H.; Kim, S.-C.; Chai, H.-H.; Cho, S.-H.; Kim, H.-C.; Lim, D.; Choi, B.-H.; Dang, C.-G.; Sharma, A.; Gondro, C. Mutations in calpastatin and μ-calpain are associated with meat tenderness, flavor and juiciness in Hanwoo (Korean cattle): Molecular modeling of the effects of substitutions in the calpastatin/μ-calpain complex. Meat Sci. 2014, 96, 1501–1508. [Google Scholar] [CrossRef]
- Cheong, H.S.; Yoon, D.-H.; Park, B.L.; Kim, L.H.; Bae, J.S.; Namgoong, S.; Lee, H.W.; Han, C.S.; Kim, J.O.; Cheong, I.-C. A single nucleotide polymorphism in CAPN1 associated with marbling score in Korean cattle. BMC Genet. 2008, 9, 33. [Google Scholar] [CrossRef] [Green Version]
- Li, Y.; Jin, H.; Yan, C.; Seo, K.; Zhang, L.; Ren, C.; Jin, X. Association of CAST gene polymorphisms with carcass and meat quality traits in Yanbian cattle of China. Mol. Biol. Rep. 2013, 40, 1875–1881. [Google Scholar] [CrossRef]
- Chung, H.; Davis, M. Effects of genetic variants for the calpastatin gene on calpastatin activity and meat tenderness in Hanwoo (Korean cattle). Meat Sci. 2012, 90, 711–714. [Google Scholar] [CrossRef]
- Li, Y.; Li, J.; Zhang, L.; Gao, F.; Zhou, G. Effects of dietary starch types on growth performance, meat quality and myofibre type of finishing pigs. Meat Sci. 2017, 131, 60–67. [Google Scholar] [CrossRef]
- Terenina, E.; Babigumira, B.M.; Le Mignon, G.; Bazovkina, D.; Rousseau, S.; Salin, F.; Bendixen, C.; Mormede, P. Association study of molecular polymorphisms in candidate genes related to stress responses with production and meat quality traits in pigs. Domest. Anim. Endocrinol. 2013, 44, 81–97. [Google Scholar] [CrossRef] [PubMed] [Green Version]
- Zhang, C.; Wang, Z.; Bruce, H.; Janz, J.; Goddard, E.; Moore, S.; Plastow, G. Associations between single nucleotide polymorphisms in 33 candidate genes and meat quality traits in commercial pigs. Anim. Genet. 2014, 45, 508–516. [Google Scholar] [CrossRef] [PubMed]
- Mariman, E.C.; Wang, P. Adipocyte extracellular matrix composition, dynamics and role in obesity. Cell. Mol. Life Sci. 2010, 67, 1277–1292. [Google Scholar] [CrossRef] [PubMed] [Green Version]
- Taye, M.; Yoon, J.; Dessie, T.; Cho, S.; Oh, S.J.; Lee, H.-K.; Kim, H. Deciphering signature of selection affecting beef quality traits in Angus cattle. Genes Genom. 2018, 40, 63–75. [Google Scholar] [CrossRef]
- Shavlakadze, T.; Grounds, M. Of bears, frogs, meat, mice and men: Complexity of factors affecting skeletal muscle mass and fat. Bioessays 2006, 28, 994–1009. [Google Scholar] [CrossRef]
- Glass, D.J. Skeletal muscle hypertrophy and atrophy signaling pathways. Int. J. Biochem. Cell Biol. 2005, 37, 1974–1984. [Google Scholar] [CrossRef]
- Dos Santos Silva, D.B.; Fonseca, L.F.S.; Magalhães, A.F.B.; Muniz, M.M.M.; Baldi, F.; Ferro, J.A.; Chardulo, L.A.L.; Pinheiro, D.G.; de Albuquerque, L.G. Transcriptome profiling of muscle in Nelore cattle phenotypically divergent for the ribeye muscle area. Genomics 2010, 112, 1257–1263. [Google Scholar] [CrossRef]
- Puig-Oliveras, A.; Revilla, M.; Castelló, A.; Fernández, A.I.; Folch, J.M.; Ballester, M. Expression-based GWAS identifies variants, gene interactions and key regulators affecting intramuscular fatty acid content and composition in porcine meat. Sci. Rep. 2016, 6, 31803. [Google Scholar] [CrossRef]
- Sun, J.; Jin, Q.; Zhang, C.; Fang, X.; Gu, C.; Lei, C.; Wang, J.; Chen, H. Polymorphisms in the bovine ghrelin precursor (GHRL) and Syndecan-1 (SDC1) genes that are associated with growth traits in cattle. Mol. Biol. Rep. 2011, 38, 3153–3160. [Google Scholar] [CrossRef]
- Braz, C.; Camargo, G.; Cardoso, D.; Gil, F.; Fonseca, P.; Cyrillo, J.; Mercadante, M.; Oliveira, H.; Tonhati, H. Polymorphisms in the GHRL gene and their associations with traits of economic interest in beef cattle. Genet. Mol. Res. 2015, 14, 18188–18197. [Google Scholar] [CrossRef]
- Seong, J.; Yoon, H.; Kong, H.S. Identification of microRNA and target gene associated with marbling score in Korean cattle (Hanwoo). Genes Genom. 2016, 38, 529–538. [Google Scholar] [CrossRef]
- Park, S.J.; Kang, H.J.; Na, S.; Lee, S.H.; Baik, M. Differential expression of extracellular matrix and integrin genes in the longissimus thoracis between bulls and steers and their association with intramuscular fat contents. Meat Sci. 2018, 136, 35–43. [Google Scholar] [CrossRef] [PubMed]
- Allan, M.; Thallman, R.; Cushman, R.; Echternkamp, S.; White, S.; Kuehn, L.; Casas, E.; Smith, T. Association of a single nucleotide polymorphism in SPP1 with growth traits and twinning in a cattle population selected for twinning rate. J. Anim. Sci. 2007, 85, 341–347. [Google Scholar] [CrossRef] [PubMed] [Green Version]
- Gui, L.; Hao, R.; Zhang, Y.; Zhao, X.; Zan, L. Haplotype distribution in the class I sirtuin genes and their associations with ultrasound carcass traits in Qinchuan cattle (Bos taurus). Mol. Cell. Probes 2015, 29, 167–171. [Google Scholar] [CrossRef] [PubMed]
- Purfield, D.; Evans, R.; Berry, D. Reaffirmation of known major genes and the identification of novel candidate genes associated with carcass-related metrics based on whole genome sequence within a large multi-breed cattle population. BMC Genom. 2019, 20, 720. [Google Scholar] [CrossRef] [PubMed]
- Dias, M.; Souza, F.; Takada, L.; Feitosa, F.; Costa, R.; Diaz, I.; Cardoso, D.; Tonussi, R.; Baldi, F.; Albuquerque, L. Study of lipid metabolism-related genes as candidate genes of sexual precocity in Nellore cattle. Genet. Mol. Res. 2015, 14, 234–243. [Google Scholar] [CrossRef]
- Du, M.; Yin, J.; Zhu, M.J. Cellular signaling pathways regulating the initial stage of adipogenesis and marbling of skeletal muscle. Meat Sci. 2010, 86, 103–109. [Google Scholar] [CrossRef]
- Sun, Y.; Xue, J.; Guo, W.; Li, M.; Huang, Y.; Lan, X.; Lei, C.; Zhang, C.; Chen, H. Haplotypes of bovine FoxO1 gene sequence variants and association with growth traits in Qinchuan cattle. J. Genet. 2016, 93, 8–14. [Google Scholar] [CrossRef]
- Zhou, L.; Le Grandois, J.; Marchioni, E.; Zhao, M.; Ennahar, S.D.; Bindler, F. Improvement of total lipid and glycerophospholipid recoveries from various food matrices using pressurized liquid extraction. J. Agric. Food Chem. 2010, 58, 9912–9917. [Google Scholar] [CrossRef]
- Park, M. Studies on Factors Affecting Beef Taste and the Effects of Dietary Glycerin on Growth Performance and Carcass Characteristics in Korean Cattle Steers. Ph.D. Thesis, College of Agriculture and Life Sciences, Madison, WI, USA, 2018. [Google Scholar]
- Li, B.; Li, W.; Ahmad, H.; Zhang, L.; Wang, C.; Wang, T. Effects of choline on meat quality and intramuscular fat in intrauterine growth retardation pigs. PLoS ONE 2015, 10, e0129109. [Google Scholar] [CrossRef] [Green Version]
- Lee, S.H.; van der Werf, J.; Lee, S.H.; Park, E.W.; Gondro, C.; Yoon, D.; Oh, S.J.; Kim, O.H.; Gibson, J.; Thompson, J. Genome wide QTL mapping to identify candidate genes for carcass traits in Hanwoo (Korean Cattle). Genes Genom. 2012, 34, 43–49. [Google Scholar] [CrossRef]


| Traits | Phenotypic Data | Variance Components | ||||||
|---|---|---|---|---|---|---|---|---|
| Mean | SD | Max | Min | CV | σ2 g | σ2 p | h2 | |
| Backfat Thickness (mm) | 14.08 | 4.9 | 43 | 2 | 0.35 | 6.79 | 16.98 | 0.29 |
| Carcass Weight(kg) | 441.22 | 52.7 | 682 | 159 | 0.12 | 660.25 | 1962.58 | 0.25 |
| Eye Muscle Area (cm2) | 95.8 | 12.0 | 155 | 34 | 0.13 | 38.23 | 95.69 | 0.29 |
| Marbling Score (1–9) | 6.1 | 1.9 | 9 | 1 | 0.31 | 1.24 | 2.04 | 0.38 |
| Trait | SNP_ID | Chr | Position | p-Value | SNP Effect | Gene | Type |
|---|---|---|---|---|---|---|---|
| Backfat | rs109467607 | 19 | 7617020 | 8.89E-11 | 0.0579 | NOG | Promoter |
| Thickness | rs110172746 | 19 | 7617964 | 8.89-11 | 0.0323 | NOG | Promoter |
| rs109749187 | 19 | 7618889 | 8.89E-11 | 0.00256 | NOG | Promoter | |
| rs110056766 | 14 | 7616793 | 1.50E-10 | 0.0354 | NOG | Promoter | |
| rs109266249 | 19 | 7617322 | 1.50E-10 | 0.0311 | NOG | Promoter | |
| Carcass | rs210030313 | 14 | 25052440 | 4.12E-30 | 0.0849 | CHCHD7 | Promoter |
| Weight | rs209809798 | 14 | 26269386 | 1.07E-27 | 0.002 | UBXN2B | Promoter |
| rs210867053 | 14 | 34422595 | 2.82E-16 | 0.0006 | C8orf34 | Promoter | |
| rs210421179 | 14 | 34425147 | 2.82E-16 | 0.001 | C8orf34 | Promoter | |
| rs208243667 | 14 | 23986995 | 2.33E-14 | 0.004 | RP1 | Promoter | |
| Eye Muscle Area | rs210030313 | 14 | 25052440 | 3.54E-08 | 0.4121 | CHCHD7 | Promoter |
| rs209809798 | 14 | 26269386 | 5.00E-07 | 0.06 | UBXN2B | Promoter | |
| rs41734611 | 14 | 29827599 | 3.05E-06 | 0.007 | YTHDF3 | Promoter | |
| rs108943384 | 14 | 29828860 | 3.05E-06 | 0.0097 | YTHDF3 | Promoter | |
| rs110364554 | 14 | 29829523 | 3.05E-06 | 0.0051 | YTHDF3 | Promoter | |
| Marbling Score | Novel | 22 | 11888027 | 8.23E-06 | 8.49E-03 | ACVR2B | Non-synonymous |
| rs109436056 | 20 | 36013931 | 1.08E-05 | 9.17E-03 | EGFLAM | Non-synonymous | |
| rs109353762 | 11 | 30965508 | 1.08E-05 | 5.42E-03 | ENSBTAG00000027015 | Promoter | |
| rs109921982 | 19 | 50470876 | 1.17E-05 | 3.40E-03 | ZNF750 | Promoter | |
| rs109995364 | 11 | 30963318 | 1.27E-05 | 6.31E-03 | ENSBTAG00000027015 | Promoter |
| Trait | nSNPs | Number of SNPs in Mixture Component | ||||
|---|---|---|---|---|---|---|
| 0 × | 10−4 × | 10−3 × | 10−3 × | |||
| Backfat Thickness | 8085 | 7.02 | 441,977 (98.2) | 7920 (1.76) {5.57} | 157 (0.03) {1.08} | 8 (0.002) {0.37} |
| Carcass Weight | 5050 | 606.40 | 445,011 (98.9) | 4875 (1.08) {298.25} | 148 (0.03) {87.07} | 28 (0.01) {221.21} |
| Eye Muscle Area | 8118 | 43.53 | 441,944 (98.20) | 7927 (1.76) {34.47} | 186 (0.04) {7.93} | 5 (0.001) {1.04} |
| Marbling Score | 8524 | 1.37 | 441,538 (98.11) | 8361 (1.86) {1.15} | 161 (0.04) {0.21} | 2 (0.01) {0.01} |
| Traits | No. of Suggestive SNPs (p < 0.005) | No. of Genes Mapped within 5Kb of Suggestive SNPs |
|---|---|---|
| Backfat Thickness | 2657 | 759 |
| Carcass Weight | 3064 | 731 |
| Eye Muscle Area | 2261 | 626 |
| Marbling Score | 2362 | 628 |
| Background c | 450,062 | 14,267 |
| Trait | Category | Term_ID | Term | Count | % | p-Value | Genes | Fold Enrichment |
|---|---|---|---|---|---|---|---|---|
| BFT | BP_DIRECT | GO:0045944 | Positive regulation of transcription from RNA polymerase II promoter | 38 | 5.34 | 0.002 | MEF2C, GDF2, NOG, FOXA2, CREM, F2RL1, PRKDC, NUFIP1, FLCN, NR2C2, KDM1A, TCF20, GALR3, HEY2, PKD2, PSIP1, POU4F2, NFATC4, TAF9, SPIC, FGF1, PIK3R1, CYR61, NFATC1, TWIST1, NPAS4, FZD5, DDX5, SREBF2, LPIN3, ACVR2A, ZMIZ2, CAMK1, BMP7, NR5A2, PBX2, ATAD2B, IL2 | 1.71 |
| BP_DIRECT | GO:0031175 | Neuron projection development | 10 | 1.41 | 0.002 | NCAM1, GPRIN1, PTPRM, RAC3, CAMSAP2, STMN4, MAP4, LAMB1, AGER, FRY | 3.62 | |
| BP_DIRECT | GO:0007200 | Phospholipase C-activating G-protein coupled receptor signaling pathway | 7 | 0.98 | 0.007 | C3AR1, PLCE1, LTB4R, GALR3, LTB4R2, HTR1F, F2R | 4.07 | |
| MF_DIRECT | GO:0042626 | ATPase activity, coupled to transmembrane movement of substances | 7 | 0.98 | 0.009 | ABCA10, TAP2, TAP1, ABCB6, ABCA5, ABCA12, ABCG2 | 3.84 | |
| MF_DIRECT | GO:0050840 | Extracellular matrix binding | 5 | 0.70 | 0.009 | DMP1, OLFML2A, THBS1, CYR61, SPP1 | 5.87 | |
| MF_DIRECT | GO:0005509 | Calcium ion binding | 34 | 4.78 | 0.014 | MYL3, SYT2, EFCAB3, MYL10, SYT6, KCNIP4, MMP24, CAMKK2, SMOC2, PLCB4, CD93, EEF2K, TPT1, PKD2, HEG1, THBS1, IHH, PNLIPRP2, CRTAC1, NCALD, CDHR2, MMP16, PCDH7, PKD2L1, CDH12, THBD, CALM, EFHB, RYR3, NOTCH4, PDCD6, LRP4, CASQ2, VLDLR | 1.53 | |
| MF_DIRECT | GO:0031681 | G-protein β-subunit binding | 3 | 0.42 | 0.020 | F2RL1, ARF6, F2R | 12.91 | |
| KEGG_PATHWAY | bta04512 | ECM-receptor interaction | 11 | 1.55 | 0.001 | CD47, SDC1, CD36, ITGA8, COL6A2, ITGA2, LAMB1, THBS1, SV2C, HMMR, SPP1 | 3.56 | |
| KEGG_PATHWAY | bta02010 | ABC transporters | 7 | 0.98 | 0.003 | ABCA10, TAP2, TAP1, ABCB6, ABCA5, ABCA12, ABCG2 | 4.69 | |
| KEGG_PATHWAY | bta03450 | Non-homologous end-joining | 4 | 0.56 | 0.010 | DCLRE1C, PRKDC, NHEJ1, MRE11 | 8.66 | |
| KEGG_PATHWAY | bta04080 | Neuroactive ligand-receptor interaction | 18 | 2.53 | 0.030 | GABRG1, C3AR1, F2RL1, VIPR2, CRHR1, EDNRB, CHRM2, LTB4R, GALR3, P2RY14, AVPR1B, LTB4R2, CNR2, HTR1F, GLP1R, GHR, OPRD1, F2R | 1.73 | |
| CWT | BP_DIRECT | GO:0042127 | Regulation of cell proliferation | 11 | 1.58 | 0.038 | SGK1, TNFRSF11B, SGK3, TNC, JTB, EGLN3, PKD2, GHRL, TNK1, NDRG1, RPA3 | 2.09 |
| BP_DIRECT | GO:0007155 | Cell adhesion | 12 | 1.72 | 0.047 | IBSP, NOV, PARVG, ITGAL, CD47, OPCML, TNC, SULF1, GP1BA, GRHL2, CTNNA3, SPP1 | 1.92 | |
| MF_DIRECT | GO:0044822 | Poly(A) RNA binding | 45 | 6.46 | 0.010 | YWHAZ, ASS1, GRB2, NOC3L, PRKDC, KNOP1, RPS19BP1, NUFIP2, RPS27, PRR3, RPL7, MAK16, MACF1, DHX37, SND1, NUDT16L1, PSIP1, DHX16, RBM47, RPL12, RPS20, CDC42EP4, TNRC6A, MTERF1, KHDRBS3, MRPS28, ZC3H15, TBL2, TSR1, MAGOH, EFTUD2, PKN2, RPL26, CASC3, NUPL2, RBBP6, FLNB, CMSS1, SRSF2, SYNE1, PTCD3, POP1, DDX31, DNTTIP2, KCTD12 | 1.46 | |
| MF_DIRECT | GO:0005096 | GTPase activator activity | 14 | 2.01 | 0.017 | PREX2, ASAP2, ARHGAP24, RGS22, ARHGAP31, RGS20, RABEP1, ARHGAP42, TBC1D1, CDC42EP4, RAP1GAP2, ARAP2, CDC42EP3, TBC1D20 | 2.09 | |
| MF_DIRECT | GO:0005509 | Calcium ion binding | 31 | 4.45 | 0.029 | NKD1, CLSTN3, EFCAB5, DUOX2, MMP27, MMRN1, ZZEF1, KCNIP4, SMOC2, MACF1, FAT3, CRB2, PLA2G12A, EFCAB1, PKD2, SRR, PLCB2, HPGDS, NCALD, PCDH8, DLL1, PCDH7, SLIT2, PCDH18, ATP2C1, RYR3, NUCB2, SULF1, SCIN, ANXA13, ADGRL4 | 1.48 | |
| KEGG_PATHWAY | bta04151 | PI3K-Akt signaling pathway | 21 | 3.01 | 0.021 | PPP2R1B, FGF6, IBSP, CRTC2, YWHAZ, SGK1, SGK3, GRB2, TNC, PKN2, CDK6, GNG11, NFKB1, GNGT1, LAMA3, MAPK3, PDGFRA, PIK3R5, FGF1, MYC, SPP1 | 1.70 | |
| KEGG_PATHWAY | bta04713 | Circadian entrainment | 9 | 1.29 | 0.021 | GNGT1, ADCY8, GRIA1, RYR3, MAPK3, CACNA1I, GNG11, CACNA1C, PLCB2 | 2.61 | |
| KEGG_PATHWAY | bta04020 | Calcium signaling pathway | 12 | 1.72 | 0.071 | CCKAR, ADRB1, P2RX1, ADCY8, PHKG1, RYR3, CACNA1I, PDGFRA, AVPR1A, PPP3CA, CACNA1C, PLCB2 | 1.78 | |
| KEGG_PATHWAY | bta04110 | Cell cycle | 9 | 1.29 | 0.075 | YWHAZ, RAD21, ANAPC4, BUB1, PRKDC, CDK6, MYC, BUB3, STAG1 | 2.02 | |
| MAR | BP_DIRECT | GO:0016477 | Cell migration | 11 | 1.82 | 0.006 | CUL3, TNS3, ERG, SDC1, FSCN2, PLCG1, IL12A, SIX2, IL12B, BAMBI, SRMS | 2.79 |
| BP_DIRECT | GO:0042127 | Regulation of cell proliferation | 11 | 1.82 | 0.024 | TNFRSF6B, ITK, SGK2, BIRC7, EGLN3, GHRL, TOPORS, TFAP2C, LGR5, SRMS, NKX2-3 | 2.25 | |
| BP_DIRECT | GO:0008286 | Insulin receptor signaling pathway | 5 | 0.83 | 0.037 | SLC2A8, PDK2, FOXO1, RHOQ, ZNF106 | 3.94 | |
| BP_DIRECT | GO:0006874 | Cellular calcium ion homeostasis | 6 | 0.99 | 0.058 | EDN3, ATP2C2, ATP2C1, PKHD1, CCL8, ATP13A3 | 2.85 | |
| MF_DIRECT | GO:0005524 | ATP binding | 50 | 8.28 | 0.086 | MLH1, SKIV2L2, ACSF2, MTHFD1L, LONP1, PIP5KL1, DDX28, PRKACB, SGK2, MYH3, OLA1, CFTR, LIG4, CDK4, NEK11, CDKL4, MAST3, ATP2C2, ACVR2B, DHX29, ATP2C1, NEK7, XYLB, DNAH9, SPO11, KIT, ITM2B, STK40, VRK3, MAP3K1, ENTPD8, LMTK3, ITK, PDK2, SMCHD1, AK1, TGFBR2, TRIO, ATP1A1, STRADB, ATP13A3, TRANK1, SMC4, TP53RK, TEX14, PLK2, PSMC3, MYO16, FPGS, SRMS | 1.23 | |
| MF_DIRECT | GO:0005509 | Calcium ion binding | 26 | 4.30 | 0.089 | LALBA, GPD2, LPO, MYL2, EFCAB5, CRTAC1, PAMR1, PCDH10, CDHR3, SYT9, SYT6, PCDH8, STAB2, LPCAT2, SLIT1, ZZEF1, HMCN2, CDH12, ANXA6, EGFLAM, CLGN, FAT3, PLCG1, ATP2C1, FAT1, MCFD2 | 1.38 | |
| KEGG_PATHWAY | bta04060 | Cytokine-cytokine receptor interaction | 17 | 2.81 | 0.000 | TNFRSF6B, TGFBR2, CCL8, IL10, IL12RB2, CCR9, ACVR2B, IL17B, IL12RB1, PRLR, CCR4, IL12A, TNFRSF19, CSF3R, IL12B, IFNGR2 | 2.83 | |
| KEGG_PATHWAY | bta05200 | Pathways in cancer | 22 | 3.64 | 0.003 | RALBP1, TGFBR2, BIRC7, EGLN3, MLH1, FOXO1, LEF1, ITGA3, NFKB2, KIT, CDK4, MMP2, AGTR1, EDNRB, CUL2, PLCG1, SOS1, RALB, CSF3R, HHIP, PRKACB, TRAF6 | 2.00 | |
| KEGG_PATHWAY | bta00280 | Valine, leucine and isoleucine degradation | 5 | 0.83 | 0.047 | HMGCS2, OXCT1, DLD, IL4I1, ACAD8 | 3.62 | |
| KEGG_PATHWAY | bta00790 | Folate biosynthesis | 3 | 0.50 | 0.048 | GGH, FPGS, GCH1 | 8.37 | |
| KEGG_PATHWAY | bta00564 | Glycerophospholipid metabolism | 7 | 1.16 | 0.050 | GPD2, CHKA, ADPRM, ETNK1, LPCAT2, PLPP1, PLPP2 | 2.61 | |
| KEGG_PATHWAY | bta05231 | Choline metabolism | 7 | 1.16 | 0.054 | CHKA, PLCG1, SOS1, SLC22A5, PLPP1, PLPP2, SLC22A1 | 2.56 | |
| KEGG_PATHWAY | bta04630 | Jak-STAT signaling pathway | 9 | 1.49 | 0.055 | IL12RB2, IL12RB1, PRLR, SOS1, IL12A, CSF3R, IL12B, IFNGR2, IL10 | 2.16 | |
| EMA | BP_DIRECT | GO:0031663 | Lipopolysaccharide-mediated signaling pathway | 4 | 0.34 | 0.057 | MAPK3, NFKBIA, PRKCE, PTAFR | 4.52 |
| BP_DIRECT | GO:0001568 | Blood vessel development | 4 | 0.34 | 0.057 | MEF2C, PSEN1, ITGAV, RAPGEF2 | 4.52 | |
| BP_DIRECT | GO:0042127 | Regulation of cell proliferation | 9 | 0.77 | 0.090 | SGK1, PTGS2, TNC, LCK, CHST11, NFKBIA, FAS, PLAU, TEC | 1.95 | |
| BP_DIRECT | GO:0007155 | Cell adhesion | 10 | 0.85 | 0.096 | ITGAL, LYVE1, TNC, NPHS1, ACAN, ITGA2, GP1BA, PRKCE, FN1, MYH10 | 1.83 | |
| MF_DIRECT | GO:0008168 | Methyltransferase activity | 6 | 0.51 | 0.004 | ZCCHC4, METTL21B, TRMT10A, PRMT9, NSUN3, METTL18 | 5.52 | |
| MF_DIRECT | GO:0005524 | ATP binding | 54 | 4.61 | 0.013 | KIF22, SEPHS2, INO80, IARS2, PIP5KL1, MOS, PRKACB, SIK2, ABCE1, SGK1, MYH3, CDK6, LIG4, PRKCE, UBE2C, CDK4, CDKL4, UBE2N, MAST4, UBE2K, ATP2C1, RIPK1, LCK, MAPK3, RRM1, DNAH9, PEAK1, PRKDC, CHEK2, ITM2B, DNAH5, STK40, ENTPD8, STK38L, ABCA13, AATK, TEC, DHX8, PDK2, ALPK3, AK1, AK7, RIMKLB, TP53RK, GLYCTK, DYRK1A, ATP2A1, DGKZ, ABCC2, NLRP13, FPGS, KATNAL2, MYH10, ATAD2B | 1.38 | |
| MF_DIRECT | GO:0005509 | Calcium ion binding | 29 | 2.47 | 0.016 | GALNT3, TBC1D9, MMP8, MMP27, C2CD4D, EDIL3, KCNIP1, CRB2, ACAN, CDH26, HPGDS, GPD2, NOX5, ADGRE3, HSPG2, S100A10, STIM1, TC2N, CABYR, CLGN, CDH17, ATP2C1, ATP2A1, DSC3, RYR2, DSC2, ANXA13, SGCA, LCP1 | 1.59 | |
| KEGG_PATHWAY | bta04110 | Cell cycle | 11 | 0.94 | 0.005 | E2F2, YWHAH, HDAC1, RBL1, ANAPC4, PRKDC, CDK6, ANAPC10, ORC6, CHEK2, CDK4 | 2.89 | |
| KEGG_PATHWAY | bta04115 | p53 signaling pathway | 7 | 0.60 | 0.020 | RFWD2, CASP3, CDK6, CHEK2, FAS, CDK4, CCNG1 | 3.24 | |
| KEGG_PATHWAY | bta04514 | Cell adhesion molecules (CAMs) | 10 | 0.85 | 0.044 | GLG1, CLDN8, ITGAL, CLDN18, CD86, VTCN1, ITGAV, CD274, NEO1, CLDN25 | 2.13 |
© 2020 by the authors. Licensee MDPI, Basel, Switzerland. This article is an open access article distributed under the terms and conditions of the Creative Commons Attribution (CC BY) license (http://creativecommons.org/licenses/by/4.0/).
Share and Cite
Srikanth, K.; Lee, S.-H.; Chung, K.-Y.; Park, J.-E.; Jang, G.-W.; Park, M.-R.; Kim, N.Y.; Kim, T.-H.; Chai, H.-H.; Park, W.C.; et al. A Gene-Set Enrichment and Protein–Protein Interaction Network-Based GWAS with Regulatory SNPs Identifies Candidate Genes and Pathways Associated with Carcass Traits in Hanwoo Cattle. Genes 2020, 11, 316. https://doi.org/10.3390/genes11030316
Srikanth K, Lee S-H, Chung K-Y, Park J-E, Jang G-W, Park M-R, Kim NY, Kim T-H, Chai H-H, Park WC, et al. A Gene-Set Enrichment and Protein–Protein Interaction Network-Based GWAS with Regulatory SNPs Identifies Candidate Genes and Pathways Associated with Carcass Traits in Hanwoo Cattle. Genes. 2020; 11(3):316. https://doi.org/10.3390/genes11030316
Chicago/Turabian StyleSrikanth, Krishnamoorthy, Seung-Hwan Lee, Ki-Yong Chung, Jong-Eun Park, Gul-Won Jang, Mi-Rim Park, Na Yeon Kim, Tae-Hun Kim, Han-Ha Chai, Won Cheoul Park, and et al. 2020. "A Gene-Set Enrichment and Protein–Protein Interaction Network-Based GWAS with Regulatory SNPs Identifies Candidate Genes and Pathways Associated with Carcass Traits in Hanwoo Cattle" Genes 11, no. 3: 316. https://doi.org/10.3390/genes11030316