Expression Profile of Laccase Gene Family in White-Rot Basidiomycete Lentinula edodes under Different Environmental Stresses


1
Institute of Applied Mycology, College of Plant Science and Technology, Huazhong Agricultural University, Wuhan 430070, China
2
Key Laboratory of Agro-Microbial Resource Comprehensive Utilization, Ministry of Agriculture, Huazhong Agricultural University, Wuhan 430070, China
*
Author to whom correspondence should be addressed.
Genes 2019, 10(12), 1045; https://doi.org/10.3390/genes10121045
Submission received: 9 November 2019
/
Revised: 12 December 2019
/
Accepted: 12 December 2019
/
Published: 16 December 2019
(This article belongs to the Section Molecular Genetics and Genomics)
Abstract
:Laccases belong to ligninolytic enzymes and play important roles in various biological processes of filamentous fungi, including fruiting-body formation and lignin degradation. The process of fruiting-body development in Lentinula edodes is complex and is greatly affected by environmental conditions. In this paper, 14 multicopper oxidase-encoding (laccase) genes were analyzed in the draft genome sequence of L. edodes strain W1-26, followed by a search of multiple stress-related Cis-elements in the promoter region of these laccase genes, and then a transcription profile analysis of 14 laccase genes (Lelcc) under the conditions of different carbon sources, temperatures, and photoperiods. All laccase genes were significantly regulated by varying carbon source materials. The expression of only two laccase genes (Lelcc5 and Lelcc6) was induced by sodium-lignosulphonate and the expression of most laccase genes was specifically upregulated in glucose medium. Under different temperature conditions, the expression levels of most laccase genes decreased at 39 °C and transcription was significantly increased for Lelcc1, Lelcc4, Lelcc5, Lelcc9, Lelcc12, Lelcc13, and Lelcc14 after induction for 24 h at 10 °C, indicating their involvement in primordium differentiation. Tyrosinase, which is involved in melanin synthesis, was clustered with the same group as Lelcc4 and Lelcc7 in all the different photoperiod treatments. Meanwhile, five laccase genes (Lelcc8, Lelcc9, Lelcc12, Lelcc13, and Lelcc14) showed similar expression profiles to that of two blue light receptor genes (LephrA and LephrB) in the 12 h light/12 h dark treatment, suggesting the involvement of laccase genes in the adaptation process of L. edodes to the changing environment and fruiting-body formation. This study contributes to our understanding of the function of the different Lelcc genes and facilitates the screening of key genes from the laccase gene family for further functional research.
1. Introduction
Laccase (benzenediol: oxygen oxidoreductase, EC 1.10.3.2) is a group of phenoloxidases containing copper atoms in the catalytic center, and is also a member of the blue multicopper oxidase family (MCO) [1]. Laccases have been widely studied for their potential industrial applications in pulp bleaching, dye decolorization, detoxification of environmental pollutants, and revalorization of wastes and wastewaters [2,3,4]. Laccase was shown to contain three types of coppers (type 1, type 2, and type 3) [5,6,7]. A set of four ungapped sequence regions L1–L4 are used to distinguish laccases within the broader class of MCOs [6,7]. Laccases are also widely distributed in fungi, bacteria, and insects, but not plants [7]. Sequence comparison and transcription analysis of several fungi demonstrated that laccases were encoded by multigene families [8,9,10,11]. This gene redundancy suggests the differences in their physicochemical and regulatory mechanisms, especially their physiological roles in response to nutrition change and environmental stress [12,13]. The intricacy of laccase genes families in fungi cumbers the further study of these genes.
In plants, laccases participate in the radical-based mechanisms of lignin polymer formation [14,15], while in fungi, laccases are thought to play a variety of physiological roles, including stress defense, melanin synthesis [10], fruiting-body formation, and lignin degradation [7]. The transcription of laccase genes in various organisms (mostly fungi) is affected by many factors, such as the type and nature of nutrients, temperature, pH, and chemical inducers, and also varies with the phases of fruiting-body development [9,11,12,16]. In recent years, a number of reports were published regarding the genetic functional analysis of laccases in mushrooms, such as Pleurotus ostreatus, Hypsizygus marmoreus, and Lentinula edodes [17,18,19,20]. Comprehensive knowledge regarding the laccase gene family in terms of induced transcription under diverse conditions could provide an understanding of the functions of different laccase genes.
L. edodes, an important cultivated edible and medicinal mushroom, belongs to the wood-colonizing white-rot species. The formation process of its fruiting bodies is mediated by cellular processes and genetic, physiological, and environmental factors [21]. Specifically, light, low temperature, and substrates are the key factors that affect the induction of brown film (BF) formation and primordium initiation, with the expression of laccase genes significantly upregulated during the two stages [21,22,23]. The correlation analysis showed that the laccase activity in the vegetative growth stage was closely related to the time when L. edodes entered the reproductive stage. The greater the enzyme activity, the earlier the brown film formation and primordium initiation [24]. In-depth systematic exploration of how L. edodes adapts to various environmental conditions and starts the reproductive growth stage is particularly important for efficient cultivation of L. edodes.
Thus far, 14 laccase genes (Lelcc) have been identified in L. edodes [25]. The expression of the laccase genes was reported to be induced by different environmental factors in L. edodes and varied during fruiting-body development [11,21,23,26]. The genome data of L. edodes W1-26 were published by our laboratory [25]. Additionally, our analyses of the transcriptome and secretion proteome data indicated that laccases in L. edodes respond to stresses such as heat and carbon sources [27,28]. Therefore, it is necessary to further explore the response mechanisms of L. edodes to various environmental conditions to improve our understanding of its growth characteristics and enhance its cultivation efficiency.
The purpose of the present study was to analyze the expression profile of the laccase gene family in L. edodes under different environmental stresses, such as photoperiods, carbon sources, and temperature. The results could facilitate the understanding of the laccase function of white-rot fungi regarding their adaptive capacity to environment and provide a convenient way to select interesting genes from the L. edodus laccase family genes for further research.
2. Materials and Methods
2.1. Phylogenetic Analysis of Laccase Genes of L. edodes
The laccase sequences of L. edodes W1-26 (a single spore culture derived from the W1 strain) were downloaded from the L. edodes Genome Database http://legdb.chenlianfu.com/index.html [25]. Subsequently, the protein sequences of the identified members of L. edodes laccase gene family were analyzed with EXPASY PROTOPARAM4 to obtain the molecular weight and theoretical isoelectric point (pI). Signal peptides of each laccase were predicted using SignalP algorithm (http://www.cbs.dtu.dk/services/SignalP/). Four ungapped sequence regions (L1–L4) were used to distinguish between the laccases in L. edodes.
All 14 laccase genes were analyzed phylogenetically by alignment of the respective amino acid sequences using ClustalW software (http://www.ddbj.nig.ac.jp/search/clustalw-j.html). The phylogram was constructed using the neighbor-joining method, and trees were drawn using FigTree (http://tree.bio.ed.ac.uk/software/fgtree/). Bootstrapping was carried out with 1000 replications.
2.2. Promoter Analysis of Laccase Genes in L. edodes
The upstream regions (1.5 kb) of the laccase gene sequences were downloaded from the L. edodes Genome Database (http://legdb.chenlianfu.com/index.html) and used for search of Cis-elements online by Yeastract (Yeast Search for Transcriptional Regulators and Consensus Tracking, http://www.yeastract.com/index.php). The Cis-elements predicted by Yeastract were classed to four main groups according to their putative function (Supplementary Table S1). PhrA, a white collar-1-like blue-light photoreceptor, combines with the white collar-2 homolog phrB and binds to a specific site (5′GATA/TTG/T/AC3′) in the promoter region of the L. edodes tyrosinase gene [26]. The specific site (5′GATA/TTG/T/AC3′) was also searched for in the promoter regions.
2.3. Mycelial Materials and Environmental Treatment Methods
The parent strain W1 (ACCC50926) of W1-26 was treated as the tester strain. The strain was maintained separately on the following four mediums in dark at 25 °C: (1) malt extract, yeast extract and glucose (MYG) agar medium (2% maltose, 2% glucose, 0.2% yeast extract, 0.2% tryptone, 2% agar), (2) complete yeast extract medium (CYM) (2% glucose, 0.2% yeast extracts, 0.2% peptone, 0.1% K2HPO4, 0.05% MgSO4, 0.046% KH2PO4, and 2% agar), (3) CYM containing microcrystalline cellulose (CYM-C) (2% microcrystalline cellulose, 0.2% yeast extract, 0.2% peptone, 0.1% K2HPO4, 0.05% MgSO4, 0.046% KH2PO4, and 2% agar), and (4) CYM containing microcrystalline cellulose plus sodium lignosulfonate (CYM-C + SLS) (1.9% microcrystalline cellulose plus 0.1% sodium lignosulfonate, 0.2% yeast extract, 0.2% peptone, 0.1% K2HPO4, 0.05% MgSO4, 0.046% KH2PO4, and 2% agar).
(1) Carbon sources: W1 mycelial plugs were inoculated separately in CYM, CYM-C, and CYM-C + SLS agar medium containing 2% (wt/vol) glucose (glucose), 2% microcrystalline cellulose (cellulose), or 1.9% microcrystalline cellulose plus 0.1% sodium lignosulfonate (cellulose-SLS) as the major carbon source. Each medium was covered with cellophane and incubated for 7 days at 25 °C. Hyphae were collected, followed by freezing with liquid nitrogen and storage in a refrigerator at −70 °C for total RNA extraction. Each treatment was conducted with three biological replicates.
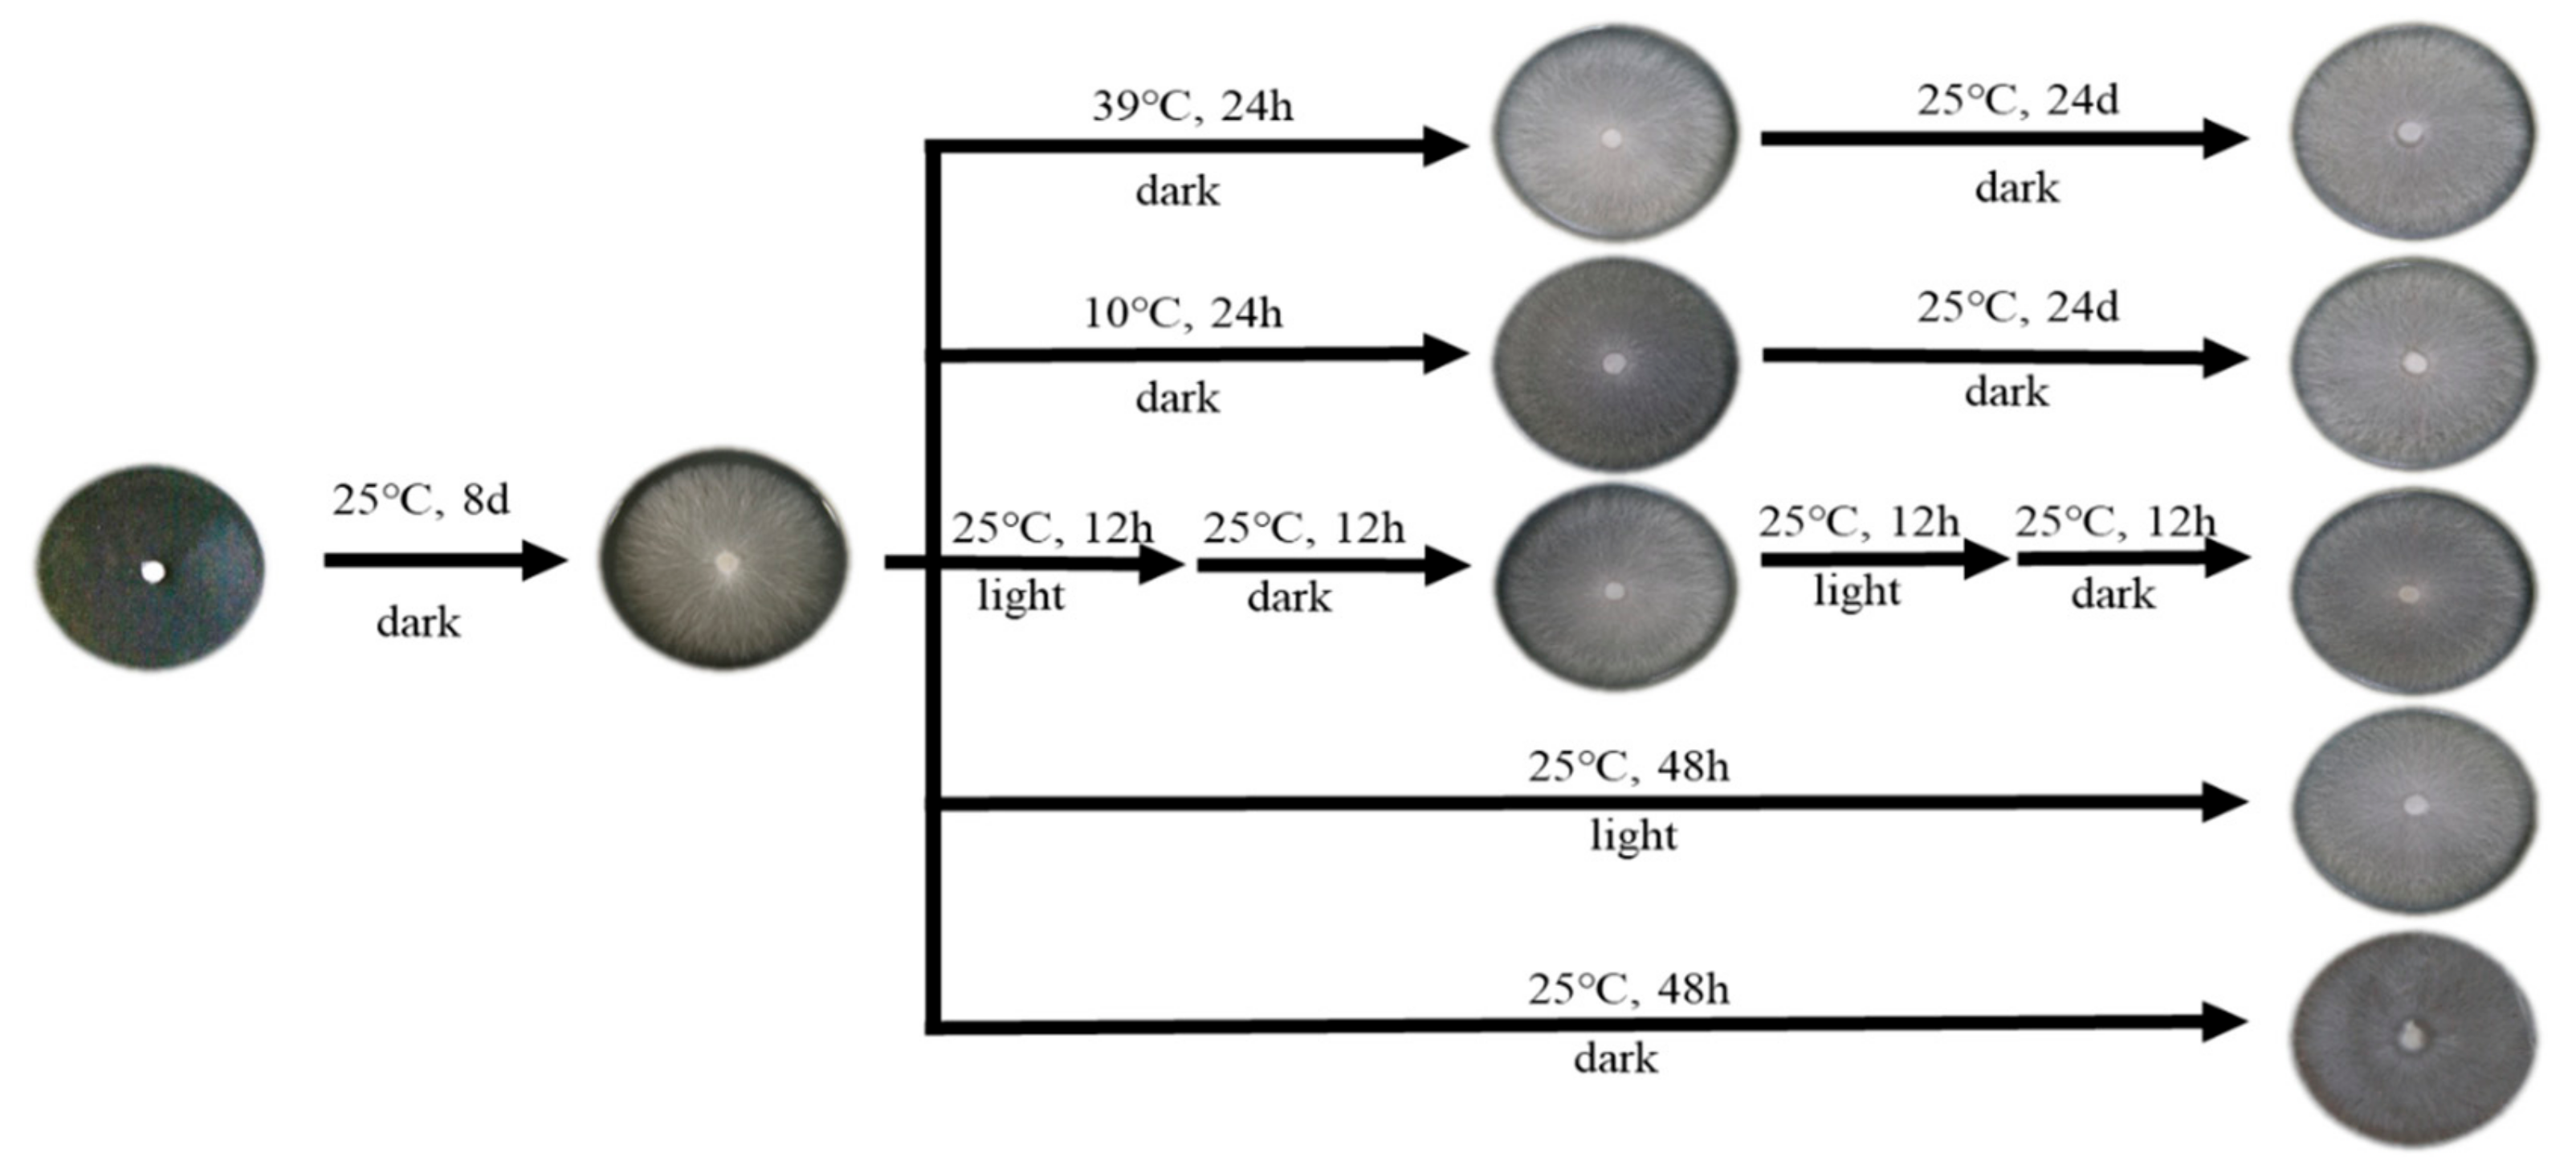
(2) Heat stress: A mycelial tip plug 5 mm in diameter was inoculated onto the MYG medium. For the treatment group, the mycelia grown at 25 °C for 8 days were subjected to 39 °C heat stress for 24 h, followed by transfer of the samples to incubators at 25 °C, where they were cultured for another 24 h [28] (Figure 1). Sampling was done separately at 1, 3, 6, 12, and 24 h.
(3) Cold stress: Mycelia under normal growth at 25 °C for 8 days were subjected to 10 °C cold stress for 24 h (Figure 1). The other procedures were the same as described above for heat stress.
(4) Photoperiod: A mycelial tip plug of 5 mm in diameter was inoculated onto the MYG medium and incubated for 8 days at 25 °C in the dark condition. When hyphae covered the plate, the light growth chamber was maintained at three different photoperiod regimes of 12 h light/12 h dark, 24 h light/0 h dark, or 24 h dark/0 h light at 25 °C. Sampling was done every 4 h for 48 h successively (Figure 1).
2.4. RNA Extraction and qRT-PCR Analysis
Total RNA from the fungus was extracted by a method adapted from the RNAiso Plus method according to the manufacturer’s instructions (TaKaRa, Dalian, China).
The transcription levels of Lelcc1 to Lelcc14 were analyzed using the primer sets listed in Supplementary Table S2. Additionally, white collar-1-like homolog gene LephrA, white collar-2 homolog gene LephrB, and tyrosinase homolog gene Letry were also analyzed. As an internal control, the expression of actin was analyzed using the primers Actin-F and Actin-R. The relative expression of target genes was calculated with respect to each corresponding reference condition (calibrator) (ΔΔCt = ΔCt − ΔCt calibrator sample). Based on the reference or a calibrator, the amount of target gene was calculated as 2−(−ΔΔct) (expression) [29] and the reference condition was defined as that with the lowest expression level at the other experiments.
3. Results
3.1. Prediction and Sequence Alignment of Multicopper Oxidases in the L. edodes Genome
All 14 full-length multicopper oxidase-encoding genes were obtained in the whole genome of L. edodes. The detailed information regarding the laccase genes and proteins is shown in Supplementary Table S3. Except for Lelcc3 and Lelcc11, all laccase proteins had signal peptide sequences, indicating that these laccases belonged to secretory proteins. The length of laccase proteins ranged from 523 aa (Lelcc12) to 708 aa (Lelcc3) residues, and the predicted molecular weights were between 56.738 kDa (Lelcc13) and 68.273 kDa (Lelcc3). The predicted pI-values of the laccase proteins ranged from 4.3 (Lelcc5) to 7.14 (Lelcc11), indicating that they belonged to acidic and neutral proteins. The intron number ranged from 9 (Lelcc10 and Lelcc11) to 26 (Lelcc6). The coding sequences (CDS) sequences of Lelcc1, Lelcc6, and Lelcc8 were divided into more than 20 parts by introns, indicating that these three laccases were more complicated than the other laccase genes with respect to gene structure. To determine their distribution in L. edodes, the Lelcc14 genes were mapped onto L. edodes scaffolds, and Scaffold 0018 was identified to contain the largest number of laccase genes (Lelcc9, Lelcc13, Lelcc14).
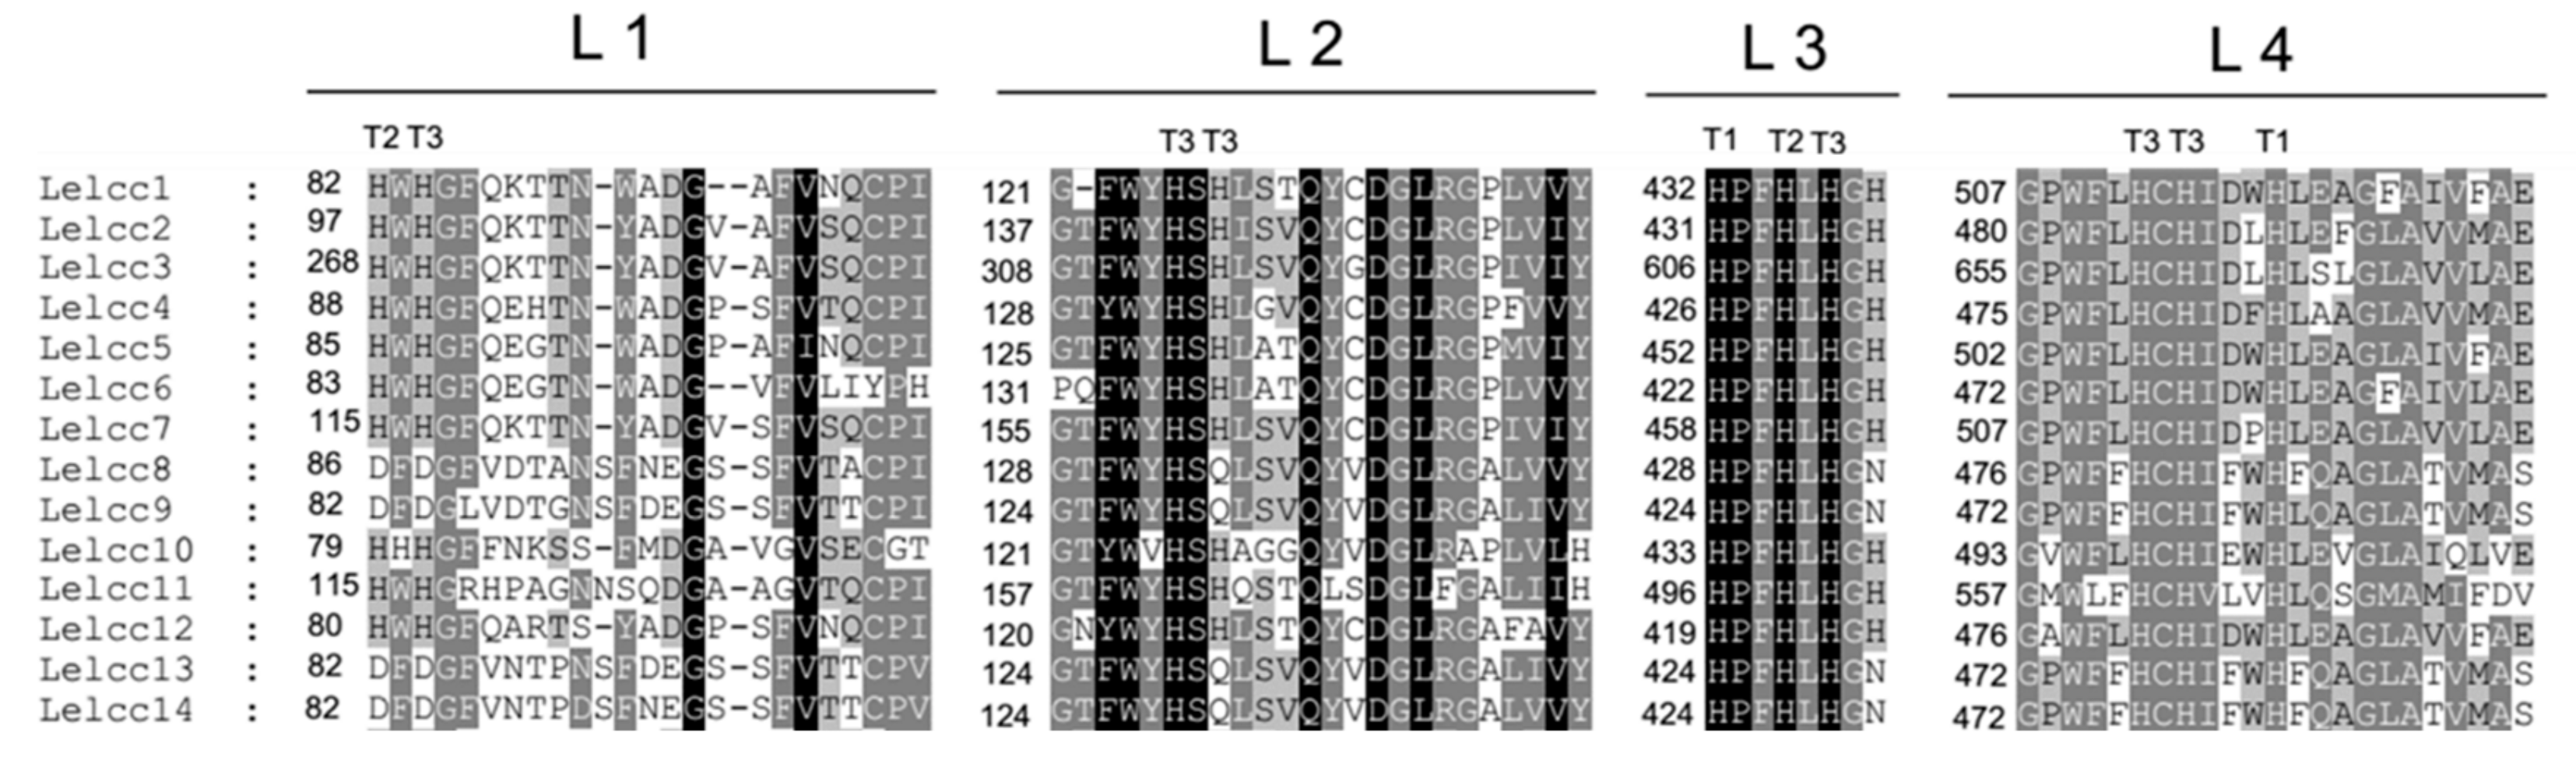
In a previous study, 13 laccase genes, excluding Lelcc8 in L. edodes D703PP-9, were analyzed and categorized into three subfamilies [11]. Phylogenetic analysis of the L. edodes W1-26 strain showed that Lelcc8 could be categorized into laccase sensu stricto subfamily 2 (Supplementary Figure S1). Analysis of laccase signature sequences (L1–L4) using amino acid sequence alignment showed that all the laccases of the W1 strain had four signature sequences (Figure 2). Lelcc8, Lelcc9, Lelcc13, and Lelcc14 each lacked several T2/T3 copper-binding histidines, but possessed the conserved histidines for T1 copper binding, suggesting that they were different from the other laccase genes with respect to their affinity toward T2/T3 copper ions.
3.2. Analysis of Stress-Related Cis-Elements in L. edodes Laccase Promoters
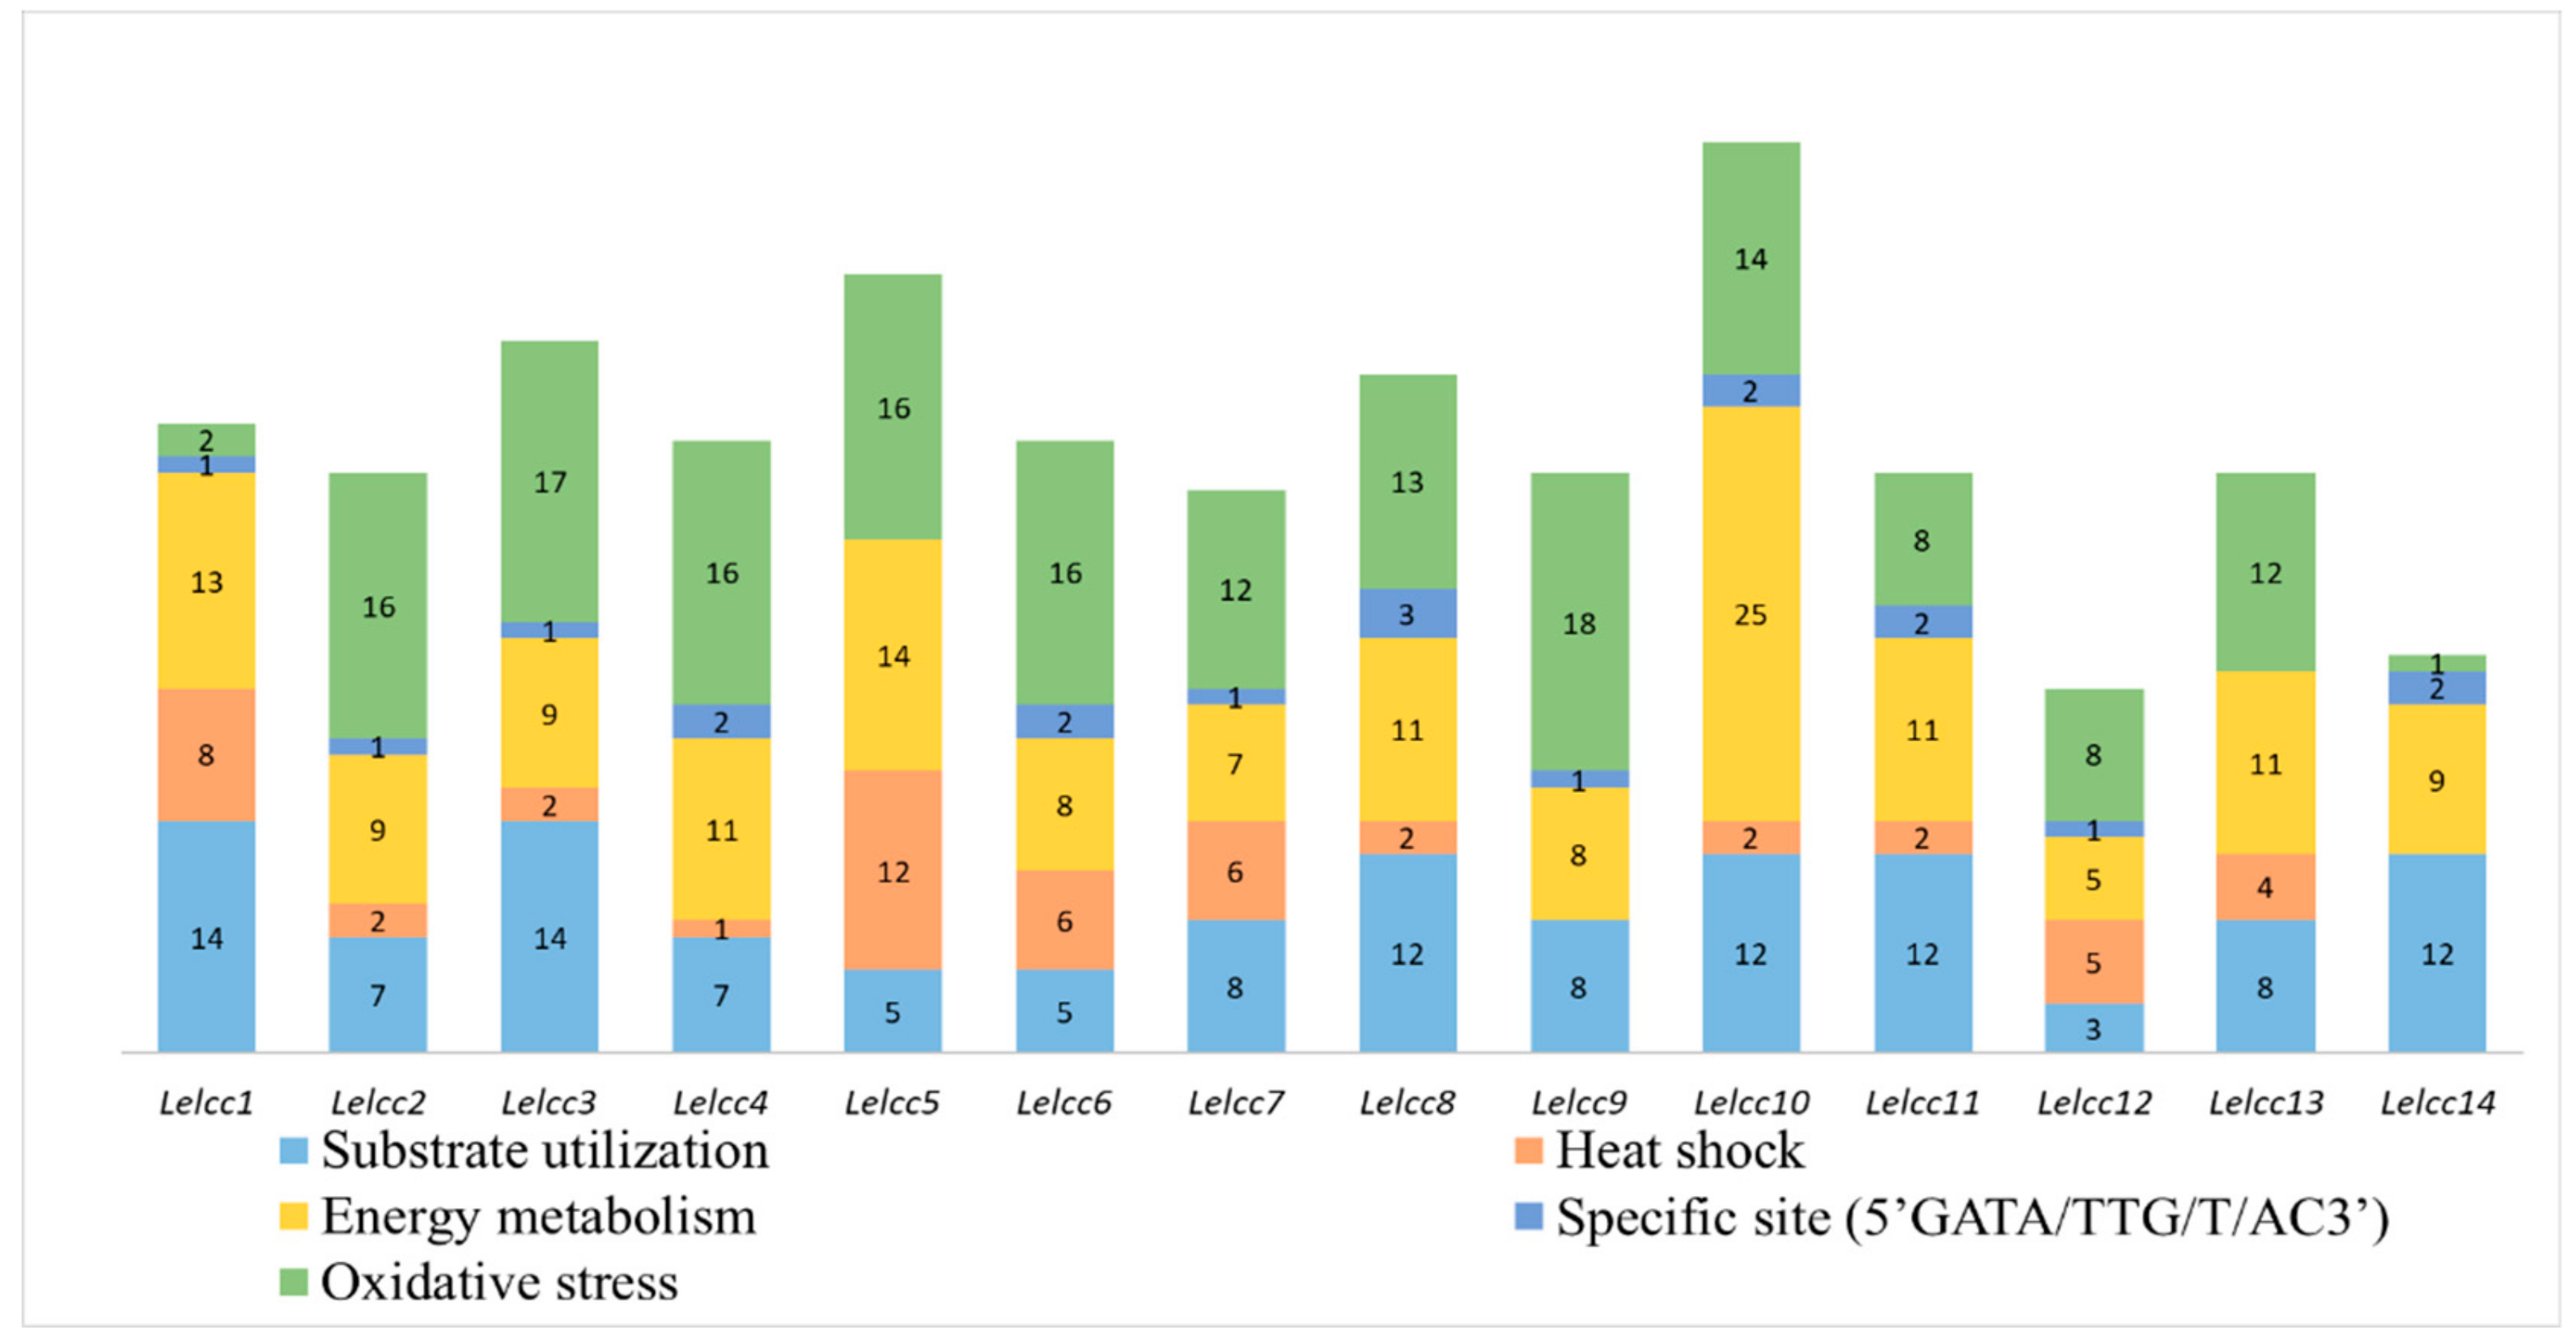
The upstream regions (1.5 kb) of the laccase sequences were obtained to search for regulation factors in response to different stress conditions. The promoter regions of Lelcc1–Lelcc14 included various stress-related Cis-acting elements (Figure 3). Among them, Lelcc10 had the most stress-related Cis-elements, including 14 oxidative stress-related, two specific sites (5’GATA/TTG/T/AC3’), 25 energy metabolism-related, two heat-shock-related, and 12 substrate utilization-related Cis-elements. All of the genes had Cis-elements related to energy metabolism, substrate utilization. and oxidative stress in the promoter regions. However, due to the limited number of stress-related Cis-elements in yeast types, no light and low-temperature-related Cis-elements were observed in the results. Almost all of the laccase genes contained phrA- and phraB-binding specific sites (5’GATA/TTG/T/AC3’) in their promoter regions. These results demonstrated that the laccase genes varied from each other in the number and type of Cis-acting elements, suggesting that the transcription of laccase genes in L. edodes could be induced by different substrates, heat stresses, photoperiods, and other stresses.
3.3. Expression Patterns of Lelcc genes in Three Different Carbon Sources
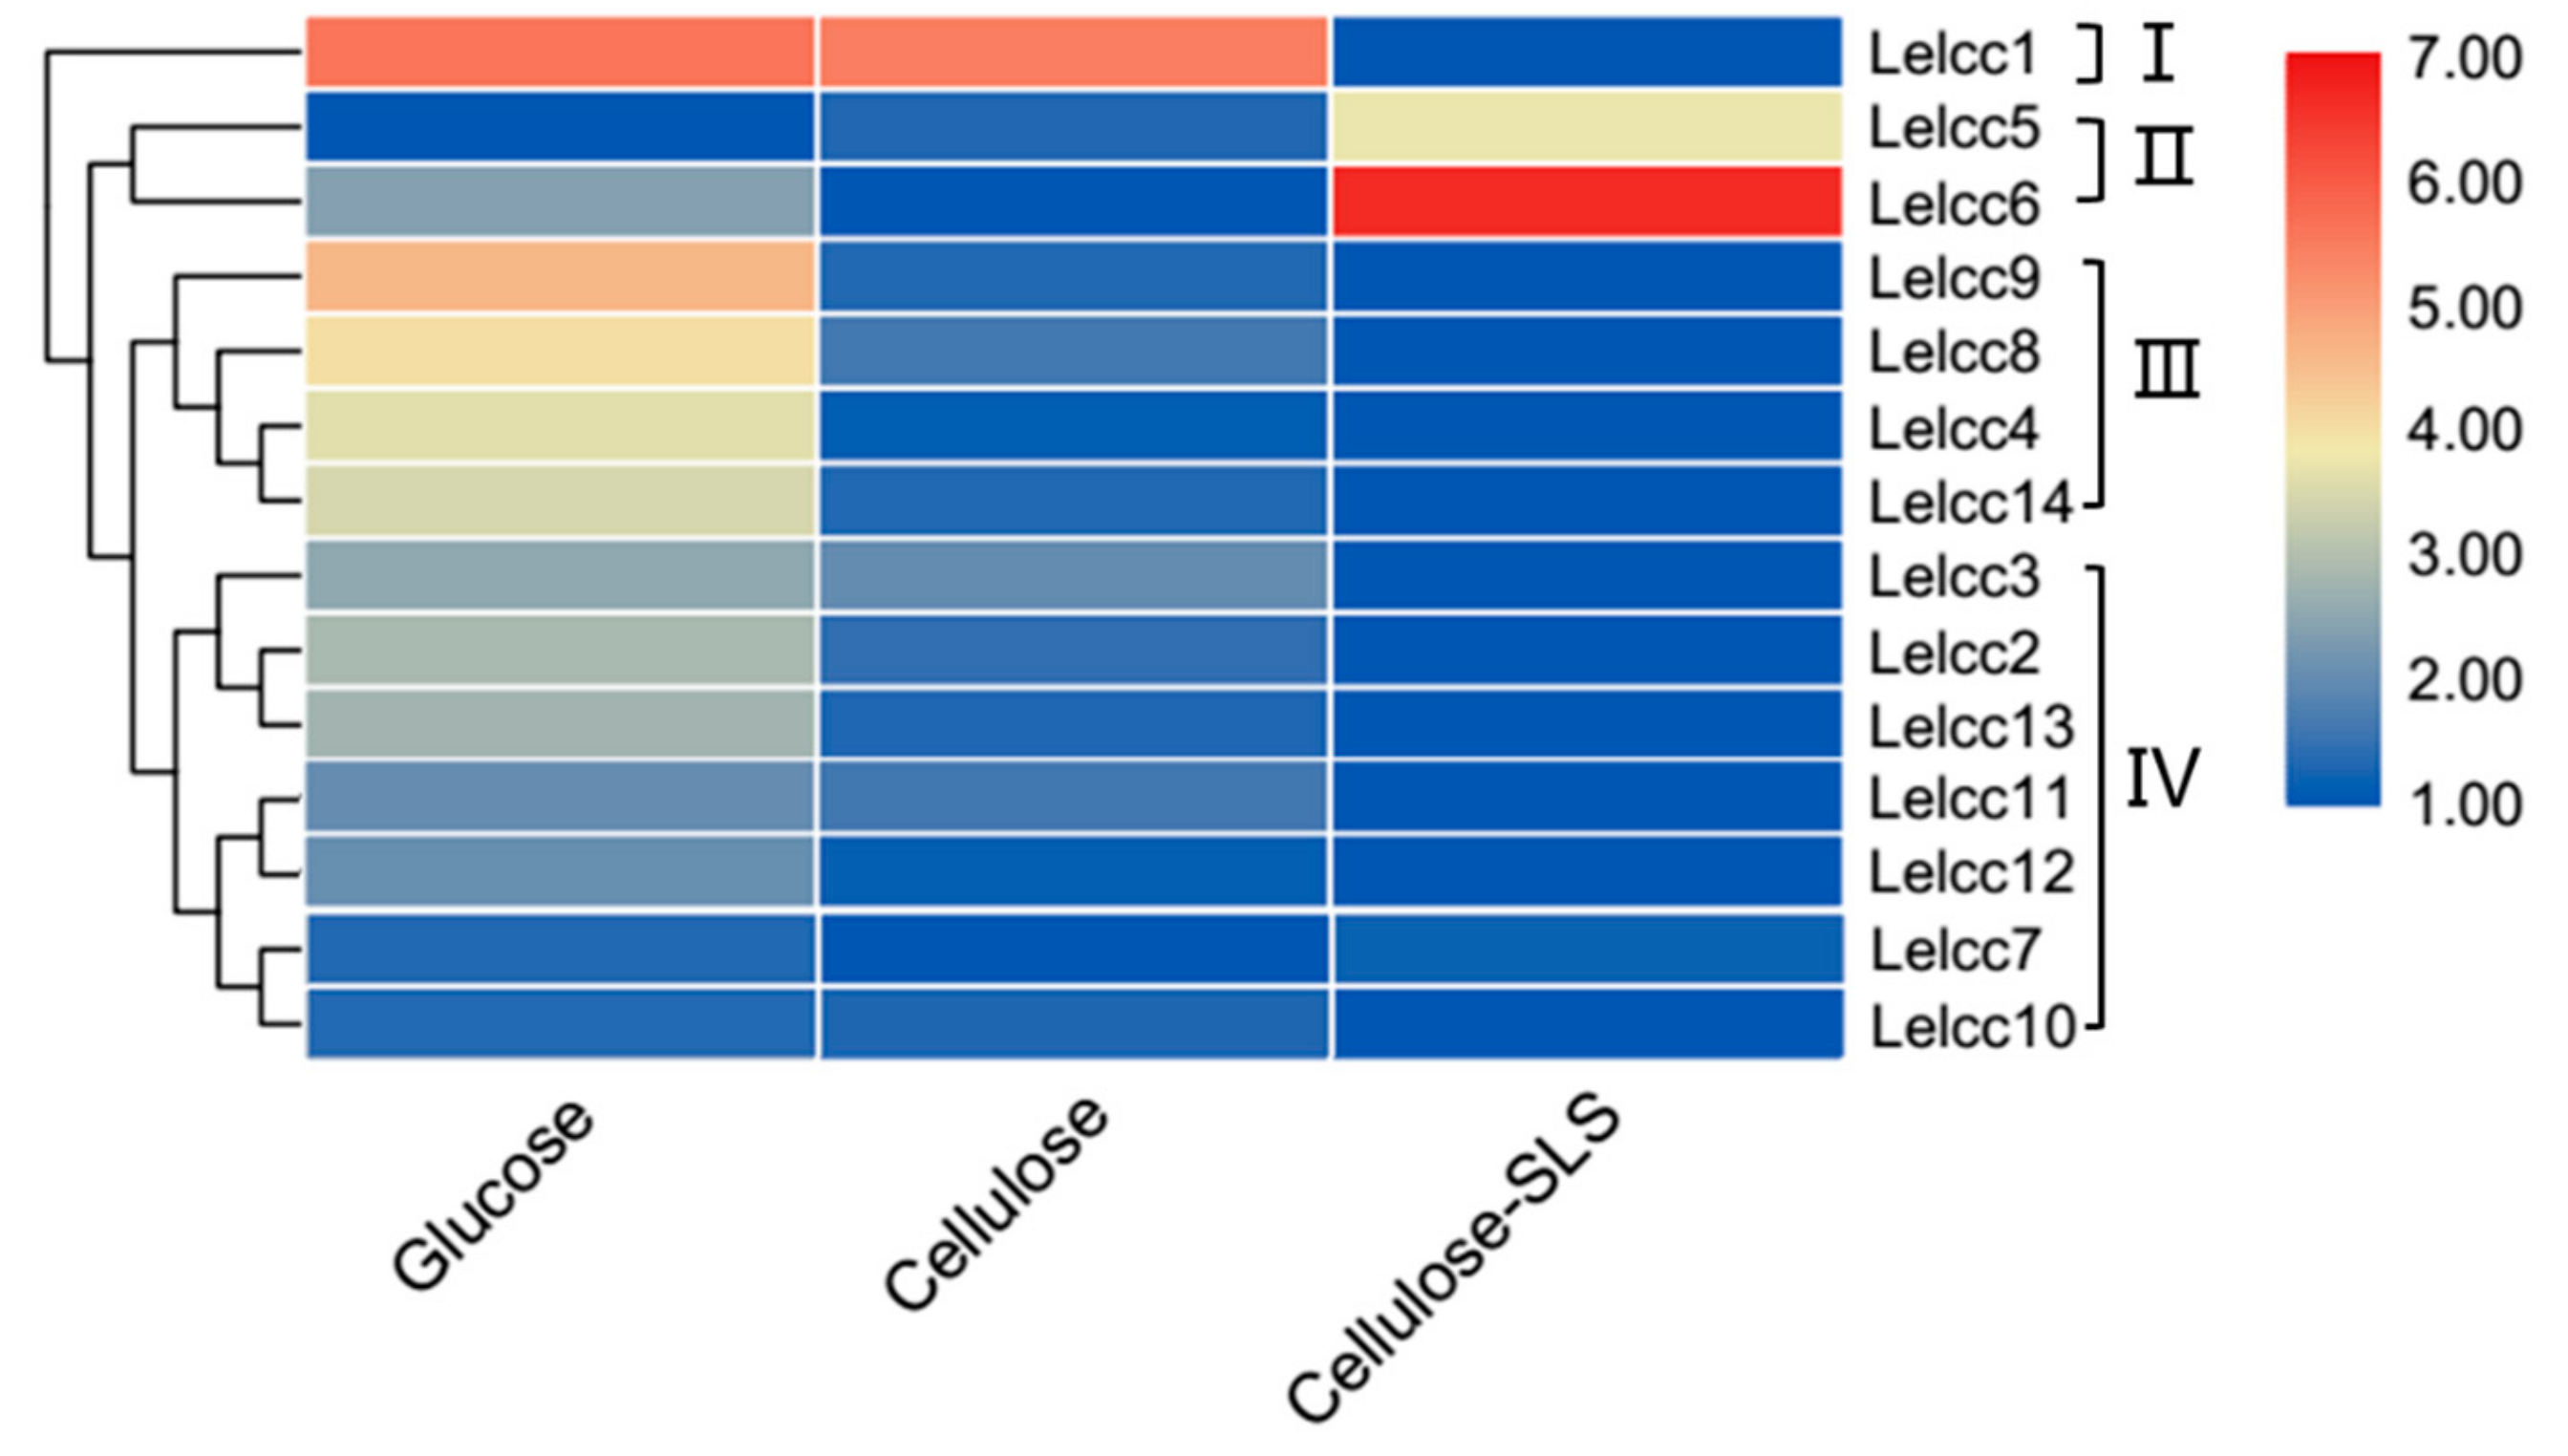
Gene expression patterns are usually closely related to their functions. The expression profiles of the laccase genes were classed into four groups (I, II, III, and IV), according to their respective similar expression patterns, as shown in Figure 4 (for detail, see Supplementary Figure S2). The relative transcription levels of Lelcc1 in CYM and CYM-C culture mediums were 48.3 and 43.9 times higher than that of the CYM-C + SLS culture medium. Compared to their expression in the other two carbon sources, the laccase genes of Group II (Lelcc5 and Lelcc6) tended to be induced by the mixed carbon source (microcrystalline cellulose plus 0.1% sodium lignosulfonate), with their relative expression levels showing a 12.4- and 101.6-fold increase, respectively. These results were consistent with the comparative secretomic data published previously [27]. The most Lelcc genes in group III (Lelcc4, Lelcc8, Lelcc9, and Lelcc14) were observed to be transcribed almost exclusively in the CYM culture medium. The remaining seven laccases were clustered into Group IV, with higher expression levels detected in CYM or CYM-C medium than in CYM-C + SLS. Moreover, the changes in the relative expression levels of the same genes in group IV were relatively small. Collectively, the expression of most Lelcc genes was significantly altered in diverse carbon sources, implying that the Lelcc genes might be involved in fungal utilization and degradation of carbon sources.
3.4. Expression Patterns of Lelcc genes in Response to Heat or Cold Treatments
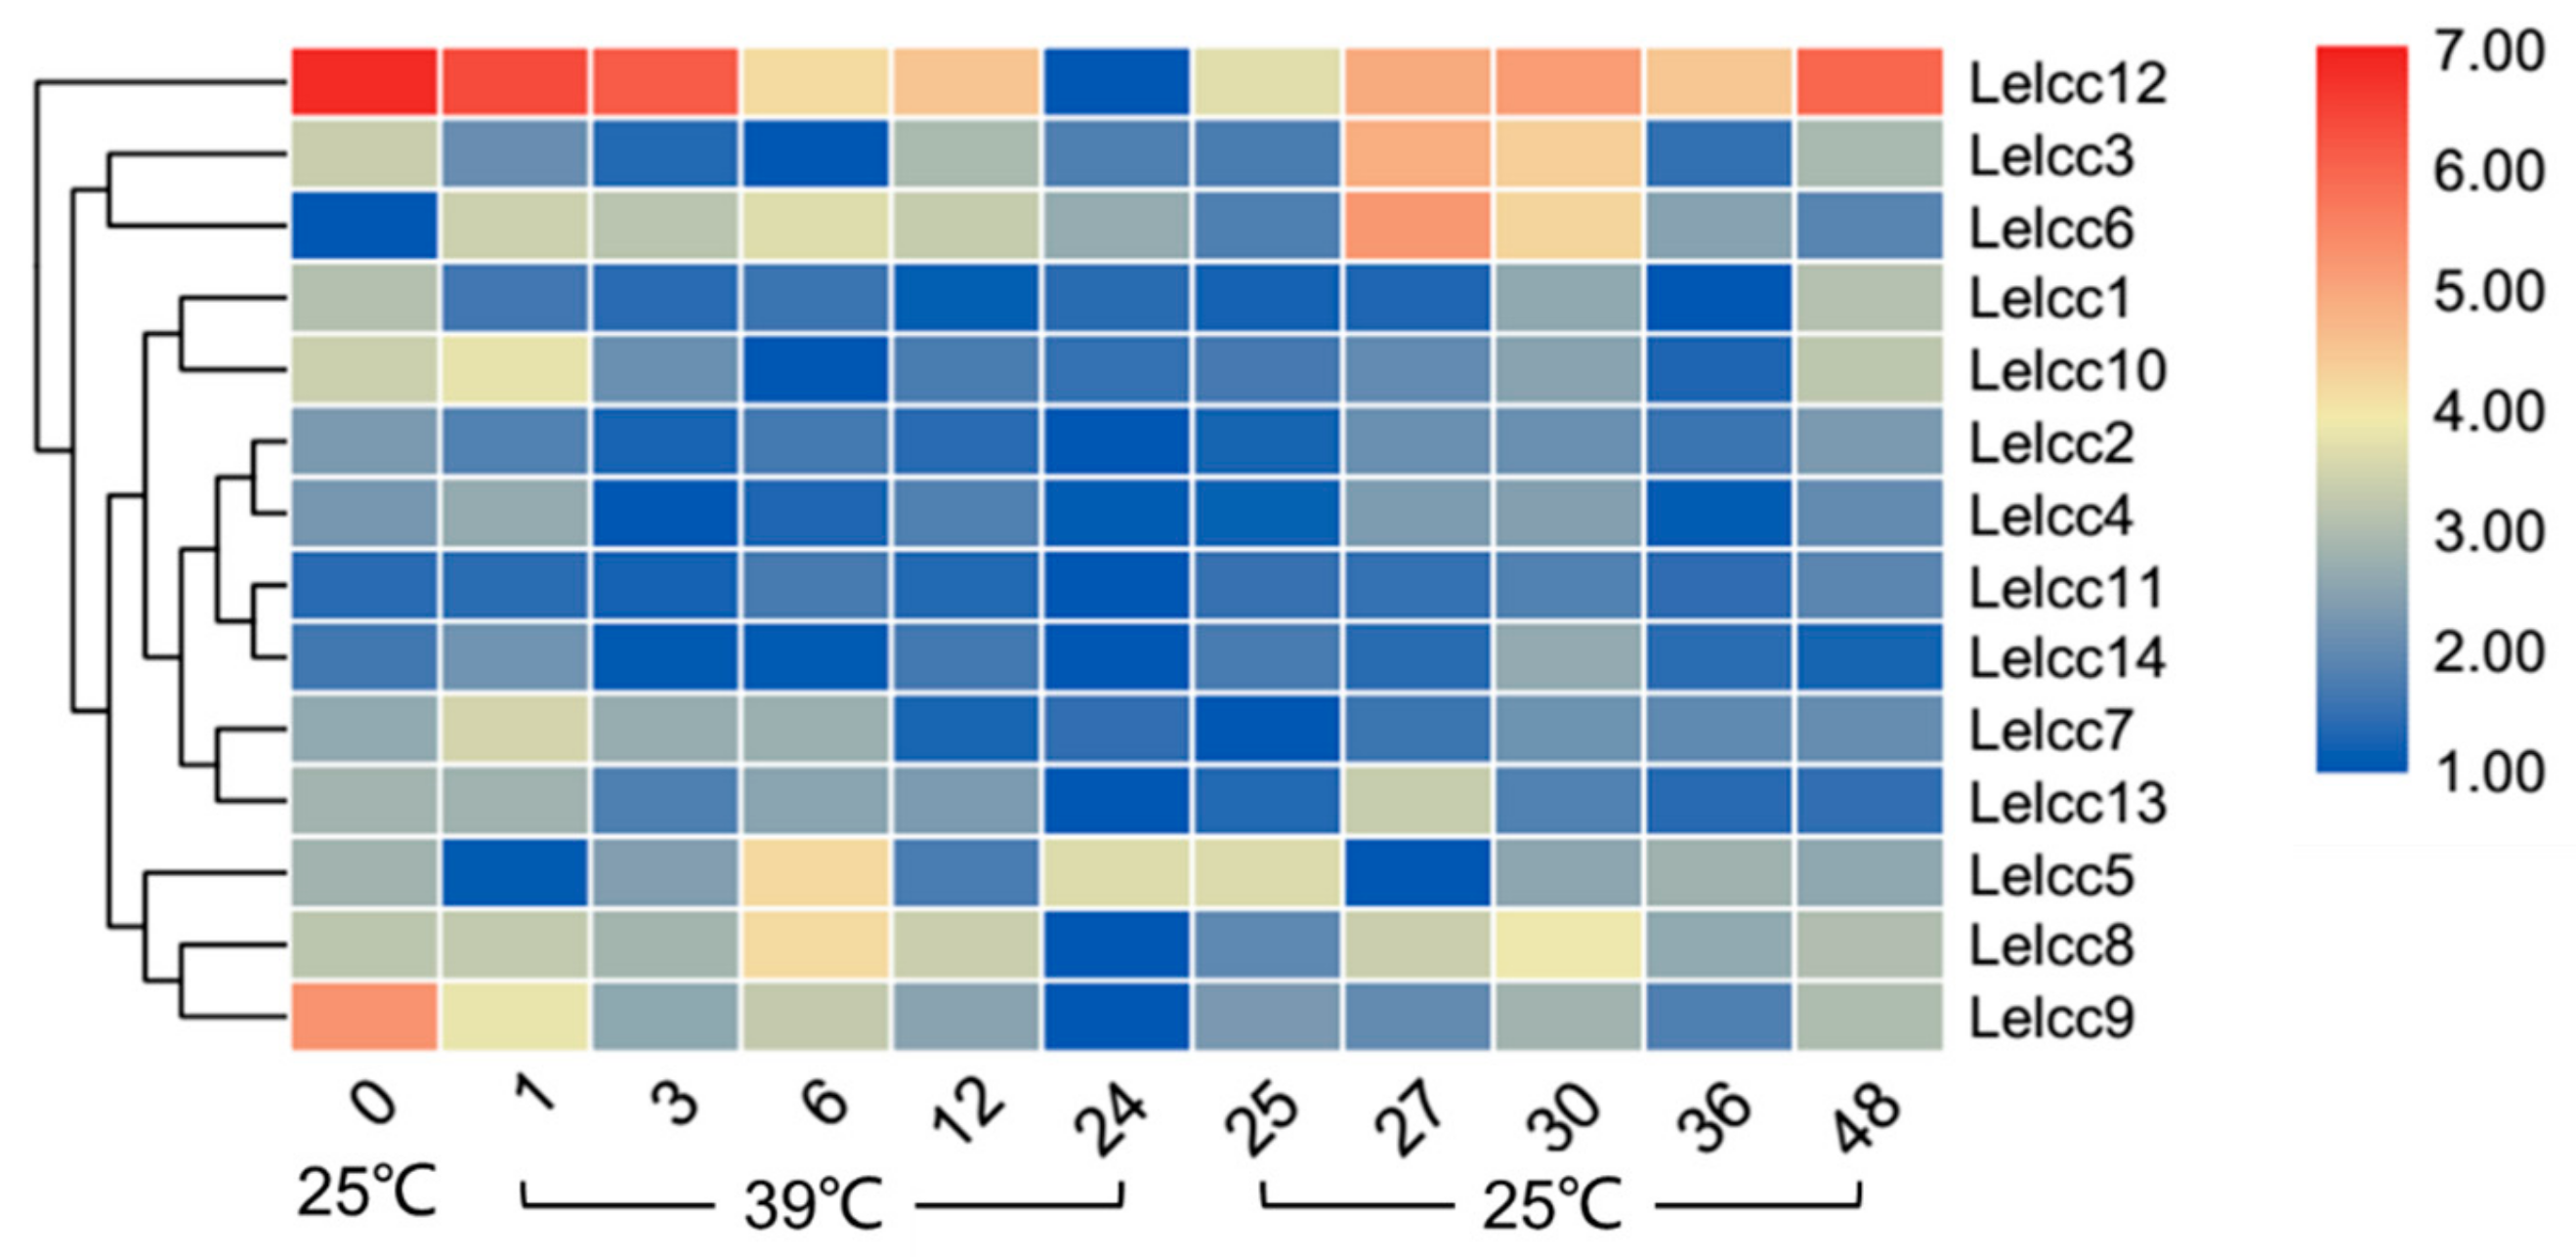
As shown in Figure 5 (for detail, see Supplementary Figure S3), the relative transcription levels of most Lelcc genes were low at 24 h under heat stress. The relative expression of the same genes (Lelcc1, Lelcc2, Lelcc7, Lelcc9, Lelcc10, Lelcc12) showed a continuous decreasing trend after heat stress, with a 38.5- and 115.5-fold decrease in the relative expression levels of Lelcc9 and Lelcc12 after 24 h of heat stress. During treatment at 39 °C, the expression levels of Lelcc7 and Lelcc10 increased significantly at 1 h, followed by a steady decrease until 24 h. the relative expression of Lelcc5 was significantly depressed at 1 h, upregulated until 12 h, and then upregulated again at 24 h under heat stress. The relative transcription levels of most of the Lelcc genes were restored after treatment at 25 °C, such as Lelcc3, Lelcc6, Lelcc8, Lelcc9, and Lelcc12. The laccase genes Lelcc3, Lelcc6, and Lelcc13 presented intense changes at 25 °C after heat stress, and the peak value appeared at 27 h or 30 h. Moreover, Lelcc3 and Lelcc6 showed significantly higher relative expressions than most of the other laccase genes at the prophase of 25 °C recovery (27 h), followed by a gradual decrease. Collectively, high temperature had an inhibitory effect on the transcription of most laccase genes, while their relative expression levels gradually rose after returning to 25 °C.
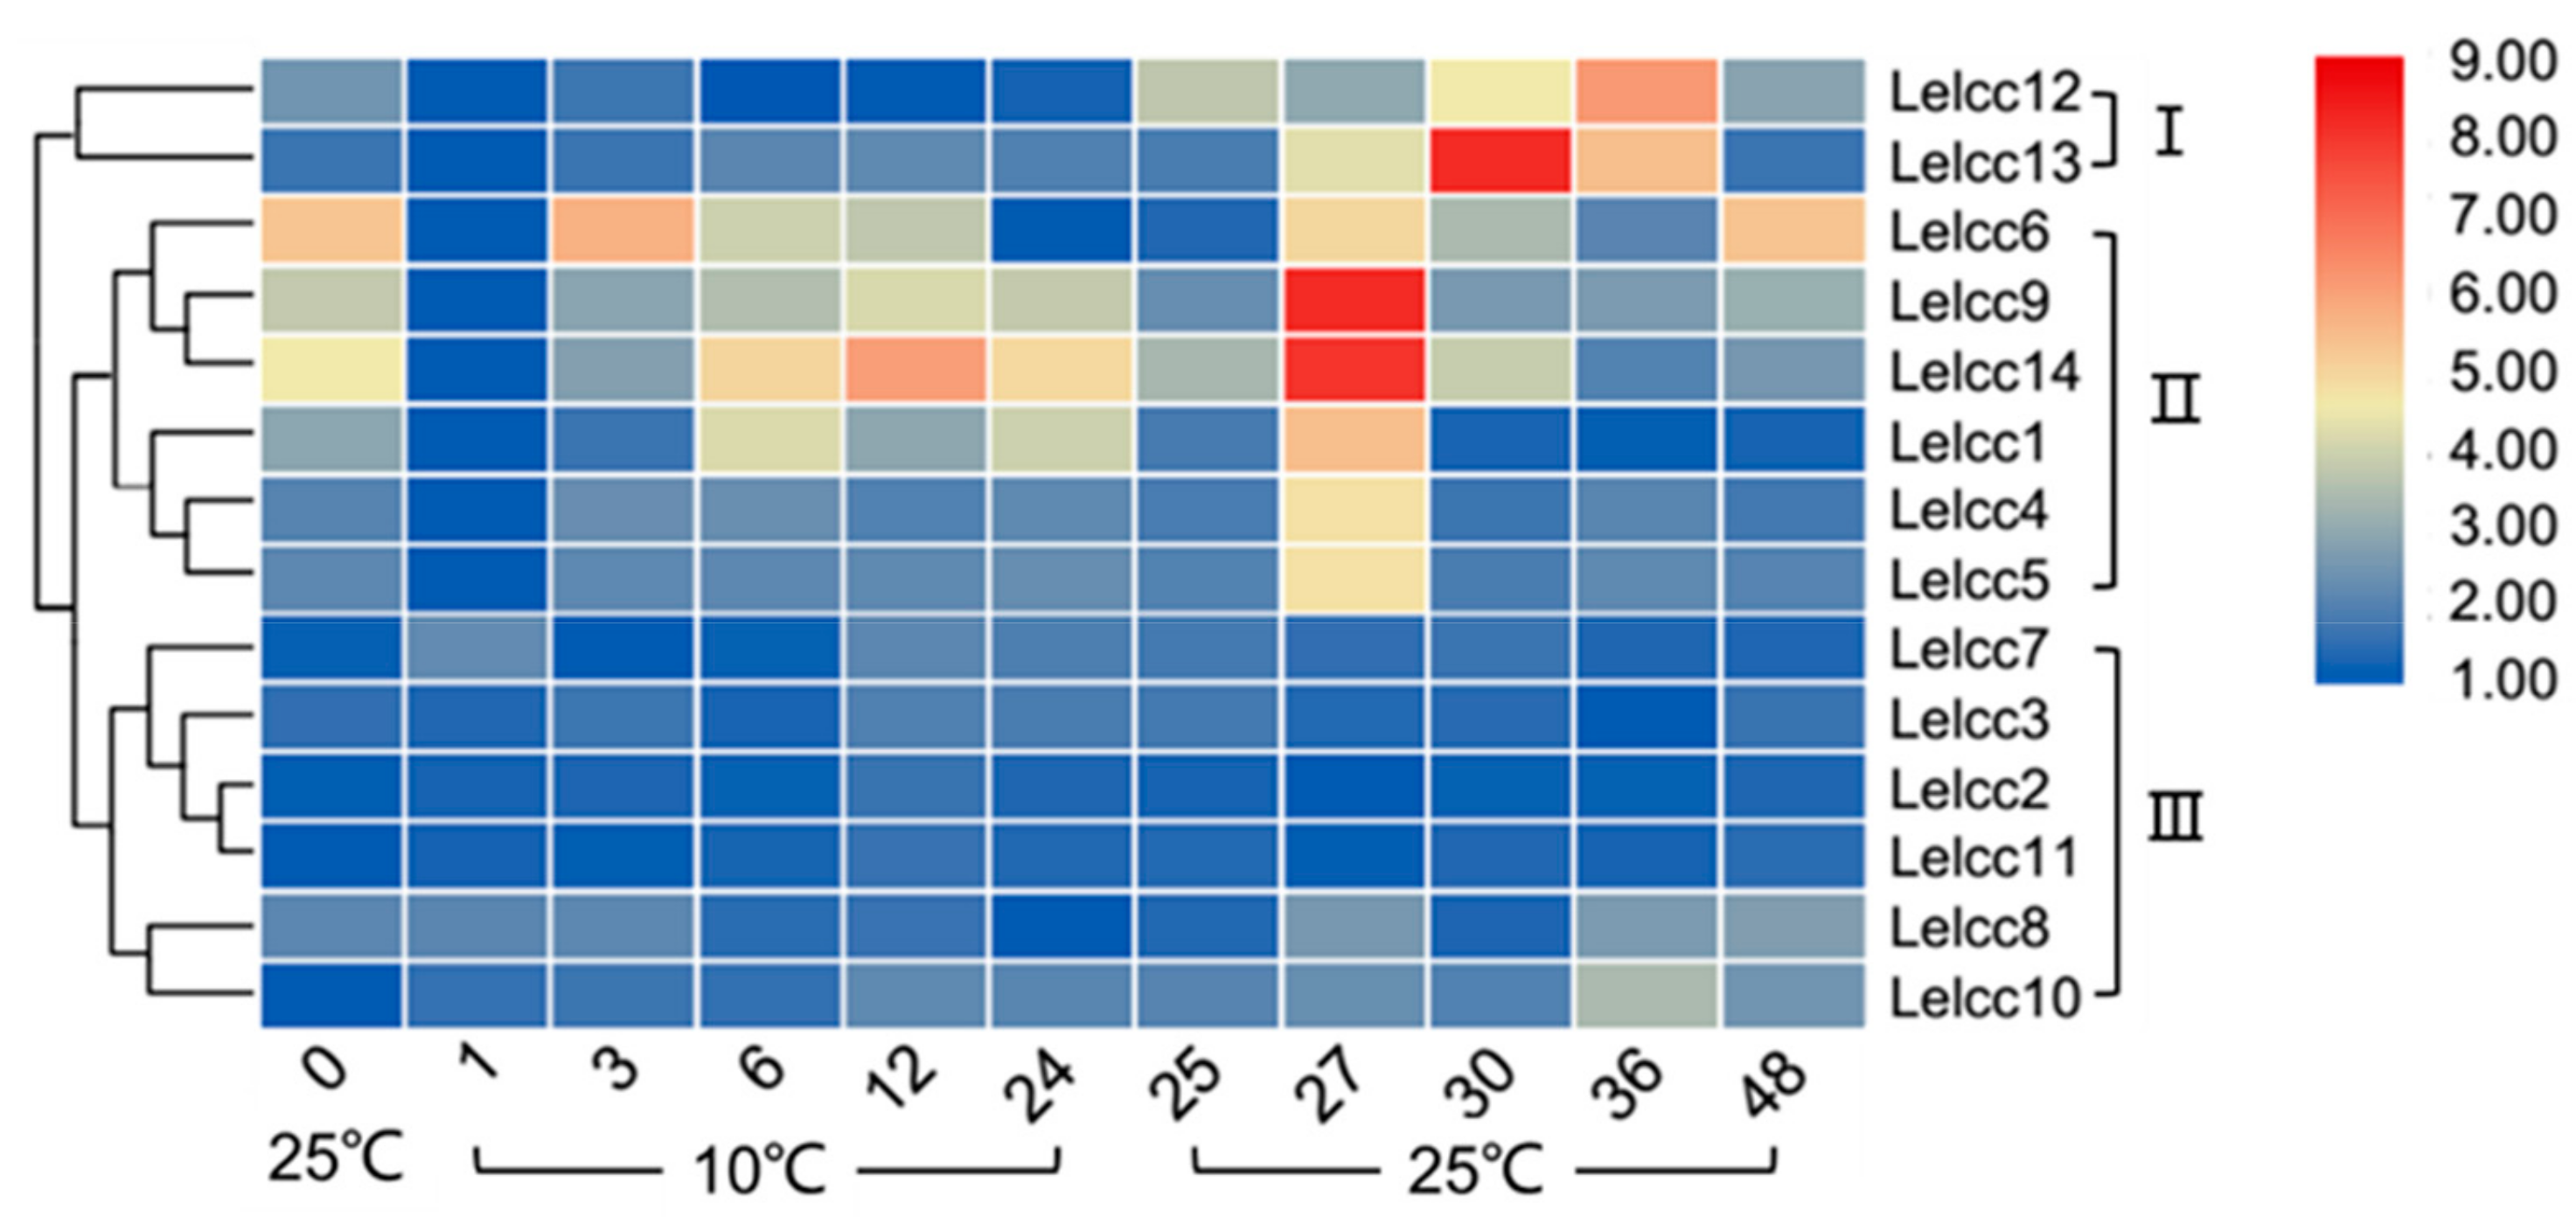
In Figure 6 (for detail, see Supplementary Figure S4), the expression patterns of the LeLcc family were shown to vary under cold stress treatment and were divided into three groups (I, II, and III). In Group III (Lelcc7, Lelcc3, Lelcc2, Lelcc11, Lelcc8, Lelcc10), the laccase expression showed almost no striking variation at 10 °C and 25 °C, suggesting that these laccase genes were possibly not involved in the fungal response to cold stress. The transcription of genes in Group I (Lelcc12, Lelcc13) was stable most of the time during treatment at 10 °C, but was rapidly upregulated and peaked at 36 or 30 h when the temperature returned back to 25 °C, followed by a decrease. The relative transcription of Lelcc13 showed over a 290-fold increase at 30 h. In Group II (Lelcc6, Lelcc9, Lelcc14, Lelcc1, Lelcc4, Lelcc5) the Lelcc genes, apart from Lelcc6 and Lelcc8, exhibited a similar expression pattern to that of Group II, with a rapid upregulation and peak observed in their expression at 27 h rather than at 30 h. The relative transcription of Lelcc9 and Lelcc14 increased by 294- and 262-fold, respectively, compared with the lowest expression level. Overall, under 10 °C cold treatment, the transcription of some laccase genes failed to be induced, while the others varied in their expression, with most of them showing rapid up-regulation or maximal expression levels after returning to 25 °C.
3.5. Expression Patterns of Lelcc genes in Response to Different Photoperiods
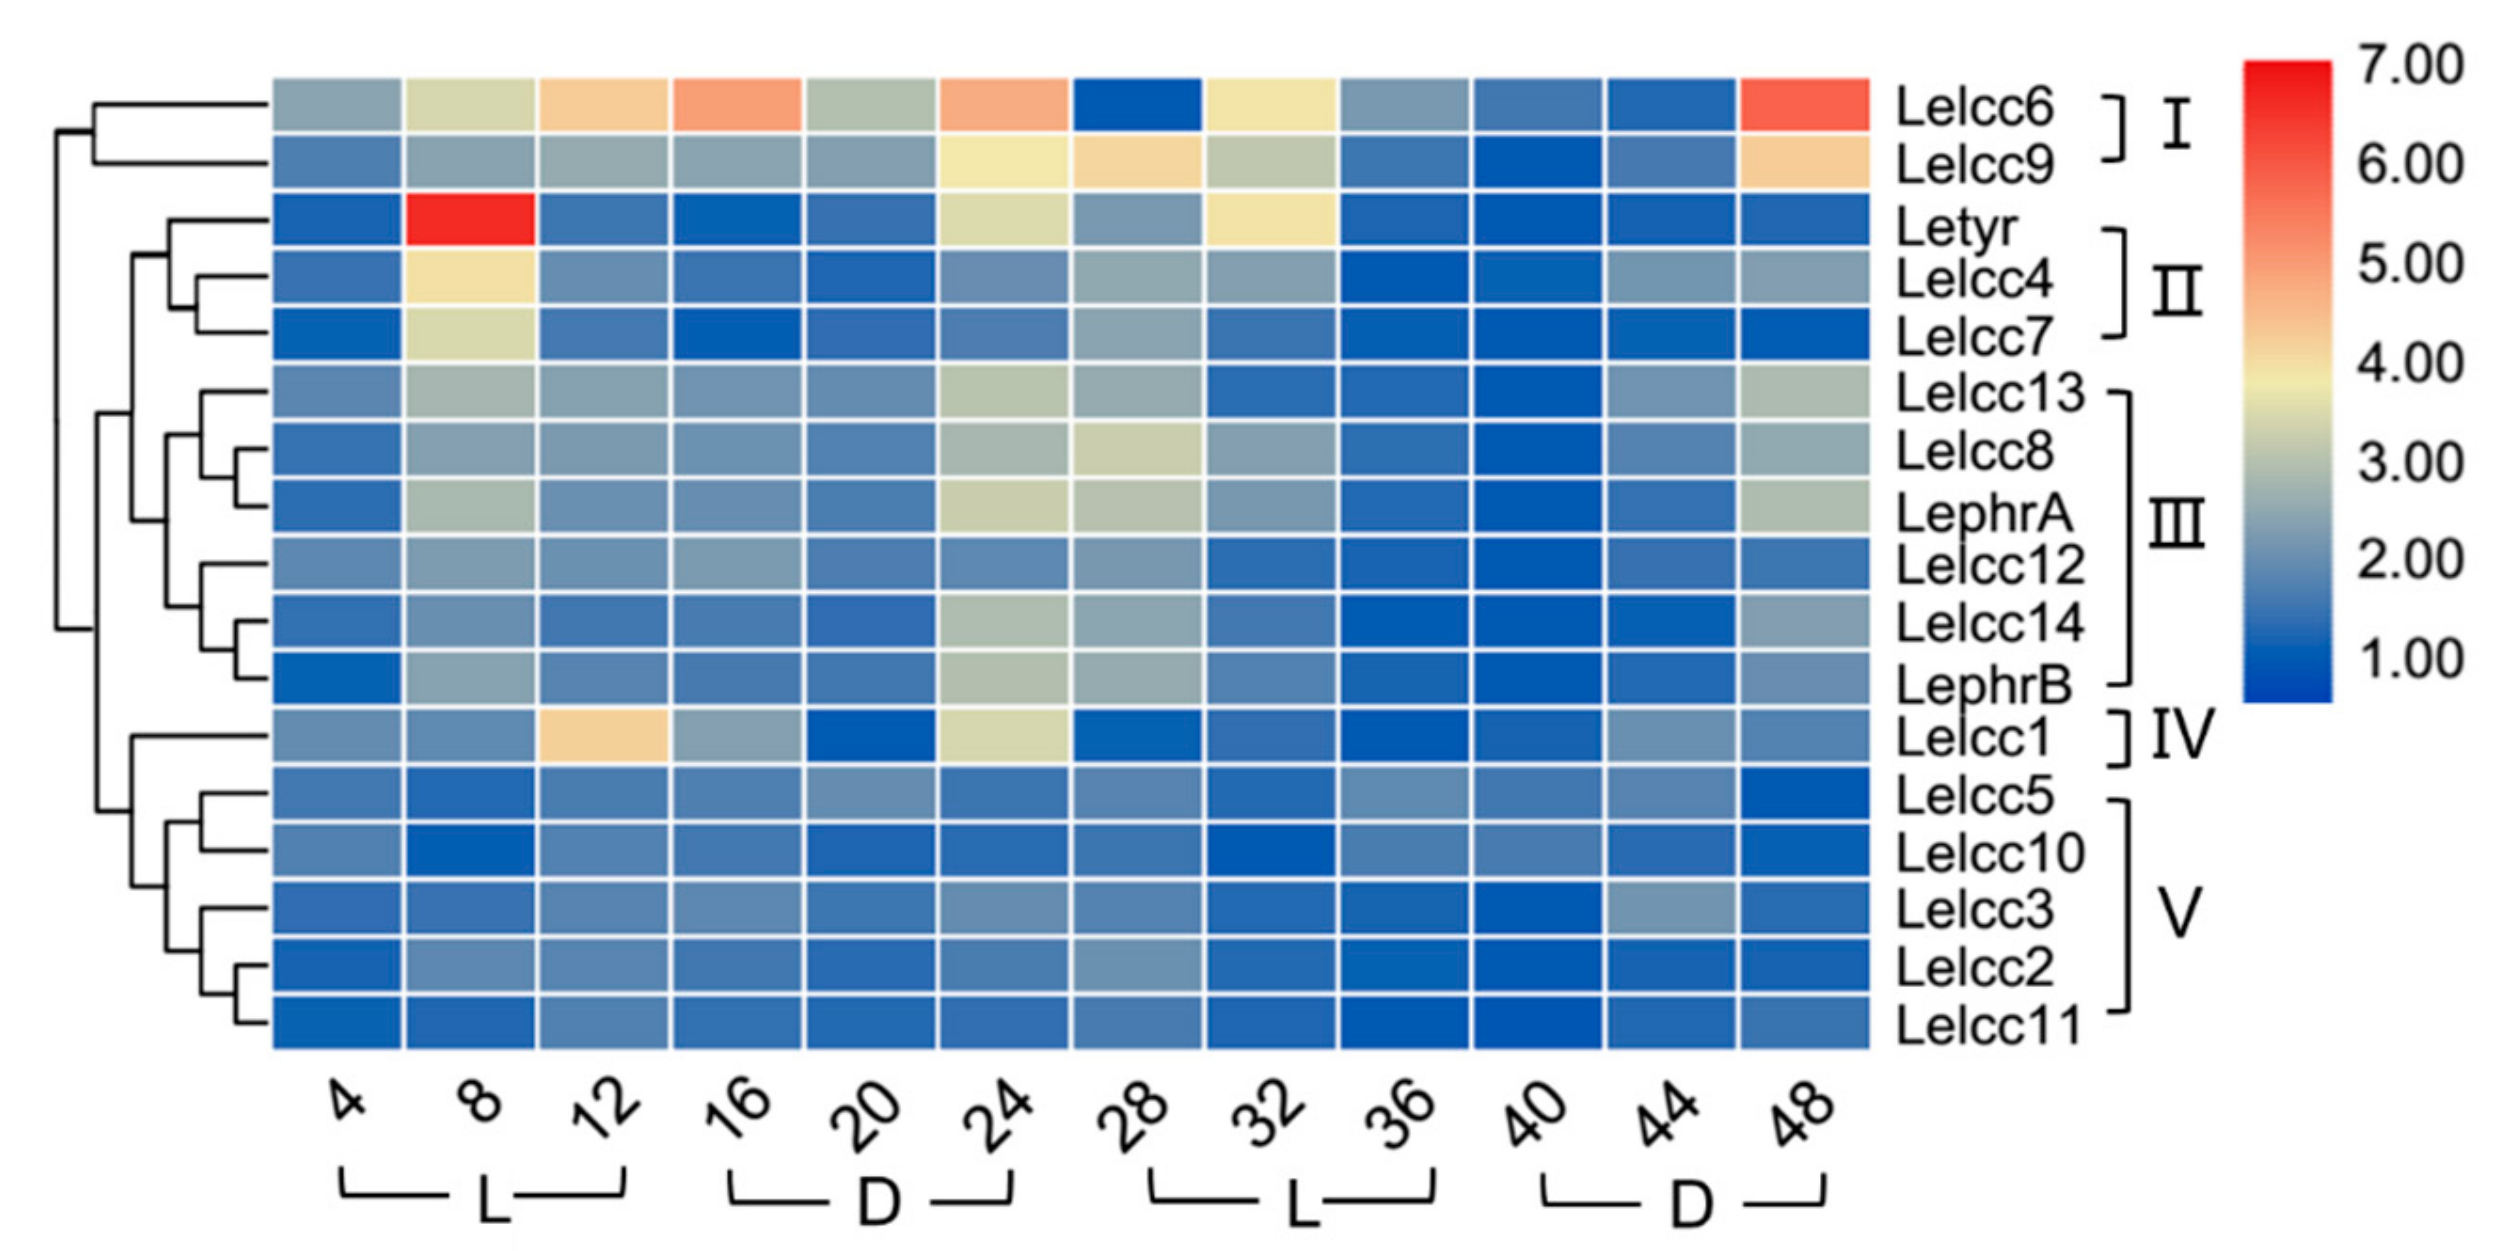
Light-induced transcriptional regulation of laccase genes LephrA, LephrB, and Letry of L. edodes was analyzed by RT-qPCR using specific primers. As shown in Figure 7 and Supplementary Figure S5, the expression profiles of the LeLcc genes in the photoperiod of 12 h light/12 h dark were divided into five groups (I, II, III, IV, and V). Group V (Lelcc5, Lelcc10, Lelcc3, Lelcc2, Lelcc11) showed almost no significant variation of laccase expression, indicating that the five laccase genes may not have been involved in the light response. Letyr, Lelcc4, and Lelcc7 were clustered to group II; their expression remained stable most of the time, but with a rapid upregulation and peak at 8 h, followed by a significant decrease at 12 h. The expression profiles of four laccase genes (Lelcc8, Lelcc9, Lelcc13, and Lelcc14) and two blue light receptor genes (LephrA and LephrB) were extremely similar, with an increase in all relative expression levels at 8 h under the light condition, followed by a sequential decrease until a peak at 24 h (in the dark), followed by another sequential decrease from dark to light, reaching the minimal level at 40 h. These results illustrated the close relationship between the four laccase genes and the two blue light receptor genes in response to light stimulus. The genes of both group II and III showed an increase in their relative expression levels at 8 h. Taken together, the laccase genes and the three known light-response genes showed extremely similar expression profiles, indicating the potential involvement of these laccase genes in the molecular response of L. edodes to light.
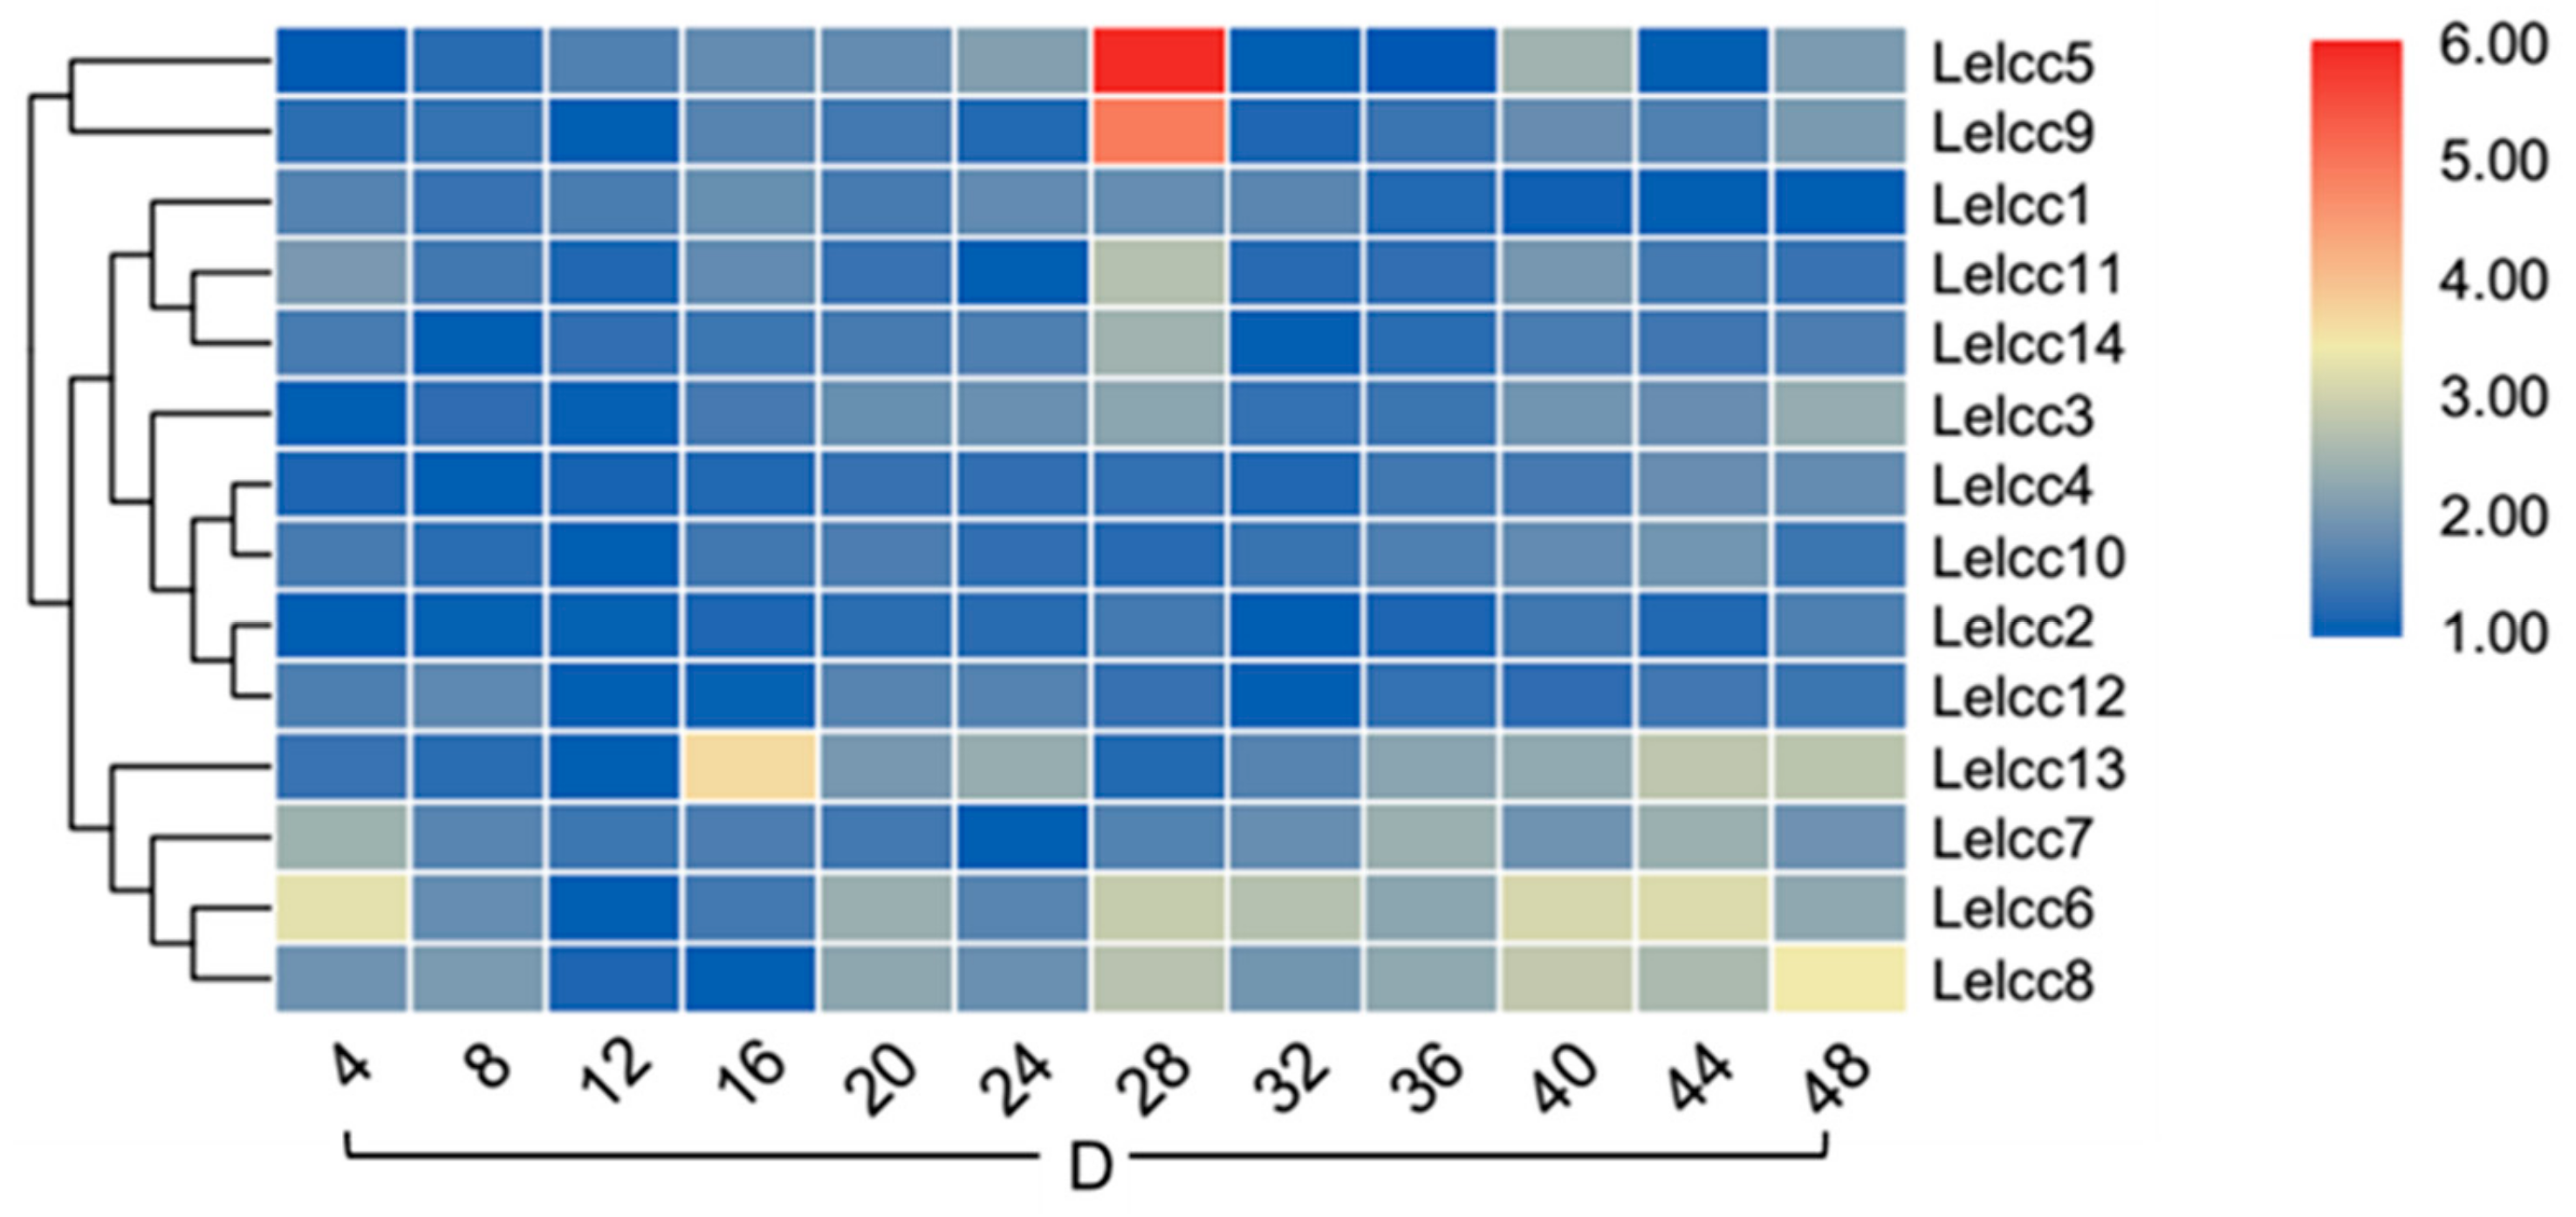
To further understand how light regulates the expression of laccase genes, the expression patterns of laccase genes under continuous illumination (24 h light/0 h dark) and continuous darkness (0 h light/24 h dark) were examined (Figure 8, Supplementary Figure S6, Figure 9, and Supplementary Figure S7). Intuitively, the relative expression levels showed a smaller variation in the photoperiod of 24 h light/0 h dark and the photoperiod of 0 h light/24 h dark than in the photoperiod of 12 h light/12 h dark. In the photoperiod of 24 h light/0 h dark, LephrA and LephrB showed no significant fluctuation in their relative expression levels. The two laccase genes (Lelcc4 and Lelcc7) and the tyrosine gene (Letyr) were still clustered to the same group, with their relative expressions peaking at 8 h. In the continuous dark photoperiod of 0 h light/24 h dark, with increasing time, the expression showed little difference in Lelcc4 and Lelcc7. This result indicated that the expression of Lelcc4 and Lelcc7 may have been induced by light and was closely related to tyrosinase.
4. Discussion
In 2015, 13 of the 14 laccases, excluding Lelcc8, were identified in L. edodes D703PP-9 [11]. In this study, we analyzed all 14 laccase genes in L. edodes W1-26. The majority of the fungal laccases are extracellular monomeric globular proteins of approximately 50–70 kDa, with an acidic isoelectric point (pI) around pH 4.0 [7]. The characteristic analysis results of the proteins in this report were similar to those of previous studies, indicating that the laccases of L. edodes are the typical ones. Most of the laccase secreted to the outside of the cell is acidic [31]. The fungal laccase amino acid sequence generally contains a signal peptide sequence at the N-terminus to guide transmembrane transfer [17]. In this study, except for LELCC3 and LELCC11, the laccases possessed the signal peptide, while in L. eodes D703PP-9, LELCC3 contained the signal peptide. Additionally, the L1 sequences of LELCC8, LELCC9, LELCC13, and LELCC14 in L. edodes W1-26 are more complete than those in L. edodes D703PP-9 [11]. This indicates that the laccase genes not only vary between different species, but also between different varieties. Signal peptide sequence deficiency was also reported in Flammulina velutipes and Setosphaeria turcica [32,33], as well as in plants [34], implying that the laccase gene may have lost the signal peptide sequence during evolution.
The original laccase gene is differentiated into paralogous genes with different functions to fulfill the various functional requirements of fungi throughout the life cycle [35]. Previous studies showed that it was common for fungal laccase genes to be clustered on the same scaffold. In P. ostreatus, 12 PoLac genes were mapped to six scaffolds and in L. edodes strain D703PP-9, 13 laccase genes were mapped to seven scaffolds [17,36,37]. In the current research, the 14 laccase genes were unevenly scattered among eleven scaffolds, probably due to the imperfect genome assembly of the reference genome in W1-26.
In this research, many stress-related Cis-elements were observed in the nucleotide sequences extending 1500 bp upstream of the Lelccs and were classified into five major groups, such as oxidative stress-related, specific sites (5′GATA/TTG/T/AC3′), energy metabolism-related, heat-shock-related, and substrate utilization-related Cis-elements. Cis-elements were shown to play significant roles in the regulatory process of responding to multiple abiotic stresses [38]. These results implied that Lelcc genes could be involved in fungal response processes toward multiple stresses. In heterokaryons, different nuclear types exist within a single cell of L. edodes. In this research, the parent dikaryotic strain W1 was used to detect gene expression levels, while the genome data of W1-26, a single spore culture derived from W1, were used for the Cis-elements analysis. This may be responsible for the inconsistency between the gene expression patterns and the prediction of Cis-elements. Widespread transcriptomic variation was identified between the nuclear types of Agaricus bisporus and L. edodes, and two different nuclei contributed differently to the regulation of the fungal cells [39,40]. The relationship between the promoter Cis-elements and gene expression levels of Lelccs should be studied further.
Understanding the mechanism of lignocellulose degradation by L. edodes is critical. The expression pattern was detected by qRT-PCR for the laccase family members in L. edodes, which was cultured with three different carbon sources and divided into four groups by clustering analysis. The relative transcription levels of Lelcc1, Lelcc5, and Lelcc6 were consistent with our previous comparative secretome analysis in different carbon sources (microcrystalline cellulose, lignosulfonate, and glucose) [27]. This indicates the reliability of the qRT-PCR analysis used to detect the relative transcription levels of the genes in this study. In this study, the relative transcription levels of group II (Lelcc5 and Lelcc6) were induced by lignosulfonate, highlighting their roles in ligocellulose degradation, which was consistent with a previous study reporting that the laccases were involved in lignin degradation [41]. Conversely, group III (the last 12 laccase genes) was observed almost exclusively in glucose culture. Previous studies showed that rich available glucose in the medium led to cellular oxidative stress, and laccase of L. edodes can be assumed to have a protective role rather than a direct role in lignocellulose deconstruction [27]. Oxidative stress was observed to stimulate the extracellular laccase activity of some white rot basidiomycetes, such as Fomes fomentarius, Tyromyces pubescens, Trametes versicolor, and Abortiporus biennis [42,43]. The transcriptome and exoproteome analysis of Dichomitus squalens demonstrated that laccase adapted well to the changing substrate [44]. Similar results were reported in the white-rot fungi Pycnoporus coccineus and Phlebiopsis gigantea [45,46]. Overall, the expression profile of laccase genes varied significantly in diverse groups, implying that the genes in the fungal laccase family may have functionally differentiated during adaptation to the changing environment, and the process of carbon source utilization requires high coordination among multiple laccases. This assumption needs to be further elucidated in future studies.
Proper cold stimulation is essential to induce the differentiation of hyphae from primordia to fruiting bodies [47]. In the present study, the expression profile of the Lelcc gene was analyzed during different temperature treatments. At the onset of the low-temperature induction, the expressions of some laccase genes (Group I and II) were significantly reduced, probably due to the rapid response of laccases at low temperatures. This was similar to a report regarding laccase activities in Pleurotus tuoliensis [12]. The relative expressions of most laccase genes reached the highest level during 25 °C recovery phases. These results were consistent with the findings regarding P. tuoliensis [12]. L. edodes is a variable temperature fruiting mushroom and the subsequent process of fruiting-body development may require a large amount of carbohydrates. Laccases are involved in the degradation of lignocellulose into available sugar for fungi during development [12]. Thus, a large quantity of laccases could be induced to degrade lignin and cellulose for fruiting-body development after low-temperature induction. Overexpression of lcc1 in H. marmoreus resulted in the induction of primordium initiation about 3–5 days earlier in the transgenic fungus [18]. To date, the regulation of laccase expression and the role of mushroom laccase during adaptation to temperature change has not been thoroughly elucidated.
Heat stress significantly inhibits the growth of mycelium and the formation of fruit bodies [47]. In the heat treatment, the relative expression of most laccase genes showed a continuous decreasing trend when the mycelia of L. edodes were grown at 39 °C, in contrast to an increasing trend at 25 °C after heat stress. The mycelial activity and growth rate of L. edodes decreased in the presence of high temperatures [28,48,49]. Thus, high temperature inhibits the transcription of the laccase genes, which may be responsible for mycelial activity.
In this study, the expression profiles of Lelccs (Lelcc13, Lelcc14) were extremely similar to those of LephrA and LephrB. Two genes with similar expression profiles were reported to be regulated by the same transcription factor in Populus [50]. This result indicated that Lelcc13, Lelcc14, and blue-light photoreceptors were regulated by the same transcription factor or had similar functions. The transition from the vegetative stage in darkness to the reproductive stage in light may have resulted in sudden metabolic changes, such as carbon and tyrosine metabolism involved in melanin synthesis [22,51]. The expression patterns of laccases in group II (Lelcc4, Lelcc7) were clustered into the same group as tyrosinase of L. edodes. Laccase is the third enzyme with a tyrosinase domain, other than tyrosinase and polyphenol oxidase (PPO); these three enzymes are extremely important for melanin production [52]. The pigment production induced by light in brown film formation stage was identified as melanin (unpublished). Lelcc4 and Lelcc7 may be involved in the browning of mycelium by effective melanin synthesis and light induction, a theory which is supported by previous reports showing increased transcription of laccase during the browning of mycelium under light treatment [22,51] and the involvement of lcc4 from L. edodes in melanin synthesis [53].
5. Conclusions
In summary, this study demonstrated the comprehensive expression profile of 14 laccase genes from L. edodes under different environmental stresses. The relative expression levels of the 14 genes were significantly influenced by various growth conditions, indicating the involvement of Lelccs in during adaptation to the changing environment. Additionally, the result of the dendrogram implied the potential existence of functional divergence among the 14 laccase genes of L. edodes in response to different stresses. This study provided valuable information contributing toward the understanding of the adaptive capacity of white-rot fungi to the environment and laccase engineering research.
Supplementary Materials
The following are available online at https://www.mdpi.com/2073-4425/10/12/1045/s1, Figure S1: Phylogenetic analysis of laccases in Lentinula edodes, Figure S2: Expression profiles of Lelcc genes in various carbon sources. Results are presented as mean ± standard deviation (SD), Figure S3: Expression profiles of Lelcc genes in heat stress, Figure S4: Expression profiles of Lelcc genes in low-temperature stress, Figure S5: Expression profiles of Lelcc genes in photoperiod (12h light/12h dark), Figure S6: Expression profiles of Lelcc genes in photoperiod (24h light/0h dark), Figure S7: Expression profiles of Lelcc genes in photoperiod (0h light/24h dark), Table S1: Transcription factor binding sites predicted by Yeastract, Table S2: Primers used in this study. Table S3: Lelcc members identified in L. edodes.
Author Contributions
Y.B., Y.Z., R.X., and L.Y. conceived and designed the study; L.Y., R.X., and H.L. performed the experiments and collected and analyzed the data; L.Y., Y.Z., and Y.B. wrote the manuscript; All authors read, revised, and approved the manuscript. All authors read and approved the final manuscript.
Funding
This study was supported by the National Natural Science Foundation of China (31672211) and the Fundamental Research Funds for the Central Universities (2662014BQ011).
Acknowledgments
We thank the National Natural Science Foundation for supporting this work.
Conflicts of Interest
The authors declare no conflict of interest.
Availability of data and materials: All data generated or analyzed during this study are included in this published article.
References
- Shahane, S.; Majumdar, R.; Mishra, U.; Patel, N. Shivam mode of action, properties, production, and application of laccase: A review. Recent Pat. Biotechnol. 2018, 13, 19–32. [Google Scholar]
- Zhang, Y.; Lv, Z.; Zhou, J.; Xin, F.; Ma, J.; Wu, H.; Fang, Y.; Jiang, M.; Dong, W. Application of eukaryotic and prokaryotic laccases in biosensor and biofuel cells: Recent advances and electrochemical aspects. Appl. Microbiol. Biotechnol. 2018, 102, 10409–10423. [Google Scholar] [CrossRef] [PubMed]
- Bilal, M.; Asgher, M.; Parra-Saldivar, R.; Hu, H.; Wang, W.; Zhang, X.; Iqbal, H.M.N. Immobilized ligninolytic enzymes: An innovative and environmental responsive technology to tackle dye-based industrial pollutants—A review. Sci. Total Environ. 2017, 576, 646–659. [Google Scholar] [CrossRef] [PubMed]
- Aranda, E.; de Eugenio, L.; Barriuso, J.; Mtibaà, R.; Martínez, M.J.; Mechichi, T.; Belbahri, L.; Nasri, M. Purification and characterization of a fungal laccase from the ascomycete Thielavia sp. and its role in the decolorization of a recalcitrant dye. Int. J. Biol. Macromol. 2018, 120, 1744–1751. [Google Scholar]
- Yoshida, H. LXIII.—Chemistry of lacquer (Urushi) Part I: Communication from the chemical society of Tokio. J. Chem. Soc. Trans. 1883, 43, 472–486. [Google Scholar] [CrossRef] [Green Version]
- Hakulinen, N.; Rouvinen, J. Three-dimensional structures of laccases. Cell. Mol. Life Sci. 2015, 72, 857–868. [Google Scholar] [CrossRef]
- Giardina, P.; Faraco, V.; Pezzella, C.; Piscitelli, A.; Vanhulle, S.; Sannia, G. Laccases: A never-ending story. Cell. Mol. Life Sci. 2010, 67, 369–385. [Google Scholar] [CrossRef]
- Madhavan, S.; Krause, K.; Jung, E.M.; Kothe, E. Differential regulation of multi-copper oxidases in Schizophyllum commune during sexual development. Mycol. Prog. 2014, 13, 1199–1206. [Google Scholar] [CrossRef]
- Saparrat, M.; Balatti, P.A.; Martínez, M.J.; Jurado, M. Differential regulation of laccase gene expression in Coriolopsis rigida LPSC No. 232. Fungal Biol. 2010, 114, 999–1006. [Google Scholar] [CrossRef]
- Li, X.Q.; Guo, B.L.; Cai, W.Y.; Zhang, J.M.; Huang, H.Q.; Zhan, P.; Xi, L.Y.; Vicente, V.A.; Stielow, B.; Sun, J.F.; et al. The role of melanin pathways in extremotolerance and virulence of Fonsecaea revealed by de novo assembly transcriptomics using illumina paired-end sequencing. Stud. Mycol. 2016, 83, 1–18. [Google Scholar] [CrossRef] [Green Version]
- Sakamoto, Y.; Nakade, K.; Yoshida, K.; Natsume, S.; Miyazaki, K.; Sato, S.; van Peer, A.F.; Konno, N. Grouping of multicopper oxidases in Lentinula edodes by sequence similarities and expression patterns. AMB Express 2015, 5, 63. [Google Scholar] [CrossRef] [PubMed] [Green Version]
- Hua, S.; Zhang, B.; Fu, Y.; Qi, B.; Li, Y.; Tian, F.; Li, Y. Enzymatic gene expression by Pleurotus tuoliensis (Bailinggu): Differential regulation under low temperature induction conditions. World J. Microbiol. Biotechnol. 2018, 34, 160. [Google Scholar] [CrossRef]
- Wong, K.S.; Cheung, M.K.; Au, C.H.; Kwan, H.S. A novel Lentinula edodes laccase and its comparative enzymology suggest guaiacol-based laccase engineering for bioremediation. PLoS ONE 2013, 8, e66426. [Google Scholar] [CrossRef] [PubMed] [Green Version]
- Berthet, S.; Demont-Caulet, N.; Pollet, B.; Bidzinski, P.; Cézard, L.; Le Bris, P.; Borrega, N.; Hervé, J.; Blondet, E.; Balzergue, S.; et al. Disruption of LACCASE4 and 17 results in tissue-specific alterations to lignification of Arabidopsis thaliana stems. Plant Cell 2011, 23, 1124–1137. [Google Scholar] [CrossRef] [PubMed] [Green Version]
- Hu, Q.; Min, L.; Yang, X.; Jin, S.; Zhang, L.; Li, Y.; Ma, Y.; Qi, X.; Li, D.; Liu, H.; et al. Laccase GhLac1 modulates broad-spectrum biotic stress tolerance via manipulating phenylpropanoid pathway and jasmonic acid synthesis. Plant Physiol. 2018, 176, 1808–1823. [Google Scholar] [CrossRef] [PubMed] [Green Version]
- An, H.; Wei, D.; Xiao, T. Transcriptional profiles of laccase genes in the brown rot fungus Postia placenta MAD-R-698. J. Microbiol. 2015, 53, 606–615. [Google Scholar] [CrossRef] [PubMed]
- Jiao, X.; Li, G.; Wang, Y.; Nie, F.; Cheng, X.; Abdullah, M.; Lin, Y.; Cai, Y. Systematic analysis of the pleurotus ostreatus laccase gene (PoLac) Family and functional characterization of PoLac2 involved in the degradation of cotton-straw lignin. Molecules 2018, 23, 880. [Google Scholar] [CrossRef] [Green Version]
- Zhang, J.; Chen, H.; Chen, M.; Ren, A.; Huang, J.; Wang, H.; Zhao, M.; Feng, Z. Cloning and functional analysis of a laccase gene during fruiting body formation in Hypsizygus marmoreus. Microbiol. Res. 2015, 179, 54–63. [Google Scholar] [CrossRef]
- Nakade, K.; Watanabe, H.; Sakamoto, Y.; Sato, T. Gene silencing of the Lentinula edodes lcc1 gene by expression of a homologous inverted repeat sequence. Microbiol. Res. 2011, 166, 484–493. [Google Scholar] [CrossRef]
- Sakamoto, Y.; Nakade, K.; Sato, S.; Yoshimi, A.; Sasaki, K.; Konno, N.; Abe, K. Cell wall structure of secreted laccase-silenced strain in Lentinula edodes. Fungal Biol. 2018, 122, 1192–1200. [Google Scholar] [CrossRef]
- Sakamoto, Y. Influences of environmental factors on fruiting body induction, development and maturation in mushroom-forming fungi. Fungal Biol. Rev. 2018, 32, 236–248. [Google Scholar] [CrossRef]
- Tang, L.H.; Tan, Q.; Bao, D.P.; Zhang, X.H.; Jian, H.H.; Li, Y.; Yang, R.H.; Wang, Y. Comparative proteomic analysis of light-induced mycelial brown film formation in Lentinula edodes. Biomed Res. Int. 2016, 2016, 5837293. [Google Scholar] [CrossRef] [PubMed] [Green Version]
- Ohga, S.; Royse, D.J. Transcriptional regulation of laccase and cellulase genes during growth and fruiting of Lentinula edodes on supplemented sawdust. FEMS Microbiol. Lett. 2001, 201, 111–115. [Google Scholar] [CrossRef] [PubMed] [Green Version]
- Zhang, Q. Study on the Change Regularity of Extracellular Enzyme Activity and Agronony Charaters of Lentinula edodes. Master’s Thesis, Henan Technology University, Henan, China, 2016. [Google Scholar]
- Chen, L.; Gong, Y.; Cai, Y.; Liu, W.; Zhou, Y.; Xiao, Y.; Xu, Z.; Liu, Y.; Lei, X.; Wang, G.; et al. Genome sequence of the edible cultivated mushroom Lentinula edodes (shiitake) reveals insights into lignocellulose degradation. PLoS ONE 2016, 11, e0160336. [Google Scholar] [CrossRef] [PubMed]
- Sano, H.; Kaneko, S.; Sakamoto, Y.; Sato, T.; Shishido, K. The basidiomycetous mushroom Lentinula edodes white collar-2 homolog PHRB, a partner of putative blue-light photoreceptor PHRA, binds to a specific site in the promoter region of the L. edodes tyrosinase gene. Fungal Genet. Biol. 2009, 46, 333–341. [Google Scholar] [CrossRef] [PubMed]
- Cai, Y.; Gong, Y.; Liu, W.; Hu, Y.; Chen, L.; Yan, L.; Zhou, Y.; Bian, Y. Comparative secretomic analysis of lignocellulose degradation by Lentinula edodes grown on microcrystalline cellulose, lignosulfonate and glucose. J. Proteom. 2017, 163, 92–101. [Google Scholar] [CrossRef]
- Wang, G.; Zhou, S.S.; Luo, Y.; Ma, C.; Gong, Y.; Zhou, Y.; Gao, S.; Huang, Z.; Yan, L.; Hu, Y.; et al. The heat shock protein 40 LeDnaJ regulates stress resistance and indole-3-acetic acid biosynthesis in Lentinula edodes. Fungal Genet. Biol. 2018, 118, 37–44. [Google Scholar] [CrossRef]
- Pfaffl, M.W. A new mathematical model for relative quantification.pdf. Nucleic Acids Res. 2001, 29, 5837293. [Google Scholar] [CrossRef]
- Chen, C.; Chen, H.; He, Y.; Xia, R. TBtools, a Toolkit for Biologists integrating various biological data handling tools with a user-friendly interface. BioRxiv 2018, 289660. [Google Scholar]
- Wang, W.; Wang, L.; Chen, B.; Mukhtar, I.; Xie, B.; Li, Z.; Meng, L. Characterization and expression pattern of homeobox transcription factors in fruiting body development of straw mushroom Volvariella volvacea. Fungal Biol. 2019, 123, 95–102. [Google Scholar] [CrossRef]
- Wang, W.; Liu, F.; Jiang, Y.; Wu, G.; Guo, L.; Chen, R.; Chen, B.; Lu, Y.; Dai, Y.; Xie, B. The multigene family of fungal laccases and their expression in the white rot basidiomycete Flammulina velutipes. Gene 2015, 563, 142–149. [Google Scholar] [CrossRef]
- Liu, N.; Cao, Z.; Cao, K.; Ma, S.; Gong, X. Identification of laccase-like multicopper oxidases from the pathogenic fungus Setosphaeria turcica and their expression pattern during growth and infection. 2019, 153, 1149–1163. Eur. J. Plant Pathol. 2019, 153, 1149–1163. [Google Scholar] [CrossRef]
- Xu, X.; Zhou, Y.; Wang, B.; Ding, L.; Wang, Y.; Luo, L.; Zhang, Y.; Kong, W. Genome-wide identification and characterization of laccase gene family in Citrus sinensis. Gene 2019, 689, 114–123. [Google Scholar] [CrossRef]
- Suresh Kumar, S.V.; Phale, P.S.; Durani, S.; Wangikar, P.P. Combined sequence and structure analysis of the fungal laccase family. Biotechnol. Bioeng. 2003, 83, 386–394. [Google Scholar] [CrossRef]
- Lu, Y.; Wu, G.; Lian, L.; Guo, L.; Wang, W.; Yang, Z.; Miao, J.; Chen, B.; Xie, B.; Lu, Y.; et al. Cloning and expression analysis of Vvlcc3, a novel and functional laccase gene possibly involved in stipe elongation. Int. J. Mol. Sci. 2015, 16, 28498–28509. [Google Scholar] [CrossRef] [Green Version]
- Kilaru, S.; Hoegger, P.J.; Kües, U. The laccase multi-gene family in Coprinopsis cinerea has seventeen different members that divide into two distinct subfamilies. Curr. Genet. 2006, 50, 45–60. [Google Scholar] [CrossRef]
- Feng, K.; Yu, J.; Cheng, Y.; Ruan, M.; Wang, R.; Ye, Q.; Zhou, G.; Li, Z.; Yao, Z.; Yang, Y.; et al. The SOD gene family in tomato: Identification, phylogenetic relationships, and expression patterns. Front. Plant Sci. 2016, 7, 1279. [Google Scholar] [CrossRef] [Green Version]
- Gehrmann, T.; Pelkmans, J.F.; Ohm, R.A.; Vos, A.M.; Sonnenberg, A.S.M.; Baars, J.J.P.; Wösten, H.A.B.; Reinders, M.J.T.; Abeel, T. Nucleus-specific expression in the multinuclear mushroom-forming fungus Agaricus bisporus reveals different nuclear regulatory programs. Proc. Natl. Acad. Sci. USA 2018, 115, 4429–4434. [Google Scholar] [CrossRef] [Green Version]
- Ha, B.; Lee, S.; Kim, S.; Kim, M.; Moon, Y.J.; Song, Y.; Ro, H.S. Nucleus-selective expression of laccase genes in the dikaryotic strain of Lentinula edodes. Mycobiology 2017, 45, 379–384. [Google Scholar] [CrossRef] [Green Version]
- Levasseur, A.; Drula, E.; Lombard, V.; Coutinho, P.M.; Henrissat, B. Expansion of the enzymatic repertoire of the CAZy database to integrate auxiliary redox enzymes. Biotechnol. Biofuels 2013, 6, 41. [Google Scholar] [CrossRef] [Green Version]
- Jaszek, M.; Grzywnowicz, K.; Malarczyk, E.; Leonowicz, A. Enhanced extracellular laccase activity as a part of the response system of white rot fungi: Trametes versicolor and Abortiporus biennis to paraquat-caused oxidative stress conditions. Pestic. Biochem. Physiol. 2006, 85, 147–154. [Google Scholar] [CrossRef]
- Jaszek, M.; Zuchowski, J.; Dajczak, E.; Cimek, K.; Graz, M.; Grzywnowicz, K. Ligninolytic enzymes can participate in a multiple response system to oxidative stress in white-rot basidiomycetes: Fomes fomentarius and Tyromyces pubescens. Int. Biodeterior. Biodegrad. 2006, 85, 147–154. [Google Scholar] [CrossRef]
- Rytioja, J.; Hildén, K.; Di Falco, M.; Zhou, M.; Aguilar-Pontes, M.V.; Sietiö, O.M.; Tsang, A.; de Vries, R.P.; Mäkelä, M.R. The molecular response of the white-rot fungus Dichomitus squalens to wood and non-woody biomass as examined by transcriptome and exoproteome analyses. Environ. Microbiol. 2017, 19, 1237–1250. [Google Scholar] [CrossRef] [Green Version]
- Couturier, M.; Navarro, D.; Chevret, D.; Henrissat, B.; Piumi, F.; Ruiz-Dueñas, F.J.; Martinez, A.T.; Grigoriev, I.V.; Riley, R.; Lipzen, A.; et al. Enhanced degradation of softwood versus hardwood by the white-rot fungus Pycnoporus coccineus. Biotechnol. Biofuels 2015, 8, 216. [Google Scholar] [CrossRef]
- Hori, C.; Ishida, T.; Igarashi, K.; Samejima, M.; Suzuki, H.; Master, E.; Ferreira, P.; Ruiz-Dueñas, F.J.; Held, B.; Canessa, P.; et al. Analysis of the Phlebiopsis gigantea genome, transcriptome and secretome provides insight into its pioneer colonization strategies of wood. PLoS Genet. 2014, 10, e1004759. [Google Scholar] [CrossRef] [Green Version]
- Miles, P.G.; Chang, S.T. Mushrooms: Cultivation, nutritional value, medicinal effect, and environmental impact. In Chapter 1 Overview I Introduction; CRC Press: Boca Raton, FL, USA, 2004; pp. 1–25. [Google Scholar]
- Cao, X.T.; Bian, Y.B.; Xu, Z.Y. First report of trichoderma oblongisporum causing green mold disease on Lentinula edodes (shiitake) in China. Plant Dis. 2014, 98, 1440. [Google Scholar] [CrossRef]
- Wang, G.; Cao, X.; Ma, X.; Guo, M.; Liu, C.; Yan, L.; Bian, Y. Diversity and effect of Trichoderma spp. associated with green mold disease on Lentinula edodes in China. Microbiologyopen 2016, 5, 709–718. [Google Scholar] [CrossRef] [Green Version]
- Xu, C.; Shen, Y.; He, F.; Fu, X.; Yu, H.; Lu, W.; Li, Y.; Li, C.; Fan, D.; Wang, H.C.; et al. Auxin-mediated Aux/IAA-ARF-HB signaling cascade regulates secondary xylem development in Populus. New Phytol. 2019, 222, 752–767. [Google Scholar] [CrossRef]
- Yoo, S.; Lee, H.-Y.; Markkandan, K.; Moon, S.; Ahn, Y.J.; Ji, S.; Ko, J.; Kim, S.-J.; Ryu, H.; Hong, C.P. Comparative transcriptome analysis identified candidate genes involved in mycelium browning in Lentinula edodes. BMC Genom. 2019, 20, 121. [Google Scholar] [CrossRef] [Green Version]
- Singh, S.; Malhotra, A.G.; Pandey, A.; Pandey, K.M. Computational model for pathway reconstruction to unravel the evolutionary significance of melanin synthesis. Bioinformation 2013, 9, 94. [Google Scholar] [CrossRef]
- Sakamoto, Y.; Nakade, K.; Sato, S.; Yoshida, K.; Miyazaki, K.; Natsume, S.; Konno, N. Lentinula edodes genome survey and postharvest transcriptome analysis. Appl. Environ. Microbiol. 2017, 83, e02990-16. [Google Scholar] [CrossRef] [Green Version]
Figure 1.
Different induction conditions for mycelia of W1 (ACCC50926).

Figure 2.
Laccase signature sequences L1–L4 and putative substrate binding loops 1–4 of laccases from Lentinula edodes. The histidine and cysteine residues for copper binding are indicated with T1, T2, and T3 above the residues representing type 1, type 2, and type 3 coppers, respectively.
Figure 2.
Laccase signature sequences L1–L4 and putative substrate binding loops 1–4 of laccases from Lentinula edodes. The histidine and cysteine residues for copper binding are indicated with T1, T2, and T3 above the residues representing type 1, type 2, and type 3 coppers, respectively.

Figure 3.
Predicted Cis-elements in the promoter regions of laccase genes from L. edodes (Lelcc). Promoter sequences (−1500 bp) of 14 Lelcc genes were analyzed, with their names shown on the bottom of the figure. Cis-elements with common functions are marked with the same color.
Figure 3.
Predicted Cis-elements in the promoter regions of laccase genes from L. edodes (Lelcc). Promoter sequences (−1500 bp) of 14 Lelcc genes were analyzed, with their names shown on the bottom of the figure. Cis-elements with common functions are marked with the same color.

Figure 4.
Heatmap of the expression profiles of laccase genes from L. edodes (Lelcc) in various carbon sources. The heatmaps with hierarchical clustering were visualized using the software TBtools 0.665 and the values were log2-transformed with normalization [30]. The blue and red elements indicate low and high relative expression levels, respectively.

Figure 5.
Heatmap of the expression profiles of laccase genes from L. edodes (Lelcc) under high-temperature stimulation. The heatmaps with hierarchical clustering were visualized using the software TBtools 0.665 and the values were log2-transformed with normalization. The blue and red elements indicate low and high relative expression levels, respectively.

Figure 6.
Heatmap of the expression profiles of laccase genes from L. edodes (Lelcc) under low-temperature stimulation. The heatmaps with hierarchical clustering were visualized using the software TBtools 0.665 and the values were log2-transformed with normalization. The blue and red elements indicate low and high relative expression levels, respectively.

Figure 7.
Heatmap of the expression profiles of laccase genes from L. edodes (Lelcc) in the photoperiod (12 h light/12 h dark). The heatmaps with hierarchical clustering were visualized using the software TBtools 0.665 and the values were log2-transformed with normalization. The blue and red elements indicate low and high relative expression levels, respectively.

Figure 8.
Heatmap of the expression profiles of laccase genes from L. edodes (Lelcc) in the photoperiod (24 h light/0 h dark). The heat maps with hierarchical clustering were visualized using the software TBtools 0.665 and the values were log2-transformed with normalization. The blue and red elements indicate low and high relative expression levels, respectively.

Figure 9.
Heatmap of the expression profiles of laccase genes from L. edodes (Lelcc) in the photoperiod (0 h light/24 h dark). The heatmaps with hierarchical clustering were visualized using the software TBtools 0.665 and the values were log2-transformed with normalization. The blue and red elements indicate low and high relative expression levels, respectively.

© 2019 by the authors. Licensee MDPI, Basel, Switzerland. This article is an open access article distributed under the terms and conditions of the Creative Commons Attribution (CC BY) license (http://creativecommons.org/licenses/by/4.0/).
Share and Cite
MDPI and ACS Style
Yan, L.; Xu, R.; Bian, Y.; Li, H.; Zhou, Y. Expression Profile of Laccase Gene Family in White-Rot Basidiomycete Lentinula edodes under Different Environmental Stresses. Genes 2019, 10, 1045. https://doi.org/10.3390/genes10121045
AMA Style
Yan L, Xu R, Bian Y, Li H, Zhou Y. Expression Profile of Laccase Gene Family in White-Rot Basidiomycete Lentinula edodes under Different Environmental Stresses. Genes. 2019; 10(12):1045. https://doi.org/10.3390/genes10121045
Chicago/Turabian StyleYan, Lianlian, Ruiping Xu, Yinbing Bian, Hongxian Li, and Yan Zhou. 2019. "Expression Profile of Laccase Gene Family in White-Rot Basidiomycete Lentinula edodes under Different Environmental Stresses" Genes 10, no. 12: 1045. https://doi.org/10.3390/genes10121045
Note that from the first issue of 2016, this journal uses article numbers instead of page numbers. See further details here.