Article

An SNP-Based Genetic Map and QTL Mapping for Growth Traits in the Red-Spotted Grouper (Epinephelus akaara)

1
South China Sea Marine Survey and Technology Center, SOA, Guangzhou 510275, China
2
Laboratory for Marine Fisheries Science and Food Production Processes, Qingdao National Laboratory for Marine Science and Technology, Qingdao 266373, China
3
Shenzhen Key Lab of Marine Genomics, Guangdong Provincial Key Lab of Molecular Breeding in Marine Economic Animals, BGI Academy of Marine Sciences, BGI Marine, BGI, Shenzhen 518083, China
4
Fisheries Research Institute of Fujian, Xiamen 361012, China
5
State Key Laboratory of Biocontrol, Guangdong Provincial Key Laboratory for Aquatic Economic Animals and Guangdong Provincial Engineering Technology Research Center for Healthy Breeding of Important Economic Fish, School of Life Sciences, Sun Yat-Sen University, Guangzhou 510275, China
6
Southern Marine Science and Engineering Guangdong Laboratory (ZhanJiang), Fisheries College, Guangdong Ocean University, Zhanjiang 524088, China
*
Authors to whom correspondence should be addressed.
These authors contributed equally to this work.
Genes 2019, 10(10), 793; https://doi.org/10.3390/genes10100793
Submission received: 6 August 2019 / Revised: 4 October 2019 / Accepted: 4 October 2019 / Published: 12 October 2019
(This article belongs to the Section Animal Genetics and Genomics)

Abstract

:
The red-spotted grouper (Epinephelus akaara) is one of the most commercially important aquatic species in China. However, its seedstock has low larval survival rates, and its stability is confronted with the danger of overexploitation. In this study, a high-density genetic map was constructed using 3435 single nucleotide polymorphisms (SNPs) from 142 first generation (F1) full-sib offspring and two parents of a red-spotted grouper population. The total genetic length of the map was 2300.12 cM with an average intermarker distance of 0.67 cM. Seventeen genome-wide significant quantitative trait loci (QTLs) for growth-related traits were detected on 24 linkage groups, including 5 QTLs for full length, 7 QTLs for body length, and 5 QTLs for body weight. The contribution values of explained phenotypic variance ranged from 10.7% to 12.9%. Moreover, 13 potential candidate genes for growth-related traits were identified. Collectively, these findings will be useful for conducting marker-assisted selection of the red-spotted grouper in future studies.

1. Introduction

The red-spotted grouper (Epinephelus akaara) is a popular, edible aquatic species in many Asian countries [1]. Like other grouper species, the red-spotted grouper is a protogynous hermaphrodite that is first differentiated as female and later changes to male at six years of age. Therefore, male red-spotted groupers are the limiting factor in the mass production of fingerlings and large-scale aquaculture of this commercial fish [2]. In order to avoid decreasing seedstock sources of the red-spotted grouper, many countries have strengthened the protection and management of this wild species’ resources. The development of DNA markers and new genetic methods may contribute to the construction of a high-density genetic map and the identification of quantitative trait loci (QTLs), and have contributed to the conservation of this species. Moreover, single nucleotide polymorphism (SNP) markers are commonly used to evaluate the genetic population structure due to their high polymorphism and codominant inheritance [3].
With the development of next-generation sequencing (NGS) technology, the construction of high-quality linkage maps for various economically important fish species has been facilitated. Several methods have been simultaneously developed for high-throughput marker discovery and genotyping using restriction enzymes, including restriction site-associated DNA sequencing (RAD-Seq) [4]. Thus, developing a high-quality genetic linkage map is a vital prerequisite for QTL mapping and increasing the efficiency of marker-assisted selection (MAS), thereby enhancing genetic progress. Such maps influence the relative positioning of diverse marker loci and help identify QTLs related to many traits. To date, researchers have constructed many linkage maps and developed QTLs of fish species including Atlantic salmon (Salmo salar) [5], Japanese flounder (Paralichthys olivaceus) [6], rainbow trout (Oncorhynchus mykiss) [7,8], Chinese mitten crab (Eriocheir sinensis) [9], southern catfish (Silurus meridionalis) [10], Pacific oyster (Crassostrea gigas) [11], snapper (Chrysophrys auratus) [12], and northern snakehead (Channa argus) [13]. The first high-density genetic linkage map for groupers (orange-spotted grouper, Epinephelus coioides) was constructed previously [14], which revealed that 27 significant QTLs and 17 genes were associated with growth-related traits [15]. Additionally, microsatellite-based linkage maps for the red-spotted grouper [16], white grouper (Epinephelus aeneus) [17], and kelp grouper (Epinephelus bruneus) have been published [18]. Recently, the genome assembly of red-spotted grouper was also reported [19]. However, an SNP-based genetic map and QTL mapping of the red-spotted grouper have not yet been reported.
Computational tools provide a promising alternative for helping identify biologically significant QTLs and SNPs. In this study, two open software packages were used to study the red-spotted grouper in RAD analysis data. STRING (a database of known and predicted protein-protein interactions) collects and integrates this information by consolidating known and predicted protein–protein association data for a large number of organisms [20]. Cytoscape software visualizes interaction networks and pathways [21]. These open-source software packages have also been used to study high-throughput expression data for other fish, including zebrafish (Danio rerio) [22], orange-spotted grouper [23], and rainbow trout [24].
In this study, we constructed a high-quality genetic linkage map and developed QTLs for growth-related traits in the red-spotted grouper. In total, 17 growth-related QTLs were identified, and 13 related genes were discovered. These findings will be beneficial for MAS with regard to growth traits in the red-spotted grouper.

2. Materials and Methods

2.1. Mapping Family and DNA Isolation

The red-spotted grouper first generation (F1) full-sib family was collected from a large seawater farm in Xiaodeng Island, Fujian Province, China, during July 2016. The fish were acclimatized for one month under controlled conditions. Approximately 15,000 progenies were stocked into a 600-m2 (30 m × 20 m × 1.5 m) pond at an initial density of 17 fish per m3. All fish were fed at 08:00 h and 16:00 h every day. During this period, the water quality parameters were monitored as follows: water temperature 27.5 ± 1.5 °C, salinity 29 ± 1‰, dissolved oxygen 10 ± 0.5 mg/L, pH 8.0 ± 0.2, and un-ionized ammonia 0.02 ± 0.1 mg/L. After 50 days of culturing, 144 individuals were randomly selected for phenotypic measurements, and the average weight of the fish was 4.2 g. Three growth-related traits, body weight (BW), full length (FL), and body length (BL), were recorded as phenotypic data (Table S1).
Genomic DNA was extracted from the fresh muscle tissues of 144 individuals (142 offspring, two parents) following the phenol-chloroform protocol [6]. DNA quality was evaluated using a Qubit Fluorometer (Invitrogen, MA, USA) and electrophoresis on 0.6% agarose gel. All experiments were conducted following the regulations of the Animal Ethics Committee and were approved by the Institutional Review Board on Bioethics and Biosafety of BGI (No. FT14015).

2.2. Restriction Site-Associated DNA Sequencing

Ten RAD-Seq libraries were prepared for the 142 offspring and two parents following standard protocol [25]. Briefly, 1 µg of genomic DNA from each sample was digested with PstI restriction enzyme (Thermo Scientific, MA, USA) and incubated for 10 min in FastDigest buffer (total volume: 30 µL) at 65 °C. Barcode adapters (F: AAGTCGGAGGCCAAGCGGTCTTAGGAAGACAA, R: AAGTCGGATCGTAGCCATGTCGTT CTGTGAGCCAAGGAGTTG) containing a sample-specific nucleotide code were designed following the standard Illumina adapters design protocol. A total of 10 µmol of unique barcode adapters from each DNA sample was added to the reaction system. Sixteen samples were pooled within each tube. Nine pools were collected, and fragments between 300 and 500 bp were selected. Finally, sequencing was conducted using the Illumina Hiseq 4000 platform (Illumina, CA, USA) with 150-bp paired-end strategy.

2.3. Sequence Data Analysis and Genotyping

All RAD sequence analyses and genotyping were conducted using the non-reference genomes software program Stacks v2.4 [26]. First, the data reads without a barcode or expected restriction enzyme motif were filtered; the filtering principles included (1) base quality ≥25; (2) depth between 5 and 300; and (3) at least one heterozygote from the parents. Second, the Stacks pipeline was used to build loci from short-read sequences using the following process: (1) RAD tags were clustered until exact matching by ustacks (-m 2 -M 2 -p 15); (2) cstacks (-b 1 -n 3 -p 15) was set to collect variations; and (3) retained reads were sorted into loci by sstacks (-p 15 -b 1). Lastly, clean tag reads of offspring were aligned to the parents’ SNP regions, where the genotypes of individuals were determined by the reference sample genotype.

2.4. Genetic Map Construction

JoinMap v4.1 software was used to assign linkage groups (LGs) based on the cross population (CP) algorithm [27]. The genetic map was constructed using Lep-Map software [28]. All markers were filtered manually to remove obvious Mendelian errors from the offspring genotype data. The filtered SNPs could be used for further genetic map construction. First, the LG assignment was obtained using the JoinMap v4.1 software. Then, Lep-MAP was used to construct the genetic map using genotype data from the F1 red-spotted grouper population using the following process: (1) linkage analysis was performed for at least 80% of the markers; (2) the default value of data tolerance (p-value = 0.01) was used to filter out highly segregated markers (χ2 test, p < 0.01); (3) markers were assigned to LGs and executed with a logarithm of odds (LOD) score ranging from 2 to 10; and (4) markers within each LG were ordered. The error parameters were also calculated.

2.5. QTL Mapping Analysis and Gene Annotation

The MapQTL v6 software was used to perform the QTL analyses [29]. Composite interval mapping (CIM) was adopted with a walking speed of 1 cM [30]. The significance of each QTL interval was tested by a likelihood-ratio statistic. The LOD-supported intervals were constructed as 95% confidence intervals [31]. One thousand permutations were used, and the significance (p < 0.05) of the whole genome was determined based on the threshold level of LOD. The genes located in the QTL regions were supposedly growth-related genes, which were identified by QTL mapping. First, markers in the red-spotted grouper QTL regions were identified, and the corresponding marker sequences were selected from the reference parents based on their SNP ID. Second, sequences were mapped based on the position of the orange-spotted grouper genome scaffolds. Lastly, upstream and downstream coding gene functions were identified by a BLASTX (Basic Local Alignment Search Tool) search in the National Biotechnology Information Center. The sequencing reads of the orange-spotted grouper genome were deposited in the ENA Public Database (accession numbers: ERS2656083, SAMEA4836214; ERS2656082, SAMEA4836213).

2.6. Network Analysis Between the Candidate Genes

Genes in the connection groups were determined using the STRING online software by inputting SNP ID sequences [20]; the organism (Danio rerio) can be selected by clicking on the arrow or directly typing the name into the related input field. Two criteria were applied for detecting important nodes: high confidence with score = 0.15 and no more than 10 interactors. Then the network images were generated; clicking on a node provides details about the protein. Lastly, Cytoscape v3.7.1 software was used to visualize and analyze the molecular and interaction networks [21].

3. Results

3.1. Genotyping by Sequencing

In total, 114 Gb of raw data were generated from 10 RAD libraries, and 98 Gb of clean data were retained after data trimming by removing low-quality raw reads. Clean reads of separated individuals were stored in the CNSA (CNGB Nucleotide Sequence Archive) public database (CNP0000564). Then, loci in a set of individuals were identified, and the genotype of each locus was determined. Collectively, 20,798 SNPs were obtained, including four segregation types: <ef × eg> (n = 740), <hk × hk> (n = 2373), <lm × ll> (n = 7430), and <nn × np> (n = 10,255).

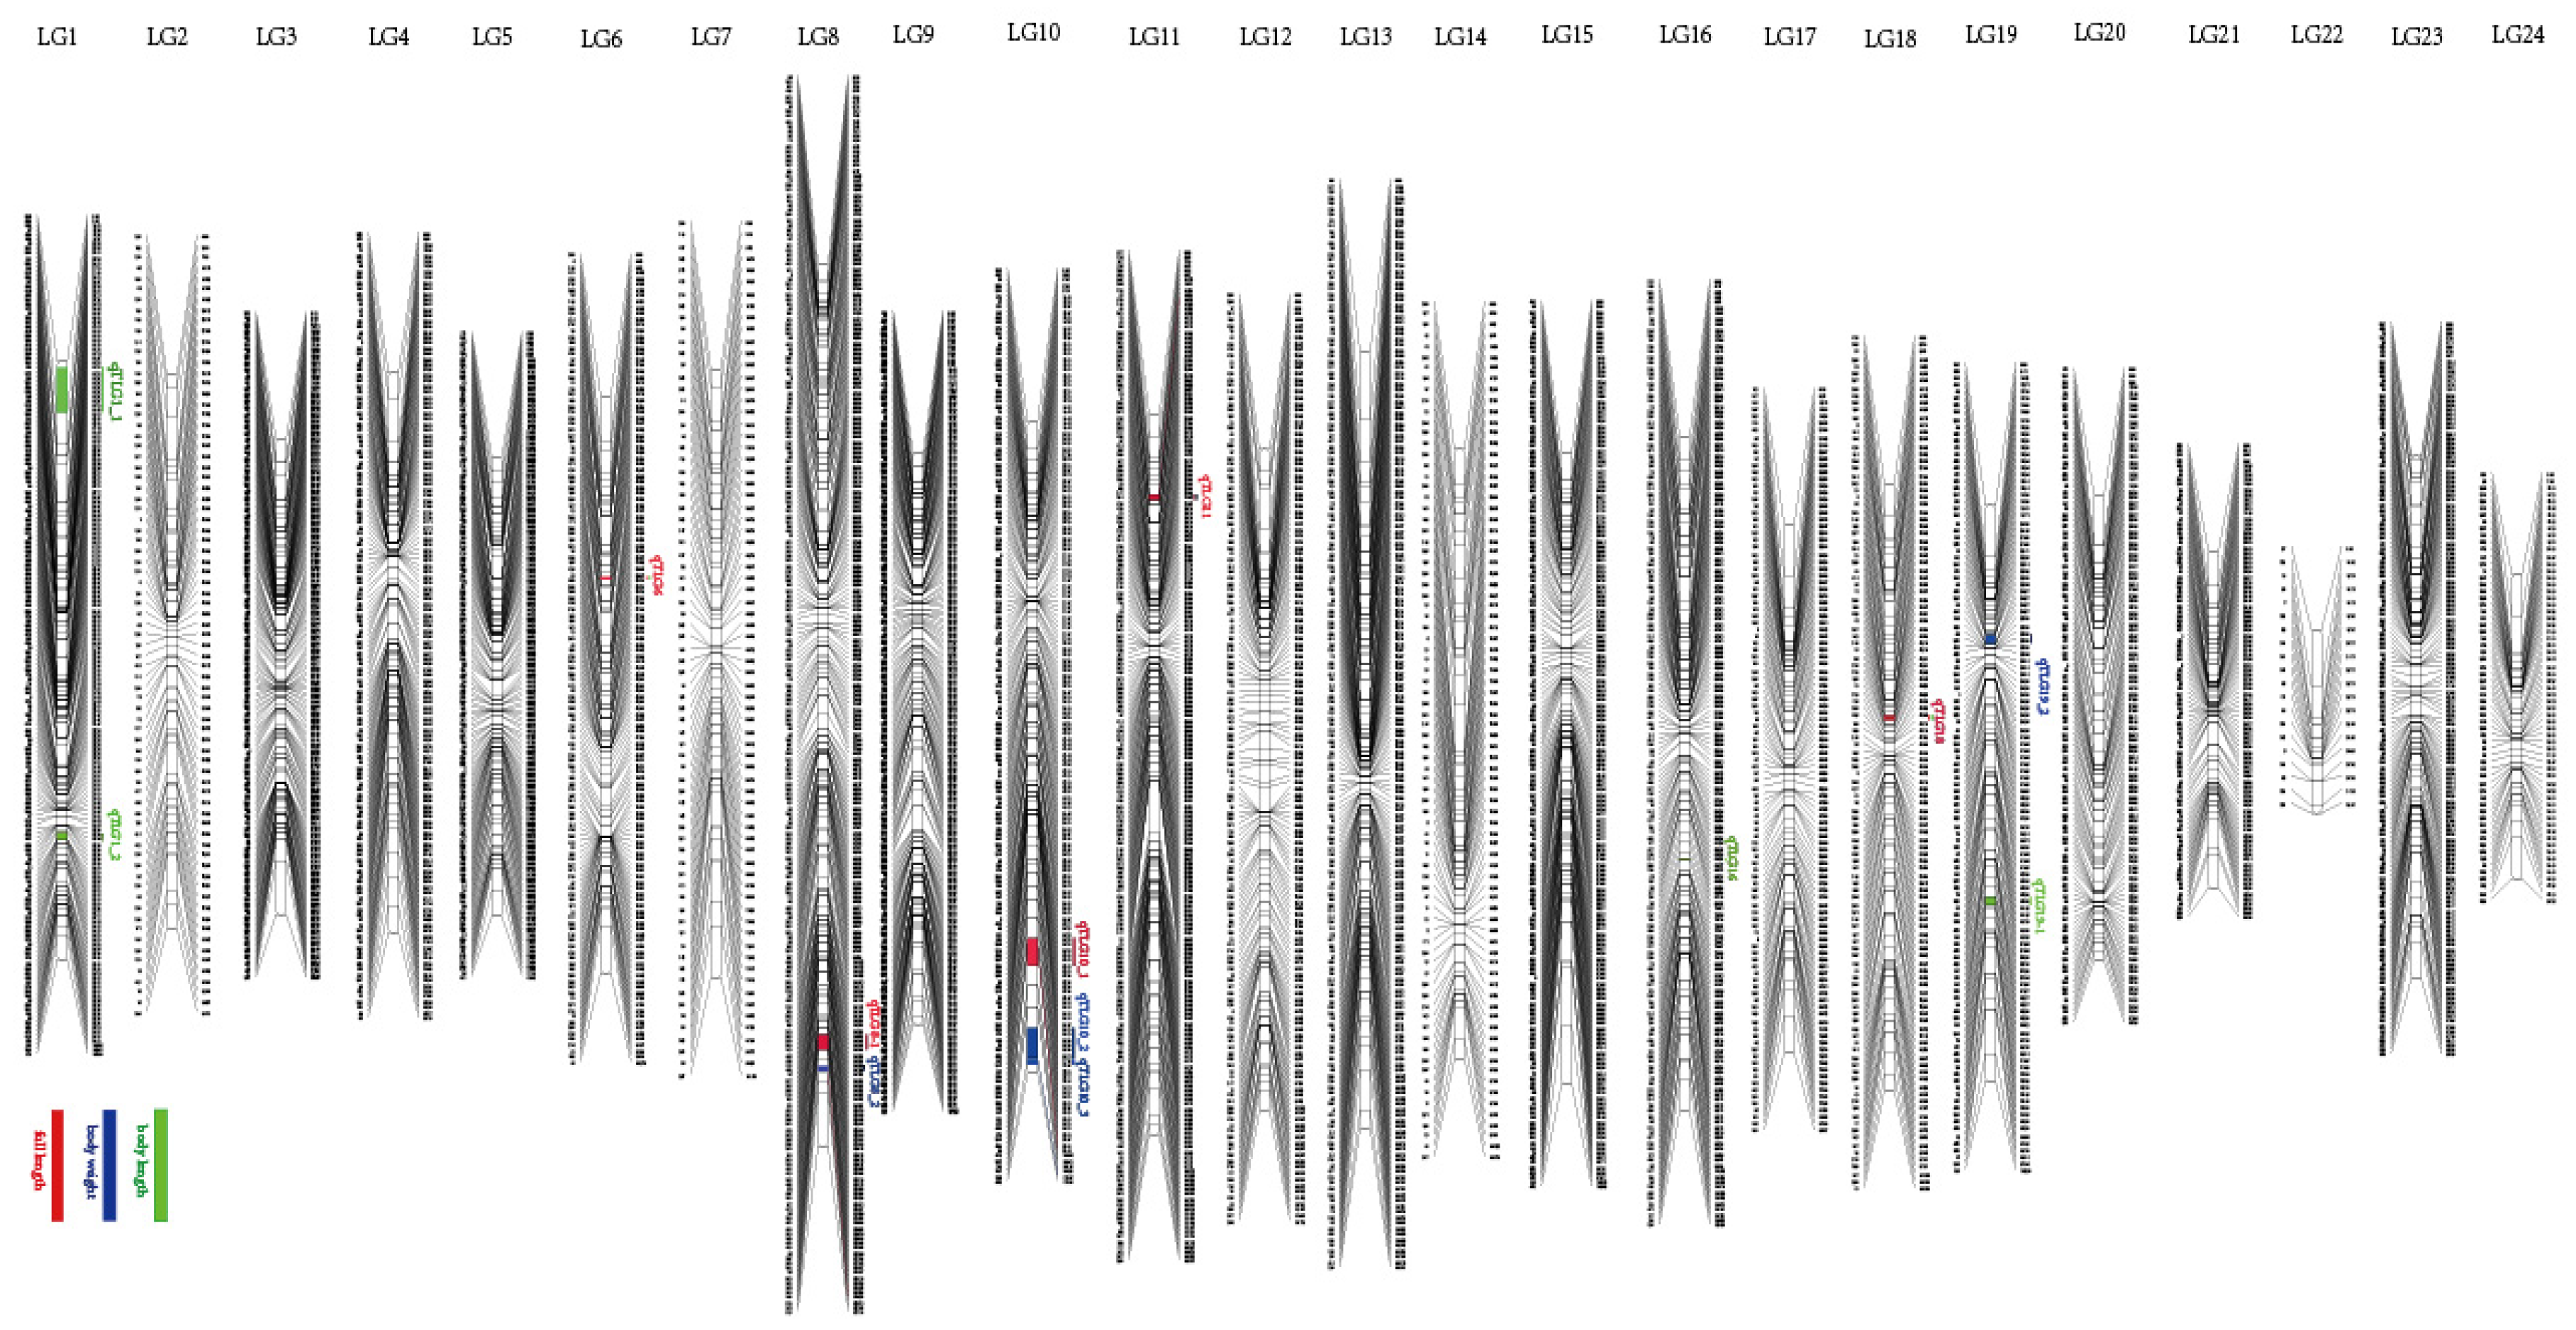
3.2. Construction of the Genetic Map

A high-resolution genetic map of the red-spotted grouper was constructed using JoinMap and Lep-MAP for the first time. The successful mapping of 3435 SNPs in 24 LGs was consistent with the haploid chromosome number of the red-spotted grouper (2n = 48) [32]. The total genetic distance of the linkage map was 2300.12 cM with an average intermarker distance of 0.67 cM. The SNP number of each LG ranged from 20 to 251 (LG22 and LG8). Additionally, the female map contained 3151 SNPs, and the male map contained 1220 SNPs. The lengths of the female and male maps were 2464.56 cM and 1671.97 cM, respectively. The average LG lengths of the female and male maps were 102.69 cM and 69.67 cM, respectively (Figure 1; Table 1).

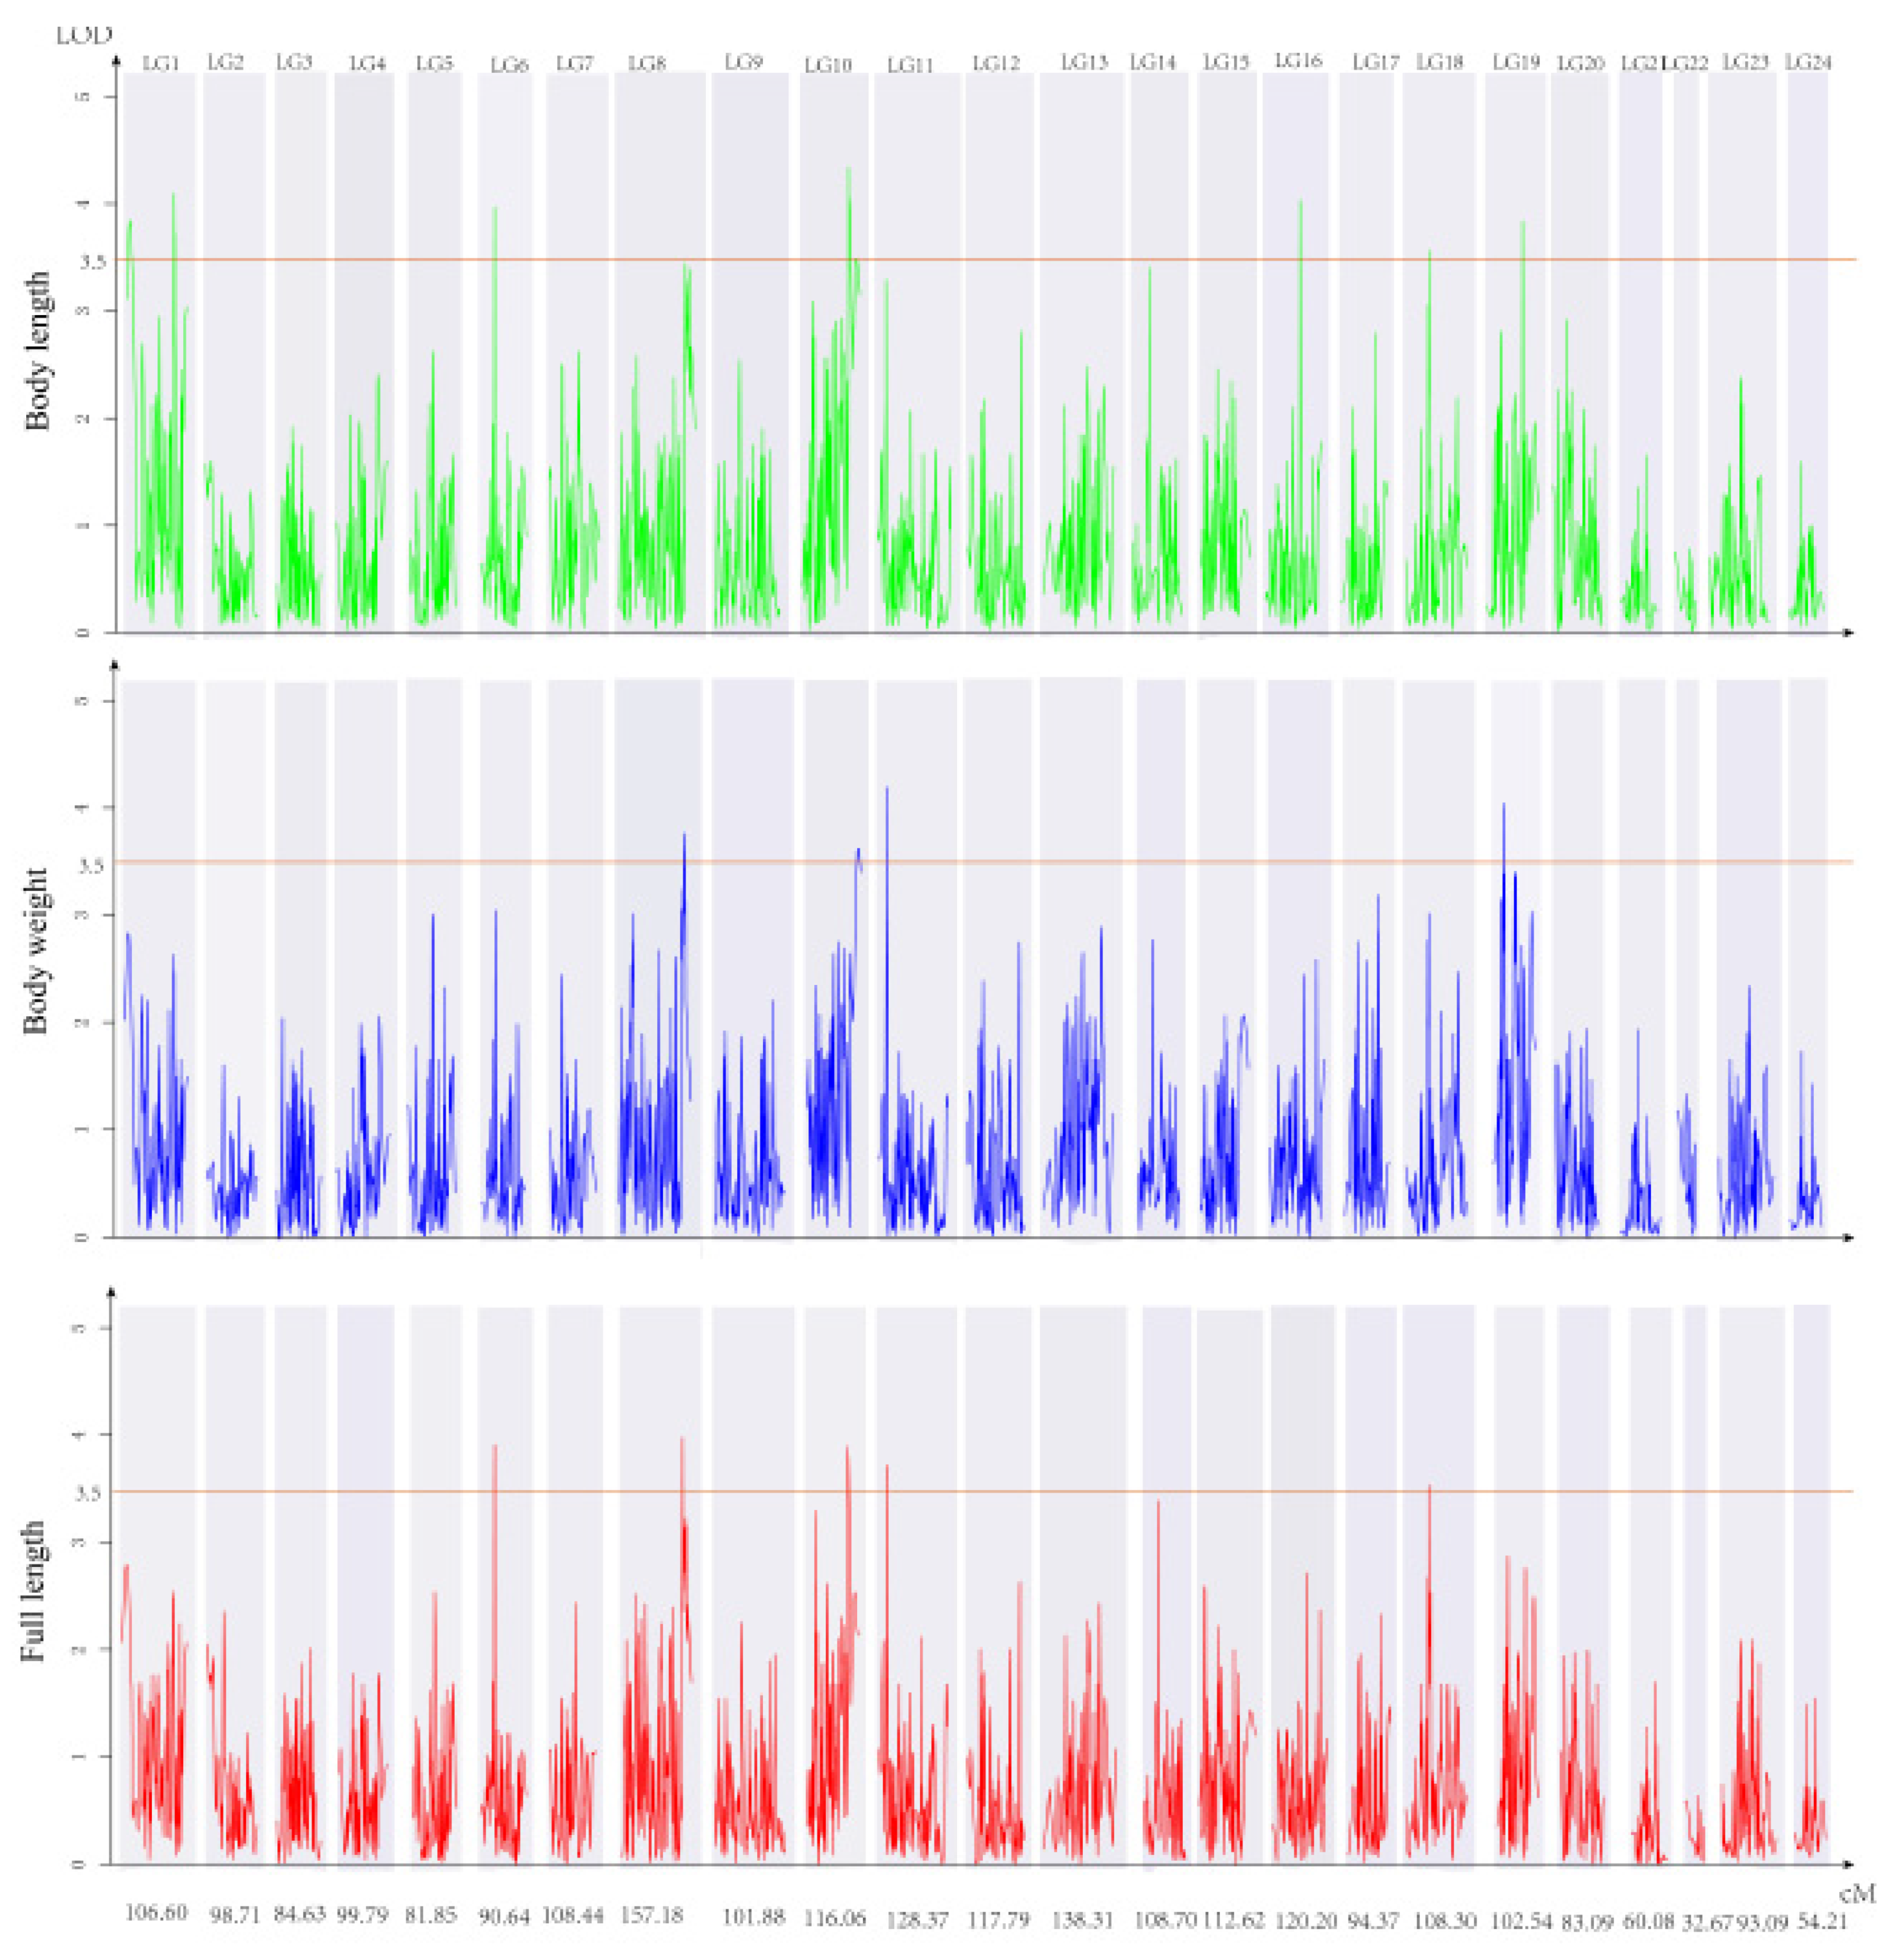
3.3. QTL Identification and Related Genes

In total, 17 QTLs for growth-related traits were distributed on LG1, LG6, LG8, LG10, LG11, LG16, LG18, and LG19, including 5 QTLs for BW, 5 QTLs for FL, and 7 QTLs for BL. There were 9 SNPs located on FL-related QTLs with LOD values ranging from 3.52 to 3.98, accounting for 10.7–11.9% of the phenotypic variation. Twelve SNPs were located on BL-related QTLs with LOD values ranging from 3.54 to 4.32, accounting for 10.7–12.9% of the phenotypic variation. Nine SNPs were located on BW-related QTLs with LOD values ranging from 3.55 to 4.21, accounting for 10.7–12.2% of the phenotypic variation. The LOD value of qTLG10_BL for BL was the highest value (4.32) recorded, and accounted for 12.9% of the phenotypic variation. Interestingly, markers 21190 (LG6), 449098 (LG6), 858434 (LG10), 17495 (LG10), and 343730 (qTLG18) all appeared for the BL and FL traits (Figure 2; Table 2).
Additionally, 13 potential candidate genes were identified by the BLAST search of the orange-spotted grouper genomic region (Table 3). Among them, somatostatin (sst) was confirmed to be associated with suppressing growth hormone (GH) gene expression in the orange-spotted grouper [33], European eel (Anguilla anguilla) [34], goldfish (Carassius auratus) [35], rainbow trout [36], and grass carp (Ctenopharyngodon idella) [37]. The sst3 receptors on neuronal cilia suggest that they act as chemical sensors in the direct growth environment [38]. In bighead catfish (Clarias macrocephalus), the transcriptome data indicated that spermidine synthase (srm) was related to growth. It was demonstrated that cytochrome c (cyc1), NADH-ubiquinone oxidoreductase, and ubiquinol-cytochrome c reductase complex subunits were associated with the coordinated expression of related functional genes during muscle recovery and growth [39]. In a previous study, low-density lipoprotein receptor-related protein 1 (lrp1) affected liver lipid deposition in large yellow croaker (Larimichthys crocea) by influencing dietary lipid levels. Sialidase-4 (neu4) is an enzyme encoded by the neu4 gene and was found to regulate mammal neuronal functions by degrading polySia, thereby affecting neurological function including synaptic plasticity, neurite growth, and cell migration [40]. Other genes were also found to be associated with growth-related QTLs, but their exact roles in fish have not been reported (Table 3).

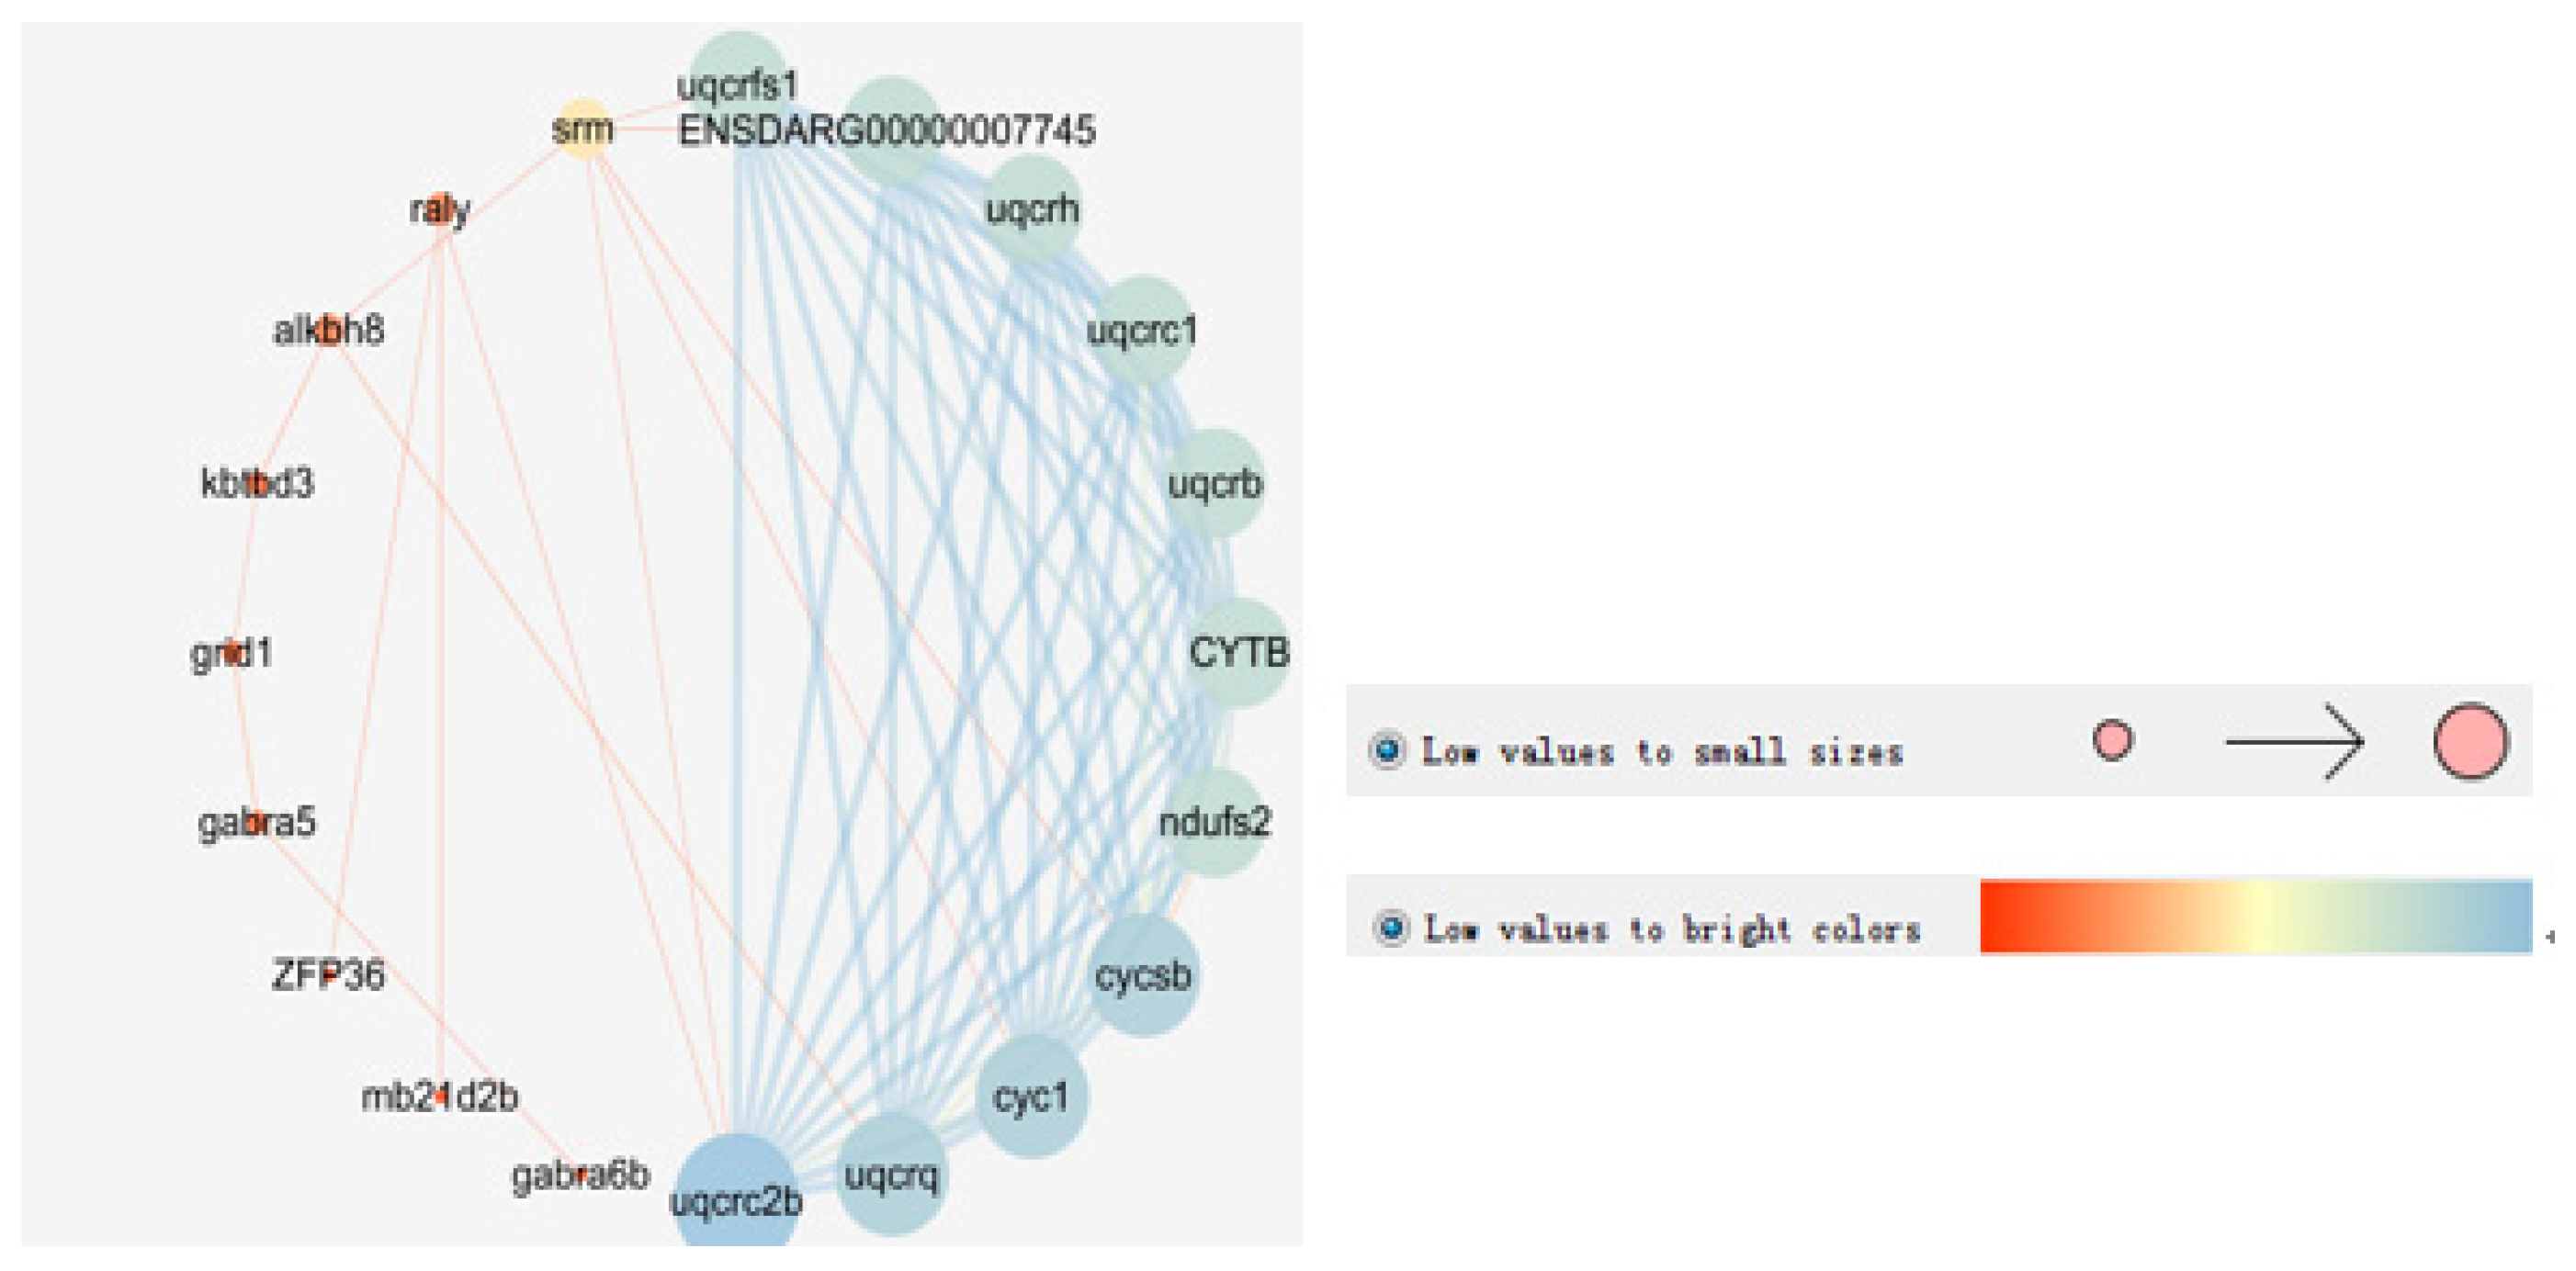
3.4. Network Analysis Between the Candidate Genes

In this study, 52 interacting proteins were added to provide a more comprehensive view of their interactions (Figure S1; Table S2). Fifteen proteins were found to be either directly or indirectly linked through one or more interacting proteins, suggesting that functional linkages may exist. Three biological processes were determined to be significantly involved (p < 0.05) based on the false discovery rate correction in this network, including mitochondrial electron transport, the ATP metabolic process, and the purine ribonucleoside monophosphate metabolic process (Table 4). One molecular function and one cellular component Gene Ontology (GO) term were enriched. Cytoscape v3.7.1 was subsequently used to visualize the STRING data (Figure 3).

4. Discussion

4.1. Molecular Marker Development and Utilization of the Genetic Map and QTL Analysis

Molecular marker technology has revolutionized research on aquaculture genetic studies. In the past, many molecular markers were used to study the genetic diversity of different aquatic organisms, including allozymes, mitochondrial DNA, restriction fragment length polymorphisms (RFLPs), random amplified polymorphic DNA (RAPD), amplified fragment length polymorphisms (AFLPs), simple sequence repeats (SSRs), microsatellite DNA, and SNP markers [53]. To date, numerous linkage maps in over 30 fish species have been constructed in aquaculture research. Meanwhile, several QTLs for essential traits were identified in more than 20 fish species between 2015 and 2019 (Table S3). Most of the published linkage maps for fish were based on SSR and SNP markers. Among them, 4 genetic maps were constructed using SSR markers, 4 were constructed through the combination of SSR and SNP markers, and 23 were developed using SNP markers. Moreover, the Nile tilapia’s linkage map contains the maximum sample capacity (689) [54]. The Atlantic salmon’s linkage map contained the largest number of markers (96,396 SNPs) in these maps [55], and the total length of the southern catfish’s map was the longest (5918.31 cM) [10]. The average locus interval between the snapper’s map was the lowest (0.129 cM) [12]. Growth traits and disease resistance are essential economic properties of fish affecting its production. Thus, QTLs related to growth and disease resistance traits have been well-studied. Although most aquatic animals exhibit high polymorphism, the linkage map generated using F1 (first generation) populations could meet the needs of most aquatic animals, according to previous studies [56]. Clearly, molecular markers are important tools for identifying and characterizing diverse genotypes. Additionally, genome-wide SNP discovery and linkage map analyses can lead to the discovery of thousands of markers in models or other organisms regardless of genome size or reference genome.

4.2. High-Density SNP Genetic Map Construction in the Red-Spotted Grouper Based on RAD-Seq

In groupers, eight genetic maps have been published previously: 5 maps were constructed using SSR markers and 3 were developed using SNP markers (Table S3). Dor et al. (2014) published a linkage map consisting of 48 white grouper individuals based on 222 microsatellite markers. The female and male maps comprised 24 LGs with 203 and 202 markers spanning 1053 and 886 cM with an average marker interval of 5.8 and 5.0 cM, respectively [17]. Liu et al. (2013) constructed linkage maps of kelp grouper using 222 SSR markers. The male map consisted of 23 LGs with 161 markers, and the female map consisted of 25 LGs with 173 markers. The total lengths of the male and female maps were 650.5 and 944.4 cM with an average marker interval of 5.0 and 6.7 cM, respectively [18]. An SSR-based map of the red-spotted grouper was previously completed by Watanabe et al. (2011) [16]. However, it is costly and time-consuming to identify candidate genes or construct a linkage map with a large number of SSR markers. As an alternative, RAD tag sequencing was developed and has been extensively used to generate SNP genotype data at the population level. The main reason for its success is that RAD-Seq does not require any previous genomic knowledge. The existing RAD methods mainly include the original RAD-Seq [10,57], IIB-restriction site-associated DNA (2b-RAD) [58,59,60], and double digest restriction site-associated DNA (ddRAD) [4,61]. The first SNP-based linkage map of the orange-spotted grouper was constructed based on RAD-Seq containing 4608 SNPs with an average marker interval of 0.56 cM. The total lengths of the female and male maps were 1370.9 and 1335.5 cM, respectively [14].
In this study, a linkage map of the red-spotted grouper using RAD-Seq was constructed for the first time using 3,435 RAD markers genotyped from 144 individuals. The length of the consensus map was 2300.12 cM with an average inter-location space of 0.67 cM. The total lengths of the female and male maps were 1370.9 and 1335.5 cM, respectively, indicating a substantial female bias in recombination with a female-to-male recombination ratio of 1.47:1. Sex-specific differences in recombination rates are common and have been reported in both vertebrates and invertebrates. In organisms with chromosomal sex determination, the meiotic recombination rate of males is substantially lower than females [62]. This pattern of sex-specific recombination has also been found in many fish species, including Asian seabass (Lates calcarijer) (the rate of total lengths of female map to male map, F:M = 1.12:1) [63], common carp (F:M= 1.23:1) [64], Atlantic salmon (F:M=1.38:1) [5], and snapper (F:M = 1.62:1) [12], as well as other aquatic animals [62,65]. There are several possible explanations for the mechanism of sex-specific recombination rates: (1) germ cells develop in different environments, with heterogametic sex and temporal differences during the beginning of meiosis between the sexes; (2) there are differences between ovocytes and sperm in homolog pairing and synapsis during meiosis [66]; and (3) at the individual chromosomal level, recombination usually varies regionally by sex with increased recombination exhibited in regions proximal to centromeres in females and telomeres in males [67].

4.3. QTL Analysis Based on the High-Density SNP Genetic Map

Mapping QTLs contributes to our understanding of the underlying genetic mechanisms of economic traits. Like most economic traits, growth is a quantitative trait regulated by multiple genes from different genomic regions. Mainly, growth traits include full length, body length, body weight, and head length. QTL mapping is a practical approach for identifying these regions. Recently, along with the successful construction of high-density genetic linkage maps, a multitude of QTLs related to growth traits have been detected in snapper [59], channel catfish (Lctalurus punctatus) [68], yellow drum (Nibea albiflora) [69], golden pompano [57], Mandarin fish (Siniperca chuatsi) [70], Pacific bluefin tuna (Thunnus orientalis) [71], pikeperch (Sander lucioperca) [72], blunt snout bream (Megalobrama amblycephala) [73], Atlantic salmon [55], large yellow croaker [74], and crucian carp [75]. No QTLs have been reported in the red-spotted grouper until now. However, several QTLs governing growth have been identified in the orange-spotted grouper, where 27 significant QTLs were detected in the genetic map, and 17 candidate genes were identified from these QTL regions.
In this study, based on the high-density genetic linkage map of the red-spotted grouper, 17 growth trait-related QTLs with a LOD ≥3.5 were identified on eight LGs. Many QTLs exhibited pleiotropy. Namely, qTLG6-FL (21190, 449098) and qTLG6_BL (21190, 449098) were identified in a 32.24–32.59 cM interval on LG6; qTLG10-FL (858434, 17495) and qTLG10_BL (858434, 17495) were identified in the same genetic position (93.08–96.14 cM) on LG10; and qTLG11-FL (755146) and qTLG11-BW (755146) were identified in a 14.33–15.33 cM interval on LG11. The clustering of QTLs indicates that the same chromosome region is shared by various QTLs, which may be due to the high correlation between the full length and body length phenotypic traits. Identification of these pleiotropic QTLs could increase the efficiency of MAS and accelerate breeding progress. A similar result has also been reported in whiteleg shrimp (Penaeus vannamei) [76]. Collectively, the findings of these studies act as useful references for mining grouper QTLs. These identified candidate genes will contribute to furthering our understanding of the genetic foundation underlying grouper growth.

4.4. Protein Network Analysis

Progress has been made in “omics” research (e.g., genomics, transcriptomics, proteomics, and metabolomics), which has led to vast amounts of biological data. Visualization is the easiest way to represent large biological datasets. STRING and Cytoscape software are commonly used in bioinformatic visualization studies. For example, the virulence gene prediction and construction of the protein interaction network of the orange-spotted grouper were determined using STRING and Cytoscape software, which suggested that the spleen of the orange-spotted grouper is an excellent target for studying the immune response of grouper to Polychloride miticide [23]. In this study, these visualization tools were used to analyze the red-spotted grouper QTL data. Twenty nodes with the greatest degree of network connection were determined using data from the Cytoscape and STRING databases. The top 20 hub genes identified were uqcrh, uqcrc2b, uqcrc1, cyc1, cytb, ENSDARG00000007745, uqcrq, uqcrb, uqcrfs1, cycsb, ndufs2, grid1, gabra5, alkbh8, kbtbd3, srm, gabra6b, raly, zfp36, and mb21d2b. The red-spotted grouper candidate gene with the greatest number of node networks (n = 11) was cyc1. Cytochrome c is a key protein involved in the process of energy utilization, which is the terminal step of the electron transport system. In animals, cytochrome c activity is closely related to actual oxygen consumption rates of different tissues. It is also sensitive to energy demands of exercise activity and various nutritional states [77]. Moreover, it has been demonstrated that changes in relative tissue size and cytochrome c activity could cause changes in the growth rate of largemouth bass (Micropterus salmoides) [78]. Therefore, cytochrome c may be an important growth target gene of the red-spotted grouper. By uncovering the protein interaction network in the red-spotted grouper, it may be possible to illuminate whole-body metabolic activity as the sum of tissue activity and physiological function.

5. Conclusions

A high-density genetic linkage map of the red-spotted grouper was constructed in this study. The map comprised 3435 SNPs on 24 LGs. Seventeen growth-related QTLs were identified in a genomic region. A protein–protein interaction network was also constructed. These findings provide a pivotal interactions network and will serve as a valuable resource for future investigations on the underlying molecular mechanisms of the red-spotted grouper.

Supplementary Materials

The following are available online at https://www.mdpi.com/2073-4425/10/10/793/s1, Figure S1: STRING interaction network showing association between differentially expressed protein, Table S1: Phenotypic information, Table S2: The protein informations in the protein interaction networks (PPI), Table S3: Genetic maps construction for some fish species between 2015 and 2019.

Author Contributions

X.Y., Y.Z., S.L., L.Z., H.L., and Q.S. contributed to study design; X.W., X.L., D.W., and S.W. contributed to the fish and sample preparation; S.J., X.Z., and X.Y., performed the bioinformatics analysis; S.J., X.W. and X.Y. wrote the paper. All authors read and approved the final manuscript.

Acknowledgments

This work was supported by the National Natural Science Foundation of China (No. 31872572, 31672631, 31972769, U1301252), the Guangdong Provincial Natural Science Foundation (2018B030311026, 2018A030313890), the Guangdong Provincial Science and Technology Program (2017B0202450001, 2017B090904022), the Guangdong Provincial Special Fund For Modern Agriculture Industry Technology Innovation Teams, the Special Fund of State Key Laboratory of Developmental Biology of Freshwater (2018KF001), the Fund of Southern Marine Science and Engineering Guangdong Laboratory (ZhanJiang) (ZJW-2019-06), the Special Fund for Fisheries-Scientific Research of Guangdong Province (SDYY-2018-04), the Shenzhen Special Program for Development of Strategic Emerging and Future Industries (No. 20170428173357698), and the Shenzhen Dapeng Special Program for Industrial Development (No. KT20170205).

Conflicts of Interest

The authors declare no conflict of interest.

References

  1. Kayano, Y.; Yao, S.; Yamamoto, S.; Nakagawa, H. Effects of feeding frequency on the growth and body constituents of young red-spotted grouper, Epinephelus akaara. Aquaculture 1993, 110, 271–278. [Google Scholar] [CrossRef]
  2. Liao, I.C.; Su, H.M.; Chang, E.Y. Techniques in finfish larviculture in Taiwan. Aquaculture 2001, 200, 1–31. [Google Scholar] [CrossRef]
  3. Andrews, K.R.; Good, J.M.; Miller, M.R.; Luikart, G.; Hohenlohe, P.A. Harnessing the power of RADseq for ecological and evolutionary genomics. Nat. Rev. Genet. 2016, 17, 81. [Google Scholar] [CrossRef]
  4. Robledo, D.; Palaiokostas, C.; Bargelloni, L.; Martínez, P.; Houston, R. Applications of genotyping by sequencing in aquaculture breeding and genetics. Rev. Aquac. 2018, 10, 670–682. [Google Scholar] [CrossRef]
  5. Lien, S.; Gidskehaug, L.; Moen, T.; Hayes, B.J.; Berg, P.R.; Davidson, W.S.; Omholt, S.W.; Kent, M.P. A dense SNP-based linkage map for Atlantic salmon (Salmo salar) reveals extended chromosome homeologies and striking differences in sex-specific recombination patterns. BMC Genom. 2011, 12, 615. [Google Scholar] [CrossRef] [PubMed]
  6. Song, W.; Pang, R.; Niu, Y.; Gao, F.; Zhao, Y.; Zhang, J.; Sun, J.; Shao, C.; Liao, X.; Wang, L. Construction of high-density genetic linkage maps and mapping of growth-related quantitative trail loci in the Japanese flounder (Paralichthys olivaceus). PLoS ONE 2012, 7, e50404. [Google Scholar] [CrossRef] [PubMed]
  7. Palti, Y.; Gao, G.; Liu, S.; Kent, M.; Lien, S.; Miller, M.; Rexroad III, C.; Moen, T. The development and characterization of a 57 K single nucleotide polymorphism array for rainbow trout. Mol. Ecol. Resour. 2015, 15, 662–672. [Google Scholar] [CrossRef] [PubMed]
  8. Palti, Y.; Vallejo, R.L.; Gao, G.; Liu, S.; Hernandez, A.G.; Rexroad, C.E., III; Wiens, G.D. Detection and validation of QTL affecting bacterial cold water disease resistance in rainbow trout using restriction-site associated DNA sequencing. PLoS ONE 2015, 10, e0138435. [Google Scholar] [CrossRef] [PubMed]
  9. Qiu, G.-F.; Xiong, L.-W.; Han, Z.-K.; Liu, Z.-Q.; Feng, J.-B.; Wu, X.-G.; Yan, Y.-L.; Shen, H.; Huang, L.; Chen, L. A second generation SNP and SSR integrated linkage map and QTL mapping for the Chinese mitten crab Eriocheir sinensis. Sci. Rep. 2017, 7, 39826. [Google Scholar] [CrossRef] [PubMed]
  10. Xie, M.; Ming, Y.; Shao, F.; Jian, J.; Zhang, Y.; Peng, Z. Restriction site-associated DNA sequencing for SNP discovery and high-density genetic map construction in southern catfish (Silurus meridionalis). R. Soc. Open Sci. 2018, 5, 172054. [Google Scholar] [CrossRef]
  11. Song, J.; Li, Q.; Yu, Y.; Wan, S.; Han, L.; Du, S. Mapping genetic loci for quantitative traits of golden shell color, mineral element contents, and growth-related traits in Pacific oyster (Crassostrea gigas). Mar. Biotechnol. 2018, 20, 666–675. [Google Scholar] [CrossRef] [PubMed]
  12. Ashton, D.T.; Ritchie, P.A.; Wellenreuther, M. High-density linkage map and QTLs for growth in snapper (Chrysophrys auratus). G3 Genes Genomes Genet. 2019, 9, 1027–1035. [Google Scholar] [CrossRef] [PubMed]
  13. Wang, L.; Xie, N.; Shen, Y.; Ye, B.; Yue, G.H.; Feng, X. Constructing High-Density Genetic Maps and Developing Sexing Markers in Northern Snakehead (Channa argus). Mar. Biotechnol. 2019, 21, 348–358. [Google Scholar] [CrossRef] [PubMed]
  14. You, X.; Shu, L.; Li, S.; Chen, J.; Luo, J.; Lu, J.; Mu, Q.; Bai, J.; Xia, Q.; Chen, Q. Construction of high-density genetic linkage maps for orange-spotted grouper Epinephelus coioides using multiplexed shotgun genotyping. BMC Genet. 2013, 14, 113. [Google Scholar] [CrossRef]
  15. Yu, H.; You, X.; Li, J.; Liu, H.; Meng, Z.; Xiao, L.; Zhang, H.; Lin, H.-R.; Zhang, Y.; Shi, Q. Genome-wide mapping of growth-related quantitative trait loci in orange-spotted grouper (Epinephelus coioides) using double digest restriction-site associated DNA sequencing (ddRADseq). Int. J. Mol. Sci. 2016, 17, 501. [Google Scholar] [CrossRef]
  16. Watanabe, M.; Shimizu, T.; Kamarudin, A.S.B.; Kuniyoshi, H.; Ohara, K.; Takagi, M.; Umino, T. Ten novel polymorphic microsatellite loci of Red-spotted grouper (Epinephelus akaara) revealed from full-sib progeny and unrelated individuals. Conserv. Genet. Resour. 2011, 3, 613–616. [Google Scholar] [CrossRef]
  17. Dor, L.; Shirak, A.; Gorshkov, S.; Band, M.R.; Korol, A.; Ronin, Y.; Curzon, A.; Hulata, G.; Seroussi, E.; Ron, M. Construction of a microsatellites-based linkage map for the white grouper (Epinephelus aeneus). G3 Genes Genomes Genet. 2014, 4, 1455–1464. [Google Scholar] [CrossRef]
  18. Liu, Q.; Sakamoto, T.; Kubota, S.; Okamoto, N.; Yamashita, H.; Takagi, M.; Shigenobu, Y.; Sugaya, T.; Nakamura, Y.; Sano, M. A genetic linkage map of kelp grouper (Epinephelus bruneus) based on microsatellite markers. Aquaculture 2013, 414, 63–81. [Google Scholar] [CrossRef]
  19. Ge, H.; Lin, K.; Shen, M.; Wu, S.; Wang, Y.; Zhang, Z.; Wang, Z.; Zhang, Y.; Huang, Z.; Zhou, C. De novo assembly of a chromosome-level reference genome of red-spotted grouper (Epinephelus akaara) using nanopore sequencing and Hi-C. Mol. Ecol. Resour. 2019, 19, 1322–1332. [Google Scholar] [CrossRef]
  20. Szklarczyk, D.; Morris, J.H.; Cook, H.; Kuhn, M.; Wyder, S.; Simonovic, M.; Santos, A.; Doncheva, N.T.; Roth, A.; Bork, P. The STRING database in 2017: Quality-controlled protein–protein association networks, made broadly accessible. Nucleic Acids Res. 2016, 45, 362–368. [Google Scholar] [CrossRef]
  21. Liang, W.; Sun, F. Competing Endogenous RNA Network Analysis Reveals Pivotal ceRNAs in Adrenocortical Carcinoma. Front. Endocrinol. 2019, 10, 301–309. [Google Scholar] [CrossRef] [PubMed]
  22. Khan, Z.A.; Labala, R.K.; Mondal, G.; Devi, H.S.; Rajiv, C.; Yumnamcha, T.; Devi, S.D.; Bharali, R.; Thorat, S.S.; Chattoraj, A. The daily expression profile of Neuropeptides (gnih, gnrh3, kiss1 and kiss2): A study of possible interaction in the brain of Zebrafish (Danio rerio). J. Endocrinol. Reprod. 2017, 20, 46–54. [Google Scholar]
  23. Zhang, B.; Zhuang, Z.; Wang, X.; Huang, H.; Fu, Q.; Yan, Q. Dual RNA-Seq reveals the role of a transcriptional regulator gene in pathogen-host interactions between Pseudomonas plecoglossicida and Epinephelus coioides. Fish. Shellfish Immunol. 2019, 87, 778–787. [Google Scholar] [CrossRef] [PubMed]
  24. Puente-Marin, S.; Nombela, I.; Chico, V.; Ciordia, S.; Mena, M.C.; Perez, L.G.; Coll, J.; Ortega-Villaizan, M.d.M. Potential Role of Rainbow Trout Erythrocytes as Mediators in the Immune Response Induced by a DNA Vaccine in Fish. Vaccines 2019, 7, 60. [Google Scholar] [CrossRef]
  25. Baird, N.A.; Etter, P.D.; Atwood, T.S.; Currey, M.C.; Shiver, A.L.; Lewis, Z.A.; Selker, E.U.; Cresko, W.A.; Johnson, E.A. Rapid SNP discovery and genetic mapping using sequenced RAD markers. PLoS ONE 2008, 3, e3376. [Google Scholar] [CrossRef]
  26. Catchen, J.M.; Amores, A.; Hohenlohe, P.; Cresko, W.; Postlethwait, J.H. Stacks: Building and genotyping loci de novo from short-read sequences. G3 Genes Genomes Genet. 2011, 1, 171–182. [Google Scholar] [CrossRef]
  27. Voorrips, R. MapChart: Software for the graphical presentation of linkage maps and QTLs. J. Hered. 2002, 93, 77–78. [Google Scholar] [CrossRef]
  28. Rastas, P.; Paulin, L.; Hanski, I.; Lehtonen, R.; Auvinen, P. Lep-MAP: Fast and accurate linkage map construction for large SNP datasets. Bioinformatics 2013, 29, 3128–3134. [Google Scholar] [CrossRef]
  29. Luciano Da Costa, E.S.; Wang, S.; Zeng, Z.-B. Composite interval mapping and multiple interval mapping: Procedures and guidelines for using Windows QTL Cartographer. In Quantitative Trait Loci (QTL); Springer: Berlin, Germany, 2012; pp. 75–119. [Google Scholar]
  30. Wang, W.; Huang, S.; Liu, Y.; Fang, Z.; Yang, L.; Hua, W.; Yuan, S.; Liu, S.; Sun, J.; Zhuang, M. Construction and analysis of a high-density genetic linkage map in cabbage (Brassica oleracea L. var. capitata). BMC Genom. 2012, 13, 523. [Google Scholar] [CrossRef]
  31. Van Ooijen, J.W. Accuracy of mapping quantitative trait loci in autogamous species. Theor. Appl. Genet. 1992, 84, 803–811. [Google Scholar] [CrossRef]
  32. Wang, Y.; Wang, H.; Zhang, H.; Liufu, Y. Karyotypes of Epinephelus coioides and Epinephelus adaara. J. Zhanjiang Ocean. Univ. 2004, 24, 4–8. [Google Scholar]
  33. Wang, B.; Jia, J.; Yang, G.; Qin, J.; Zhang, C.; Zhang, Q.; Sun, C.; Li, W. In vitro effects of somatostatin on the growth hormone-insulin-like growth factor axis in orange-spotted grouper (Epinephelus coioides). Gen. Comp. Endocrinol. 2016, 237, 1–9. [Google Scholar] [CrossRef] [PubMed]
  34. Rousseau, K.; Dufour, S. Phylogenetic evolution of the neuroendocrine control of growth hormone: Contribution from teleosts. Cybium 2004, 28, 181–198. [Google Scholar]
  35. Yunker, W.K.; Smith, S.; Graves, C.; Davis, P.J.; Unniappan, S.; Rivier, J.E.; Peter, R.E.; Chang, J.P. Endogenous hypothalamic somatostatins differentially regulate growth hormone secretion from goldfish pituitary somatotropes in vitro. Endocrinology 2003, 144, 4031–4041. [Google Scholar] [CrossRef] [PubMed]
  36. Murray, R.D.; Kim, K.; Ren, S.-G.; Chelly, M.; Umehara, Y.; Melmed, S. Central and peripheral actions of somatostatin on the growth hormone–IGF-I axis. J. Clin. Investig. 2004, 114, 349–356. [Google Scholar] [CrossRef]
  37. Li, W.; Chu, M.; Lin, H.; Wong, A. In Interaction of pituitary adenylate cyclase-activating polypeptide with gonadotropin-releasing hormone, dopamine, and somatostatin in regulating growth hormone gene expression in grass carp pituitary cells. In Proceedings of the 4th International Symposium on Fish Endocrinology, Seattle, WA, USA, 31 July–3 August 2000. [Google Scholar]
  38. Händel, M.; Schulz, S.; Stanarius, A.; Schreff, M.; Erdtmann-Vourliotis, M.; Schmidt, H.; Wolf, G.; Höllt, V. Selective targeting of somatostatin receptor 3 to neuronal cilia. Neuroscience 1999, 89, 909–926. [Google Scholar] [CrossRef]
  39. Rescan, P.-Y.; Montfort, J.; Rallière, C.; Le Cam, A.; Esquerré, D.; Hugot, K. Dynamic gene expression in fish muscle during recovery growth induced by a fasting-refeeding schedule. BMC Genom. 2007, 8, 438. [Google Scholar] [CrossRef]
  40. Podgorniak, T.; Brockmann, S.; Konstantinidis, I.; Fernandes, J.M. Differences in the fast muscle methylome provide insight into sex-specific epigenetic regulation of growth in Nile tilapia during early stages of domestication. Epigenetics 2019, 14, 818–836. [Google Scholar] [CrossRef]
  41. Andersen, S.M.; Waagbø, R.; Espe, M. Functional amino acids in fish health and welfare. Front. Biosci. 2016, 8, 143–169. [Google Scholar]
  42. Chatchaiphan, S.; Srisapoome, P.; Kim, J.-H.; Devlin, R.H.; Na-Nakorn, U. De novo transcriptome characterization and growth-related gene expression profiling of diploid and triploid bighead catfish (Clarias macrocephalus Günther, 1864). Mar. Biotechnol. 2017, 19, 36–48. [Google Scholar] [CrossRef]
  43. Kaushik, G.; Xia, Y.; Pfau, J.C.; Thomas, M.A. Dysregulation of autism-associated synaptic proteins by psychoactive pharmaceuticals at environmental concentrations. Neurosci. Lett. 2017, 661, 143–148. [Google Scholar] [CrossRef] [PubMed]
  44. Sazhenova, E.; Nikitina, T.; Skryabin, N.; Minaycheva, L.; Ivanova, T.; Nemtseva, T.; Yuriev, S.Y.; Evtushenko, I.; Lebedev, I. Epigenetic status of imprinted genes in placenta during recurrent pregnancy loss. Russ. J. Genet. 2017, 53, 376–387. [Google Scholar] [CrossRef]
  45. Lam, S.W.; van IJzendoorn, D.G.; Cleton-Jansen, A.-M.; Szuhai, K.; Bovée, J.V. Molecular pathology of bone tumors. J. Mol. Diagn. 2018, 18, 30329–30333. [Google Scholar] [CrossRef] [PubMed]
  46. Migdalska-Richards, A.; Mill, J. Epigenetic studies of schizophrenia: Current status and future directions. Curr. Opin. Behav. Sci. 2019, 25, 102–110. [Google Scholar] [CrossRef]
  47. Kolshus, E.; Dalton, V.; Ryan, K.; McLoughlin, D. When less is more–microRNAs and psychiatric disorders. Acta Psychiatr. Scand. 2014, 129, 241–256. [Google Scholar] [CrossRef] [PubMed]
  48. Nadeau, N.J.; Minvielle, F.; Ito, S.; Inoue-Murayama, M.; Gourichon, D.; Follett, S.A.; Burke, T.; Mundy, N.I. Characterization of Japanese quail yellow as a genomic deletion upstream of the avian homolog of the mammalian ASIP (agouti) gene. Genetics 2008, 178, 777–786. [Google Scholar] [CrossRef] [PubMed]
  49. Zopf, C.; Quinn, K.; Zeidman, J.; Maheshri, N. Cell-cycle dependence of transcription dominates noise in gene expression. PLoS Comput. Biol. 2013, 9, e1003161. [Google Scholar] [CrossRef]
  50. Yan, J.; Liao, K.; Wang, T.; Mai, K.; Xu, W.; Ai, Q. Dietary lipid levels influence lipid deposition in the liver of large yellow croaker (Larimichthys crocea) by regulating lipoprotein receptors, fatty acid uptake and triacylglycerol synthesis and catabolism at the transcriptional level. PLoS ONE 2015, 10, e0129937. [Google Scholar] [CrossRef]
  51. Endres, L.; Fasullo, M.; Rose, R. tRNA modification and cancer: Potential for therapeutic prevention and intervention. Future Med. Chem. 2019, 11, 885–900. [Google Scholar] [CrossRef]
  52. Takahashi, K.; Mitoma, J.; Hosono, M.; Shiozaki, K.; Sato, C.; Yamaguchi, K.; Kitajima, K.; Higashi, H.; Nitta, K.; Shima, H. Sialidase NEU4 hydrolyzes polysialic acids of neural cell adhesion molecules and negatively regulates neurite formation by hippocampal neurons. J. Biol. Chem. 2012, 287, 14816–14826. [Google Scholar] [CrossRef]
  53. Liu, Z.J.; Cordes, J. DNA marker technologies and their applications in aquaculture genetics. Aquaculture 2004, 238, 1–37. [Google Scholar] [CrossRef]
  54. Joshi, R.; Arnyasi, M.; Lien, S.; Gjøen, H.M.; Alvarez, A.T.; Kent, M. Development and validation of 58K SNP-array and high-density linkage map in Nile tilapia (O. niloticus). Front. Genet. 2018, 9, 472. [Google Scholar] [CrossRef] [PubMed]
  55. Tsai, H.Y.; Robledo, D.; Lowe, N.R.; Bekaert, M.; Taggart, J.B.; Bron, J.E.; Houston, R.D. Construction and annotation of a high density SNP linkage map of the Atlantic salmon (Salmo salar) genome. G3 Genes Genomes Genet. 2016, 6, 2173–2179. [Google Scholar] [CrossRef] [PubMed]
  56. Ren, P.; Peng, W.; You, W.; Huang, Z.; Guo, Q.; Chen, N.; He, P.; Ke, J.; Gwo, J.-C.; Ke, C. Genetic mapping and quantitative trait loci analysis of growth-related traits in the small abalone Haliotis diversicolor using restriction-site-associated DNA sequencing. Aquaculture 2016, 454, 163–170. [Google Scholar] [CrossRef]
  57. Zhang, G.; Zhang, X.; Ye, H.; Jiang, S.; Yu, H.; Li, J.; Shi, Q.; Chen, G.; Zhou, Z.; Luo, J. Construction of high-density genetic linkage maps and QTL mapping in the golden pompano. Aquaculture 2018, 482, 90–95. [Google Scholar] [CrossRef]
  58. Palaiokostas, C.; Ferraresso, S.; Franch, R.; Houston, R.D.; Bargelloni, L. Genomic prediction of resistance to pasteurellosis in gilthead sea bream (Sparus aurata) using 2b-RAD sequencing. G3 Genes Genomes Genet. 2016, 6, 3693–3700. [Google Scholar] [CrossRef]
  59. Liu, H.; Fu, B.; Pang, M.; Feng, X.; Yu, X.; Tong, J. A high-density genetic linkage map and QTL fine mapping for body weight in crucian carp (Carassius auratus) using 2b-RAD sequencing. G3 Genes Genomes Genet. 2017, 7, 2473–2487. [Google Scholar] [CrossRef]
  60. Dou, J.; Li, X.; Fu, Q.; Jiao, W.; Li, Y.; Li, T.; Wang, Y.; Hu, X.; Wang, S.; Bao, Z. Evaluation of the 2b-RAD method for genomic selection in scallop breeding. Sci. Rep. 2016, 6, 19244. [Google Scholar] [CrossRef]
  61. Kong, S.; Ke, Q.; Chen, L.; Zhou, Z.; Pu, F.; Zhao, J.; Bai, H.; Peng, W.; Xu, P. Constructing a High-Density Genetic Linkage Map for Large Yellow Croaker (Larimichthys crocea) and Mapping Resistance Trait Against Ciliate Parasite Cryptocaryon irritans. Mar. Biotechnol. 2019, 21, 262–275. [Google Scholar] [CrossRef]
  62. Jones, D.B.; Jerry, D.R.; Khatkar, M.S.; Raadsma, H.W.; Zenger, K.R. A high-density SNP genetic linkage map for the silver-lipped pearl oyster, Pinctada maxima: A valuable resource for gene localisation and marker-assisted selection. BMC Genom. 2013, 14, 810. [Google Scholar] [CrossRef]
  63. Wang, L.; Wan, Z.Y.; Bai, B.; Huang, S.Q.; Chua, E.; Lee, M.; Pang, H.Y.; Wen, Y.F.; Liu, P.; Liu, F. Construction of a high-density linkage map and fine mapping of QTL for growth in Asian seabass. Sci. Rep. 2015, 5, 16358. [Google Scholar] [CrossRef] [PubMed]
  64. Peng, W.; Xu, J.; Zhang, Y.; Feng, J.; Dong, C.; Jiang, L.; Feng, J.; Chen, B.; Gong, Y.; Chen, L. An ultra-high density linkage map and QTL mapping for sex and growth-related traits of common carp (Cyprinus carpio). Sci. Rep. 2016, 6, 26693. [Google Scholar] [CrossRef] [PubMed]
  65. Hubert, S.; Hedgecock, D. Linkage maps of microsatellite DNA markers for the Pacific oyster Crassostrea gigas. Genetics 2004, 168, 351–362. [Google Scholar] [CrossRef]
  66. Haldane, J. Sex ratio and unisexual sterility in hybrid animals. J. Genet. 1922, 12, 101–109. [Google Scholar] [CrossRef] [Green Version]
  67. Kong, A.; Gudbjartsson, D.F.; Sainz, J.; Jonsdottir, G.M.; Gudjonsson, S.A.; Richardsson, B.; Sigurdardottir, S.; Barnard, J.; Hallbeck, B.; Masson, G. A high-resolution recombination map of the human genome. Nat. Genet. 2002, 31, 241. [Google Scholar] [CrossRef]
  68. Zhu, C.; Liu, H.; Pan, Z.; Chang, G.; Wang, H.; Wu, N.; Ding, H.; Yu, X. Construction of a high-density genetic linkage map and QTL mapping for growth traits in Pseudobagrus ussuriensis. Aquaculture 2019, 511, 734213. [Google Scholar] [CrossRef]
  69. Zhang, S.; Zhang, X.; Chen, X.; Xu, T.; Wang, M.; Qin, Q.; Zhong, L.; Jiang, H.; Zhu, X.; Liu, H. Construction of a High-density Linkage Map and QTL Fine Mapping for Growth and Sex Related Traits in Channel Catfish (Ictalurus punctatus). Front. Genet. 2019, 10, 251. [Google Scholar] [CrossRef]
  70. Qiu, C.; Han, Z.; Li, W.; Ye, K.; Xie, Y.; Wang, Z. A high-density genetic linkage map and QTL mapping for growth and sex of yellow drum (Nibea albiflora). Sci. Rep. 2018, 8, 17271. [Google Scholar] [CrossRef]
  71. Sun, C.; Niu, Y.; Ye, X.; Dong, J.; Hu, W.; Zeng, Q.; Chen, Z.; Tian, Y.; Zhang, J.; Lu, M. Construction of a high-density linkage map and mapping of sex determination and growth-related loci in the mandarin fish (Siniperca chuatsi). BMC Genom. 2017, 18, 446. [Google Scholar] [CrossRef]
  72. Uchino, T.; Hosoda, E.; Nakamura, Y.; Yasuike, M.; Mekuchi, M.; Sekino, M.; Fujiwara, A.; Sugaya, T.; Tanaka, Y.; Kumon, K. Genotyping-by-sequencing for construction of a new genetic linkage map and QTL analysis of growth-related traits in Pacific bluefin tuna. Aquac. Res. 2018, 49, 1293–1301. [Google Scholar] [CrossRef]
  73. Guo, J.; Li, C.; Teng, T.; Shen, F.; Chen, Y.; Wang, Y.; Pan, C.; Ling, Q. Construction of the first high-density genetic linkage map of pikeperch (Sander lucioperca) using specific length amplified fragment (SLAF) sequencing and QTL analysis of growth-related traits. Aquaculture 2018, 497, 299–305. [Google Scholar] [CrossRef]
  74. Wan, S.-M.; Liu, H.; Zhao, B.-W.; Nie, C.-H.; Wang, W.-M.; Gao, Z.-X. Construction of a high-density linkage map and fine mapping of QTLs for growth and gonad related traits in blunt snout bream. Sci. Rep. 2017, 7, 46509. [Google Scholar] [CrossRef] [PubMed]
  75. Ao, J.; Li, J.; You, X.; Mu, Y.; Ding, Y.; Mao, K.; Bian, C.; Mu, P.; Shi, Q.; Chen, X. Construction of the high-density genetic linkage map and chromosome map of large yellow croaker (Larimichthys crocea). Int. J. Mol. Sci. 2015, 16, 26237–26248. [Google Scholar] [CrossRef] [PubMed]
  76. Andriantahina, F.; Liu, X.; Huang, H. Genetic map construction and quantitative trait locus (QTL) detection of growth-related traits in Litopenaeus vannamei for selective breeding applications. PLoS ONE 2013, 8, e75206. [Google Scholar] [CrossRef]
  77. Simon, L.M.; Robin, E.D. Relationship of cytochrome oxidase activity to vertebrate total and organ oxygen consumption. Int. J. Biochem. 1971, 2, 569–573. [Google Scholar] [CrossRef]
  78. Goolish, E.M.; Adelman, I.R. Tissue-specific cytochrome oxidase activity in largemouth bass: The metabolic costs of feeding and growth. Physiol. Zool. 1987, 60, 454–464. [Google Scholar] [CrossRef]
Figure 1. LG lengths and marker distributions of a high-resolution genetic map of the red-spotted grouper. Quantitative trait loci (QTL) names are shown on the left side of each LG. Red, green, and blue represent the full length, body length, and body weight traits, respectively.
Genes 10 00793 g001
Figure 2. Genetic locations of growth-related QTLs on the 24 LGs of the red-spotted grouper. Green horizontal lines indicate the cutting threshold of LOD at 3.5. Green, blue, and red represent the body length, body weight, and full length traits, respectively.
Genes 10 00793 g002
Figure 3. Illustration of the growth candidate gene core in Cytoscape.
Genes 10 00793 g003
Table 1. Information on marker numbers and map lengths of different linkage groups (LGs) in the red-spotted grouper.
Linkage
Group
ConsensusFemaleMale
MarkerSize (cM)MarkerSize (cM)MarkerSize (cM)
LG1184106.60146100.12118126.50
LG27598.715770.9275106.19
LG319384.63193131.332040.38
LG414599.7912695.3074109.50
LG517181.85157112.502944.82
LG614090.6414099.331332.17
LG773108.447092.974373.68
LG8251157.18231160.844036.32
LG9240101.88213131.382744.35
LG10174116.06164118.296590.05
LG11214128.37200177.058279.71
LG1215517.79155130.546375.75
LG13193138.3116492.3585119.22
LG1480108.708095.2680103.62
LG15179112.62169128.815874.76
LG16174120.20166118.027590.29
LG1710994.379078.621635.54
LG18118108.30118100.842942.07
LG19118102.54118101.207587.26
LG2011483.0911494.586685.05
LG219860.089864.591769.82
LG222032.672045.69722.78
LG2315493.0910570.013760.82
LG246354.215754.022621.32
Total34352300.1231512464.5612201671.97
Average14395.84131102.695169.67
Table 2. On growth-related QTLs in the red-spotted grouper. SNP: single nucleotide polymorphism; FL: full length; BL: body length; BW: body weight.
TraitQTLSNP IDGenetic Position (cM)Logarithm of Odds (LOD)Explained Phenotype (%)
FLqTLG6 _FL2119032.24_32.593.9211.8
449098
FLqTLG8_1169102137.04_137.433.9811.9
597906
633637
FLqTLG10_FL85843493.08_96.143.911.7
17495
FLqTLG11_FL75514614.33_15.333.7211.2
FLqTLG18_FL34373041.39_42.103.5210.7
BLqTLG1_17411533_9.123.8311.5
931102
BLqTLG1_211062784.0_85.294.0812.2
365461
BLqTLG6_BL2119032.24_32.593.9511.9
449098
BLqTLG10_BL85843493.08_96.144.3212.9
17495
BLqTLG1634125475.1_75.364.0112
444247
BLqTLG18_BL34373041.39_42103.5410.7
BLqTLG19_197846569.82_70.813.8211.5
BWqTLG8_2695031141.58_143.583.7611.3
BWqTLG10_2819257109.22_113.223.6311
BWqTLG10_3689551113.47_114.473.5510.7
BWqTLG11-BW75514614.33_15.334.2112.6
BWqTLG19_219679923.84_24.574.0612.2
964460
Table 3. Growth-related candidate genes in the red-spotted grouper.
QTLRelated TraitsSNP IDLociGene IDGene DescriptionReference
qTLG6FL and BL21190Chr4Eco_gene_10017022mRNA, disks large-associated protein 4-like (LOC108900233)
qTLG6FL and BL 449098Chr4Eco_gene_10020133mRNA, somatostatin-3B-like (somatostatin3)[38]
Eco_gene_10020134mRNA, spermidine synthase (srm)[41,42]
qTLG8_1FL633637Chr6Eco_gene_10016761mRNA, gamma-aminobutyric acid receptor subunit alpha-6 (gabra6)[43]
Eco_gene_10016762mRNA, gamma-aminobutyric acid receptor subunit alpha-2-like (gabra5)[44]
qTLG10FL and BL 858434Chr21Eco_gene_10016634mRNA, decay activator protein ZFP36-like (zfp36)[45]
Eco_gene_10016635mRNA, leucine-rich repeat and fibronectin type III domain-containing protein 1-like protein (LOC111216932)
qTLG10FL and BL17495Chr21Eco_gene_10021594mRNA, leucine rich repeat and fibronectin type III domain containing 1 (lrfn1)[46]
qTLG18FL and BL343730Chr15Eco_gene_10003697mRNA, delta-like canonical Notch ligand 1 (grid1))[47]
qTLG1_1BL741153Chr9Eco_gene_10012245mRNA, RALY heterogeneous nuclear ribonucleoprotein (raly)[48]
Eco_gene_10012246mRNA, cytochrome c1, heme protein, mitochondrial-like (cyc1)[49]
qTLG1_1BL931102Chr9Eco_gene_10014886mRNA, serine/threonine-protein kinase WNK2-like (LOC108886535)
qTLG1_2BL365461Chr9Eco_gene_10010099mRNA, low-density lipoprotein receptor-related protein 1-like (lrp1)[50]
qTLG10_3BW689551Chr21Eco_gene_10016615mRNA, alkB homolog 8, tRNA methyltransferase (alkbh8)[51]
Eco_gene_10016616mRNA, kelch repeat and BTB domain containing 3 (kbtbd3)
qTLG19_2BW96400Chr21Eco_gene_10000580mRNA, sialidase-4-like (neu4)[40,52]
qTLG16BL444247Chr19Eco_gene_10010609mRNA, protein kinase C gamma type-like (LOC114557331)
Table 4. Enriched GO and Kyoto Encyclopedia of Genes and Genomes (KEGG) pathway analyses in the STRING protein network.
GO TermTerm IDDescriptionp-Value
Biological processGO:0006122Mitochondrial electron transport, ubiquinol to cytochrome c9.3 × 10−4
GO:0046034ATP metabolic process5.0 × 10−3
GO:0009167Purine ribonucleoside monophosphate metabolic process5.7 × 10−3
Molecular functionGO:0009055Electron transfer activity7.3 × 10−4
Cellular componentGO:0070469Respirasome6.2 × 10−3
KEGG pathway IDDescriptionp-value
dre00190Oxidative phosphorylation7.19 × 10−14
dre04260Cardiac muscle contraction2.14 × 10−13
dre01100Metabolic pathways4.09 × 10−8

