ZCMM: A Novel Method Using Z-Curve Theory- Based and Position Weight Matrix for Predicting Nucleosome Positioning


1
College of Computer Science and Technology, Heilongjiang University, Harbin 150080, China
2
College of Bioinformatics Science and Technology, Harbin Medical University, Harbin 150081, China
3
College of Computer Science and Technology, Harbin Institute of Technology, Harbin 150001, China
*
Author to whom correspondence should be addressed.
Genes 2019, 10(10), 765; https://doi.org/10.3390/genes10100765
Submission received: 17 August 2019
/
Revised: 25 September 2019
/
Accepted: 26 September 2019
/
Published: 28 September 2019
(This article belongs to the Special Issue Selected Papers from the 15th International Symposium on Bioinformatics Research and Applications (ISBRA))
Abstract
:Nucleosomes are the basic units of eukaryotes. The accurate positioning of nucleosomes plays a significant role in understanding many biological processes such as transcriptional regulation mechanisms and DNA replication and repair. Here, we describe the development of a novel method, termed ZCMM, based on Z-curve theory and position weight matrix (PWM). The ZCMM was trained and tested using the nucleosomal and linker sequences determined by support vector machine (SVM) in Saccharomyces cerevisiae (S. cerevisiae), and experimental results showed that the sensitivity (Sn), specificity (Sp), accuracy (Acc), and Matthews correlation coefficient (MCC) values for ZCMM were 91.40%, 96.56%, 96.75%, and 0.88, respectively, and the average area under the receiver operating characteristic curve (AUC) value was 0.972. A ZCMM predictor was developed to predict nucleosome positioning in Homo sapiens (H. sapiens), Caenorhabditis elegans (C. elegans), and Drosophila melanogaster (D. melanogaster) genomes, and the accuracy (Acc) values were 77.72%, 85.34%, and 93.62%, respectively. The maximum AUC values of the four species were 0.982, 0.861, 0.912 and 0.911, respectively. Another independent dataset for S. cerevisiae was used to predict nucleosome positioning. Compared with the results of Wu’s method, it was found that the Sn, Sp, Acc, and MCC of ZCMM results for S. cerevisiae were all higher, reaching 96.72%, 96.54%, 94.10%, and 0.88. Compared with the Guo’s method ‘iNuc-PseKNC’, the results of ZCMM for D. melanogaster were better. Meanwhile, the ZCMM was compared with some experimental data in vitro and in vivo for S. cerevisiae, and the results showed that the nucleosomes predicted by ZCMM were highly consistent with those confirmed by these experiments. Therefore, it was further confirmed that the ZCMM method has good accuracy and reliability in predicting nucleosome positioning.
1. Introduction
The basic unit of eukaryotic chromatin is the nucleosome. Each nucleosome contains a 147-bp core DNA that is tightly wrapped in 1.67 left-handed super-helical turns around a histone octamer. Composed of DNA and a protein core, nucleosomes are about 10 nm in diameter and are the fundamental repeating unit of the chromatin structure of eukaryotic DNA [1,2,3,4]. Nucleosome tissues play a crucial role in controlling the DNA accessibility of many DNA-binding proteins to regulatory elements on chromosomes [5]. Nucleosome positioning broadly indicates where nucleosomes are located with respect to genomic DNA sequences [6]. By modulating the accessibility of genomic regions to regulatory proteins, it was observed that the packaging of DNA around the histone octamer plays important roles in many biological processes [7,8]. Most studies on nucleosome function have indicated that nucleosomes are involved in chromatin formation [9], antagonistic transcription factors [10,11], and regulating gene expression [12,13].
Chromatin at active gene promoters is characterized by a distinct nucleosome [14]. Nucleosomal sequences play a crucial role in controlling the DNA accessibility of many DNA-binding proteins to regulatory elements on chromosomes [5]. Knowing the accurate locations of nucleosomes within a genome is key to understanding gene regulation; however, the correct location and positioning of the nucleosome within the genome has been a long-standing issue in chromatin biology [15]. Precise nucleosome localization affects gene expression regulation, DNA replication, DNA repair, and DNA recombination [16,17,18,19]. It is important to investigate the mechanism involved in controlling nucleosome localization. The most common view is that nucleosome localization is determined by a combination of DNA sequences, ATP-dependent remodeling enzymes, transcription factors, and prolonged RNA polymerases [9,20]. DNA sequence features have been considered as important contributors to nucleosome assembly. The usefulness of nucleosome studies depends on the accuracy and precision of the map of nucleosomes in vivo. A number of different protocols have been developed to map nucleosome locations genome-wide, but currently it is common to digest chromatin fibers using micrococcal nuclease (MNase) followed by high-throughput sequencing (MNase-seq). The mechanism and method for yeast nucleosome localization have been proposed, indicating that nucleosomes can be guided by DNA in the coding region of the eukaryotic genome [21,22]. Some scholars proposed using sequencing of DNase I hypersensitive sites (DNase-seq) [23] to study nucleosome localization. It has also been proposed that circulating nucleosomes could be used as cancer markers, as nucleosomes that occupy certain parameters could serve as the starting point for replication [24,25,26].
Studying nucleosome positioning mainly concentrates on prediction algorithms, such as the algorithm with information entropy [7], the bases of deflection angle method to represent the nucleosome DNA sequence characteristics [13,26,27], methods to train the support vector machine (SVM) [22,28,29,30,31,32,33], the Bayesian algorithm [34], and neural network classifiers [35,36]. While nucleosome positioning is cell-type-dependent, the DNA sequence still plays an important role in directing preferential histone octamer assembly. Teif summarized the available experimental datasets, computational tools to analyze nucleosome positioning data and computational tools to predict nucleosome positioning from DNA sequences [37]. There are several methods for predicting nucleosome positioning based on sequence features that have been put forth in recent years, such as iNuc-PhysChem [38], iNuc-PseKNC [36], and nuMap [39]. Nucleosome positioning identified by computational methods is a valuable complement to experimental verification.
In this study, we propose a novel method, termed ZCMM, which is based on the Z-curve theory and position weight matrix (PWM). The Euclidean distance between the samples and the model was calculated as the feature, which was put into the support vector machine (SVM) to train and test the model for predicting nucleosomes. Z-curve theory was put forward by Zhang [40]; it is a novel method for mapping DNA or RNA sequences into a folding curve in three-dimensional space. The Z-curve has been proposed based on the symmetry of regular tetrahedrons. There exists a unique Z-curve for a given DNA sequence; therefore, a DNA sequence can be uniquely determined by a given Z-curve. The properties of Z-curves have been studied in great detail. It is well known that PWM is a model used to represent transcriptional factor binding sites based on the base features. In our paper, we constructed a Z-curve theory model (Z-curve model) based on a sequence and a PWM model for a dataset of nucleosomal sequences. Then, the ZCMM model was established by putting forward the Z-curve model multiplied by the PWM, which extracted the feature of nucleosomal and linker sequences, and provided the features for the SVM so as to predict nucleosome positioning across different species, such as Saccharomyces cerevisiae (S. cerevisiae), Homo sapiens (H. sapiens), Caenorhabditis elegans (C. elegans), and Drosophila melanogaster (D. melanogaster) genomes. The experimental results show that the ZCMM method can achieve good predictive efficiency and has strong stability.
2. Materials and Methods
2.1. Benchmark Datasets for Nucleosomal and Linker Sequences
In this study, we first targeted S. cerevisiae. The benchmark dataset S1 for S. cerevisiae was selected from Chou’s work [38]. The reference genome sequence of S. cerevisiae was obtained from the Saccharomyces Genome Database (http://www.yeastgenome.org/). The nucleosome positions of S. cerevisiae were derived from the published data obtained by Lee al. [41], where each of the 1,206,683 DNA fragments in the dataset constructed by these authors was assigned a nucleosome formation score using a lasso model, with a high or low score to reflect its high or low propensity in forming nucleosome, respectively. The low score can also be interpreted as the propensity to inhibit the formation of nucleosomes. To prepare a high-quality benchmark dataset, 5000 fragments of 150 bp with the highest scores were selected as the nucleosome-forming sequence samples to construct the positive dataset, and 5000 fragments of 150 bp with the lowest scores were selected as the nucleosome-inhibiting (or linker) sequence samples to construct the negative dataset.
Another dataset S2 was obtained from Wei Chen’s work [42], including nucleosomal sequences and linker sequences, and CD-HIT software [38] was used with the cutoff threshold set at 80% to remove redundancies. The two datasets can be mathematically expressed as:
In Formula (1), the dataset contains 10,000 samples, of which 5000 are nucleosomal sequences belonging to the positive subset and 5000 are linker sequences belonging to the negative subset . contains 3620 samples of 150 bp, of which 1880 are nucleosomal sequences belonging to the positive subset and 1740 are linker sequences belonging to the negative subset .
Three other different species were considered in this paper, i.e., H. sapiens, C. elegans, and D. melanogaster. The benchmark datasets for these species were taken from Guo’s work [36]. The experimental data for nucleosome positions in the first species [43] were downloaded from http://dir.nhlbi.nih.gov/papers/lmi/epigenomes/hgtcellnucleosomes.aspx; those for the second species from http://hgdownload.cse.ucsc.edu; and those for the third species from [44,45] and http://atlas.bx.psu.edu/. The entire genome sequences for the three species were downloaded from the UCSC (University of California Santa Cruz) Genome Browser: http://hgdownload.cse.ucsc.edu/, where the hg18 version, WS170/ce4 version and BDGP Release5 version were used for (1) H. sapiens, (2) C. elegans, and (3) D. melanogaster genomes, respectively [46]. CD-HIT software [47] was applied to remove redundant samples from benchmark datasets with a cutoff threshold value of 80%. These datasets were obtained as formulated by:
In Formula (2), the length of the all sequences for the three species is 147 bp. The dataset SH contains 4573 samples, of which 2273 are nucleosome-forming sequences belonging to the positive subset and 2300 are nucleosome-inhibiting sequences belonging to the negative subset . Meanwhile, SC contains 5175 samples, of which 2567 are nucleosome-forming sequences belonging to the positive subset and 2608 are nucleosome-inhibiting sequences belonging to the negative subset . SD contains 5750 samples, of which 2900 are nucleosome-forming sequences belonging to the positive subset , and 2850 are nucleosome-inhibiting sequences belonging to the negative subset .
2.2. Construction of the ZCMM Model for Nucleosomal and Linker Sequences
The Z-curve theory was put forward by Zhang [40]; it is a novel method for mapping DNA or RNA sequences into a folding curve in three-dimensional space. The Z-curve was proposed based on the symmetry of regular tetrahedrons. There exists a unique Z-curve for each given DNA sequence; therefore, a DNA sequence can be determined by a given Z-curve. The properties of Z-curves have been studied in great detail. The Z-curve theory is a relatively complete, systematic theory for investigating DNA sequences [48], internationally recognized and widely applied for DNA sequence analysis and gene identification. The Z-curve has three components: x, y, and z, each with a specific biological significance [40]. x denotes the distribution of purine (A + G) to pyrimidine (C + T) along the sequences. When the number of purine bases is more than that of pyrimidine bases, x >0; otherwise x <0; when these two are equal, x = 0. Similarly, y denotes the distribution of amino (A + C) to ketone (G + T) along the sequences. z denotes the distribution of weak hydrogen bonds (A + T) to strong hydrogen bonds (G + C) along the sequence. The three components of Z-curve contain the information of distribution of the bases in the DNA sequence.
In this study, we propose a novel model, termed ZCMM, for nucleosome positioning, which integrates the Z-curve theory [49] and position weight matrix to perform nucleosome localization. The ZCMM model is constructed by the following four steps.
In step 1, each nucleosomal or linker sequence is transformed to a matrix of 3*N by normalization Formula (3), which is converted into N ordered points in space. , , and represent the cumulative frequency of bases A, G, C, and T in the subsequence from the 1st to the nth position in a single sequence. The , and rows of the matrix represent the three coordinate components, and their range is between −1.0 and 1.0. represents the distribution of purine (A + G) to pyrimidine (C + T) of one sequence along the DNA sequence; represents the distribution of amino (A + C) to ketone (G + T) of one sequence along the DNA sequence; and represents the distribution of weak hydrogen bonds (A + T) to strong hydrogen bonds (G + C) of one sequence along the DNA sequence [40,49].
A single DNA sequence is transformed by Formula (3) as follows:
In step 2, for a set of nucleosomal sequences or linker sequences from the first to the nth position, the mean value of their corresponding positions is calculated to obtain the Z-curve model (ZCM) by Formula (4). , , and represent the average frequencies of accumulation of the four bases A, G, C, and T from the 1st to the nth position for m nucleosomal or linker sequences. ,, and are the same as in step 1. The ZCM represents the distribution of the average base accumulation frequencies of m sequences in the horizontal direction of DNA sequence. The ZCM is an accumulation of characteristic information, which can comprehensively represent the characteristics of nucleosomal or linker sequences, while the preference of m sequences in a single position in the vertical direction is rarely considered.
A set of nucleosomal or linker sequences for the ZCM is transformed by Formula (4) as follows:
In step 3, the position weight matrix (PWM) is constructed for a set of the nucleosomal or linker sequences by Formula (5). Here, represents the frequency of the bases i (A, T, G, C) in the nth (1,2, …, 147) position of the nucleosome DNA. is a background frequency that represents the frequency of bases i occurring genome-wide. is a matrix of 4*N and each element is denoted as . The PWM model represents the base preference of m sequences at a single position in the vertical direction.
In step 4, a new combination model—ZCMM—is constructed by Formula (6), and the ZCMM model is established by putting forward the ZCM model from Formula (4) multiplying by Formula (5). Thus, the element value of is multiplied by the corresponding element values in the Z-curve model for the three coordinates, as shown in Formula (6). ZCMM is a coordinate matrix of 3*N, and contains more feature information for identifying nucleosome positioning in the genome. The PWM element value put into Z-curve model is employed as a new weight in ZCMM. In this way, the ZCMM model not only reflects the distribution of the base accumulation frequency in the horizontal direction, but also reflects the preference of the base distribution in the vertical direction. Therefore, the ZCMM model can better represent the characteristics of nucleosomal sequences or linker sequences than the Z-curve model or the PWM, in theory. We use experimental data to confirm this in the results.
Consider that the Z-curve model represents the distribution of the average base accumulation frequency of m sequences in the horizontal direction of DNA sequences. We can understand the ZCMM model in this way, wherein xn represents the difference between the weighted cumulative content of (A + G) and the weighted cumulative content of (C + T); yn represents the difference between the weighted cumulative content of (A + C) and the weighted cumulative content of (G + T); zn represents the difference between the weighted cumulative content of (A + T) and the weighted cumulative content of (G + C).
A set of nucleosomal or linker sequences for the ZCMM model is transformed by Formula (6) as follows:
2.3. ZCMM Method for Identifying Nucleosome Positioning by SVM
The Euclidean distance is calculated to represent the similarity between a single nucleosomal or linker sequence and the ZCMM model at each position by Formula (7). is the Euclidean distance at the nth position, and , , and are calculated by Formula (3). , and are calculated by Formula (6). is the Euclidean distance vector between the mth nucleosomal or linker sequence and the ZCMM model. N and M are respectively the length and number of nucleosomal or linker sequences. Finally, two Euclidean distance matrices are calculated as a positive subset and a negative subset for nucleosomal or linker sequences.
Support vector machines (SVMs) are currently a hot topic in the machine learning community, creating a similar enthusiasm at the moment as artificial neural networks used to do before. SVMs represent a powerful technique for general (nonlinear) classification, regression and outlier detection with an intuitive model representation. SVM is a powerful and popular method for pattern recognition that has been widely used in the realm of bioinformatics. In this article, the “e1071” package was used for the implementation of SVM, which can be downloaded from https://cran.rstudio.com/web/packages/e1071/index.html. The package “e1071” offers an interface to the award-winning C++ implementation by Chang and Lin. For further implementation details on libsvm, see a practical guide to SVM classification (https://www.csie.ntu.edu.tw/~cjlin/libsvm/). The predictor obtained via the above procedures is called the ZCMM method, which is a sequence-based predictor for nucleosome positioning, integrating the Z-curve theory and position weight matrix. Further, ZCMM can distinguish between nucleosomal and linker sequences by training and testing the positive distance matrix and negative distance matrix. The prediction method ZCMM is based on two parameters, namely gamma and cost in the R package “e1071”. Therefore, we searched for the optimal values of the two parameters, ensuring better results for predicting the nucleosome sequences.
2.4. A Set of Metrics for Quantitative Analysis
In the statistical prediction model, a fundamental task is the partition of provided data into training and testing subsets. In the literature, the cross-validation test is extensively applied for evaluating the quality and effectiveness of the developed model. Here, 10-fold cross-validation is applied, in which the data are divided into 10-fold, where nine parts used for the training process and the remaining is utilized for the testing process. The same process is repeated 10 times. Finally, the outcome is yielded on the basis of the average. The metrics for measuring the prediction performance are mathematically expressed by Formula (8):
where is the total number of positive samples or nucleosomal sequences investigated, while is the number of nucleosomal sequences incorrectly predicted to be linker sequences. is the total number of negative samples or linker sequences investigated, while is the number of linker sequences incorrectly predicted to be nucleosomal sequences [50]. Formula (8) is widely utilized to compute the prediction of classifiers. Here, there are four parameters [39], including the sensitivity (Sn), specificity (Sp), total accuracy (Acc), and Matthew correlation coefficient (MCC). These four metrics are generally used in statistical prediction to quantitatively measure the performance of a predictor from four different angles. In some statistical analyses, Sn is also called the “true positive rate” and (1 − Sp) the “false positive rate”. The area under the receiver operating characteristic curve (auROC or AUC) was also calculated to evaluate the classification effectiveness of the ZCMM method.
3. Results
3.1. ZCMM Model Construction and Statistical Analysis
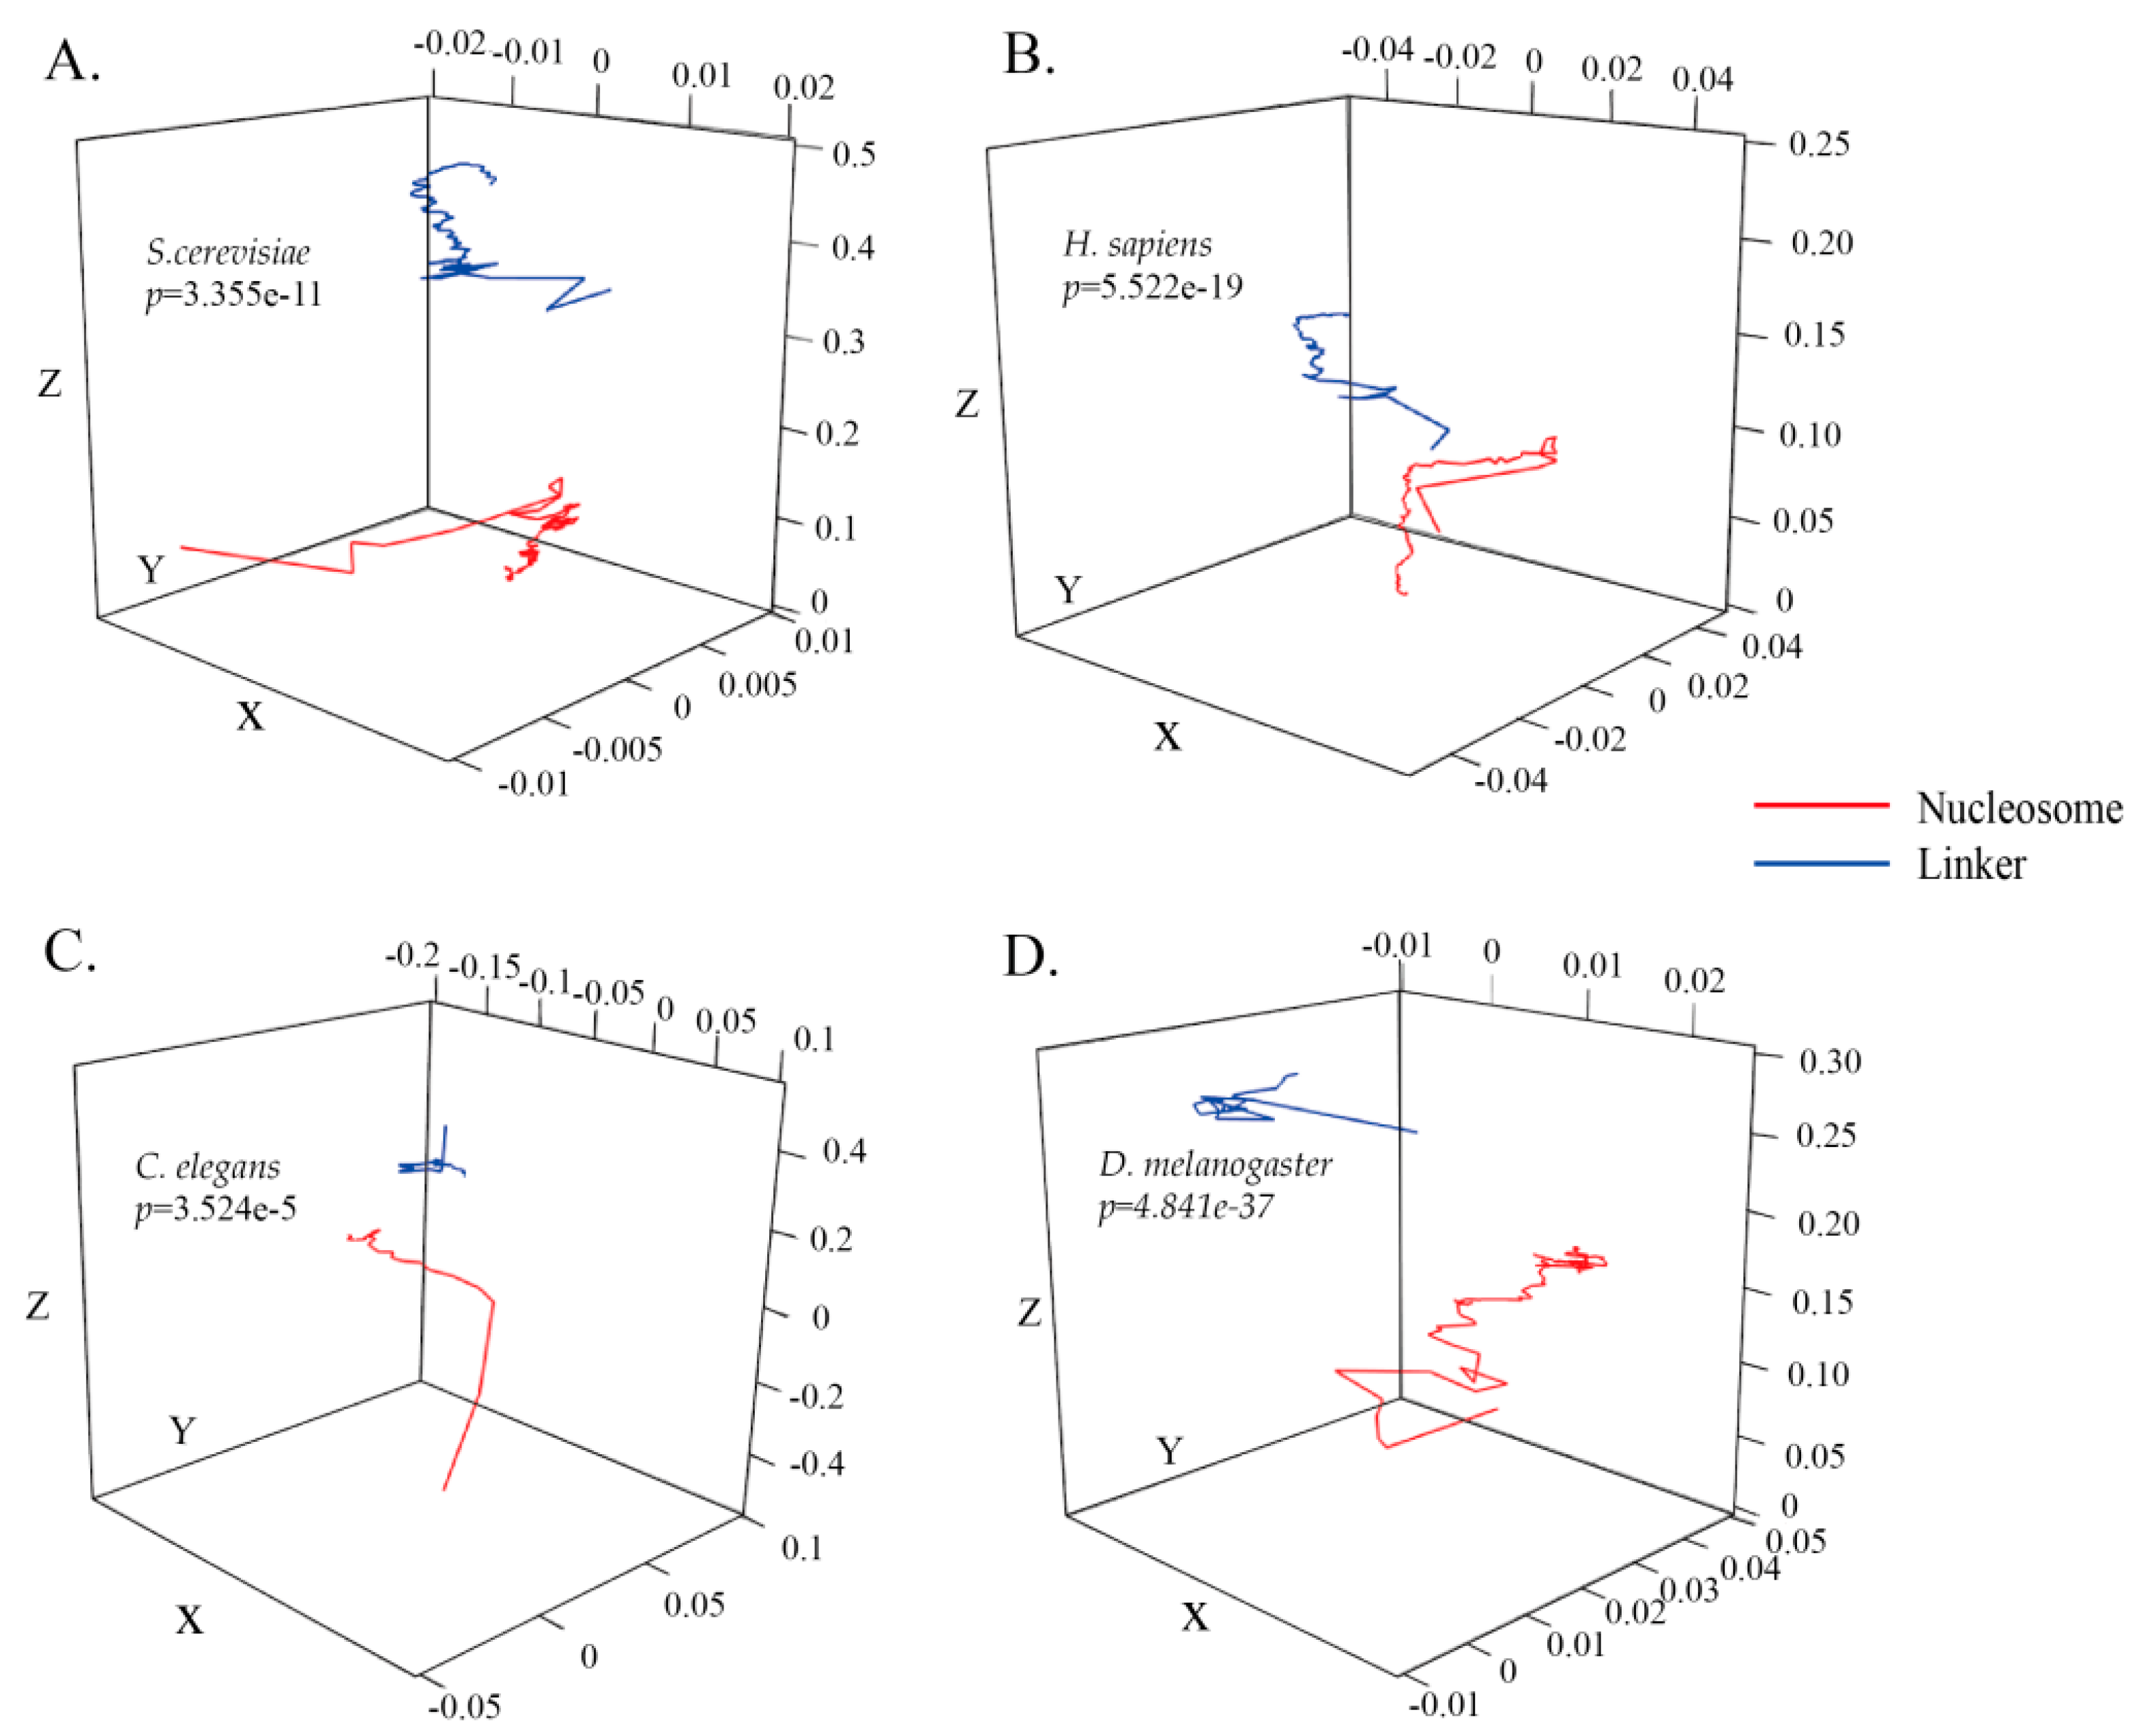
Nucleosomal sequences as the positive subset and linker sequences as the negative subset in S. cerevisiae were used to construct the ZCMM models. Image projection of the two ZCMM models along the X, Y, and Z axes was drawn by R software, and the difference between the two imaging projections was examined by the Wilcoxon rank-sum test in Figure 1A and supplementary Figure S1A–C. From the perspective of the coordinate distribution range, the x and y coordinate distribution range is small (<0.01) in Figure 1A (supplementary Figure S1A,B), while the z coordinate distribution range is large, ranging from 0.0 to 0.5 in Figure 1 (supplementary Figure S1C). According to the formula established by the model, it indicates that the total content of (A + G) and (C + T) as well as the total content of (A + C) and (T + G) in the nucleosomal sequences or linker sequences have a smaller difference, while the content of (A + T) and (C + G) in the nucleosomal or linker sequences has a larger difference. There are also differences between the X, Y, and Z curves in Figure 1A (supplementary Figure S1A–C). Meanwhile, from the perspective of the curve variation trend, the nucleosomal sequences and linker sequences have different variation trends along the DNA sequence in the coordinate system. In particular, it was found that the p-value for the global 3D curve images at 150 corresponding positions between the nucleosomal dataset and linker dataset for S. cerevisiae was less than 0.01 (p-value as shown in Figure 1A). The 3D images of H. sapiens, C. elegans, and D. melanogaster are respectively shown in Figure 1B–D, respectively. The p-values for these three species, determined by the Wilcoxon rank-sum test, were less than 0.01 (p-values were shown in Figure 1B–D). The results of these three species were similar to those found for S. cerevisiae. The ZCMM model could reflect the characteristics of nucleosomal sequences and linker sequences, and could distinguish between the two categories significantly in four species. This is beneficial for the further improvement of the efficiency of the classifier.
Furthermore, we randomly selected a nucleosomal sequence and a linker sequence to be converted into a Z-curve to analyze the differences between the two. The p-values of the global 3D curves including the three dimensions of x, y, and z were less than 0.01 (all p-values were shown in supplementary Figure S2). Therefore, it was significantly different between nucleosomal and linker sequence models, and the constructed model ZCMM reflected the characteristic differences between nucleosomes and linkages in statistics.
3.2. ZCMM Model Compared with Z-Curve Model and PWM Model
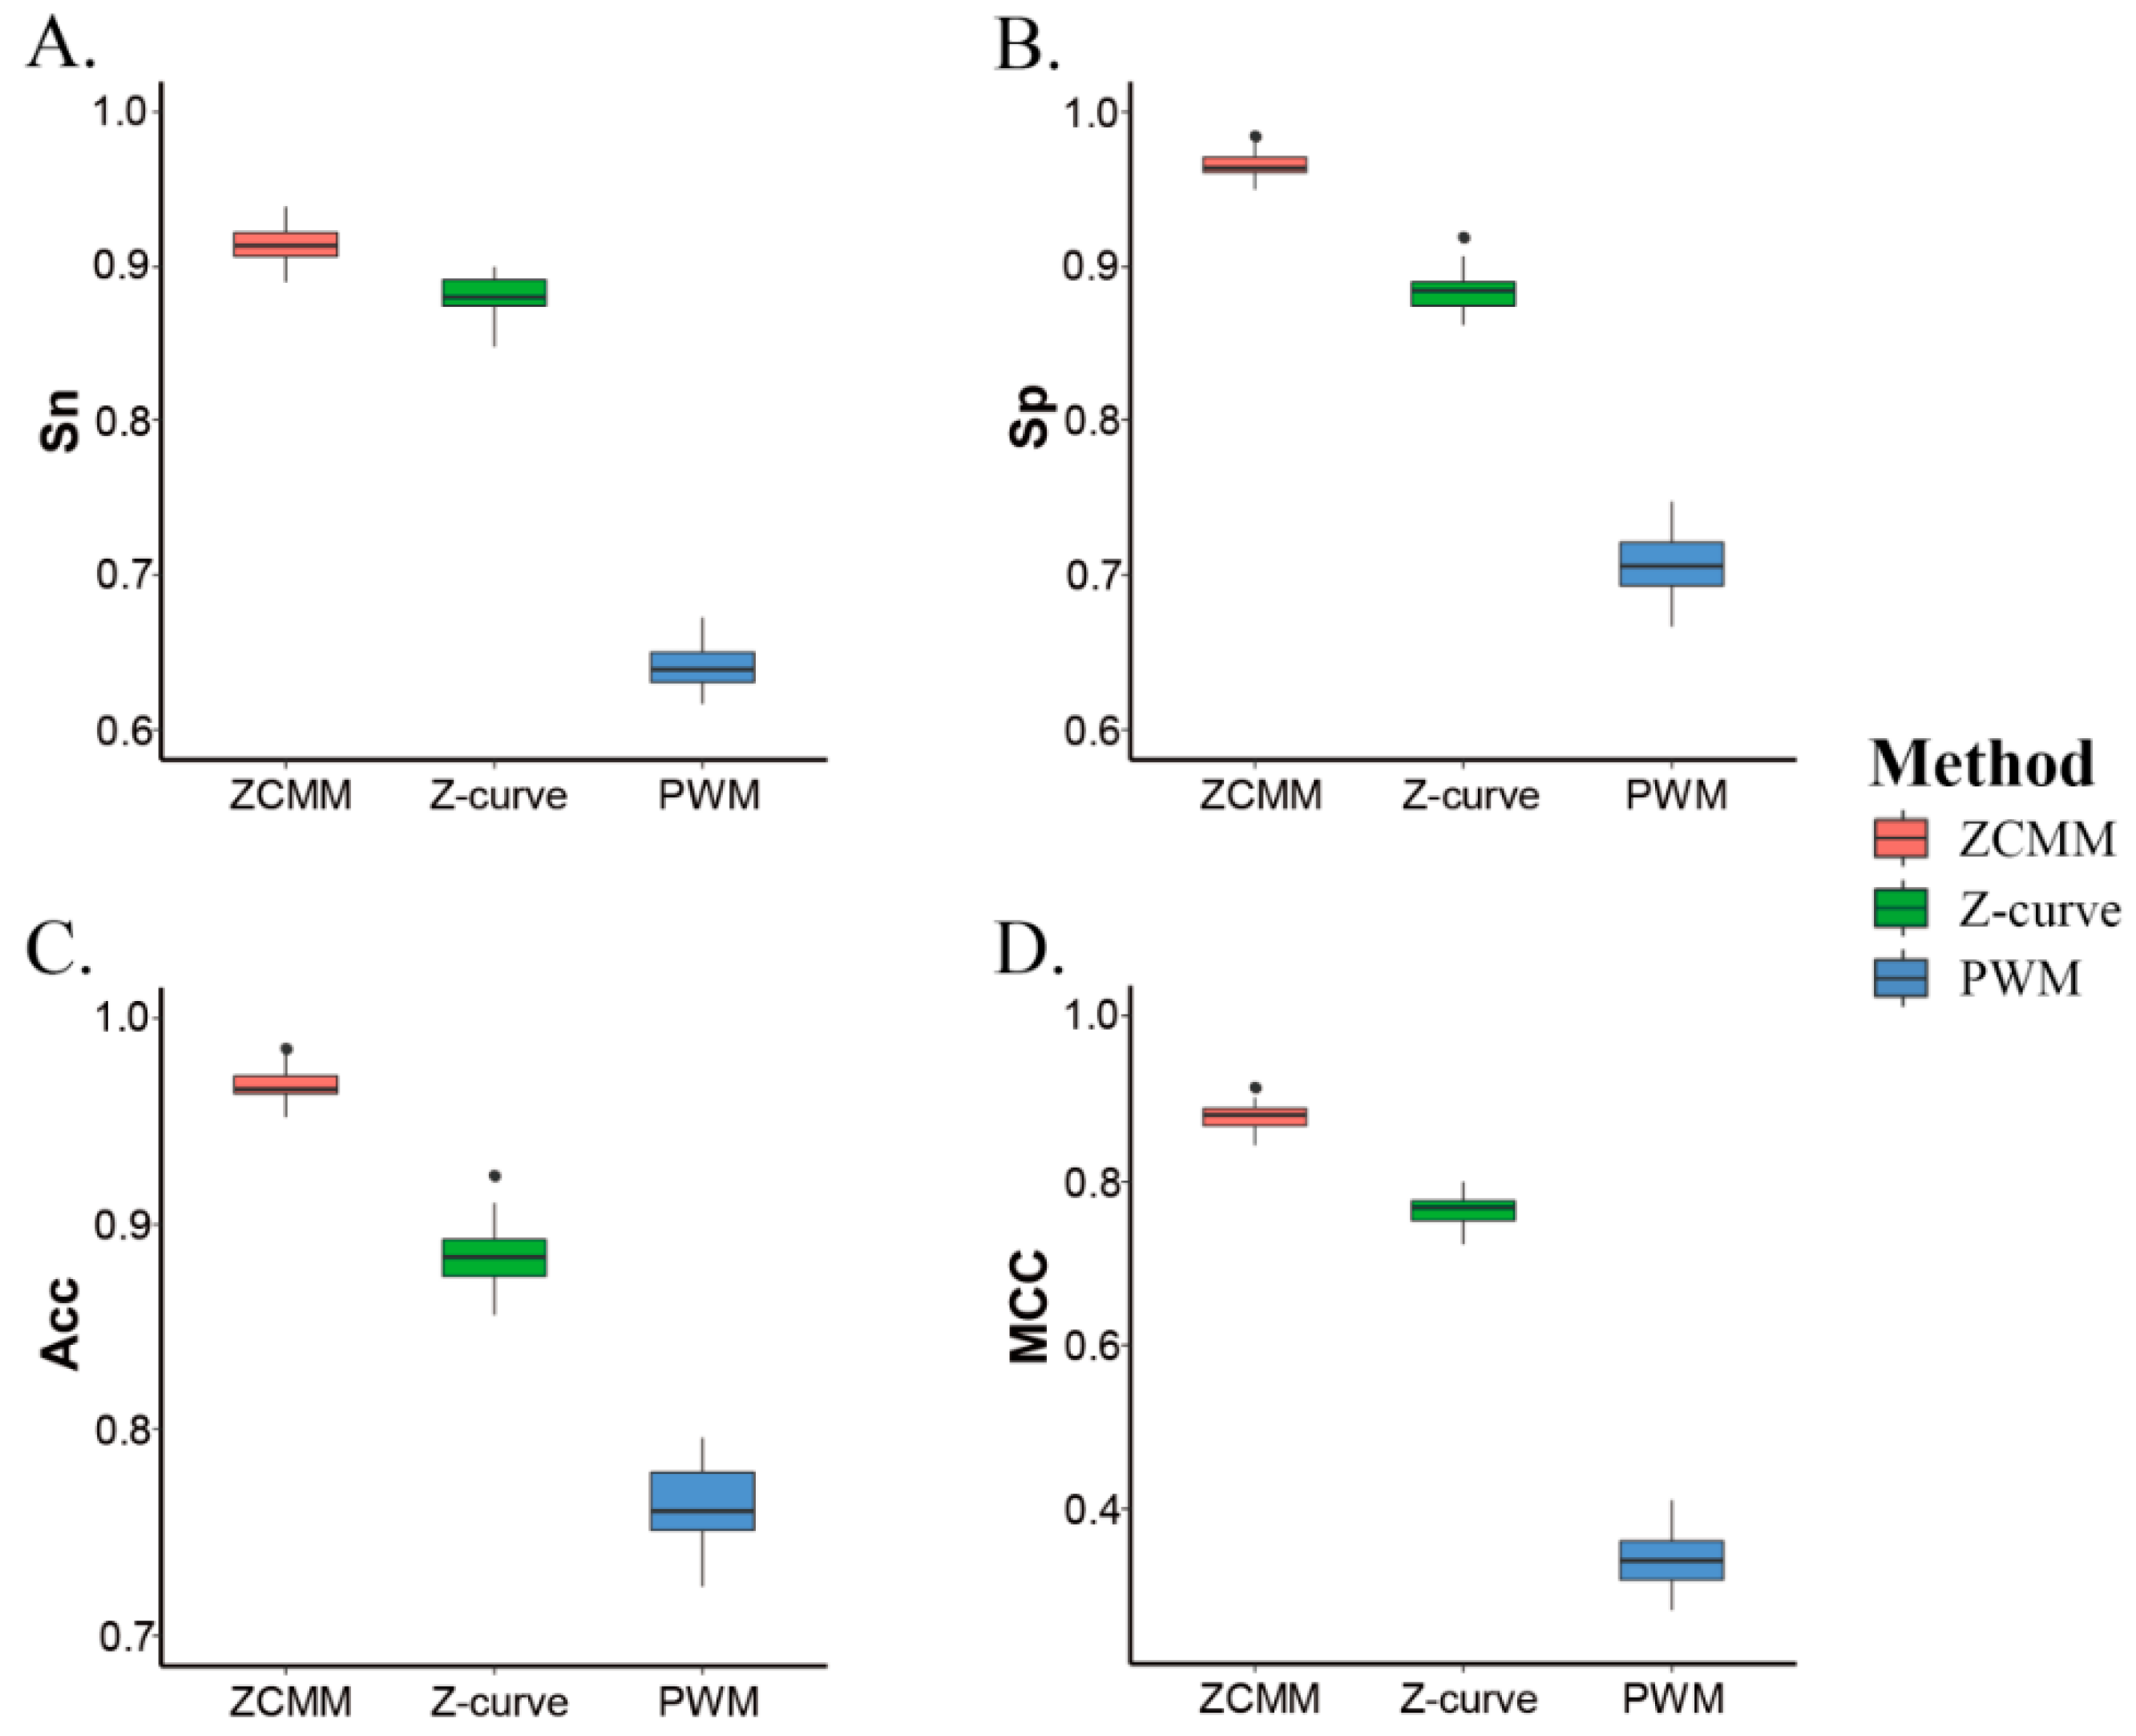
In order to better analyze model performances, we compared the ZCMM model with the Z-curve model and the position weight matrix (PWM) model for predicting nucleosomal sequences by the SVM method (10-fold cross-validation) in S. cerevisiae (). Experimental results are shown in Table 1. Values for the four parameters (Sn, Sp, Acc, and MCC) of the ZCMM model were respectively 91.40%, 96.56%, 96.75%, and 0.88, which were higher than the results of the Z-curve model and PWM model. All results of the 10-fold cross-validation are shown in Figure 2. The results show that ZCMM, obtained by integrating the Z-curve and PWM models, is superior to both the Z-curve and PWM model alone in terms of the Sn, Sp, ACC, and MCC. More complete nucleosomal sequence information or linker sequence information can be obtained by considering the two factors in ZCMM. This provided a guarantee for the predicting nucleosomal sequences by ZCMM.
3.3. ZCMM Prediction Results in Different Species
We applied ZCMM to predict nucleosomal sequences for multiple species, i.e., S. cerevisiae, H. sapiens, C. elegans, and D. melanogaster, which used the datasets , SH, SC, and SD with 10-fold cross validation. Experimental results are shown in Table 2.
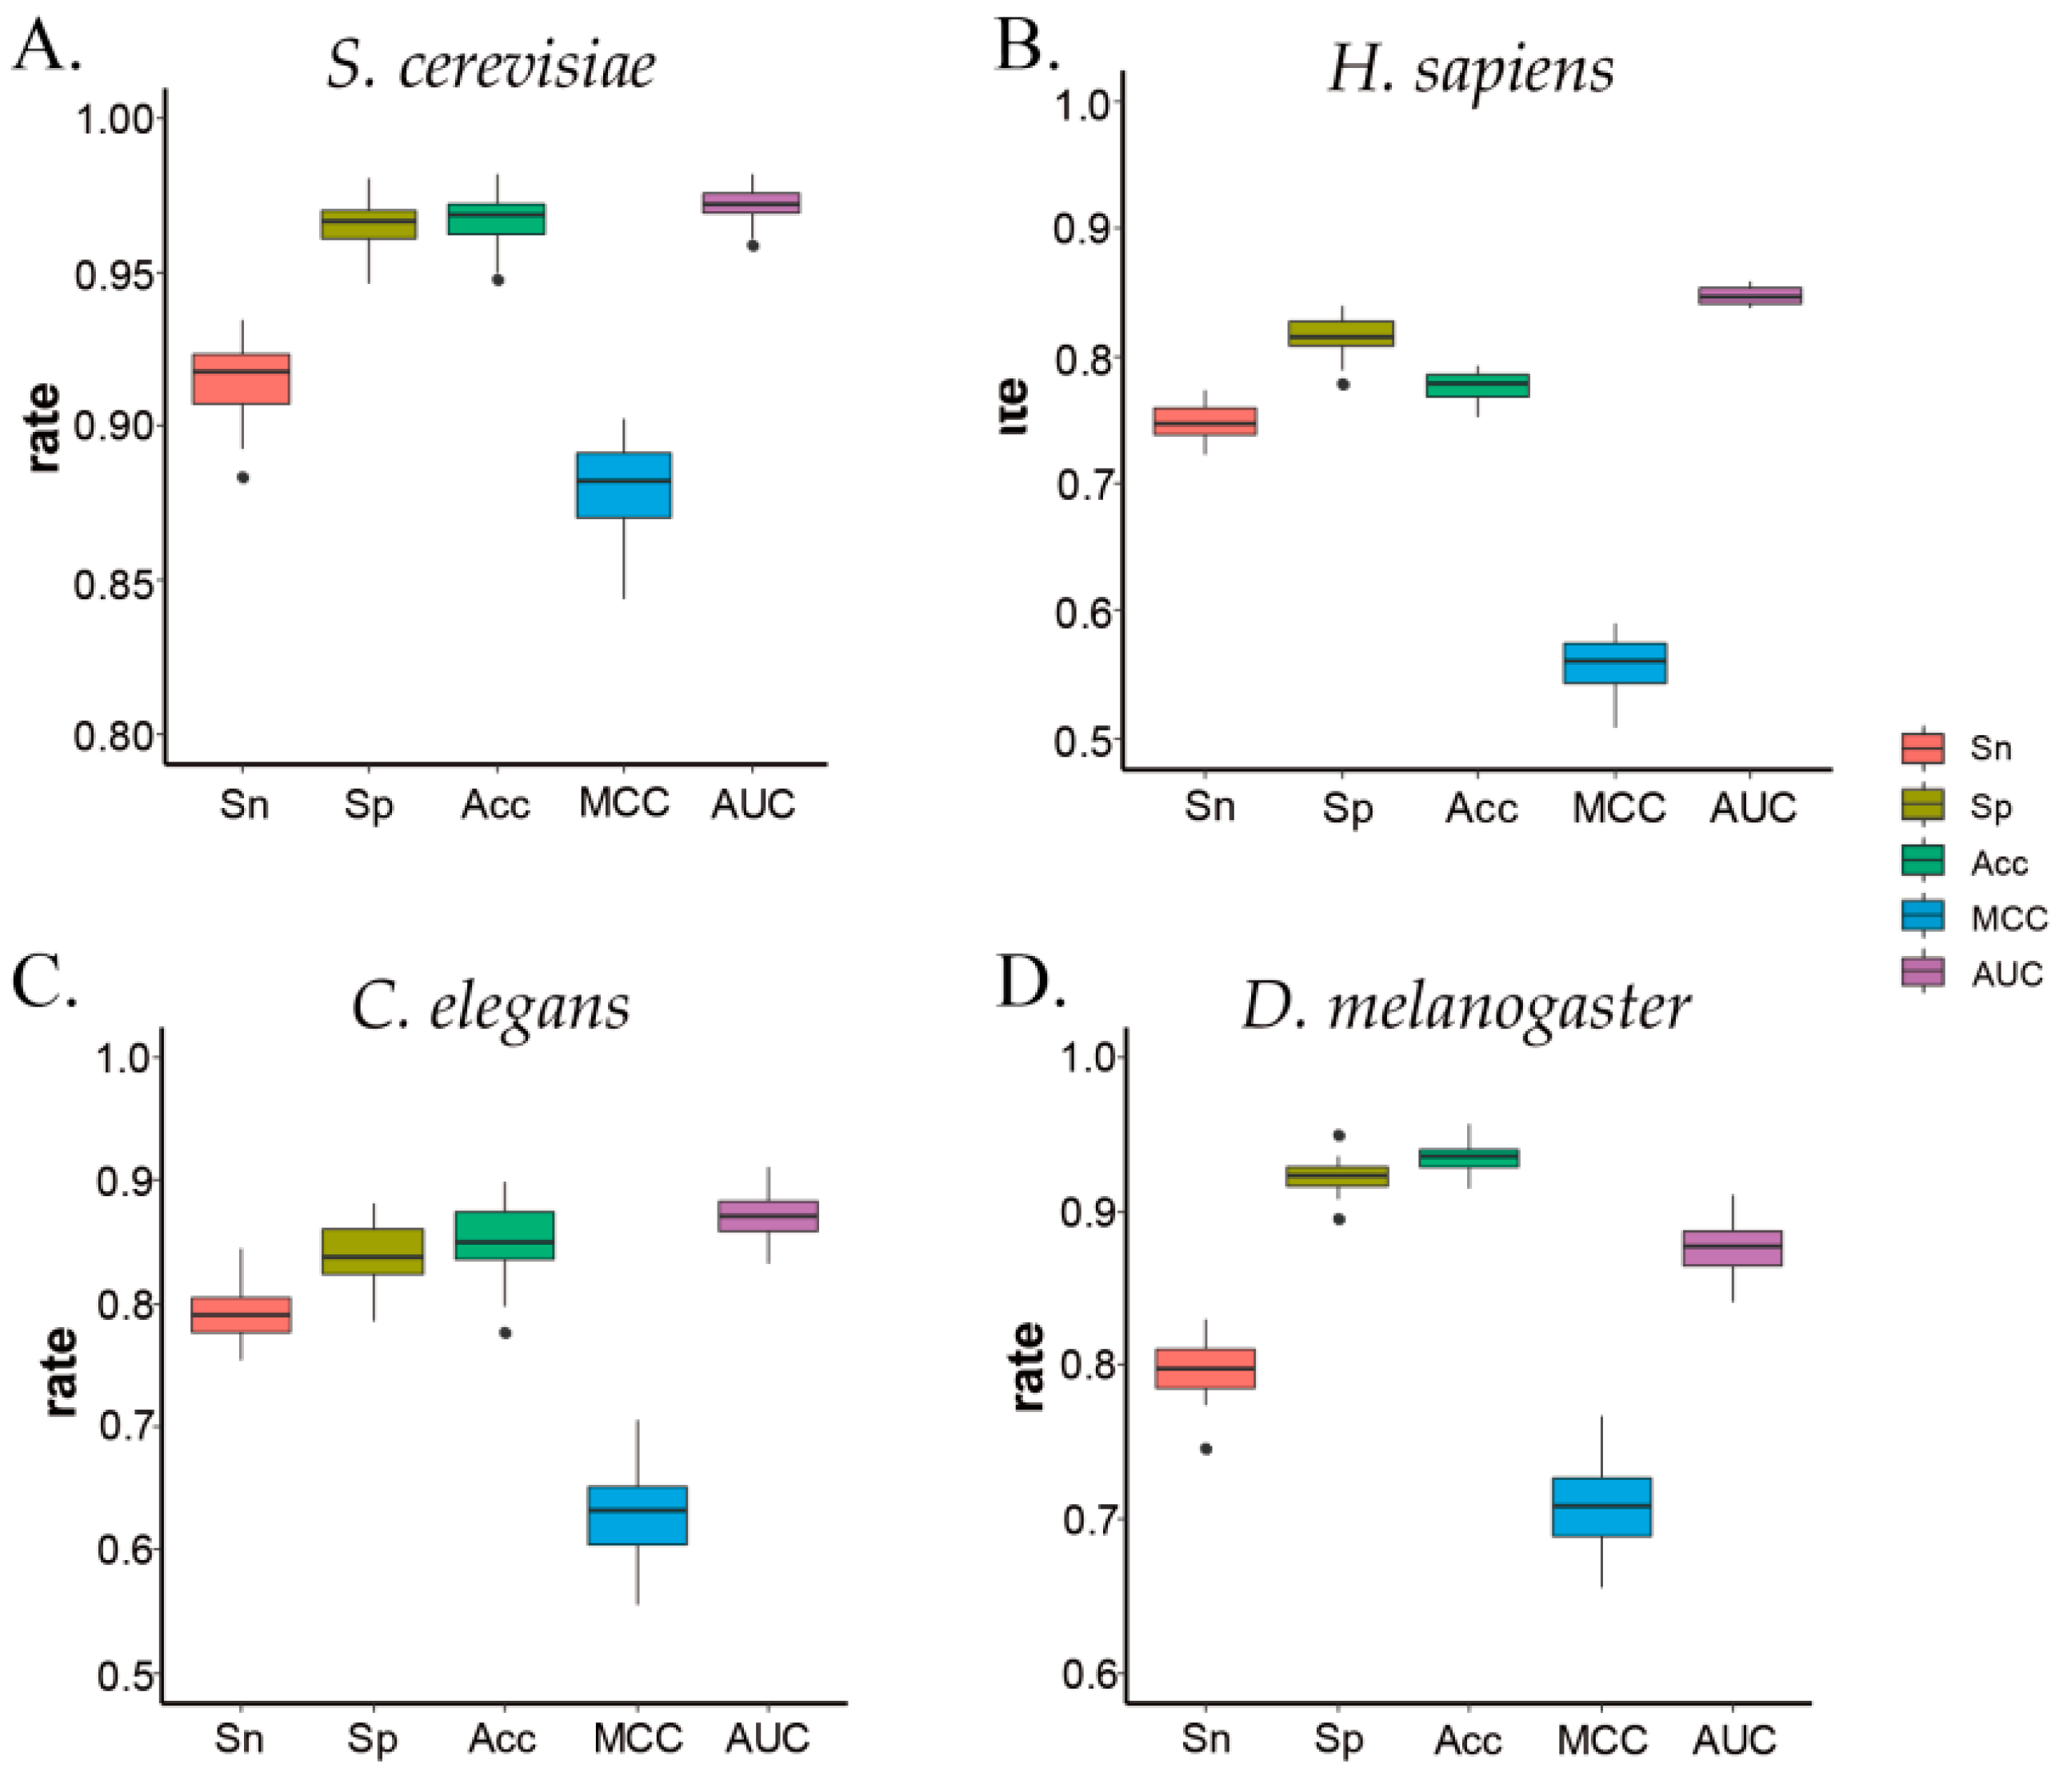
In the S. cerevisiae genome, the Sn, Sp, Acc, MCC and average AUC were 91.40%, 96.56%, 96.75%, 0.88, and 0.972. In H. sapiens, the Sn was 74.87%, the average AUC was 0.851, and the Acc and MCC values were less than 0.8. This may be related to both the strong dynamics of the human whole-genome nucleosome and the small dataset of human nucleosome sequences in our study. In C. elegans, the Sp, Acc, and average AUC were respectively 84.10%, 85.34%, and 0.872, while the Sn and MCC were less than 80% and 0.7. In D. melanogaster, the Sp, Acc and average AUC were respectively 92.26%, 93.62%, and 0.877; the Sn and MCC were about 80% and 0.7. The two groups of C. elegans and D. melanogaster were low, possibly because in the model training process, in order to reduce the computational time, we trained over less time and obtained relatively better parameters rather than the optimal parameters. The overall performance of ZCMM was good.
Meanwhile, to verify the performance of each prediction result, a 2D box figure was drawn for each 10-fold cross-validation in the four species. The four species and five indicators are shown in Figure 3. As a whole, the distribution of all experimental results was relatively concentrated near the average with a small fluctuation range, which means that our ZCMM method has good stability.
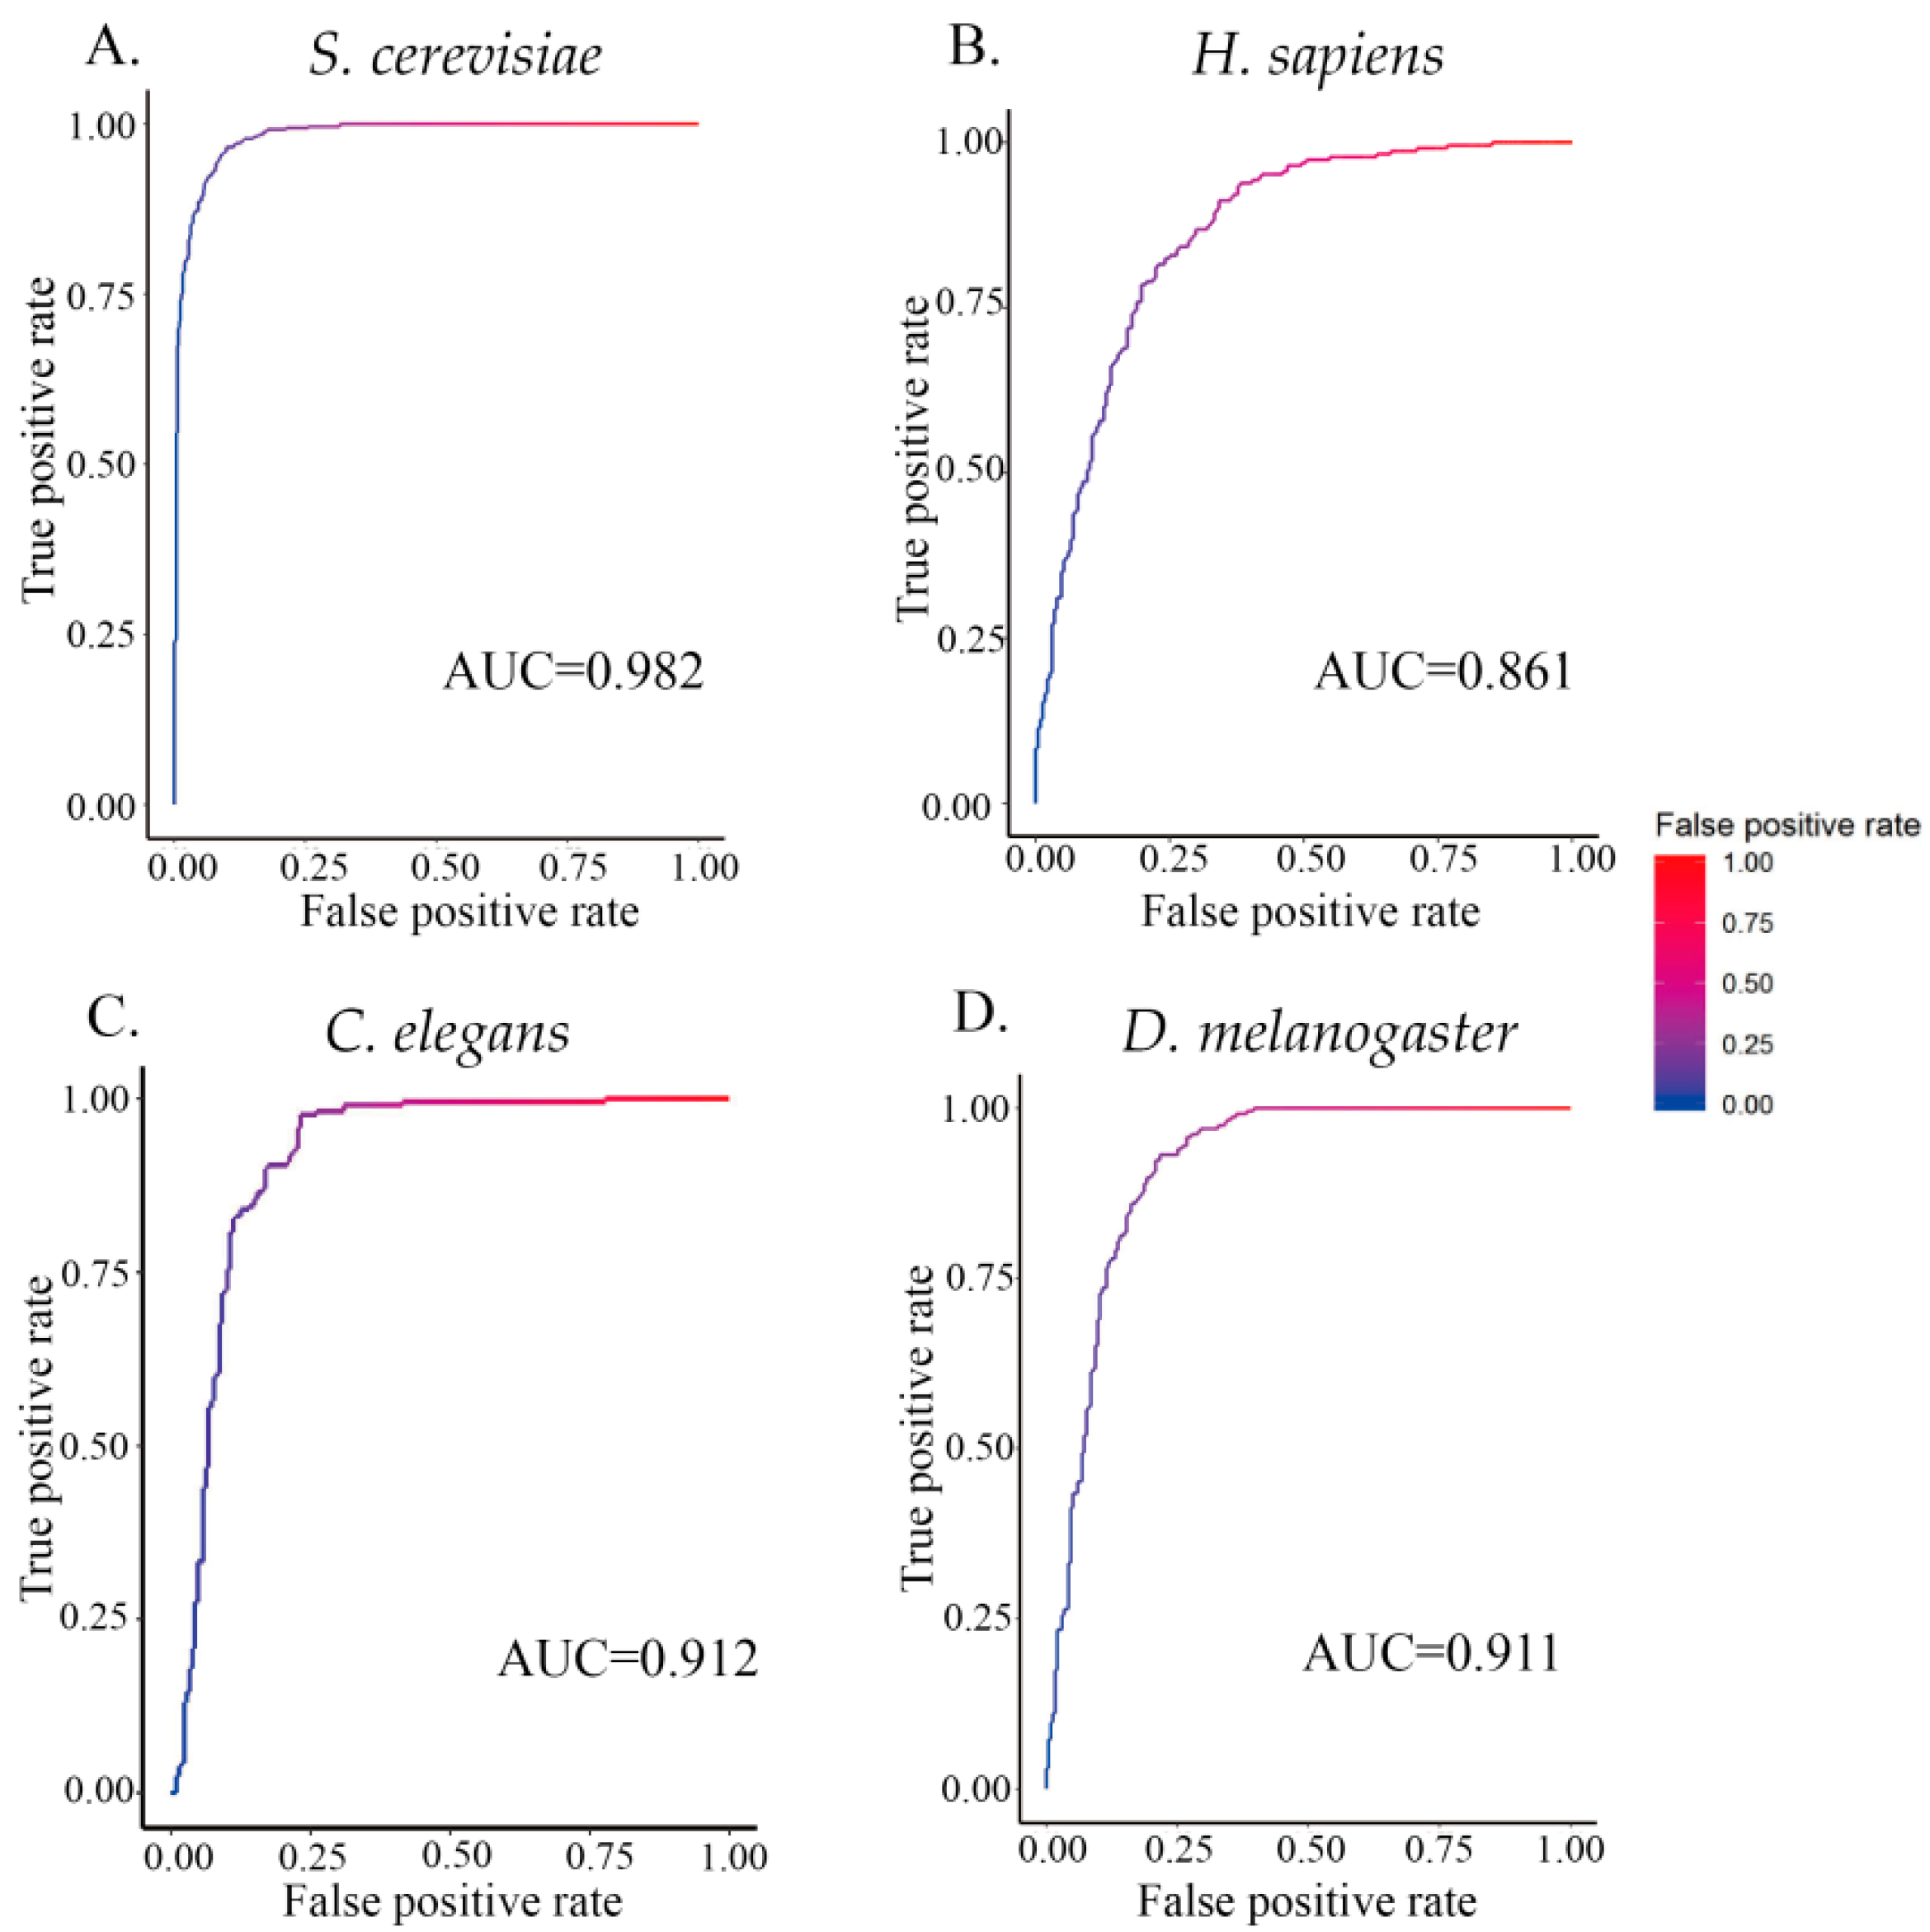
Furthermore, to provide a graphical illustration showing the performance of the classifier ZCMM, a 2D plot, called the receiver operating characteristic (ROC) curve, is given in Figure 3. In this figure, the vertical coordinate Y is for the true positive rate or Sn, while the horizontal coordinate X is the false positive rate or (1 – Sp). The AUC (area under the curve) is defined as the area under the ROC curve (auROC). This parameter is often used to indicate the performance quality of a classifier; the AUC value of 0.5 of is equivalent to random prediction, while the value of 1.0 represents a perfect prediction. The AUC values for the four species by ZCMM method are given in Figure 4, and the maximum AUC values of four species were 0.982, 0.861, 0.912, and 0.911 for S. cerevisiae, H. sapiens, C. elegans, and D. melanogaster, respectively. These results further show that our method has good classification efficiency.
3.4. Performance Compared with Other Methods
There are many methods for nucleosome prediction based on sequence features. Wu’s method, which is also based on the Z-curve theory, and iNuc-PseKNC, which is a sequence-based predictor of nucleosome positioning, were selected to be compared with our ZCMM method for three species, as shown in Table 3.
According to Wu’s algorithm ideas [51], we used R language programming to complete the experiment. The results of iNuc-PseKNC were obtained from Guo’s paper [36]. From the four performance values of Sn, Sp, Acc, and MCC, the ZCMM method in three species was shown to be generally superior to Wu’s method. For the H. sapiens genome, compared to the iNuc-PseKNC method, the Sn value obtained by ZCMM was higher, and the Sp, Acc, and MCC of ZCMM were a little lower. For the C. elegans genome, the four performance values of ZCMM were a little lower than those found by the iNuc-PseKNC method. For the D. melanogaster genome, the Sp, Acc, and MCC of ZCMM were higher than those obtained by iNuc-PseKNC. As the four indexes of the ZCMM method were almost consistently better than those obtained by Wu’s method, ZCMM was compared with the iNuc-PseKNC method in terms of the ROC curve area in Table 3. The AUC value of H. sapiens using ZCMM was 0.861, which was a little lower than that obtained by iNuc-PseKNC. The AUC value of C. elegans using ZCMM was 0.912, close to value of 0.925 obtained by iNuc-PseKNC. The AUC value of D. melanogaster, according to ZCMM, was 0.911—this was higher than the value found by iNuc-PseKNC (0.874). This result indicates that the ZCMM prediction method can be extended to more species and still maintain good accuracy after considering the position weight matrix in the Z-curve model.
3.5. Performance Validation Using Independent Data for S. cerevisiae
In order to validate the performance of the ZCMM model, we used dataset S1 (5000 nucleosomal and 5000 linker sequences) and S2 of S. cerevisiae (1740 nucleosomal and 1880 linker sequences). The results are shown in Table 4. Our ZCMM model obtained efficient outcomes—its four performance values were much higher than those obtained by Wu’s method, proving that the success rates of the ZCMM model are more efficient. Thus, the ZCMM model shows the characteristics of nucleosomal and linker sequences very well, and it was found that our ZCMM method not only achieved good classification verification, but also had strong stability.
3.6. Occupancy Profile of Predicting Nucleosomal Sequences
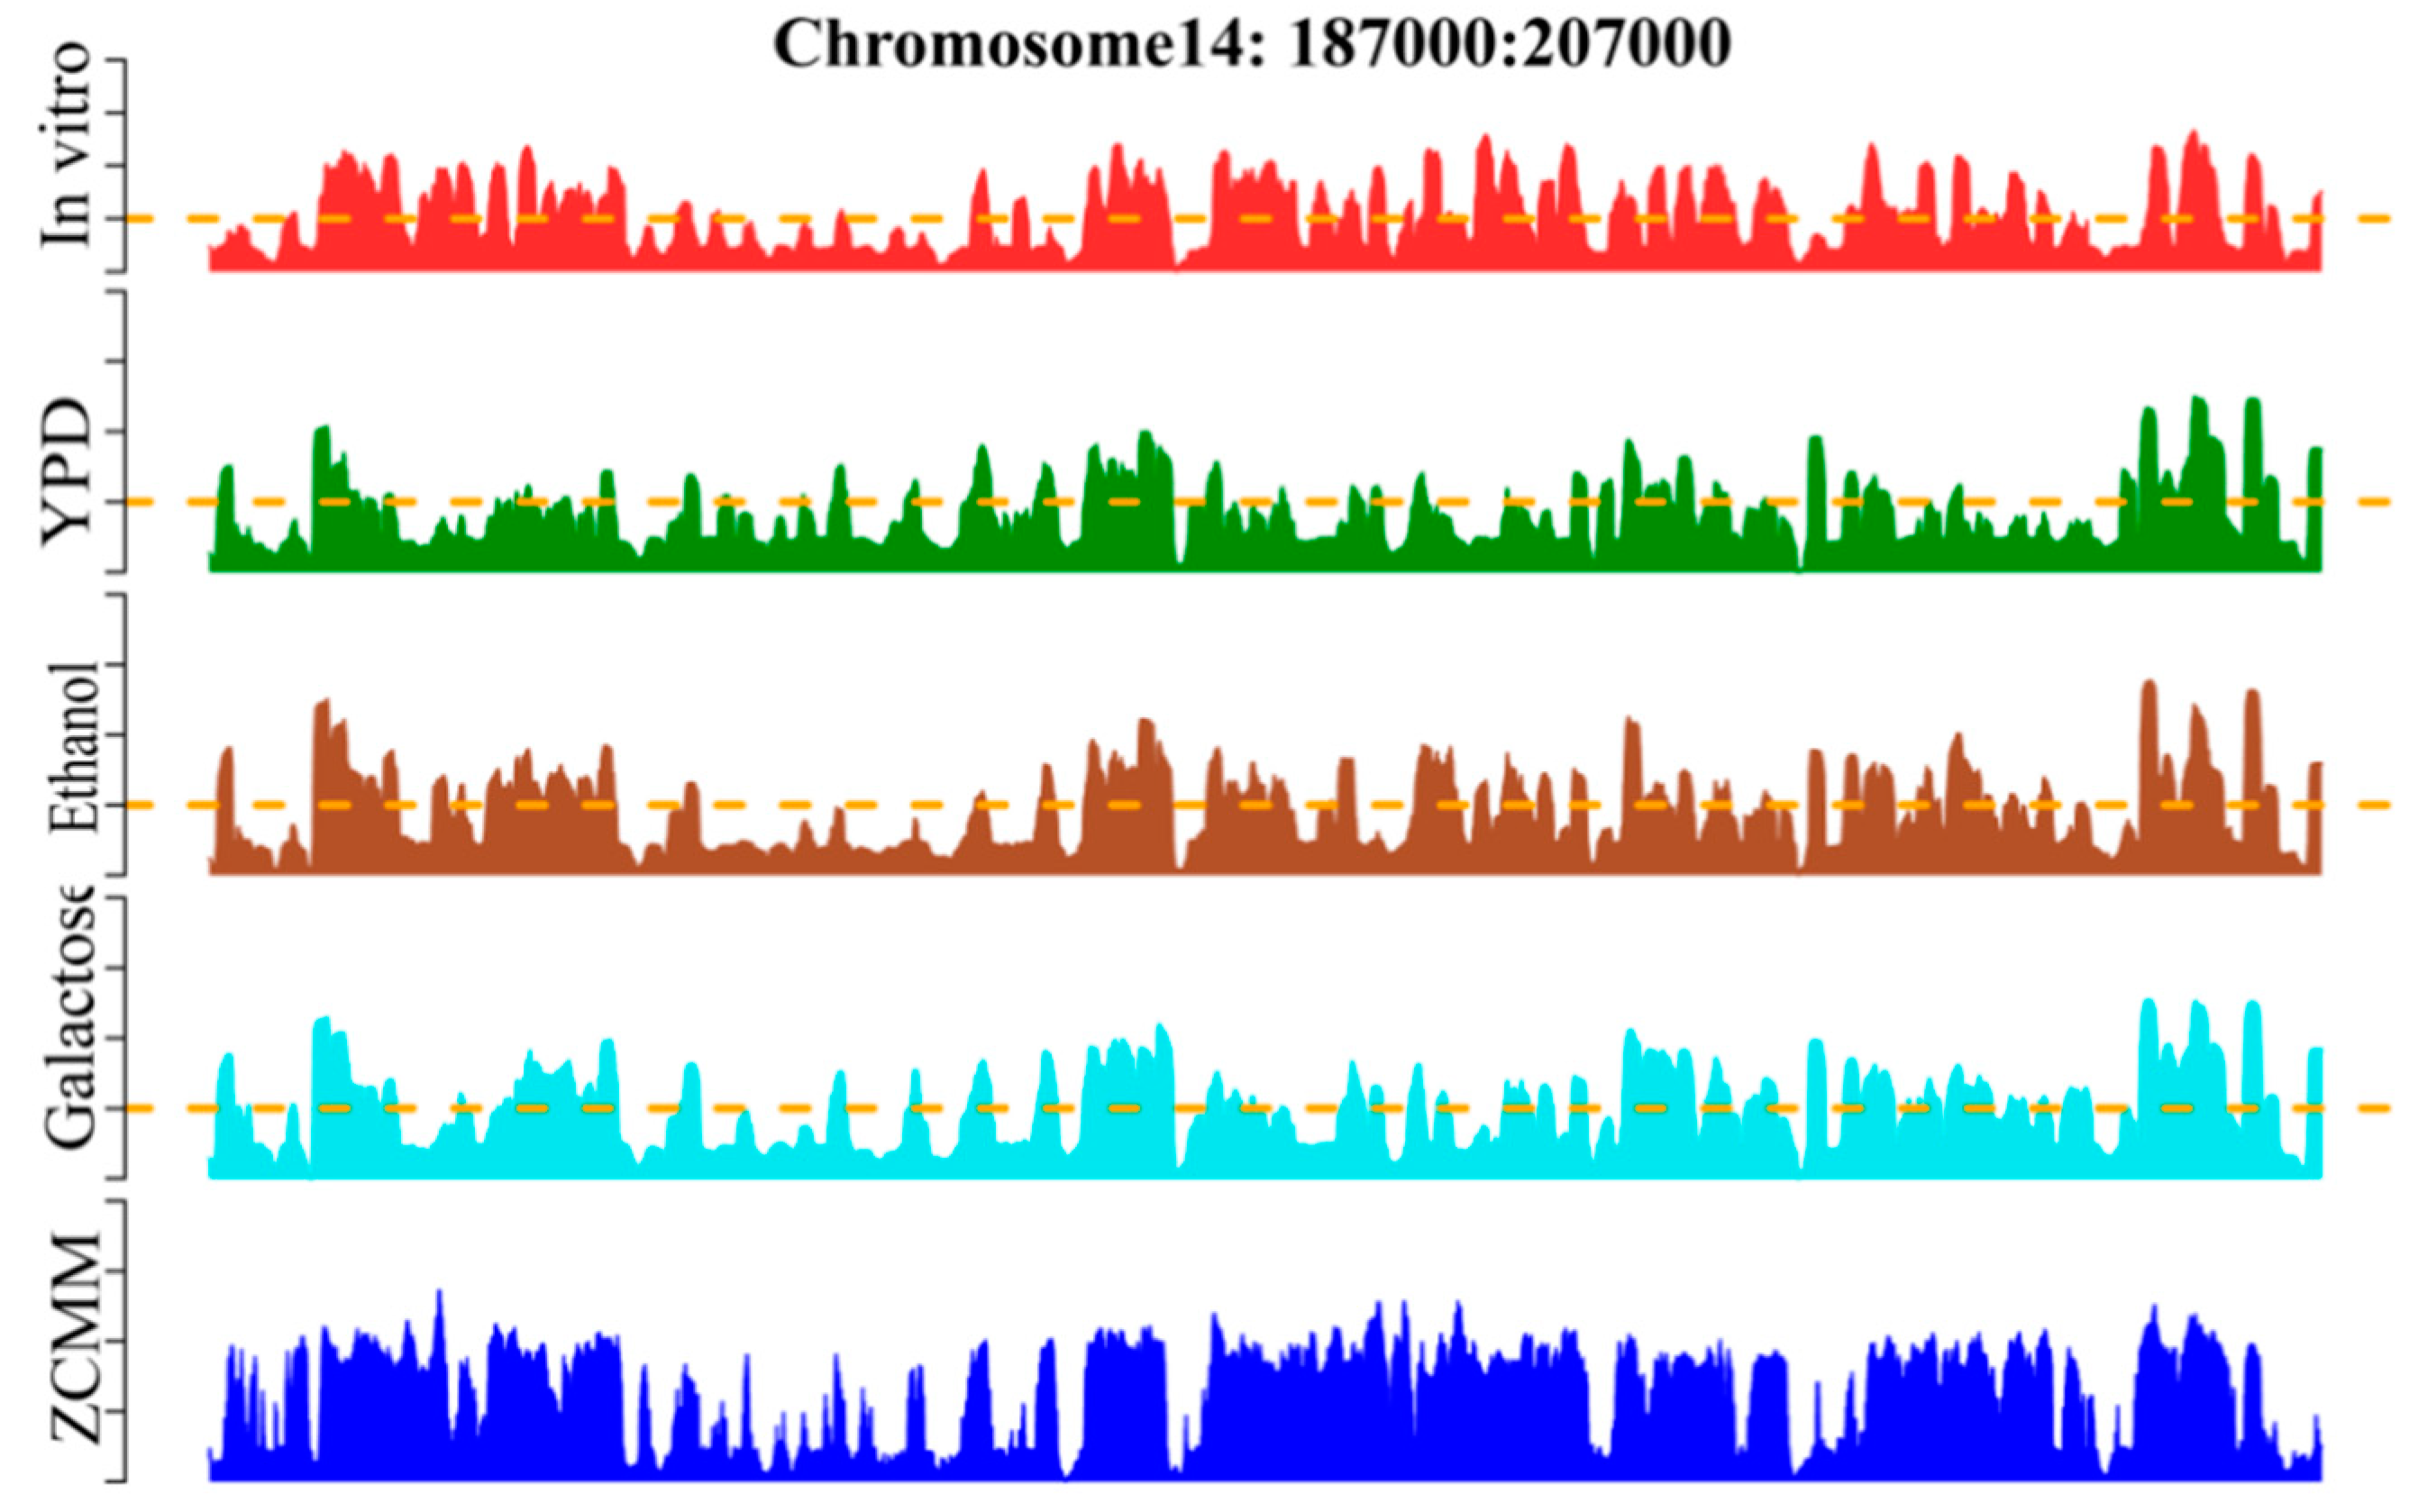
Whole-genome nucleosome prediction was performed by the sliding window method across S. cerevisiae using the ZCMM algorithm. We compared the prediction results with those of other experiments proving the nucleosome in vitro and in vivo in chromosome 14 (see Figure 5). The genomic position on the chromosome, the experimental map in vitro [52,53], and the experimental maps in vivo [2,7] for YPD, Ethanol, and Galactose are given in the figure. We found that the profile of nucleosome occupancy predicted by ZCMM was notably similar to the experimental maps of nucleosome positioning [54]. Similar peaks and valleys appeared in the graphs and their positions were very consistent, demonstrating once again that our ZCMM is indeed a very good approach for predicting nucleosome positioning.
Furthermore, we used Pearson correlation to calculate the similarity values of ZCMM prediction results and the other four experimental results, and the correlation coefficients were 0.67, 0.36, 0.57 and 0.50, respectively. This indicates that our prediction model can accurately predict the occupancy rate of nucleosomes, and may help to find the potential locations of nucleosomes in a given genome. ZCMM could be used to predict nucleosome occupancy for whole genome.
4. Discussion
In this study, the ZCMM predictor is proposed for the prediction of nucleosome positioning in genomes. In this predictor, the ZCMM model integrates the Z-curve theory and PWM to extract the features of nucleosomal and linker sequences, and the extracted feature spaces provided by ZCMM are presented by the SVM to identify nucleosome positioning for different species, namely S. cerevisiae, H. sapiens, C. elegans and D. melanogaster genomes. The experimental results show that the ZCMM method can achieve good predictive efficiency and has strong stability. The nucleosome occupancy profiles predicted by the ZCMM method are agreement with many other experimental results in the S. cerevisiae genome. Furthermore, we consider that the ZCMM method, which integrates the Z-curve and position weight matrix, can fully demonstrate the features of the sequences not only in the horizontal direction, but also in the vertical direction of the sequences. It can also better show features of nucleosomal and linker sequences. Therefore, the ZCMM was found to be useful and have good accuracy, and could be as a better novel method for the recognition and prediction of nucleosome localization. Nucleosome localization is a complex process; it still needs to be further studied, though the research on nucleosome positioning has seen some progress. Our work not only provides a new method for nucleosome positioning, but also reveals that the primary DNA sequence is an important factor of nucleosome formation. Overall, this study contributes to the comprehension of the pattern of nucleosome positioning and nucleosome occupancy in genomes.
Still, the features extracted from the nucleosome data are not comprehensive enough, so the final prediction effect is affected. In future, we will further study the localization of nucleosomes. On the one hand, we will collect much more standard datasets to conduct nucleosome classification prediction, so as to verify the effectiveness of our feature model, and ultimately improve the prediction accuracy of the model. On the other hand, we plan to consider training the model based on deep learning, and furthermore extract more updated features and improve the prediction performances. Finally, a prediction system of nucleosome location will be developed to provide a service for other researchers.
Supplementary Materials
The following are available online at https://www.mdpi.com/2073-4425/10/10/765/s1, Figure S1: Statistical test of our models of nucleosomal and linker sequences by visualization for S. cerevisiae (Wilcoxon rank-sum test), Figure S2: Statistical test between a random nucleosomal and a random linker sequence by visualization for S. cerevisiae (Wilcoxon rank-sum test).
Author Contributions
Conceptualization, Y.C.; Data curation, Z.X.; Formal analysis, J.L.; Investigation, Y.C.; Project administration, J.L.; Resources, Y.C.; Software, Z.X.; Supervision, J.L.; Visualization, Z.X.; Writing—original draft, Y.C.; Writing—review and editing, Y.C.
Funding
This work was supported by the National Nature Scientific Foundation of China (No. 61832003).
Conflicts of Interest
The authors have no conflict of interests.
References
- Richmond, T.J.; Davey, C.A. The structure of DNA in the nucleosome core. Nature 2003, 423, 145–150. [Google Scholar] [CrossRef] [PubMed]
- Segal, E.; Fondufe-Mittendorf, Y.; Chen, L.; Thåström, A.; Field, Y.; Moore, I.K.; Wang, J.P.; Widom, J. A genomic code for nucleosome positioning. Nature 2006, 442, 772–778. [Google Scholar] [CrossRef] [PubMed]
- Kornberg, R.D.; Lorch, Y. Twenty-five years of the nucleosome, fundamental particle of the eukaryote chromosome. Cell 1999, 98, 285–294. [Google Scholar] [CrossRef]
- Cai, Z.; Heydari, M.; Lin, G. Clustering Binary Oligonucleotide Fingerprint Vectors for DNA Clone Classification Analysis. J. Comb. Optim. 2005, 9, 199–211. [Google Scholar] [CrossRef]
- Taberlay, P.C.; Statham, A.L.; Kelly, T.K.; Clark, S.J.; Jones, P.A. Reconfiguration of nucleosome-depleted regions at distal regulatory elements accompanies DNA methylation of enhancers and insulators in cancer. Genome Res. 2014, 24, 1421–1432. [Google Scholar] [CrossRef] [Green Version]
- Struh, K.; Segal, E. Determinants of nucleosome positioning. Nature 2013, 20, 267–273. [Google Scholar]
- Albert, I.; Mavrich, T.N.; Tomsho, L.P.; Qi, J.; Zanton, S.J.; Schuster, S.C.; Pugh, B.F. Translational and rotational settings of H2A.Z nucleosomes across the Saccharomyces cerevisiae genome. Nature 2007, 446, 572–576. [Google Scholar] [CrossRef]
- Yuan, G.C.; Liu, J.S. Genomic sequences is highly predictive of local nucleosome depletion. PLoS Comput. Biol. 2008, 29, 1081–1088. [Google Scholar] [CrossRef]
- González, S.; García, A.; Vázquez, E.; Serrano, R.; Sánchez, M.; Quintales, L.; Antequera, F. Nucleosomal signatures impose nucleosome positioning in coding and noncoding sequences in the genome. Genome Res. 2016, 26, 1532–1543. [Google Scholar] [CrossRef] [Green Version]
- Buckwalter, J.M.; Norouzi, D.; Harutyunyan, A.; Zhurkin, V.B.; Grigoryev, S.A. Regulation of chromatin folding by conformational variations of nucleosome linker DNA. Nucleic Acids Res. 2017, 45, 9372–9387. [Google Scholar] [CrossRef]
- Farman, F.U.; Iqbal, M.; Azam, M.; Saeed, M. Nucleosomes positioning around transcriptional start site of tumor suppressor (Rbl2/p130) gene in breast cancer. Mol. Biol. Rep. 2018, 45, 1–10. [Google Scholar] [CrossRef] [PubMed]
- Murugan, R. Theory of site-specific DNA-protein interactions in the presence of nucleosome roadblocks. Biophys. J. 2018, 114, 2516. [Google Scholar] [CrossRef] [PubMed]
- Nocetti, N.; Whitehouse, I. Nucleosome repositioning underlies dynamic gene expression. Genes Dev. 2016, 30, 660–672. [Google Scholar] [CrossRef] [PubMed] [Green Version]
- Lai, W.K.M.; Pugh, B.F. Understanding nucleosome dynamics and their links to gene expression and DNA replication. Nature 2017, 18, 548–562. [Google Scholar] [CrossRef] [PubMed]
- Jiang, C.; Pugh, B.F. Nucleosome positioning and gene regulation: Advances through genomics. Nat. Rev. Genet. 2009, 10, 161–172. [Google Scholar] [CrossRef] [PubMed]
- Bai, L.; Morozov, A.V. Gene regulation by nucleosome positioning. Cell 2010, 26, 476–483. [Google Scholar] [CrossRef] [PubMed]
- Eaton, M.L.; Kyriaki, G.; Sukhyun, K.; Bell, S.P.; Macalpine, D.M. Conserved nucleosome positioning defines replication origins. Genes Dev. 2010, 24, 748–753. [Google Scholar] [CrossRef] [Green Version]
- Ying, H.; Epps, J.; Williams, R.; Huttley, G. Evidence that localized variation in primate sequence divergence Arises from an influence of nucleosome placement on DNA repair. Mol. Biol. Evol. 2010, 27, 637–649. [Google Scholar] [CrossRef]
- Bevington, S.; Boyes, J. Transcription-coupled eviction of histones H2a/H2b governs V(D)J recombination. EMBO J. 2013, 32, 1381–1392. [Google Scholar] [CrossRef]
- Sabantsev, A.; Levendosky, R.F.; Zhuang, X.; Bowman, G.D.; Deindl, S. Direct observation of coordinated DNA movements on the nucleosome during chromatin remodelling. Nat. Commun. 2019, 10, 1720. [Google Scholar] [CrossRef]
- Lieleg, C.; Krietenstein, N.; Walker, M.; Korber, P. Nucleosome positioning in yeasts: Methods, maps, and mechanisms. Chromosoma. 2015, 124, 131–151. [Google Scholar] [CrossRef]
- Beh, L.Y.; Müller, M.M.; Muir, T.W.; Kaplan, N.; Landweber, L.F. DNA-guided establishment of nucleosome patterns within coding regions of a eukaryotic genome. Genome Res. 2015, 25, 1727–1738. [Google Scholar] [CrossRef] [PubMed] [Green Version]
- He, H.H.; Meyer, C.A.; Hu, S.S.; Chen, M.W.; Zang, C.; Liu, Y.; Rao, P.K.; Fei, T.; Xu, H.; Long, H.; et al. RefinedDNase-seq protocol and data analysis reveals intrinsic bias in transcription factor footprint identification. Nat. Methods 2013, 11, 73–78. [Google Scholar] [CrossRef] [PubMed]
- Zhong, J.; Luo, K.; Winter, P.S.; Crawford, G.E.; Iversen, E.S.; Hartemink, A.J. Mapping nucleosome positions using Dnase-seq. Genome Res. 2016, 26, 351–364. [Google Scholar] [CrossRef] [PubMed]
- Bauden, M.; Pamart, D.; Ansari, D.; Herzog, M.; Eccleston, M.; Micallef, J.; Andersson, B.; Andersson, R. Circulating nucleosomes as epigenetic biomarkers in pancreatic cancer. Clin. Epigenet. 2015, 7, 106. [Google Scholar] [CrossRef]
- Rodriguez, J.; Lee, L.; Lynch, B.; Tsukiyama, T. Nucleosome occupancy as a novel chromatin parameter for replication origin functions. Genome Res. 2017, 27, 269–277. [Google Scholar] [CrossRef] [PubMed]
- Wu, X.; Cai, Z.; Wan, X.F.; Hoang, T.; Goebel, R.; Lin, G. Nucleotide Composition String Selection in HIV-1 Subtyping Using Whole Genomes. Bioinformatics 2007, 23, 1744–1752. [Google Scholar] [CrossRef]
- Lin, G.; Cai, Z.; Wu, J.; Wan, X.F.; Xu, L.; Goebel, R. Identifying a Few foot-and-mouth Disease Virus Signature Nucleotide Strings for Computational Genotyping. BMC Bioinform. 2008, 9, 279. [Google Scholar] [CrossRef]
- Zhang, J.; Peng, W.; Wang, L. LeNup: Learning Nucleosome Positioning from DNA Sequences with Improved Convolutional Neural Networks. Bioinformatics 2018, 34, 1–8. [Google Scholar] [CrossRef]
- Yang, K.; Cai, Z.; Li, J.; Lin, G. A Stable Gene Selection in Microarray Data Analysis. BMC Bioinform. 2006, 7, 228. [Google Scholar]
- Cai, Z.; Xu, L.; Shi, Y.; Salavatipour, M.R.; Goebel, R.; Lin, G. Using Gene Clustering to Identify Discriminatory Genes with Higher Classification Accuracy. In Proceedings of the IEEE 6th Symposium on Bioinformatics and Bioengineering (BIBE 2006), Arlington, VA, USA, 16–18 October 2006. [Google Scholar]
- Cai, Z.; Goebel, R.; Salavatipour, M.R.; Lin, G. Selecting dissimilar genes for multi-class classification, an application in cancer subtyping. BMC Bioinform. 2007, 8, 206. [Google Scholar] [CrossRef] [PubMed]
- Cai, Z.; Sabaa, H.; Wang, Y.; Goebel, R.; Wang, Z.; Xu, J.; Stothard, P.; Lin, G. Most Parsimonious Haplotype Allele Sharing Determination. BMC Bioinform. 2009, 10, 115. [Google Scholar] [CrossRef] [PubMed]
- Allu, P.K.; Dawicki-McKenna, J.M.; VanEeuwen, T.; Slavin, M.; Braitbard, M.; Xu, C.; Kalisman, N.; Murakami, K.; Black, B.E. Structure of the Human Core Centromeric Nucleosome Complex. Curr. Biol. 2019, 29, 2625–2639. [Google Scholar] [CrossRef]
- Chereji, R.V.; Ramachandran, S.; Bryson, T.D.; Henikoff, S. Precise genome-wide mapping of single nucleosomes and linkers in Vivo. Genome Biol. 2018, 19, 1–20. [Google Scholar] [CrossRef] [PubMed]
- Guo, S.H.; Deng, E.Z.; Xu, L.Q.; Ding, H.; Lin, H.; Chen, W.; Chou, K.C. iNuc-PseKNC: A sequence-based predictor for predicting nucleosome positioning in genomes with pseudo k-tuple nucleotide composition. Bioinformatics 2014, 30, 1522–1529. [Google Scholar] [CrossRef] [PubMed]
- Teif, V.B. Nucleosome positioning: Resources and tools online. Brief. Bioinform. 2016, 17, 745–757. [Google Scholar] [CrossRef] [PubMed]
- Chen, W.; Lin, H.; Feng, P.M.; Ding, C.; Zuo, Y.C.; Chou, K.C. iNuc-PhysChem: A Sequence-Based Predictor for Identifying Nucleosomes via Physicochemical Properties. PLoS ONE 2012, 7, e47843. [Google Scholar] [CrossRef] [PubMed]
- Alharbi, B.A.; Alshammari, T.H.; Felton, N.L.; Zhurkin, V.B.; Cui, F. nuMap: A web platform for accurate prediction of nucleosome positioning. Genom. Proteom. Bioinform. 2014, 12, 249–253. [Google Scholar] [CrossRef]
- Zhang, R.; Zhang, C.T. Z curves, an intutive tool for visualizing and analyzing the DNA sequences. J. Biomol. Struct. Dyn. 1994, 11, 767–782. [Google Scholar] [CrossRef]
- Lee, W.; Tillo, D.; Bray, N.; Morse, R.H.; Davis, R.W.; Hughes, T.R.; Nislow, C. A high-resolution atlas of nucleosome occupancy in yeast. Nat. Genet. 2007, 39, 1235–1244. [Google Scholar] [CrossRef]
- Chen, W.; Feng, P.; Ding, H.; Lin, H.; Chou, K.C. Using deformation energy to analyze nucleosome positioning in genomes. Genomics 2016, 107, 69–75. [Google Scholar] [CrossRef] [PubMed]
- Schones, D.E.; Cui, K.; Cuddapah, S.; Roh, T.Y.; Barski, A.; Wang, Z.; Wei, G.; Zhao, K. Dynamic regulation of nucleosome positioning in the human genome. Cell 2008, 132, 887–898. [Google Scholar] [CrossRef] [PubMed]
- Mavrich, T.N.; Ioshikhes, I.P.; Venters, B.J.; Jiang, C.; Tomsho, L.P.; Qi, J.; Schuster, S.C.; Albert, I.; Pugh, B.F. A barrier nucleosome model for statistical positioning of nucleosomes throughout the yeast genome. Genome Res. 2008, 18, 1073–1083. [Google Scholar] [CrossRef] [PubMed] [Green Version]
- Mavrich, T.N.; Jiang, C.; Ioshikhes, I.P.; Li, X.; Venters, B.J.; Zanton, S.J.; Tomsho, L.P.; Qi, J.; Glaser, R.L.; Schuster, S.C.; et al. Nucleosome organization in the Drosophila genome. Nature 2008, 453, 358–362. [Google Scholar] [CrossRef] [PubMed]
- Tahir, M.; Hayat, M. iNuc-STNC: A sequence-based predictor for identification of nucleosome positioning in genomes by extending the concept of SAAC and Chou’s PseAAC. Mol. BioSyst. 2016, 12, 2587–2593. [Google Scholar] [CrossRef] [PubMed]
- Fu, L.; Niu, B.; Zhu, Z.; Wu, S.; Li, W. CD-HIT: Accelerated for clustering the next-generation sequencing data. Bioinformatics 2012, 28, 3150–3152. [Google Scholar] [CrossRef] [PubMed]
- Zhao, X.; Pei, Z.; Liu, J.; Qin, S.; Cai, L. Prediction of nucleosome DNA formation potential and nucleosome positioning using increment of diversity combined with quadratic discriminant analysis. Chromosome Res. 2010, 18, 777–785. [Google Scholar] [CrossRef] [PubMed]
- Zhang, R.; Zhang, C.T. A Brief Review: The Z-curve Theory and its Application in Genome Analysis. Curr. Genom. 2014, 15, 78–94. [Google Scholar] [CrossRef] [PubMed] [Green Version]
- Xing, Y.Q.; Liu, G.Q.; Zhao, X.J.; Cai, L. An analysis and prediction of nucleosome positioning based on information content. Chromosome Res. 2013, 21, 63–74. [Google Scholar] [CrossRef]
- Wu, X.; Liu, H.; Liu, H.; Su, J.; Lv, J.; Cui, Y.; Wang, F.; Zhang, Y. Z curve theory-based analysis of the dynamic nature of nucleosome positioning in Saccharomyces cerevisiae. Gene 2013, 530, 8–18. [Google Scholar] [CrossRef] [PubMed]
- Yuan, G.C.; Liu, Y.J.; Dion, M.F.; Slack, M.D.; Wu, L.F.; Altschuler, S.J.; Rando, O.J. Genome-scale identification of nucleosome positions in S. cerevisiae. Science 2005, 309, 626–630. [Google Scholar] [CrossRef] [PubMed]
- Ioshikhes, I.; Bolshoy, A.; Derenshteyn, K.; Borodovsky, M.; Trifonov, E.N. Nucleosome DNA sequence pattern revealed by multiple alignment of experimentally mapped sequences. J. Mol. Biol. 1996, 262, 129–139. [Google Scholar] [CrossRef] [PubMed]
- Kaplan, N.; Moore, I.K.; Fondufe-Mittendorf, Y.; Gossett, A.J.; Tillo, D.; Field, Y.; LeProust, E.M.; Hughes, T.R.; Lieb, J.D.; Widom, J.; et al. The DNA-encoded nucleosome organization of a eukaryotic genome. Nature 2009, 458, 362–366. [Google Scholar] [CrossRef] [PubMed]
Figure 1.
Three-dimensional space imaging of nucleosomal and linker sequences using our model for four species. (A–D) represent Saccharomyces cerevisiae (S. cerevisiae), Homo sapiens (H. sapiens), Caenorhabditis elegans (C. elegans) and Drosophila melanogaster (D. melanogaster), respectively. The red curve represents the nucleosomal sequence model and the blue curve represents the linker sequence model.

Figure 2.
Comparison of four performances of three models for prediction results by 10-fold cross validation of support vector machine (SVM). (A–D) represent Sn, Sp, Acc, and MCC, respectively.
Figure 2.
Comparison of four performances of three models for prediction results by 10-fold cross validation of support vector machine (SVM). (A–D) represent Sn, Sp, Acc, and MCC, respectively.

Figure 3.
The metrics of prediction by 10-fold cross-validation. (A–D) represent the results for S. cerevisiae, H. sapiens, C. elegans, and D. melanogaster, respectively.
Figure 3.
The metrics of prediction by 10-fold cross-validation. (A–D) represent the results for S. cerevisiae, H. sapiens, C. elegans, and D. melanogaster, respectively.

Figure 4.
AUC obtained from 10-fold cross-validation. (A–D) represent the maximum AUC or areas under the ROC curve (0.982, 0.861, 0.912, and 0.911) for S. cerevisiae, H. sapiens, C. elegans, and D. melanogaster, respectively.
Figure 4.
AUC obtained from 10-fold cross-validation. (A–D) represent the maximum AUC or areas under the ROC curve (0.982, 0.861, 0.912, and 0.911) for S. cerevisiae, H. sapiens, C. elegans, and D. melanogaster, respectively.

Figure 5.
Illustration to show the nucleosome occupancy profile predicted by the ZCMM model on S. cerevisiae chromosome 14 (187000:207000). To facilitate the comparison, the corresponding profiles by experiments are also shown. In a top–down order, they are the genomic position on the chromosome, the experimental map in vitro, and the experimental maps in vivo for YPD, Ethanol, and Galactose, respectively. Depicted in the lowest panel is the nucleosome occupancy profile determined by the proposed ZCMM.


Table 1.
10-fold cross-validation of different methods.
| Species | Sn% | Sp% | Acc% | MCC |
|---|---|---|---|---|
| ZCMM | 91.40 | 96.56 | 96.75 | 0.88 |
| Z-curve | 88.15 | 88.40 | 88.42 | 0.77 |
| PWM | 63.97 | 70.67 | 76.32 | 0.34 |
Sn: sensitivity, Sp: specificity, Acc: total accuracy, MCC: Matthew correlation coefficient (MCC). ZCMM: our model Z-curve theory-based and position weight matrix, Z-curve: model based on Z-curve theory, PWM: model based on position weight matrix.
Table 2.
Prediction results of 10-fold cross-validation for four species by ZCMM
| Species | Sn% | Sp% | Acc% | MCC | AUC |
|---|---|---|---|---|---|
| S. cerevisiae (S1) | 91.40 | 96.56 | 96.75 | 0.88 | 0.972 |
| H. sapiens | 74.87 | 81.51 | 77.72 | 0.56 | 0.851 |
| C. elegans | 78.80 | 84.10 | 85.34 | 0.62 | 0.872 |
| D. melanogaster | 79.64 | 92.26 | 93.62 | 0.70 | 0.877 |
AUC: Area under the receiver operating characteristic curve.
Table 3.
Performance compared with other methods.
| Species | Method | Sn% | Sp% | Acc% | MCC | AUC |
|---|---|---|---|---|---|---|
| H. sapiens | ZCMM | 74.87 | 81.51 | 77.72 | 0.56 | 0.861 |
| Wu’s method | 65.82 | 64.12 | 64.74 | 0.30 | ||
| iNuc-PseKNC | 86.27 | 87.86 | 84.70 | 0.73 | 0.925 | |
| C. elegans | ZCMM | 78.80 | 84.10 | 85.34 | 0.62 | 0.912 |
| Wu’s method | 89.90 | 71.64 | 76.05 | 0.62 | ||
| iNuc-PseKNC | 86.90 | 90.30 | 83.55 | 0.74 | 0.935 | |
| D. melanogaster | ZCMM | 79.64 | 92.26 | 93.62 | 0.70 | 0.911 |
| Wu’s method | 79.17 | 41.07 | 57.34 | 0.22 | ||
| iNuc-PseKNC | 79.97 | 78.31 | 81.65 | 0.60 | 0.874 |
AUC values of the three species by ZCMM are the maximum of 10-fold cross -validation.
Table 4.
ZCMM compared with Wu’s method in two datasets of S. cerevisiae.
| Dataset | Method | Sn% | Sp% | Acc% | MCC |
|---|---|---|---|---|---|
| S1 | ZCMM | 91.40 | 96.56 | 96.75 | 0.88 |
| Wu’s method | 85.73 | 86.62 | 86.52 | 0.72 | |
| S2 | ZCMM | 96.72 | 96.54 | 94.10 | 0.88 |
| Wu’s method | 86.20 | 84.89 | 85.57 | 0.71 |
© 2019 by the authors. Licensee MDPI, Basel, Switzerland. This article is an open access article distributed under the terms and conditions of the Creative Commons Attribution (CC BY) license (http://creativecommons.org/licenses/by/4.0/).
Share and Cite
MDPI and ACS Style
Cui, Y.; Xu, Z.; Li, J. ZCMM: A Novel Method Using Z-Curve Theory- Based and Position Weight Matrix for Predicting Nucleosome Positioning. Genes 2019, 10, 765. https://doi.org/10.3390/genes10100765
AMA Style
Cui Y, Xu Z, Li J. ZCMM: A Novel Method Using Z-Curve Theory- Based and Position Weight Matrix for Predicting Nucleosome Positioning. Genes. 2019; 10(10):765. https://doi.org/10.3390/genes10100765
Chicago/Turabian StyleCui, Ying, Zelong Xu, and Jianzhong Li. 2019. "ZCMM: A Novel Method Using Z-Curve Theory- Based and Position Weight Matrix for Predicting Nucleosome Positioning" Genes 10, no. 10: 765. https://doi.org/10.3390/genes10100765
Note that from the first issue of 2016, this journal uses article numbers instead of page numbers. See further details here.