Methylome-Wide Association Study in Peripheral White Blood Cells Focusing on Central Obesity and Inflammation

 ,
,  , , , and
on Behalf of the MENA Project
, , , and
on Behalf of the MENA Project
Abstract
:1. Introduction
2. Subjects and Methods
2.1. Participants
2.2. Study Variables
2.3. DNA Extraction, DNA Methylation Analysis, and Treatment of Methylation Raw Data
2.4. Treatment of Methylation Raw Data
2.5. Statistical Analysis
2.6. Ingenuity Pathway Analysis
3. Results
4. Discussion
Supplementary Materials
Author Contributions
Funding
Acknowledgments
Conflicts of Interest
References
- Cornier, M.A.; Despres, J.P.; Davis, N.; Grossniklaus, D.A.; Klein, S.; Lamarche, B.; Lopez-Jimenez, F.; Rao, G.; St-Onge, M.P.; Towfighi, A.; et al. Assessing adiposity: A scientific statement from the American Heart Association. Circulation 2011, 124, 1996–2019. [Google Scholar] [CrossRef] [PubMed]
- WHO. Global Status Report on Noncommunicable Diseases 2014; WHO: Geneva, Switzerland, 2014; p. 298. [Google Scholar]
- Goni, L.; Milagro, F.I.; Cuervo, M.; Martinez, J.A. Single-nucleotide polymorphisms and DNA methylation markers associated with central obesity and regulation of body weight. Nutr. Rev. 2014, 72, 673–690. [Google Scholar] [CrossRef] [PubMed]
- Gonzalez-Muniesa, P.; Martinez-Gonzalez, M.A.; Hu, F.B.; Despres, J.P.; Matsuzawa, Y.; Loos, R.J.F.; Moreno, L.A.; Bray, G.A.; Martinez, J.A. Obesity. Nat. Rev. Dis. Primers 2017, 3, 17034. [Google Scholar] [CrossRef] [PubMed]
- Heianza, Y.; Qi, L. Gene-Diet Interaction and Precision Nutrition in Obesity. Int. J. Mol. Sci. 2017, 18, 787. [Google Scholar] [CrossRef]
- Van Dijk, S.J.; Tellam, R.L.; Morrison, J.L.; Muhlhausler, B.S.; Molloy, P.L. Recent developments on the role of epigenetics in obesity and metabolic disease. Clin. Epigenet. 2015, 7, 66. [Google Scholar] [CrossRef]
- Aronica, L.; Levine, A.J.; Brennan, K.; Mi, J.; Gardner, C.; Haile, R.W.; Hitchins, M.P. A systematic review of studies of DNA methylation in the context of a weight loss intervention. Epigenomics 2017, 9, 769–787. [Google Scholar] [CrossRef]
- Al Muftah, W.A.; Al-Shafai, M.; Zaghlool, S.B.; Visconti, A.; Tsai, P.C.; Kumar, P.; Spector, T.; Bell, J.; Falchi, M.; Suhre, K. Epigenetic associations of type 2 diabetes and BMI in an Arab population. Clin. Epigenet. 2016, 8, 13. [Google Scholar] [CrossRef]
- Wahl, S.; Drong, A.; Lehne, B.; Loh, M.; Scott, W.R.; Kunze, S.; Tsai, P.C.; Ried, J.S.; Zhang, W.; Yang, Y.; et al. Epigenome-wide association study of body mass index, and the adverse outcomes of adiposity. Nature 2017, 541, 81–86. [Google Scholar] [CrossRef]
- Demerath, E.W.; Guan, W.; Grove, M.L.; Aslibekyan, S.; Mendelson, M.; Zhou, Y.H.; Hedman, A.K.; Sandling, J.K.; Li, L.A.; Irvin, M.R.; et al. Epigenome-wide association study (EWAS) of BMI, BMI change and waist circumference in African American adults identifies multiple replicated loci. Hum. Mol. Genet. 2015, 24, 4464–4479. [Google Scholar] [CrossRef] [Green Version]
- Aslibekyan, S.; Demerath, E.W.; Mendelson, M.; Zhi, D.; Guan, W.; Liang, L.; Sha, J.; Pankow, J.S.; Liu, C.; Irvin, M.R.; et al. Epigenome-wide study identifies novel methylation loci associated with body mass index and waist circumference. Obesity (Silver Spring) 2015, 23, 1493–1501. [Google Scholar] [CrossRef] [Green Version]
- Meeks, K.A.C.; Henneman, P.; Venema, A.; Burr, T.; Galbete, C.; Danquah, I.; Schulze, M.B.; Mockenhaupt, F.P.; Owusu-Dabo, E.; Rotimi, C.N.; et al. An epigenome-wide association study in whole blood of measures of adiposity among Ghanaians: The RODAM study. Clin. Epigenet. 2017, 9, 103. [Google Scholar] [CrossRef] [PubMed]
- Dhana, K.; Braun, K.V.E.; Nano, J.; Voortman, T.; Demerath, E.W.; Guan, W.; Fornage, M.; van Meurs, J.B.J.; Uitterlinden, A.G.; Hofman, A.; et al. An Epigenome-Wide Association Study (EWAS) of Obesity-Related Traits. Am. J. Epidemiol. 2018. [Google Scholar] [CrossRef] [PubMed]
- Campanella, G.; Gunter, M.J.; Polidoro, S.; Krogh, V.; Palli, D.; Panico, S.; Sacerdote, C.; Tumino, R.; Fiorito, G.; Guarrera, S.; et al. Epigenome-wide association study of adiposity and future risk of obesity-related diseases. Int. J. Obes. (Lond.) 2018. [Google Scholar] [CrossRef] [PubMed]
- Mamtani, M.; Kulkarni, H.; Dyer, T.D.; Goring, H.H.; Neary, J.L.; Cole, S.A.; Kent, J.W.; Kumar, S.; Glahn, D.C.; Mahaney, M.C.; et al. Genome- and epigenome-wide association study of hypertriglyceridemic waist in Mexican American families. Clin. Epigenet. 2016, 8, 6. [Google Scholar] [CrossRef] [PubMed] [Green Version]
- Sayols-Baixeras, S.; Subirana, I.; Fernandez-Sanles, A.; Senti, M.; Lluis-Ganella, C.; Marrugat, J.; Elosua, R. DNA methylation and obesity traits: An epigenome-wide association study. The REGICOR study. Epigenetics 2017, 12, 909–916. [Google Scholar] [CrossRef] [PubMed]
- Larsen, T.M.; Dalskov, S.; van Baak, M.; Jebb, S.; Kafatos, A.; Pfeiffer, A.; Martinez, J.A.; Handjieva-Darlenska, T.; Kunesova, M.; Holst, C.; et al. The Diet, Obesity and Genes (Diogenes) Dietary Study in eight European countries—A comprehensive design for long-term intervention. Obes. Rev. 2010, 11, 76–91. [Google Scholar] [CrossRef] [PubMed]
- Huerta, A.E.; Navas-Carretero, S.; Prieto-Hontoria, P.L.; Martinez, J.A.; Moreno-Aliaga, M.J. Effects of alpha-lipoic acid and eicosapentaenoic acid in overweight and obese women during weight loss. Obesity (Silver Spring) 2015, 23, 313–321. [Google Scholar] [CrossRef] [PubMed]
- Celis-Morales, C.; Livingstone, K.M.; Marsaux, C.F.; Forster, H.; O’Donovan, C.B.; Woolhead, C.; Macready, A.L.; Fallaize, R.; Navas-Carretero, S.; San-Cristobal, R.; et al. Design and baseline characteristics of the Food4Me study: A web-based randomised controlled trial of personalised nutrition in seven European countries. Genes Nutr. 2015, 10, 450. [Google Scholar] [CrossRef] [PubMed]
- Santos, J.L.; Yevenes, I.; Cataldo, L.R.; Morales, M.; Galgani, J.; Arancibia, C.; Vega, J.; Olmos, P.; Flores, M.; Valderas, J.P.; et al. Development and assessment of the disposition index based on the oral glucose tolerance test in subjects with different glycaemic status. J. Physiol. Biochem. 2016, 72, 121–131. [Google Scholar] [CrossRef]
- Abete, I.; Gomez-Uriz, A.M.; Mansego, M.L.; De Arce, A.; Goyenechea, E.; Blazquez, V.; Martinez-Zabaleta, M.T.; Gonzalez-Muniesa, P.; Lopez De Munain, A.; Martinez, J.A.; et al. Epigenetic Changes in the Methylation Patterns of KCNQ1 and WT1 after a Weight Loss Intervention Program in Obese Stroke Patients. Curr. Neurovasc. Res. 2015, 12, 321–333. [Google Scholar] [CrossRef]
- Petersen, M.; Taylor, M.A.; Saris, W.H.; Verdich, C.; Toubro, S.; Macdonald, I.; Rossner, S.; Stich, V.; Guy-Grand, B.; Langin, D.; et al. Randomized, multi-center trial of two hypo-energetic diets in obese subjects: High- versus low-fat content. Int. J. Obes. (Lond.) 2006, 30, 552–560. [Google Scholar] [CrossRef] [PubMed]
- Estruch, R.; Ros, E.; Salas-Salvado, J.; Covas, M.I.; Corella, D.; Aros, F.; Gomez-Gracia, E.; Ruiz-Gutierrez, V.; Fiol, M.; Lapetra, J.; et al. Primary prevention of cardiovascular disease with a Mediterranean diet. N. Engl. J. Med. 2013, 368, 1279–1290. [Google Scholar] [CrossRef] [PubMed]
- Zulet, M.A.; Bondia-Pons, I.; Abete, I.; de la Iglesia, R.; Lopez-Legarrea, P.; Forga, L.; Navas-Carretero, S.; Martinez, J.A. The reduction of the metabolyc syndrome in Navarra-Spain (RESMENA-S) study: A multidisciplinary strategy based on chrononutrition and nutritional education, together with dietetic and psychological control. Nutr. Hosp. 2011, 26, 16–26. [Google Scholar] [PubMed]
- Ramos-Lopez, O.; Riezu-Boj, J.I.; Milagro, F.I.; Goni, L.; Cuervo, M.; Martinez, J.A. Differential lipid metabolism outcomes associated with ADRB2 gene polymorphisms in response to two dietary interventions in overweight/obese subjects. Nutr. Metab. Cardiovasc. Dis. 2018, 28, 165–172. [Google Scholar] [CrossRef] [PubMed]
- Arpón, A.; Milagro, F.I.; Ramos-Lopez, O.; Mansego, M.L.; Santos, J.L.; Riezu-Boj, J.I.; Martínez, J.A. Epigenome-wide association study in peripheral white blood cells involving insulin resistance. Sci. Rep. 2019, 9, 2445. [Google Scholar] [CrossRef] [PubMed]
- Madden, A.M.; Smith, S. Body composition and morphological assessment of nutritional status in adults: A review of anthropometric variables. J. Hum. Nutr. Diet. 2016, 29, 7–25. [Google Scholar] [CrossRef] [PubMed]
- Du, P.; Kibbe, W.A.; Lin, S.M. lumi: A pipeline for processing Illumina microarray. Bioinformatics 2008, 24, 1547–1548. [Google Scholar] [CrossRef] [PubMed]
- Team, R. RStudio: Integrated Development for R. Available online: http://www.rstudio.com/ (accessed on 5 June 2018).
- Morris, T.J.; Butcher, L.M.; Feber, A.; Teschendorff, A.E.; Chakravarthy, A.R.; Wojdacz, T.K.; Beck, S. ChAMP: 450k Chip Analysis Methylation Pipeline. Bioinformatics 2014, 30, 428–430. [Google Scholar] [CrossRef]
- Nordlund, J.; Backlin, C.L.; Wahlberg, P.; Busche, S.; Berglund, E.C.; Eloranta, M.L.; Flaegstad, T.; Forestier, E.; Frost, B.M.; Harila-Saari, A.; et al. Genome-wide signatures of differential DNA methylation in pediatric acute lymphoblastic leukemia. Genome Biol. 2013, 14, r105. [Google Scholar] [CrossRef]
- Maksimovic, J.; Gordon, L.; Oshlack, A. SWAN: Subset-quantile within array normalization for illumina infinium HumanMethylation450 BeadChips. Genome Biol. 2012, 13, R44. [Google Scholar] [CrossRef]
- Teschendorff, A.E.; Zhuang, J.; Widschwendter, M. Independent surrogate variable analysis to deconvolve confounding factors in large-scale microarray profiling studies. Bioinformatics 2011, 27, 1496–1505. [Google Scholar] [CrossRef] [PubMed]
- Johnson, W.E.; Li, C.; Rabinovic, A. Adjusting batch effects in microarray expression data using empirical Bayes methods. Biostatistics 2007, 8, 118–127. [Google Scholar] [CrossRef] [PubMed]
- Houseman, E.A.; Accomando, W.P.; Koestler, D.C.; Christensen, B.C.; Marsit, C.J.; Nelson, H.H.; Wiencke, J.K.; Kelsey, K.T. DNA methylation arrays as surrogate measures of cell mixture distribution. BMC Bioinformatics 2012, 13, 86. [Google Scholar] [CrossRef] [PubMed]
- Edgar, R.; Domrachev, M.; Lash, A.E. Gene Expression Omnibus: NCBI gene expression and hybridization array data repository. Nucleic Acids Res. 2002, 30, 207–210. [Google Scholar] [CrossRef] [PubMed] [Green Version]
- Arpón, A.; Milagro, F.I.; Ramos-Lopez, O.; Mansego, M.L.; Riezu-Boj, J.I.; Martinez, J.A. GSE115278: Epigenome-Wide Association Study in Peripheral White Blood Cells: Methyl Epigenome Network Association (MENA) Project. Available online: www.ncbi.nlm.nih.gov/geo/query/acc.cgi?acc=GSE115278 (accessed on 2 May 2019).
- Hinrichs, A.L.; Larkin, E.K.; Suarez, B.K. Population stratification and patterns of linkage disequilibrium. Genet. Epidemiol. 2009, 33 (Suppl. 1), S88–S92. [Google Scholar] [CrossRef] [PubMed] [Green Version]
- Expert Panel on Detection, E.; Treatment of High Blood Cholesterol in, A. Executive Summary of The Third Report of The National Cholesterol Education Program (NCEP) Expert Panel on Detection, Evaluation, And Treatment of High Blood Cholesterol In Adults (Adult Treatment Panel III). JAMA 2001, 285, 2486–2497. [Google Scholar]
- Volkmar, M.; Dedeurwaerder, S.; Cunha, D.A.; Ndlovu, M.N.; Defrance, M.; Deplus, R.; Calonne, E.; Volkmar, U.; Igoillo-Esteve, M.; Naamane, N.; et al. DNA methylation profiling identifies epigenetic dysregulation in pancreatic islets from type 2 diabetic patients. EMBO J. 2012, 31, 1405–1426. [Google Scholar] [CrossRef] [PubMed] [Green Version]
- Rodriguez-Hernandez, H.; Simental-Mendia, L.E.; Rodriguez-Ramirez, G.; Reyes-Romero, M.A. Obesity and inflammation: Epidemiology, risk factors, and markers of inflammation. Int. J. Endocrinol. 2013, 2013, 678159. [Google Scholar] [CrossRef]
- Ronn, T.; Volkov, P.; Gillberg, L.; Kokosar, M.; Perfilyev, A.; Jacobsen, A.L.; Jorgensen, S.W.; Brons, C.; Jansson, P.A.; Eriksson, K.F.; et al. Impact of age, BMI and HbA1c levels on the genome-wide DNA methylation and mRNA expression patterns in human adipose tissue and identification of epigenetic biomarkers in blood. Hum. Mol. Genet. 2015, 24, 3792–3813. [Google Scholar] [CrossRef] [Green Version]
- Mendelson, M.M.; Marioni, R.E.; Joehanes, R.; Liu, C.; Hedman, A.K.; Aslibekyan, S.; Demerath, E.W.; Guan, W.; Zhi, D.; Yao, C.; et al. Association of Body Mass Index with DNA Methylation and Gene Expression in Blood Cells and Relations to Cardiometabolic Disease: A Mendelian Randomization Approach. PLoS Med. 2017, 14, e1002215. [Google Scholar] [CrossRef]
- Geurts, Y.M.; Dugue, P.A.; Joo, J.E.; Makalic, E.; Jung, C.H.; Guan, W.; Nguyen, S.; Grove, M.L.; Wong, E.M.; Hodge, A.M.; et al. Novel associations between blood DNA methylation and body mass index in middle-aged and older adults. Int. J. Obes. (Lond.) 2018, 42, 887–896. [Google Scholar] [CrossRef] [PubMed]
- Nilsson, E.; Jansson, P.A.; Perfilyev, A.; Volkov, P.; Pedersen, M.; Svensson, M.K.; Poulsen, P.; Ribel-Madsen, R.; Pedersen, N.L.; Almgren, P.; et al. Altered DNA methylation and differential expression of genes influencing metabolism and inflammation in adipose tissue from subjects with type 2 diabetes. Diabetes 2014, 63, 2962–2976. [Google Scholar] [CrossRef] [PubMed]
- Yamada, Y.; Nishida, T.; Horibe, H.; Oguri, M.; Kato, K.; Sawabe, M. Identification of hypo- and hypermethylated genes related to atherosclerosis by a genome-wide analysis of DNA methylation. Int. J. Mol. Med. 2014, 33, 1355–1363. [Google Scholar] [CrossRef]
- Zaina, S.; Heyn, H.; Carmona, F.J.; Varol, N.; Sayols, S.; Condom, E.; Ramirez-Ruz, J.; Gomez, A.; Goncalves, I.; Moran, S.; et al. DNA methylation map of human atherosclerosis. Circ. Cardiovasc. Genet. 2014, 7, 692–700. [Google Scholar] [CrossRef] [PubMed]
- Ligthart, S.; Marzi, C.; Aslibekyan, S.; Mendelson, M.M.; Conneely, K.N.; Tanaka, T.; Colicino, E.; Waite, L.L.; Joehanes, R.; Guan, W.; et al. DNA methylation signatures of chronic low-grade inflammation are associated with complex diseases. Genome Biol. 2016, 17, 255. [Google Scholar] [CrossRef] [PubMed]
- Yoshimura, Y.; Araki, A.; Maruta, H.; Takahashi, Y.; Yamashita, H. Molecular cloning of rat acss3 and characterization of mammalian propionyl-CoA synthetase in the liver mitochondrial matrix. J. Biochem. 2017, 161, 279–289. [Google Scholar] [CrossRef] [PubMed]
- Kanter, J.E.; Kramer, F.; Barnhart, S.; Averill, M.M.; Vivekanandan-Giri, A.; Vickery, T.; Li, L.O.; Becker, L.; Yuan, W.; Chait, A.; et al. Diabetes promotes an inflammatory macrophage phenotype and atherosclerosis through acyl-CoA synthetase 1. Proc. Natl. Acad. Sci. USA 2012, 109, E715–E724. [Google Scholar] [CrossRef] [PubMed]
- Kendrick, S.F.; O’Boyle, G.; Mann, J.; Zeybel, M.; Palmer, J.; Jones, D.E.; Day, C.P. Acetate, the key modulator of inflammatory responses in acute alcoholic hepatitis. Hepatology 2010, 51, 1988–1997. [Google Scholar] [CrossRef] [PubMed]
- Benton, M.C.; Johnstone, A.; Eccles, D.; Harmon, B.; Hayes, M.T.; Lea, R.A.; Griffiths, L.; Hoffman, E.P.; Stubbs, R.S.; Macartney-Coxson, D. An analysis of DNA methylation in human adipose tissue reveals differential modification of obesity genes before and after gastric bypass and weight loss. Genome Biol. 2015, 16, 8. [Google Scholar] [CrossRef] [PubMed]
- Mudry, J.M.; Lassiter, D.G.; Nylen, C.; Garcia-Calzon, S.; Naslund, E.; Krook, A.; Zierath, J.R. Insulin and Glucose Alter Death-Associated Protein Kinase 3 (DAPK3) DNA Methylation in Human Skeletal Muscle. Diabetes 2017, 66, 651–662. [Google Scholar] [CrossRef] [PubMed]
- Kim, M.S.; Choi, M.S.; Han, S.N. High fat diet-induced obesity leads to proinflammatory response associated with higher expression of NOD2 protein. Nutr. Res. Pract. 2011, 5, 219–223. [Google Scholar] [CrossRef] [PubMed]
- Ozbayer, C.; Kurt, H.; Kebapci, M.N.; Gunes, H.V.; Colak, E.; Degirmenci, I. Effects of genetic variations in the genes encoding NOD1 and NOD2 on type 2 diabetes mellitus and insulin resistance. J. Clin. Pharm. Ther. 2017, 42, 98–102. [Google Scholar] [CrossRef] [PubMed]
- Krishnamoorthy, S.; Recchiuti, A.; Chiang, N.; Yacoubian, S.; Lee, C.H.; Yang, R.; Petasis, N.A.; Serhan, C.N. Resolvin D1 binds human phagocytes with evidence for proresolving receptors. Proc. Natl. Acad. Sci. USA 2010, 107, 1660–1665. [Google Scholar] [CrossRef] [PubMed] [Green Version]
- Claria, J.; Dalli, J.; Yacoubian, S.; Gao, F.; Serhan, C.N. Resolvin D1 and resolvin D2 govern local inflammatory tone in obese fat. J. Immunol. 2012, 189, 2597–2605. [Google Scholar] [CrossRef] [PubMed]
- Neuhofer, A.; Zeyda, M.; Mascher, D.; Itariu, B.K.; Murano, I.; Leitner, L.; Hochbrugger, E.E.; Fraisl, P.; Cinti, S.; Serhan, C.N.; et al. Impaired local production of proresolving lipid mediators in obesity and 17-HDHA as a potential treatment for obesity-associated inflammation. Diabetes 2013, 62, 1945–1956. [Google Scholar] [CrossRef] [PubMed]
- Kent, J.W., Jr. Analysis of multiple phenotypes. Genet. Epidemiol. 2009, 33 (Suppl. 1), S33–S39. [Google Scholar] [CrossRef] [PubMed] [Green Version]
- Paley, C.A.; Johnson, M.I. Abdominal obesity and metabolic syndrome: Exercise as medicine? BMC Sports Sci. Med. Rehabil. 2018, 10, 7. [Google Scholar] [CrossRef] [PubMed]
- Shay, K.P.; Moreau, R.F.; Smith, E.J.; Smith, A.R.; Hagen, T.M. Alpha-lipoic acid as a dietary supplement: Molecular mechanisms and therapeutic potential. Biochim. Biophys. Acta 2009, 1790, 1149–1160. [Google Scholar] [CrossRef] [PubMed] [Green Version]
- Karastergiou, K.; Bredella, M.A.; Lee, M.J.; Smith, S.R.; Fried, S.K.; Miller, K.K. Growth hormone receptor expression in human gluteal versus abdominal subcutaneous adipose tissue: Association with body shape. Obesity (Silver Spring) 2016, 24, 1090–1096. [Google Scholar] [CrossRef]
- Yang, S.A. Association study between growth hormone receptor (GHR ) gene polymorphisms and obesity in Korean population. J. Exerc. Rehabil. 2016, 12, 632–636. [Google Scholar] [CrossRef]
- Lukens, J.R.; Dixit, V.D.; Kanneganti, T.D. Inflammasome activation in obesity-related inflammatory diseases and autoimmunity. Discov. Med. 2011, 12, 65–74. [Google Scholar] [PubMed]
- Subramanian, S.; Pallati, P.K.; Sharma, P.; Agrawal, D.K.; Nandipati, K.C. TREM-1 associated macrophage polarization plays a significant role in inducing insulin resistance in obese population. J. Transl. Med. 2017, 15, 85. [Google Scholar] [CrossRef] [PubMed]
- Park, Y.J.; Choe, S.S.; Sohn, J.H.; Kim, J.B. The role of glucose-6-phosphate dehydrogenase in adipose tissue inflammation in obesity. Adipocyte 2017, 6, 147–153. [Google Scholar] [CrossRef] [PubMed] [Green Version]
- Montilla, M.; Santi, M.J.; Carrozas, M.A.; Ruiz, F.A. Biomarkers of the prothrombotic state in abdominal obesity. Nutr. Hosp. 2014, 31, 1059–1066. [Google Scholar] [CrossRef] [PubMed]
- Ruf, W.; Samad, F. Tissue factor pathways linking obesity and inflammation. Hamostaseologie 2015, 35, 279–283. [Google Scholar] [CrossRef] [PubMed]
- Huang, S.; Qi, D.; Liang, J.; Miao, R.; Minagawa, K.; Quinn, T.; Matsui, T.; Fan, D.; Liu, J.; Fu, M. The putative tumor suppressor Zc3h12d modulates toll-like receptor signaling in macrophages. Cell Signal 2012, 24, 569–576. [Google Scholar] [CrossRef] [PubMed] [Green Version]
- Li, L.; Pan, Z.F.; Huang, X.; Wu, B.W.; Li, T.; Kang, M.X.; Ge, R.S.; Hu, X.Y.; Zhang, Y.H.; Ge, L.J.; et al. Junctophilin 3 expresses in pancreatic beta cells and is required for glucose-stimulated insulin secretion. Cell Death Dis. 2016, 7, e2275. [Google Scholar] [CrossRef]
- Berglind, D.; Muller, P.; Willmer, M.; Sinha, I.; Tynelius, P.; Naslund, E.; Dahlman-Wright, K.; Rasmussen, F. Differential methylation in inflammation and type 2 diabetes genes in siblings born before and after maternal bariatric surgery. Obesity (Silver Spring) 2016, 24, 250–261. [Google Scholar] [CrossRef]
- Bell, C.G. The Epigenomic Analysis of Human Obesity. Obesity (Silver Spring) 2017, 25, 1471–1481. [Google Scholar] [CrossRef] [Green Version]
- Dick, K.J.; Nelson, C.P.; Tsaprouni, L.; Sandling, J.K.; Aissi, D.; Wahl, S.; Meduri, E.; Morange, P.E.; Gagnon, F.; Grallert, H.; et al. DNA methylation and body-mass index: A genome-wide analysis. Lancet 2014, 383, 1990–1998. [Google Scholar] [CrossRef]
- Arpón, A.; Riezu-Boj, J.I.; Milagro, F.I.; Razquin, C.; Martinez-Gonzalez, M.A.; Corella, D.; Estruch, R.; Casas, R.; Fito, M.; Ros, E.; et al. Adherence to Mediterranean diet is associated with methylation changes in inflammation-related genes in peripheral blood cells. J. Physiol. Biochem. 2017, 73, 445–455. [Google Scholar] [CrossRef] [PubMed]
- Horsburgh, S.; Robson-Ansley, P.; Adams, R.; Smith, C. Exercise and inflammation-related epigenetic modifications: Focus on DNA methylation. Exerc. Immunol. Rev. 2015, 21, 26–41. [Google Scholar] [PubMed]
- Crujeiras, A.B.; Diaz-Lagares, A.; Sandoval, J.; Milagro, F.I.; Navas-Carretero, S.; Carreira, M.C.; Gomez, A.; Hervas, D.; Monteiro, M.P.; Casanueva, F.F.; et al. DNA methylation map in circulating leukocytes mirrors subcutaneous adipose tissue methylation pattern: A genome-wide analysis from non-obese and obese patients. Sci. Rep. 2017, 7, 41903. [Google Scholar] [CrossRef] [PubMed]


| TOTAL | ADULTS (n = 474) | |||||||||||||||||||||
|---|---|---|---|---|---|---|---|---|---|---|---|---|---|---|---|---|---|---|---|---|---|---|
| DiOGenes-UNAV | OBEPALIP | Food4Me-UNAV | GEDYMET | ICTUS | NUGENOB-UNAV | PREDIMED-UNAV | RESMENA | NormoP | OBEKIT | |||||||||||||
| Variables | n | Values | n | Values | n | Values | n | Values | n | Values | n | Values | n | Values | n | Values | n | Values | n | Values | n | Values |
| Sex (females) | 474 | 303 (64) | 52 | 27 (52) | 29 | 29 (100) | 39 | 21 (54) | 57 | 57 (100) | 7 | 5 (71) | 22 | 14 (64) | 116 | 59 (51) | 44 | 22 (50) | 12 | 6 (50) | 96 | 63 (66) |
| Age (years) | 474 | 47.0 (14.3) | 52 | 42.7 (5.8) | 29 | 37.4 (7.3) | 39 | 41.7 (10.0) | 57 | 27.0 (6.2) | 7 | 57.1 (7.4) | 22 | 34.7 (9.7) | 116 | 65.0 (3.7) | 44 | 48.6 (10.1) | 12 | 39.4 (5.6) | 96 | 46.8 (9.6) |
| Weight (kg) | 474 | 81.7 (19.1) | 52 | 95.3 (17.7) | 29 | 83.1 (9.5) | 39 | 74.4 (14.6) | 57 | 60.7 (8.8) | 7 | 121.9 (15.2) | 22 | 87.3 (20.8) | 116 | 71.7 (9.2) | 44 | 103.0 (18.1) | 12 | 65.8 (9.3) | 96 | 89.2 (13.6) |
| BMI (kg/m2) | 474 | 30.0 (5.7) | 52 | 33.9 (3.8) | 29 | 31.6 (3.1) | 39 | 26.0 (5.3) | 57 | 24.1 (3.5) | 7 | 44.3 (4.0) | 22 | 31.1 (8.2) | 116 | 27.7 (2.3) | 44 | 36.5 (3.7) | 12 | 22.8 (1.5) | 96 | 31.9 (3.7) |
| Waist circumference (cm) | 473 | 95.8 (16.1) | 52 | 107.5 (11.5) | 29 | 95.4 (6.8) | 39 | 87.9 (12.4) | 57 | 72.7 (7.9) | 7 | 125.3 (11.1) | 22 | 93.7 (19.4) | 115 | 91.8 (8.2) | 44 | 112.5 (12.4) | 12 | 78.2 (7.5) | 96 | 104.1 (10.5) |
| Female ≤ 88 (cm) | 121 | 76.3 (7.8) | 0 | NA | 2 | 81.6 (3.2) | 14 | 77.5 (7.4) | 55 | 71.9 (6.7) | 0 | NA | 5 | 72.0 (4.6) | 35 | 82.3 (4.9) | 0 | NA | 6 | 74.4 (8.0) | 4 | 85.1 (3.0) |
| Female > 88 (cm) | 182 | 100.9 (10.0) | 27 | 102.9 (9.1) | 27 | 96.4 (5.8) | 7 | 97.9 (10.0) | 2 | 95.0 (1.4) | 5 | 120.6 (8.9) | 9 | 102.9 (10.7) | 24 | 92.8 (3.5) | 22 | 105.7 (10.7) | 0 | NA | 59 | 102.0 (9.7) |
| Male ≤ 102 (cm) | 82 | 92.8 (7.4) | 5 | 97.6 (3.0) | 0 | NA | 16 | 90.1 (9.2) | 0 | NA | 0 | NA | 5 | 81.0 (4.4) | 47 | 95.6 (4.5) | 1 | 94.0 (NA) | 6 | 82.0 (4.8) | 2 | 95.4 (4.0) |
| Male > 102 (cm) | 88 | 114.8 (10.0) | 20 | 116.0 (10.5) | 0 | NA | 2 | 109.0 (8.5) | 0 | NA | 2 | 137.2 (5.4) | 3 | 123.2 (13.0) | 9 | 105.6 (2.6) | 21 | 120.5 (8.5) | 0 | NA | 31 | 111.0 (7.2) |
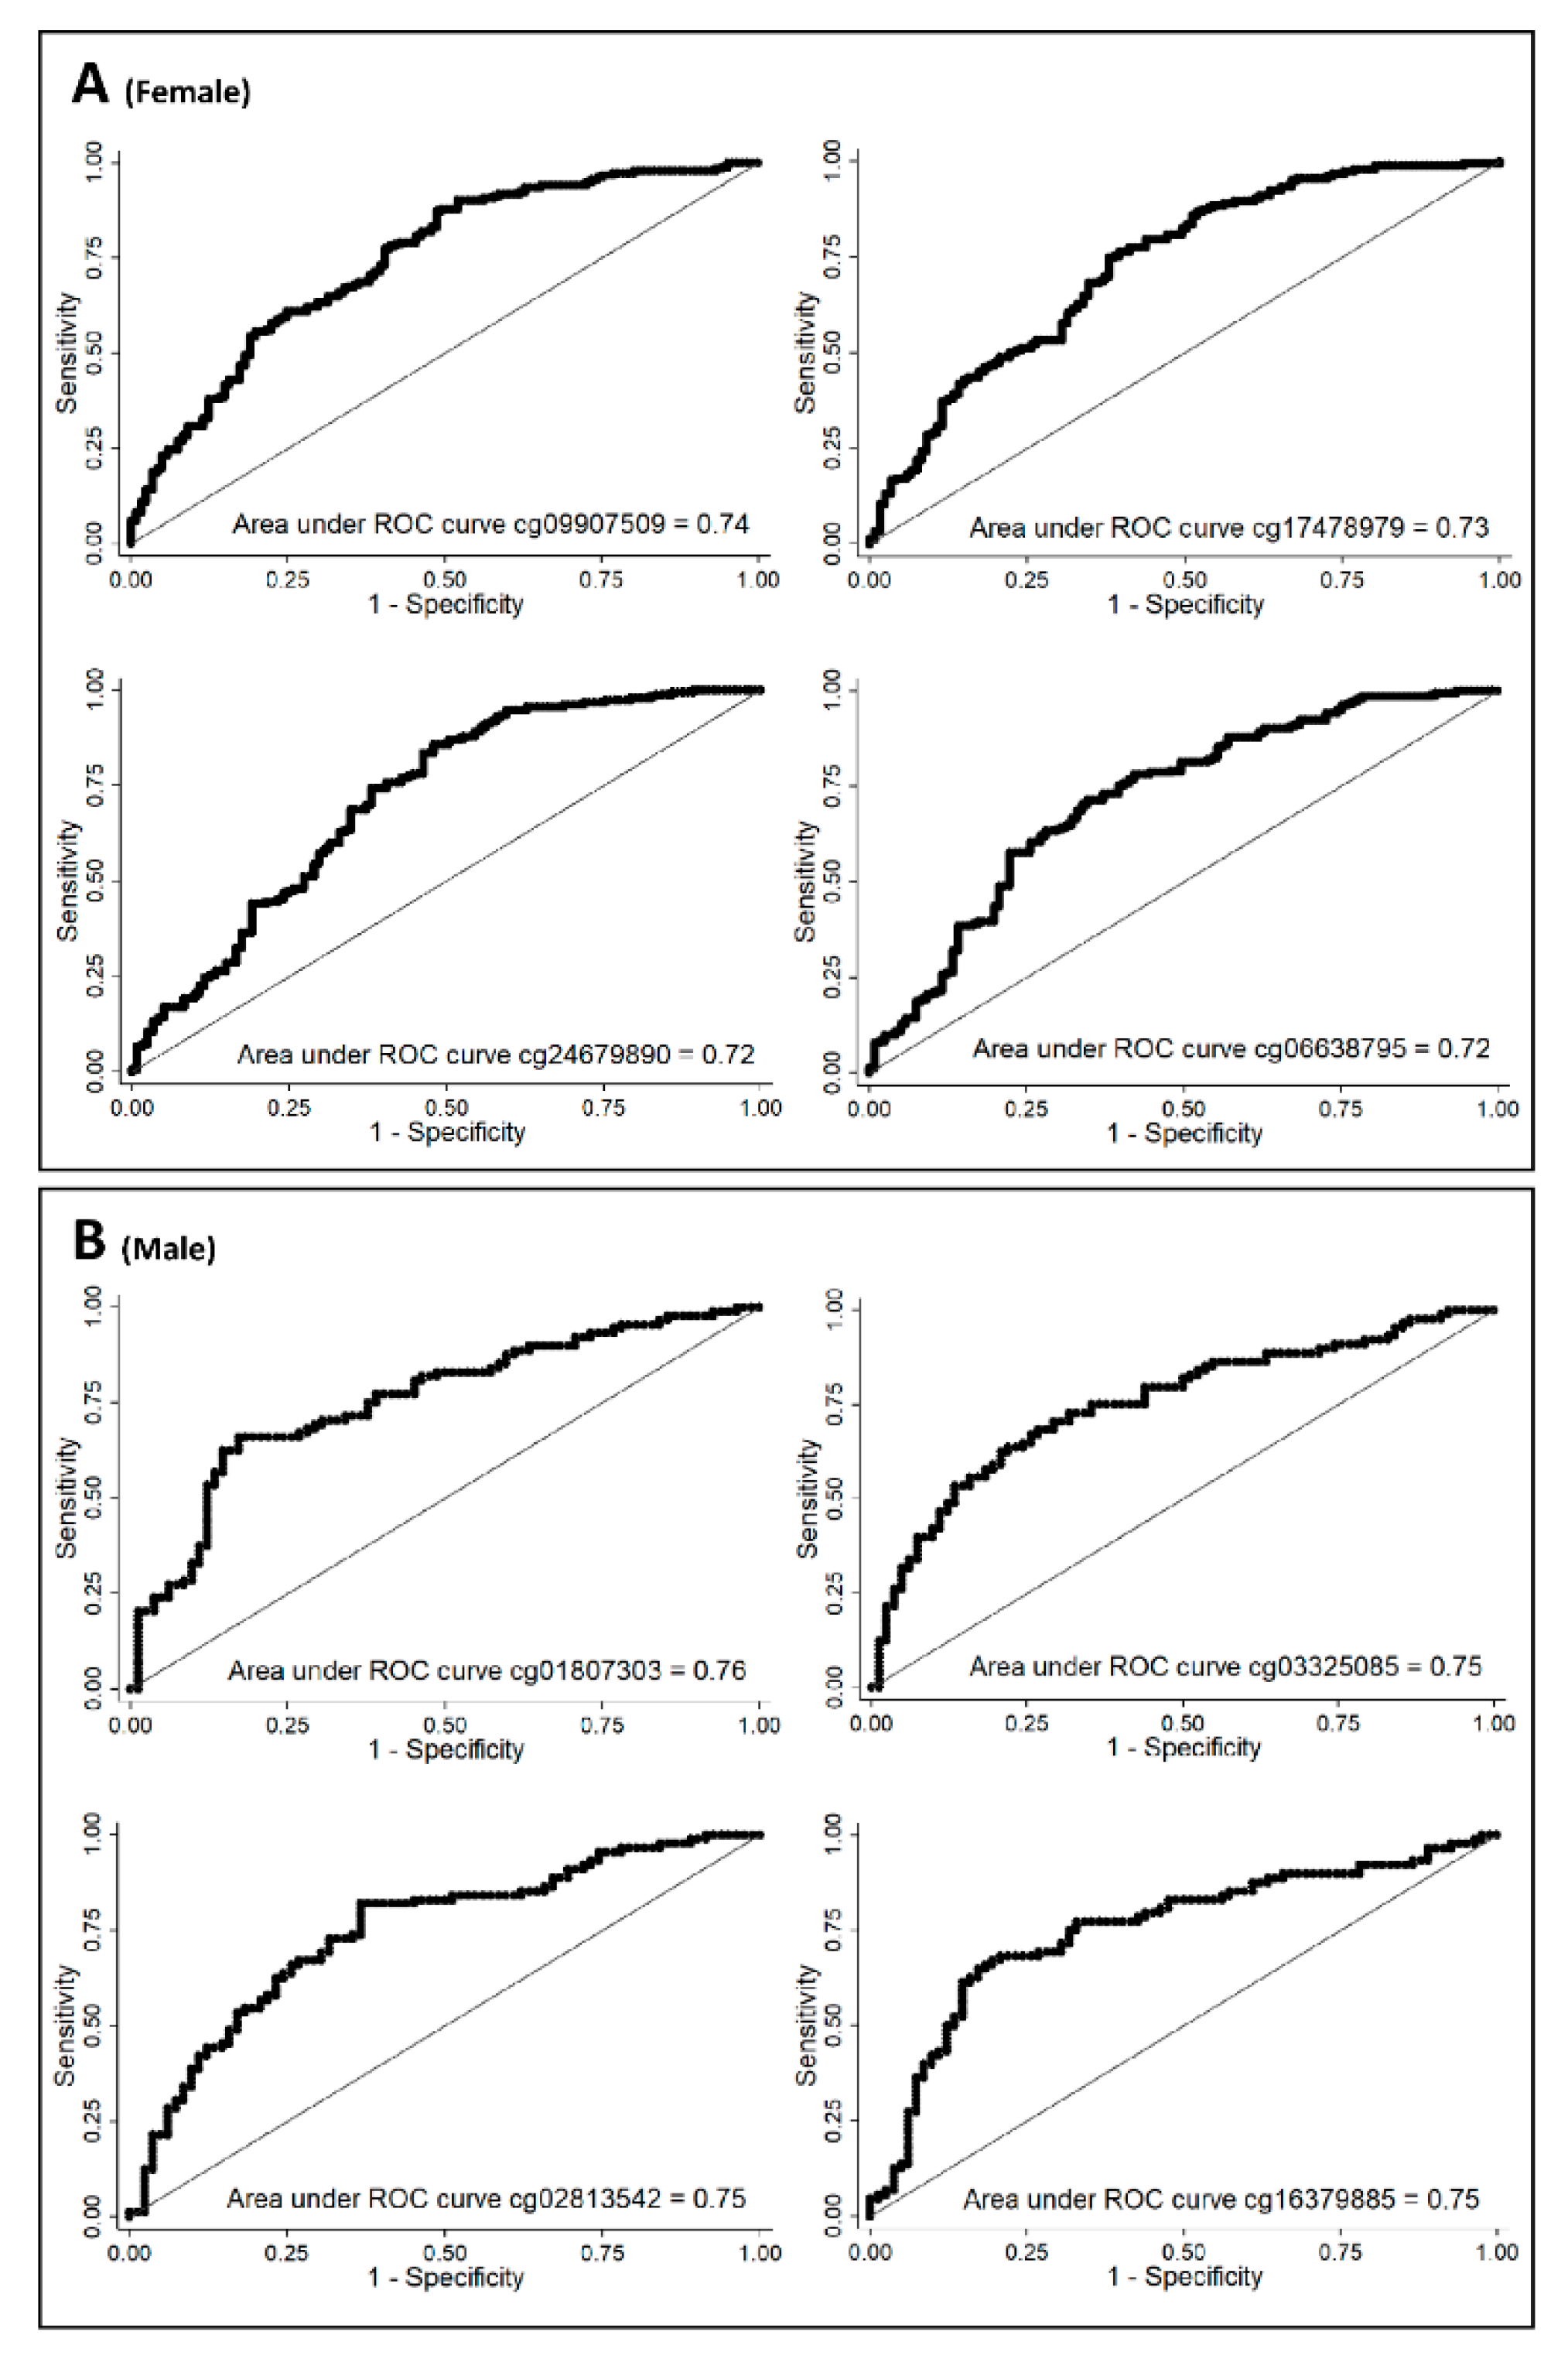
| CpG | AUC |
|---|---|
| Women | |
| cg09907509 | 0.73 |
| cg17478979 | 0.77 |
| cg24679890 | 0.72 |
| cg06638795 | 0.72 |
| Men | |
| cg01807303 | 0.63 |
| cg03325085 | 0.60 |
| cg02813542 | 0.71 |
| cg16379885 | 0.62 |
© 2019 by the authors. Licensee MDPI, Basel, Switzerland. This article is an open access article distributed under the terms and conditions of the Creative Commons Attribution (CC BY) license (http://creativecommons.org/licenses/by/4.0/).
Share and Cite
Arpón, A.; Milagro, F.I.; Ramos-Lopez, O.; Mansego, M.L.; Riezu-Boj, J.-I.; Martínez, J.A., on Behalf of the MENA Project. Methylome-Wide Association Study in Peripheral White Blood Cells Focusing on Central Obesity and Inflammation. Genes 2019, 10, 444. https://doi.org/10.3390/genes10060444
Arpón A, Milagro FI, Ramos-Lopez O, Mansego ML, Riezu-Boj J-I, Martínez JA on Behalf of the MENA Project. Methylome-Wide Association Study in Peripheral White Blood Cells Focusing on Central Obesity and Inflammation. Genes. 2019; 10(6):444. https://doi.org/10.3390/genes10060444
Chicago/Turabian StyleArpón, Ana, Fermín I. Milagro, Omar Ramos-Lopez, Maria L. Mansego, José-Ignacio Riezu-Boj, and J. Alfredo Martínez on Behalf of the MENA Project. 2019. "Methylome-Wide Association Study in Peripheral White Blood Cells Focusing on Central Obesity and Inflammation" Genes 10, no. 6: 444. https://doi.org/10.3390/genes10060444