Article

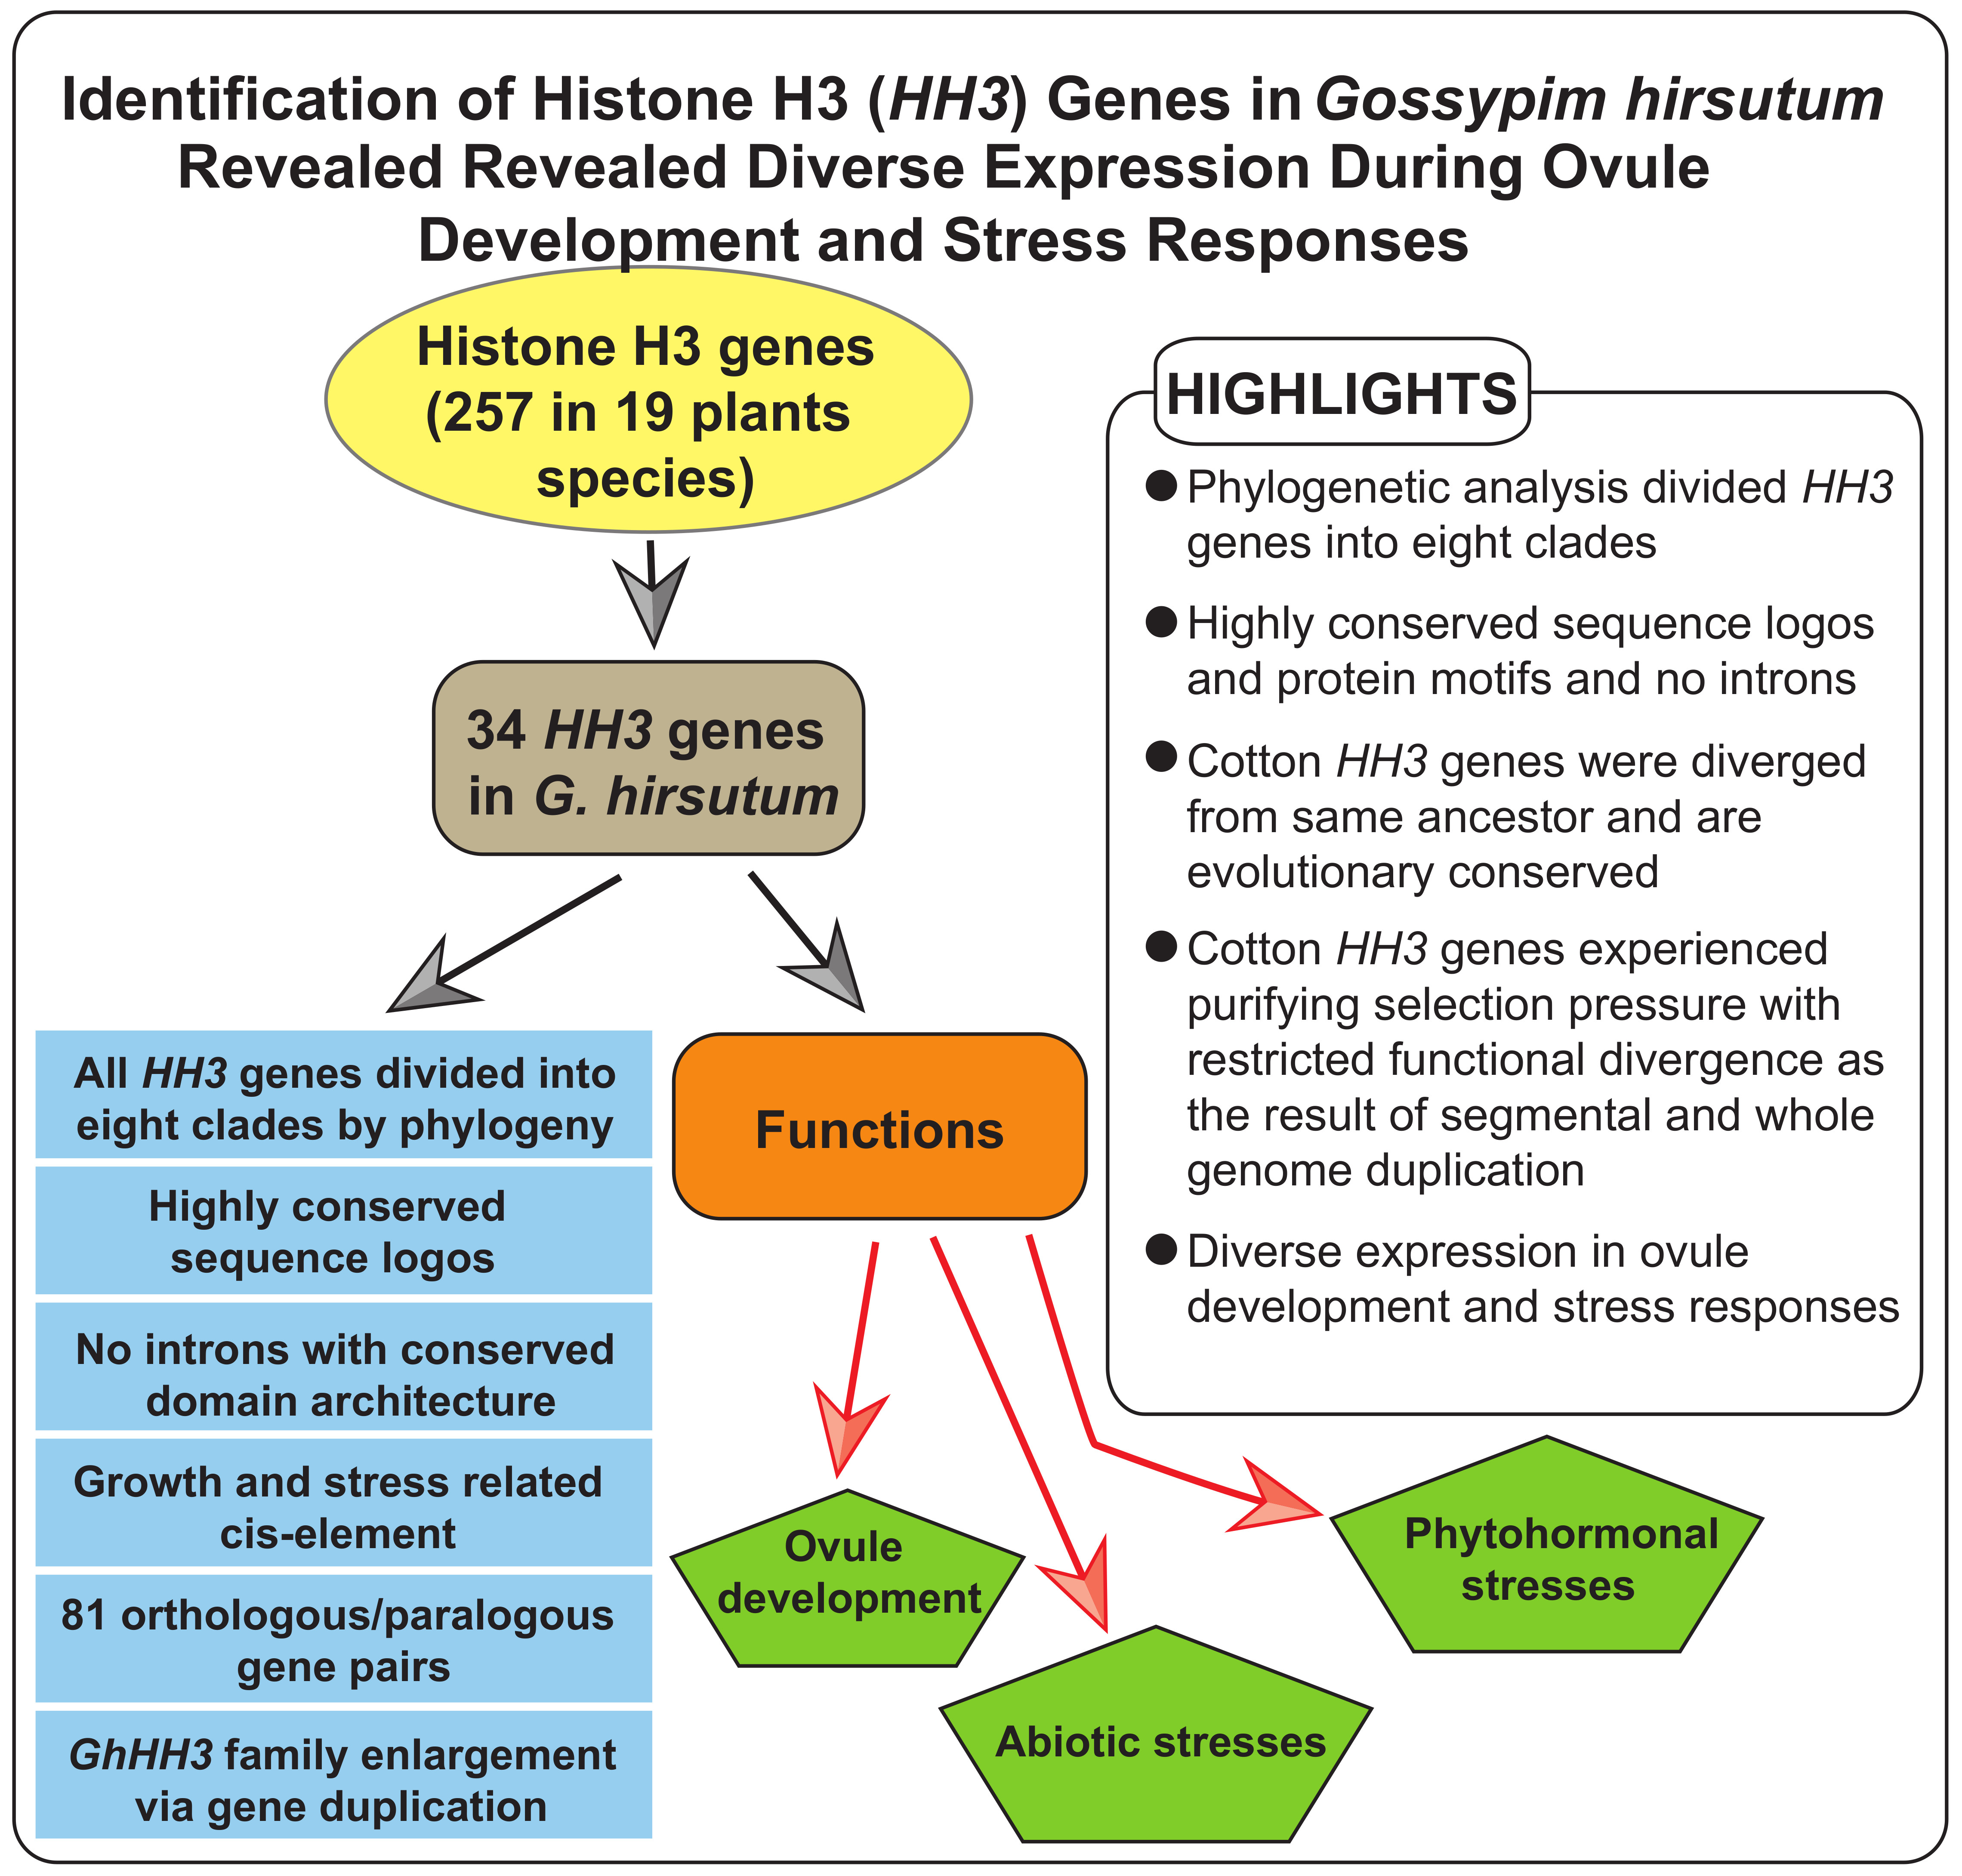
Identification of Histone H3 (HH3) Genes in Gossypium hirsutum Revealed Diverse Expression During Ovule Development and Stress Responses

1
State Key Laboratory of Cotton Biology, Key Laboratory of Biological and Genetic Breeding of Cotton, Institute of Cotton Research, Chinese Academy of Agricultural Sciences, Anyang 455000, China
2
Zhengzhou Reseach Base, State Key Laboratory of Cotton Biology, Zhengzhou University, Zhengzhou 4550001, China
*
Authors to whom correspondence should be addressed.
Genes 2019, 10(5), 355; https://doi.org/10.3390/genes10050355
Submission received: 3 April 2019 / Revised: 28 April 2019 / Accepted: 30 April 2019 / Published: 9 May 2019
(This article belongs to the Section Molecular Genetics and Genomics)

Abstract

:
Histone acts as the core for nucleosomes and is a key protein component of chromatin. Among different histone variants, histone H3 (HH3) variants have been reported to play vital roles in plant development. However, biological information and evolutionary relationships of HH3 genes in cotton remain to be elucidated. The current study identified 34 HH3 genes in Gossypium hirsutum. Phylogenetic analysis classified HH3 genes of 19 plant species into eight distinct clades. Sequence logos analysis among Arabidopsis, rice, and G. hirsutum amino acid residues showed higher conservation in amino acids. Using collinearity analysis, we identified 81 orthologous/paralogous gene pairs among the four genomes (A, D, At, and Dt) of cotton. Further, orthologous/paralogous and the Ka/Ks ratio demonstrated that cotton HH3 genes experienced strong purifying selection pressure with restricted functional divergence resulting from segmental and whole genome duplication. Expression pattern analysis indicated that GhHH3 genes were preferentially expressed in cotton ovule tissues. Additionally, GhHH3 gene expression can be regulated by abiotic stresses (cold, heat, sodium chloride (NaCl), and polyethylene glycol (PEG)) and phytohormonal (brassinolide (BL), gibberellic acid (GA), indole-3-acetic acid (IAA), salicylic acid (SA), and methyl jasmonate (MeJA)) treatments, suggesting that GhHH3 genes might play roles in abiotic and hormone stress resistance. Taken together, this work provides important information to decipher complete molecular and physiological functions of HH3 genes in cotton.

Graphical Abstract

1. Introduction

Histone is the major component of chromatin and histone genes have been widely studied in animals at the genome level. Histone genes in animals are classified according to whether they are replication independent or dependent, or on a tissue-specific basis. However, few studies have been conducted to elucidate the molecular functions of histone genes at the genomic level in plants [1]. Chromatin not only acts as DNA packaging in most eukaryotic cells, but also serves as a barrier in order to control accessibility of DNA. Histone has an essential role in chromatin structure modulation for various cellular processes such as DNA repair, replication, and transcription, as well as recombination. In chromatin, the nucleosome is the basic unit containing an octameric histone core and a DNA segment around that core [2]. Histone proteins are highly conserved among different plant species and are divided into histones H1, H2A, H2B, H3, and H4. Moreover, histone protein variants have been discovered based on different amino acids, which may vary from few amino acids to an entire protein segment [3,4,5].
During the last two decades, many studies have been conducted to explore post-transcriptional modifications involving histone that affect chromatin status including nucleosome stability and inter-nucleosomal contacts. It is now well established that the incorporation of histone variants results in chromatin formation with some particular features [6,7,8]. These histone variants are deposited in a DNA replication dependent manner. The deposition of a H3.1 histone variant may affect transcription of target genes [3,4,5]. In plants, different types of histone variants have been identified, including H3.1 and H3.3, on the basis of replication dependent and independent sub types. Unlike H3.1, histone variant H3.3 is incorporated into chromatin in a mostly replication-independent manner [9]. These histone variants differ from each other on the position of amino acids 31 and 87–90 [10,11].
Histone variant H3.3 genome-wide profiling in mammalian and Drosophila cells indicates specific incorporation into the body of active genes and regulatory elements, demonstrating the roles of H3 protein in transcription [12,13,14,15]. Another study indicated H3.3 enrichment in telomeres and peri-centric heterochromatin [16]. Moreover, several other studies demonstrated the particular functions of histone genes in genomic instability, sex chromosome inactivation, gene inactivation, and gene silencing [15,17,18]. Previously, the HH3 gene AtMGH3 was identified as a male-gamete-specific variant using a genome-wide approach in Arabidopsis [1]. Similarly, genome-wide analysis of HH3.1 and HH3.3 variants depicted similar genomic localization patterns with some unique features in Arabidopsis [4]. Another study showed that the presence of H3.3 in transcribed regions was strongly associated with transcriptional activity and H3.3 at promoters is often independent of transcription [3].
Cotton is an important natural fiber crop and a major contributor to the global textile industry. HH3 family genes have been widely analyzed in Arabidopsis and rice, but there is no comprehensive analysis of HH3 genes in cotton. Cotton genome sequencing during the last decade [19,20,21,22,23,24] has made it possible to analyze different cotton gene families with the help of genome-wide approaches.
Here, we identified 34 HH3 genes in Gossypium hirsutum. Phylogenetic analysis, sequence logo analysis for conserved amino acid residues, chromosomal distribution, gene duplication via collinearity analysis, Ka/Ks ratio, promoter cis-elements, gene structure, and domain architecture were predicted. Moreover, transcriptomic data analysis as well as expression pattern analysis of GhHH3 genes in different cotton tissues was also estimated using qRT-PCR. Additionally, the expression patterns of GhHH3 genes under various abiotic stresses and phytohormonal stimulus conditions were also determined to explore the functional roles of these genes in cotton. This work lays a foundation to elucidate the evolutionary and functional analysis of GhHH3 genes in addition to exploring molecular and biological mechanisms to understand cotton biology.

2. Materials and Methods

2.1. Sequence Identification

To identify the HH3 gene family members in different plant species, Arabidopsis HH3 protein sequences were used as query to retrieve HH3 genes in Gossypium arboreum (ICR, version 1.0), G. hirsutum (NAU, version 1.1), Gossypium raimondii (JGI, version 2.0), Brassica napus (version 1.0), Glycine max (version 10), Medicago truncatula (version 10), Populus trichocarpa (version 2.0), Solanum tuberosum (version 10), Theobroma cacao (version 10), Vitis vinifera (version 10), Oryza sativa (version 10), Zea mays (version 10), Sorghum bicolor (version 10), Ananas comosus (version 3.0), Chlamydomonas reinhardtii (version 5.5), Physcomitrella patens (version 3.3), Selaginella moellendorffii (version 1.0), and Pinus taeda (version 1.0). The Arabidopsis database was downloaded from TAIR 10 (http://www.arabidopsis.org), while a database for G. arboreum was downloaded from ftp://bioinfo.ayit.edu.cn/downloads/. G. hirsutum and G. raimondii databases were downloaded from COTTONGEN (https://www.cottongen.org/). Databases for all other plant species were downloaded from Phytozome v11 (https://phytozome.jgi.doe.gov/pz/portal.html). To confirm these retrieved HH3 protein sequences, other bioinformatics approaches including Interproscan 63.0 [25] (http://www.ebi.ac.uk/InterProScan/) and SMART [26] (http://smart.embl-heidelberg.de/) were used. Further, biophysical properties such as number of amino acids (protein length), MW (molecular weight), pl (isoelectric point), and gravity values for GhHH3 genes were calculated using the ExPASy ProtParam tool (http://us.expasy.org/tools/protparam.html). Moreover, subcellular localization of GhHH3 genes was predicted using the online tool softberry (www.softberry.com).

2.2. Phylogenetic and Conserved Sequence Analysis

For phylogenetic analysis, full length protein sequences of all observed species were aligned and two phylogenetic trees were generated in MEGA 7.0 [27] using the neighbor-joining (NJ) method. To determine the reliability of clades, the bootstrap method with 1000 replicates was used. Substitution was estimated using a Poisson model with default parameters. To generate sequence logos for conserved amino acid residues, multiple sequence alignment of Arabidopsis, rice, and G. hirsutum was carried out separately by Clustal X 2.0 (http://www.clustal.org/clustal2/) and sequence logos were generated by online software, WEBLOG [28].

2.3. Gene Structure, Domain Architecture, and Cis-Elements Analysis

GhHH3 genes were first aligned by Clustal X 2.0 and then MEGA 7.0 to generate an NJ tree. The obtained bed-file was subjected to GSDS 2.0 [29] (http://gsds.cbi.pku.edu.cn/index.php). Domain architecture analysis was performed by subjecting full length protein sequences to MEME software [30] (http://meme-suite.org/tools/meme), as described previously [31]. For cis-element analysis of GhHH3 gene promoter regions, sequence regions 2 kb upstream of the start codon were considered as proximal promoter regions and subjected to PlantCARE Database [32], and predicted cis-elements were classified according to their functional relevance, as described previously [33].

2.4. Chromosomal Localizations, Collinearity, and Ka/Ks Ratio Analysis

The chromosomal positions of GhHH3 genes were first determined by cotton genome annotation file (ftp://ftp.bioinfo.wsu.edu/species), after which gff3-files were extracted. To draw their physical location on corresponding chromosomes, MapInspect software (https://mapinspect.software.informer.com/) was used. During collinearity, analysis orthologous/paralogous data were obtained by the previously described methods [34], and then a figure was generated using CIRCOS software [35]. Next, non-synonymous (Ka) and synonymous (Ks) divergence level ratios were calculated by aligning duplicated gene pair protein sequences in Clustal X 2.0, after which they were translated into complementary DNA (cDNA) sequences using the PAL2NAL program [36] (http://www.bork.embl.de/pal2nal/). Finally, Ka and Ks values were calculated with the help of the CODEML program using the PAML package [37].

2.5. Plant Material, Treatment, and qRT-PCR Analysis

In this study, G. hirsutum variety CRI24 was used as genetic material to determine tissue specific expression patterns, as well as for abiotic and hormonal stresses. Specifically, pre-germinated cotton seeds were suspended in a container of liquid culture medium, as described previously [38]. For abiotic stress, four-week-old seedling at the 3–4 leaf stage were subjected to cold (4°C), heat (38°C), sodium chloride (NaCl) (300 nM), and polyethylene glycol (PEG) (20% mass fraction) for 1, 2, 4, and 6 hours. Similarly, seedlings at the same stage were subjected to five hormonal stresses including brassinolide (BL) (10 µM), gibberellic acid (GA) (100 µM), indole-3-acetic acid (IAA) (100 µM), salicylic acid (SA) (10 µM), and methyl jasmonate (MeJA) (10 µM) for 0.5, 1, 3, and 5 hours. After treatment, leaves were collected for RNA extraction and subsequent analysis. For tissue specific expression pattern analysis, 15 tissues including root, stem, leaf, flower, ovule (1, 3, 5, 7, 10, 15, and 20 days post-anthesis (DPA) ovule), and fiber (7, 10, 15, and 20 DPA fiber) were collected from cotton grown under field conditions with standard practices. Collected samples were immediately frozen in liquid nitrogen and stored at −80°C until used.
RNA from collected tissues was extracted using an RNAprep Pure Plant Kit (TIANGEN, Beijing, China) and 1 µg of total RNA was reverse transcribed into cDNA with a PrimeScript® RT reagent kit (Takara, Dalian, China). For qPCR, Premix Ex TaqTM II (Takara) was used and PCR amplification was conducted on a LightCycler 480 (Roche Diagnostics GmbH, Mannheim, Germany). GhUBQ7 (accession No. DQ116441) was used as an internal control. Each experiment was conducted in three independent biological repeats; primers used in this study are shown in Table S1.

3. Results

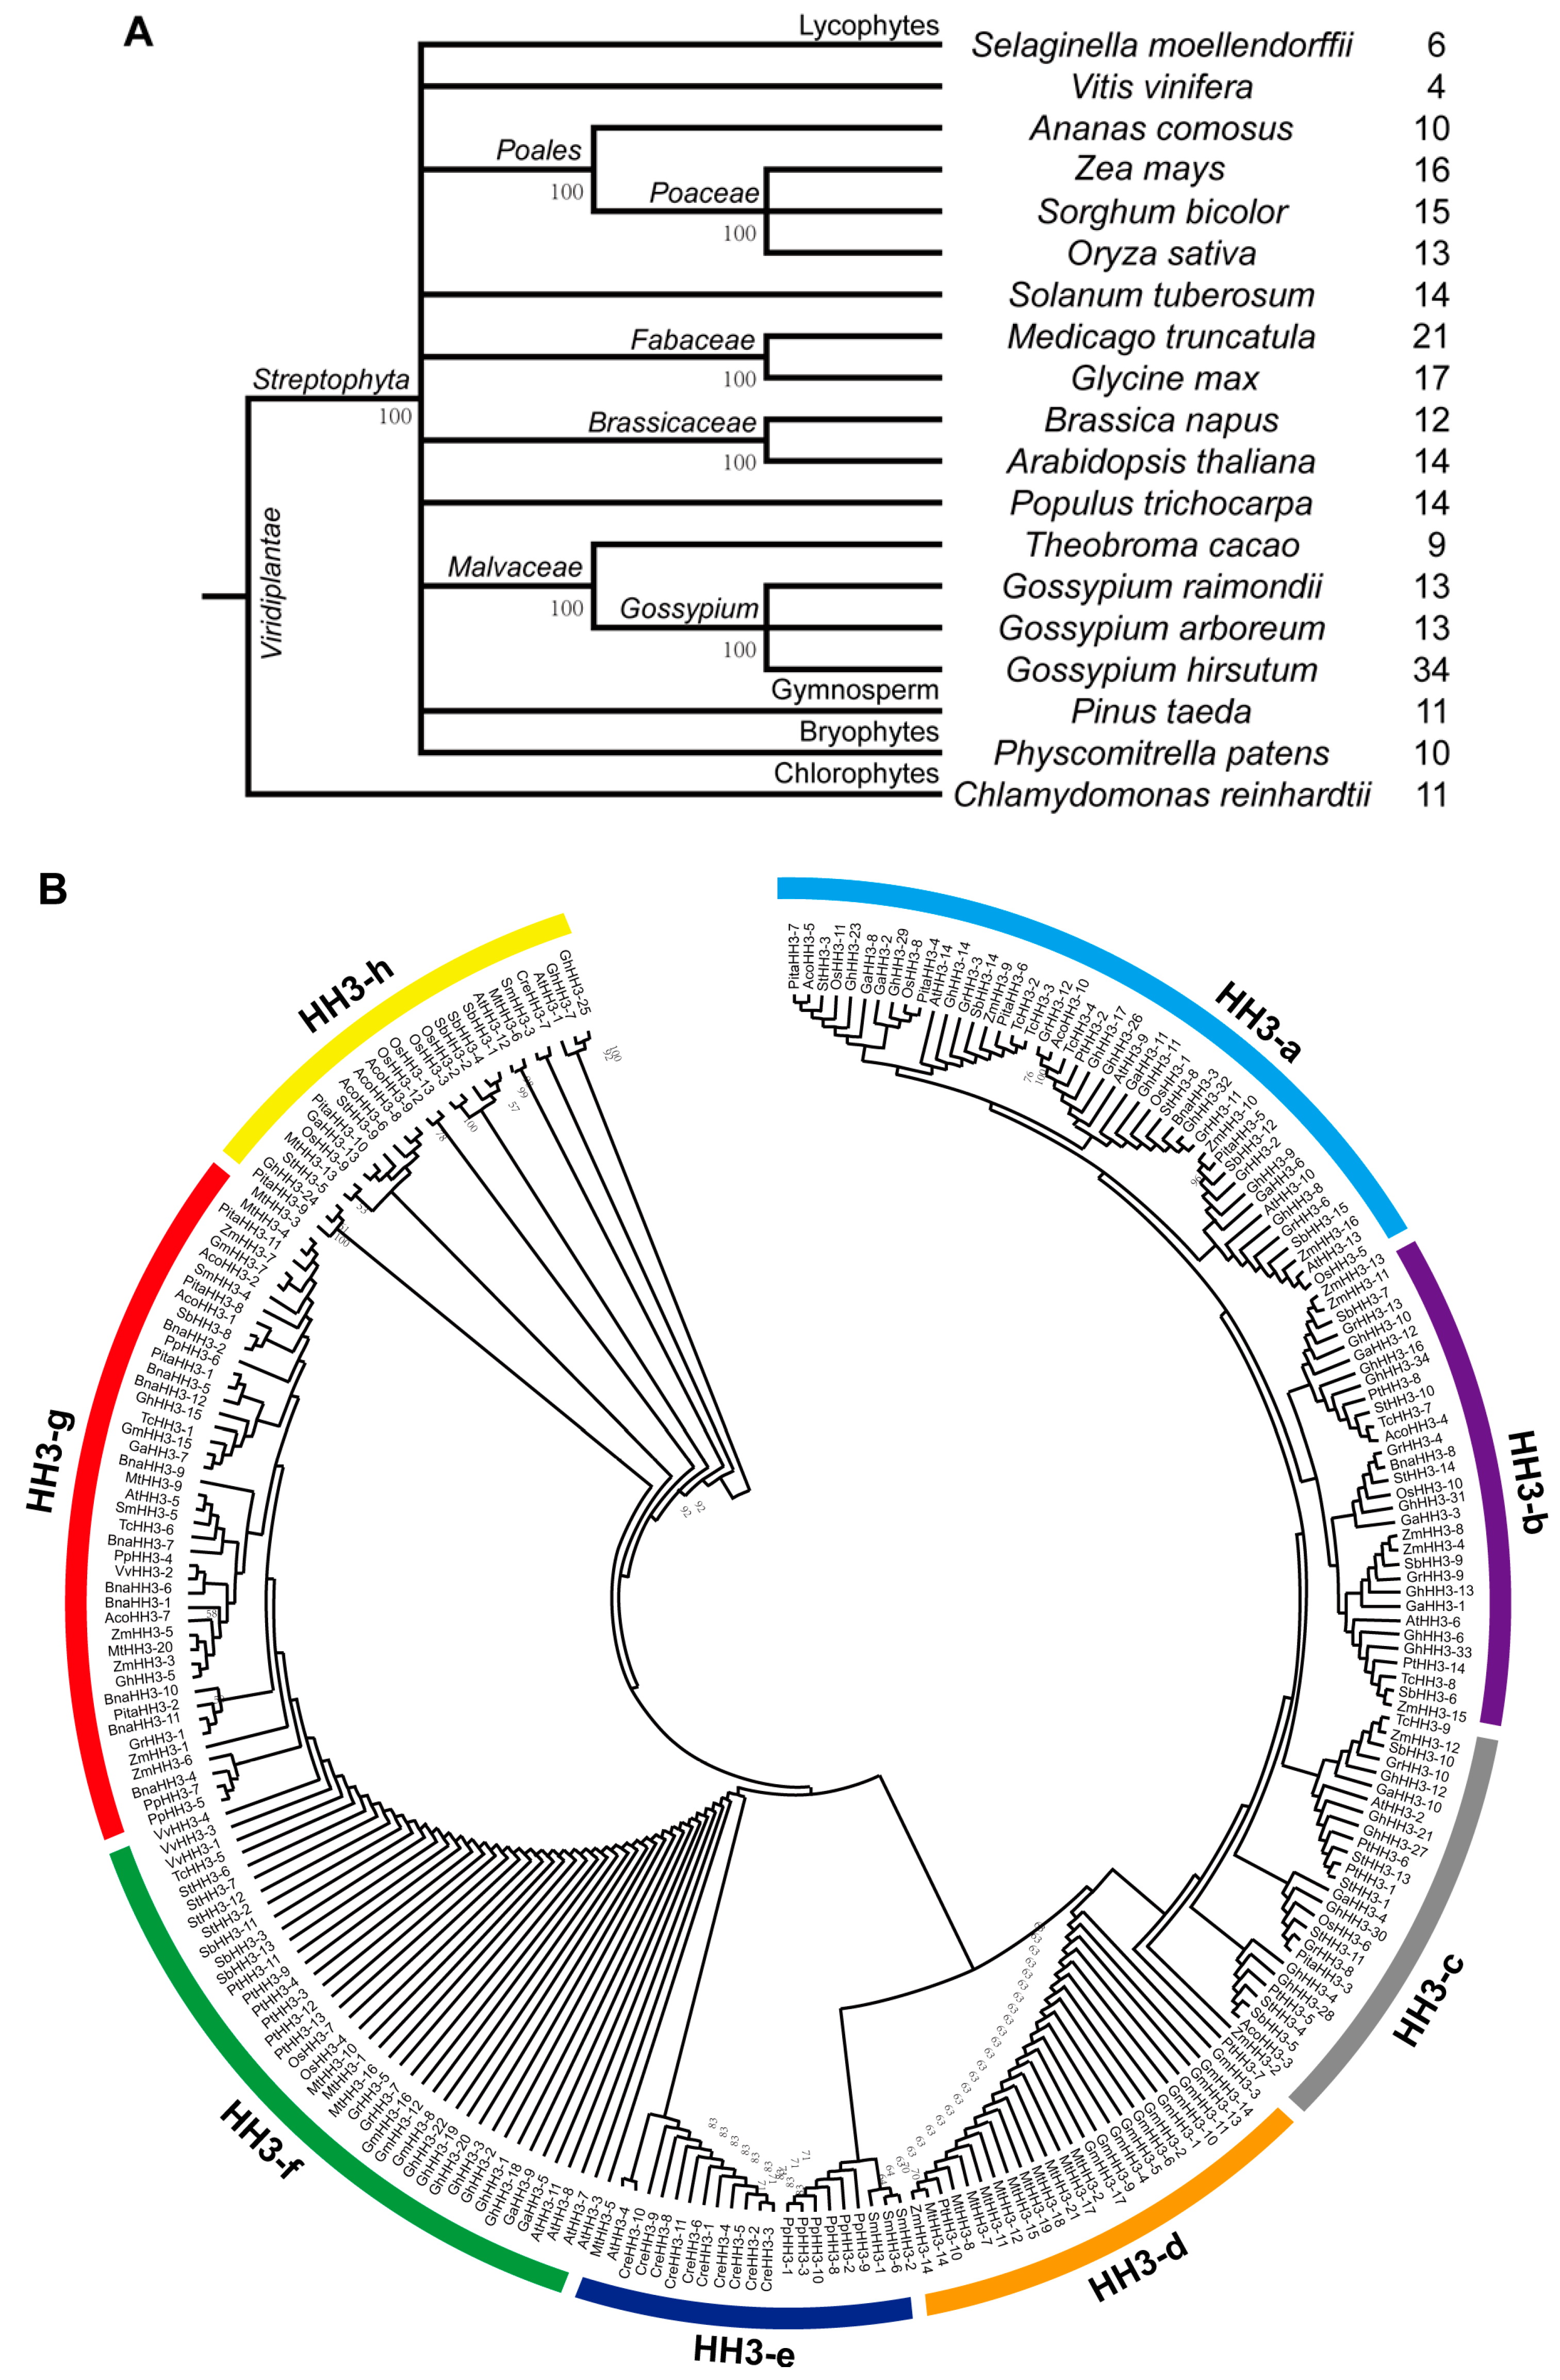
3.1. Identification of HH3 Family Members

We identified a total of 257 HH3 proteins among 19 different plant species with a combination of methods. Of these, 14 members belonged to Arabidopsis (six H3.1, seven H3.3, and one centromeric variant); 13 each from G. arboreum (nine H3.1 and four H3.3 variants) and G. raimondii (eight H3.1 and five H3.3 variants); 34 from G. hirsutum (twenty-three H3.1, nine H3.3, and two centromeric variants); 17 from G. max; 21 from M. truncatula; 13 from O. sativa; 14 from P. trichocarpa; 15 from S. bicolor; 14 from S. tuberosum; 9 from T. cacao; 4 from V. vinifera; 12 from B. napus; 16 from Z. mays; 10 from A. comosus; 11 from C. reinhardtii; 10 from P. patens; six from S. moellendorffii; and 11 genes from P. taeda. We found that almost all selected plants have at least four HH3 genes, with G. hirsutum having the highest number (34) of HH3 genes and V. vinifera having only 4 genes, indicating that HH3 genes were subjected to a large-scale expansion. (Table S2). These members of the HH3 gene family were confirmed using different bioinformatics approaches including InterProscan 63.0 (http://www.ebi.ac.uk/interpro/), SMART (http://smart.embl-heidelberg.de/), and PROSITE (http://prosite.expasy.org/). As our main focus was G. hirsutum, we compared the genes from two G. hirsutum sequenced genomes (NAU and BJI) and found that all the genes were highly similar and the genes from NAU contained all genes of BJI. We used the genes from the NAU genome sequence database for our subsequent analysis. In our study, HH3 genes in the AD cotton (G. hirsutum) genome were more than double the A (G. arboreum) and D genome (G. raimondii) cottons, which was consistent with tetraploid and diploid genomes and indicated the effects of polyploidy in AD genome cotton.
Further basic information of GhHH3 genes indicated the equal distribution on A and D chromosomes, as both had 17 genes. Their chromosomal location start and end points, strand, gene length, coding sequences (CDs), protein length, molecular weight (MW), isoelectric point (pl), gravity, and predicted cellular localization are provided in Table S3. GhHH3-5 had the maximum coding region length (1134 bp) while GhHH3-7 had only 297 bp of coding sequence. A similar pattern was observed for protein length and molecular weight of GhHH3 family genes. The isoelectric points were 9.67 and 11.85 for GhHH3-24 and GhHH3-7, respectively. Moreover, gravity was −0.607 and −0.047 for GhHH3-15 and GhHH3-24, respectively. However, predicted subcellular localization results indicted the cellular localization of all GhHH3 genes in the nucleus (Table S3).

3.2. Phylogenetic Analysis of HH3 Genes

The phylostratum analysis of the HH3 gene family identified the earliest plant lineage as HH3 genes were present in C. reinhardtii (chlorophyte), an early plant lineage (Figure 1A). HH3 genes were present in A. comosus (angiosperm), P. taeda (gymnosperm), P. patens (bryophytes), S. moellendorffii (lycophytes), dicotyledons (A. thaliana, G. arboreum, G. hirsutum, G. raimondii, B. napus, G. max, M. truncatula, P. trichocarpa, S. tuberosum, T. cacao, and V. vinifera), and monocotyledons (O. sativa, Z. mays, and S. bicolor). These results indicated that HH3 genes originated from early land plants’ phylostratum, and potential orthologous genes of HH3 are present throughout the plant kingdom. Next, we built an NJ tree to estimate the deeper relationship of HH3 genes of 19 plant species including dicotyledons (A. thaliana, G. arboreum, G. hirsutum, G. raimondii, B. napus, G. max, M. truncatula, P. trichocarpa, S. tuberosum, T. cacao, and V. vinifera), monocotyledons (O. sativa, Z. mays, and S. bicolor), A. comosus (angiosperm), P. taeda (gymnosperm), C. reinhardtii (chlorophyte), P. patens (bryophytes), and S. moellendorffii (lycophytes). The prefixes At, Ga, Gh, Gr, Bna, Gm, Mt, Pt, St, Tc, Vv, Os, Zm, Sb, Aco, Cre, Pp, Sm, and Pita were used before the names of HH3 genes from A. thaliana, G. arboreum, G. hirsutum G. raimondii, B. napus, G. max, M. truncatula, P. trichocarpa, S. tuberosum, T. cacao, V. vinifera, O. sativa, Z. mays, S. bicolor, A. comosus, C. reinhardtii, P. patens, S. moellendorffii, and P. taeda, respectively. The NJ tree showed that all 257 HH3 genes from 19 different plant species were naturally classified into eight clades, a–h (Figure 1B).
In this study, clade HH3-a contained the most HH3 genes (45 genes) followed by clade HH3-g (43 genes), clade HH3-f (40 genes), clade HH3-b (31 genes), clade HH3-c (27 genes), clade HH3-d (25 genes), clade HH3-h (25 genes), and clade HH3-e (21 genes). HH3-a and HH3-c clades contain genes from A. comosus (angiosperm), P. taeda (gymnosperm), dicots and monocots, except for S. moellendorffii (lycophytes), C. reinhardtii (chlorophyte), and P. patens (bryophytes). HH3-b lacks the genes from S. moellendorffii, C. reinhardtii, P. patens, and P. taeda, while HH3 genes from G. hirsutum, A. comosus, S. moellendorffii, C. reinhardtii, P. patens, and P. taeda were absent in HH3-d clade and have the majority of HH3 genes from G. max and M. truncatula. Similarly, HH3-e clade contains genes from S. moellendorffii, C. reinhardtii, and P. patens, except for one gene from A. thaliana and M. truncatula. HH3 genes from A. comosus, S. moellendorffii, C. reinhardtii, P. patens, and P. taeda were absent in HH3-f clade. However, HH3 genes from C. reinhardtii and P. patens were absent in HH3-g and HH3-h clades respectively. Among the eight clades, HH3 genes from G. hirsutum were distributed in six clades (except HH3-d and HH3-e) of the phylogenetic tree. All clades (except HH3-e) clustered genes from both monocot and dicot plant species, indicating that the HH3 gene family existed before the separation of mono- and dicotyledons. Although genes from dicots or monocots were closely clustered to each other, G. hirsutum experienced a significant increase in genes as their members were more than double all other observed species, except for M. truncatula. Gene enlargement in G. hirsutum can be observed in our phylogenetic analysis, as its nine pairs of genes were closely clustered to each other. Further, paralogous gene pairs derived from the same node were observed in almost all observed species (except P. taeda), even V. vinifera, although it only had four HH3 members (Figure 1B). These paralogous pairs were the result of duplication and indicated that HH3 genes experienced a duplication event in their evolution that contributed toward gene family expansion. However, this duplication was uneven in all clades and different species.

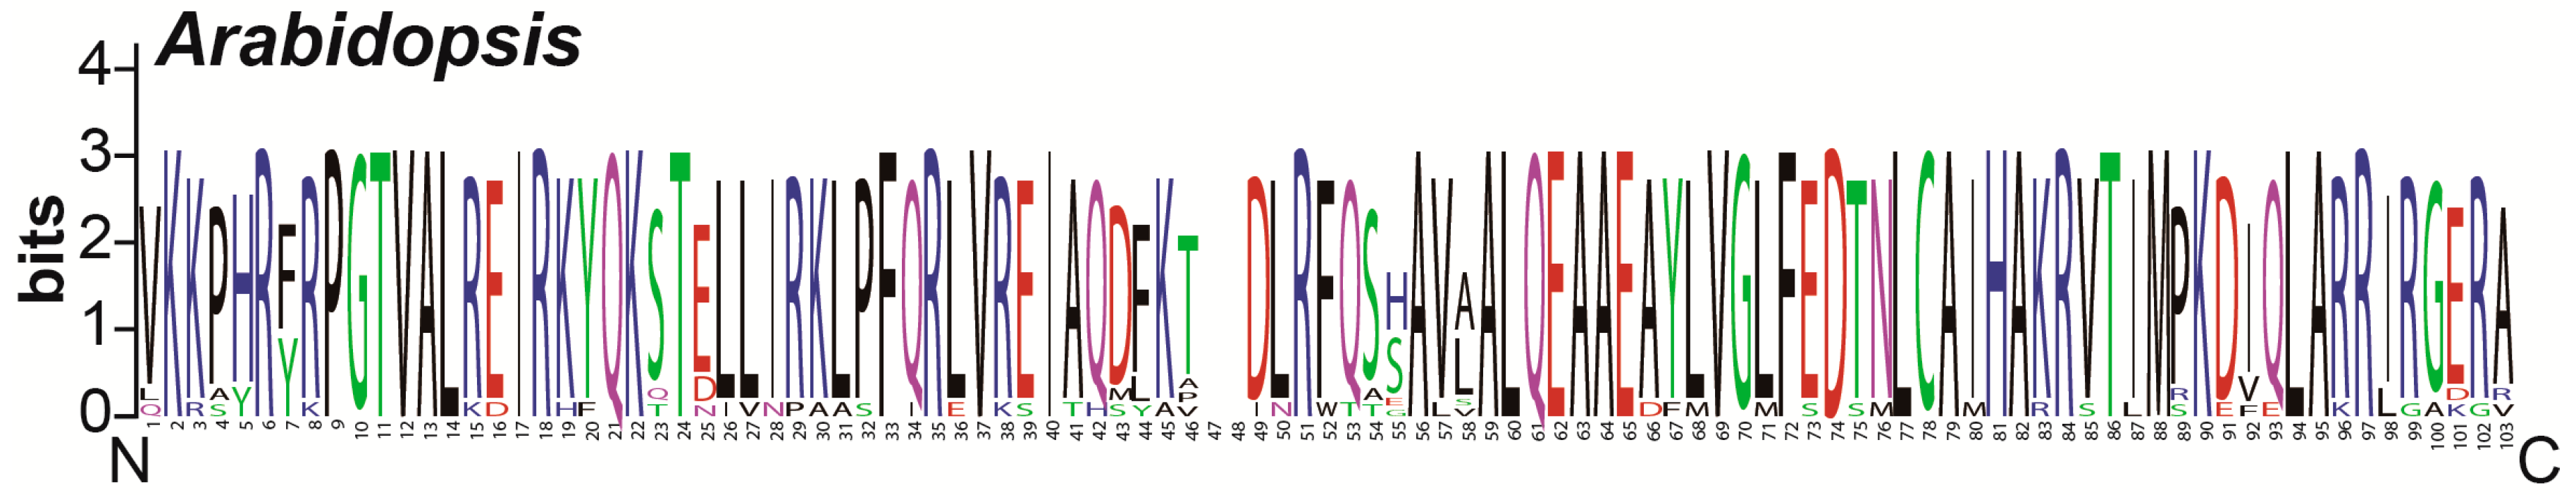
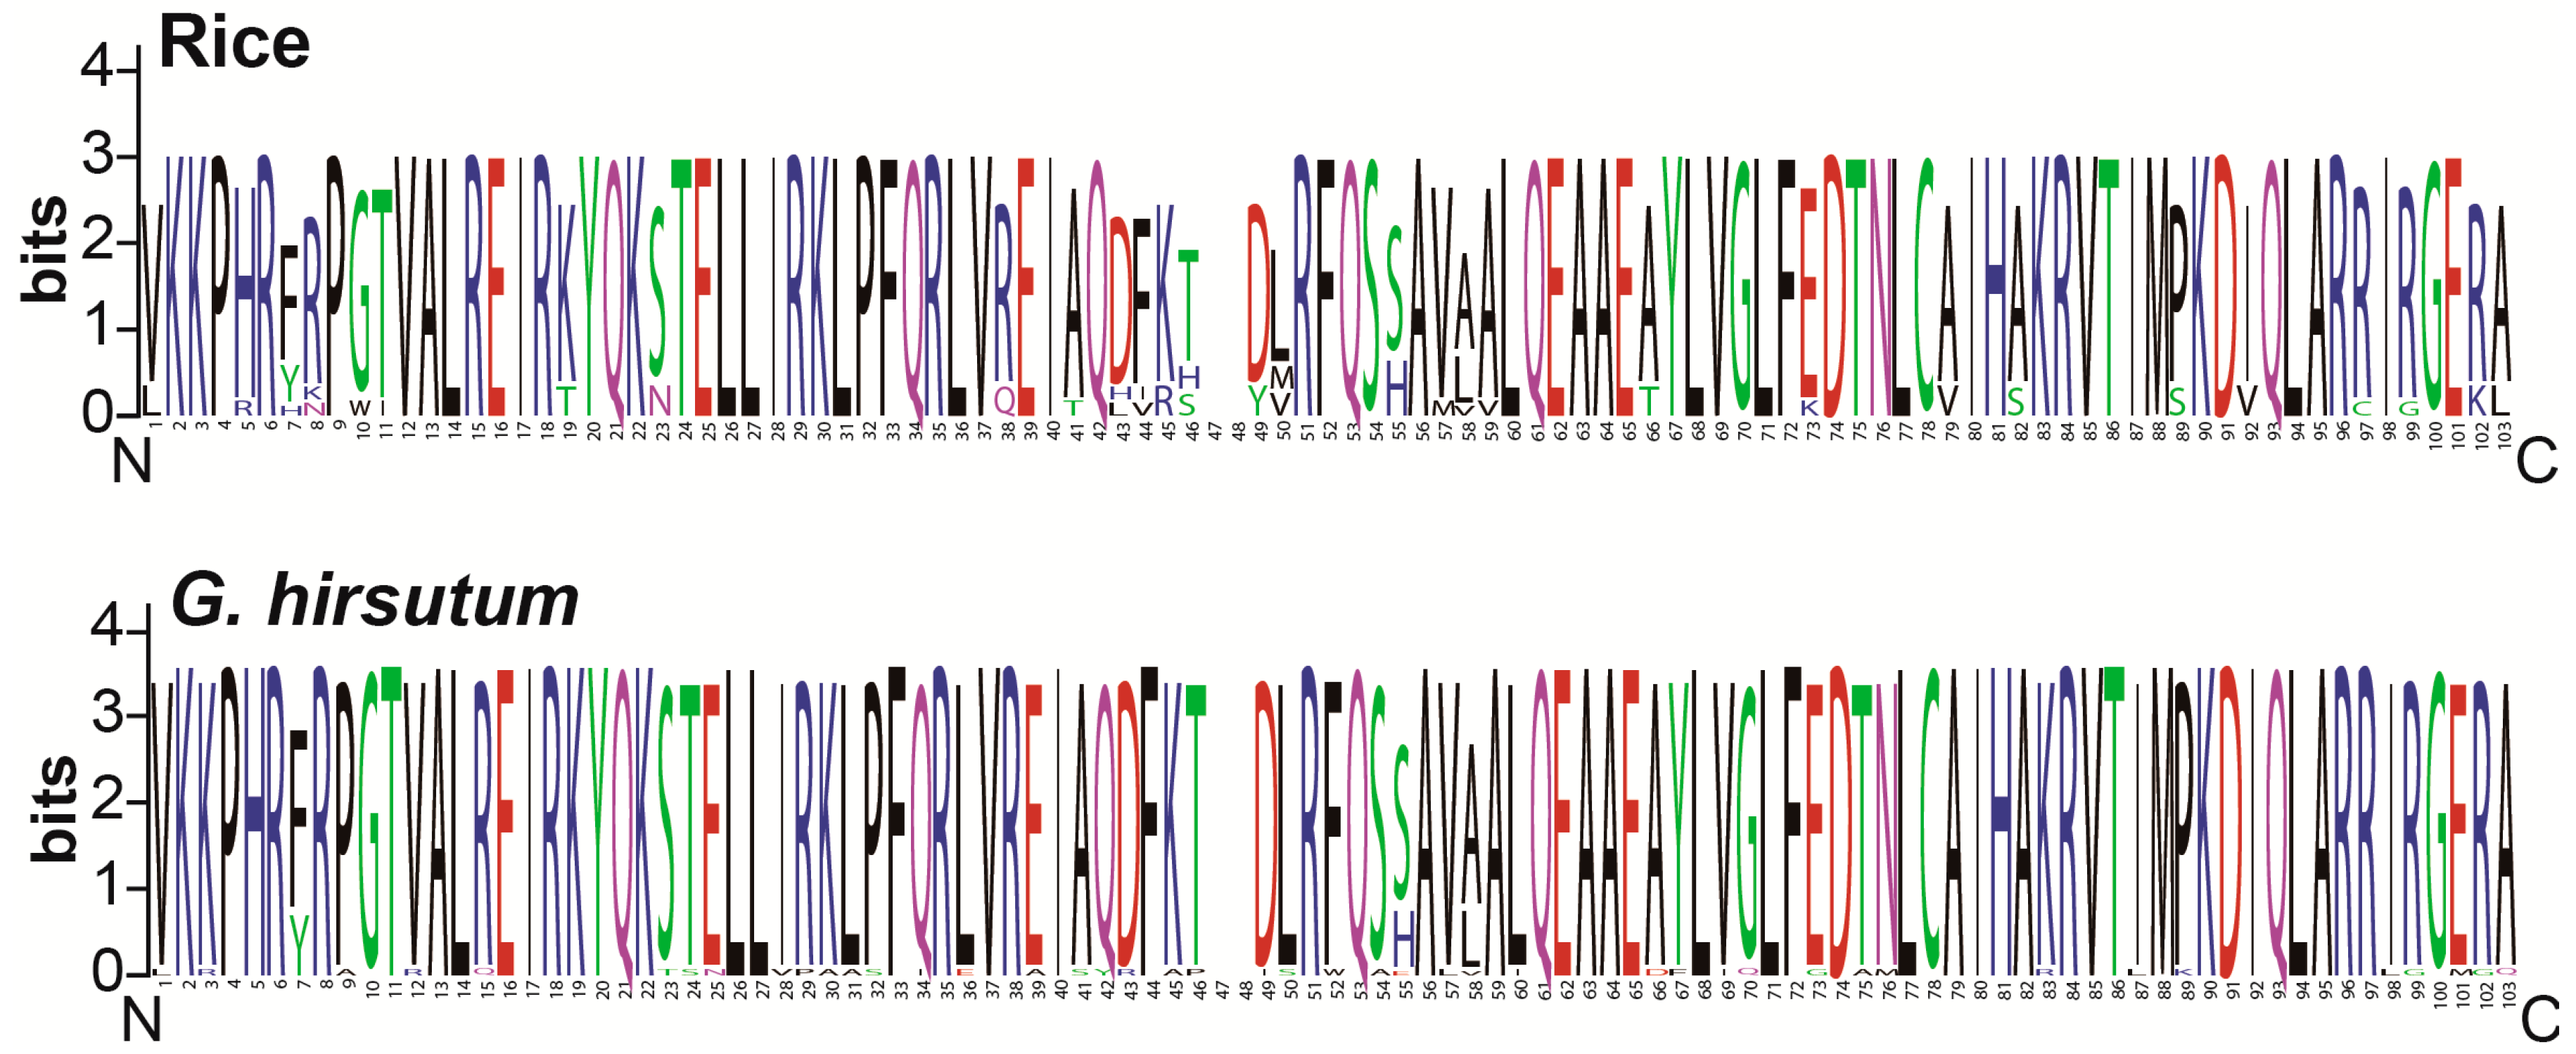
3.3. Conserved Amino Acid Residues Analysis

To find homologous domain sequences and to investigate the conservation of each amino acid residue in GhHH3 domains, a multiple sequence alignment was performed to construct sequence logos in Arabidopsis, rice, and G. hirsutum. The results indicated that the amino acid residue distribution was highly similar at most of the loci among all three observed plant species. For instance, some amino acid residues including V [1], K [2], K [3], P [4], H [5], R [6], P [9], V [12], A [13], L [14], R [15], E [16], R [18], Q [21], K [22], T [24], E [25], L [26], L [27], R [35], L [36], V [37], I [39], R [40], A [41], A [42], L [43], Q [44], E [45], A [46], A [47], E [48], and so on were found to be highly conserved. No composition bias of any specific conserved amino acid residue was observed in any region, suggesting a highly conserved distribution pattern irrespective of the N or C terminal end of their domain in all observed species (Figure 2).

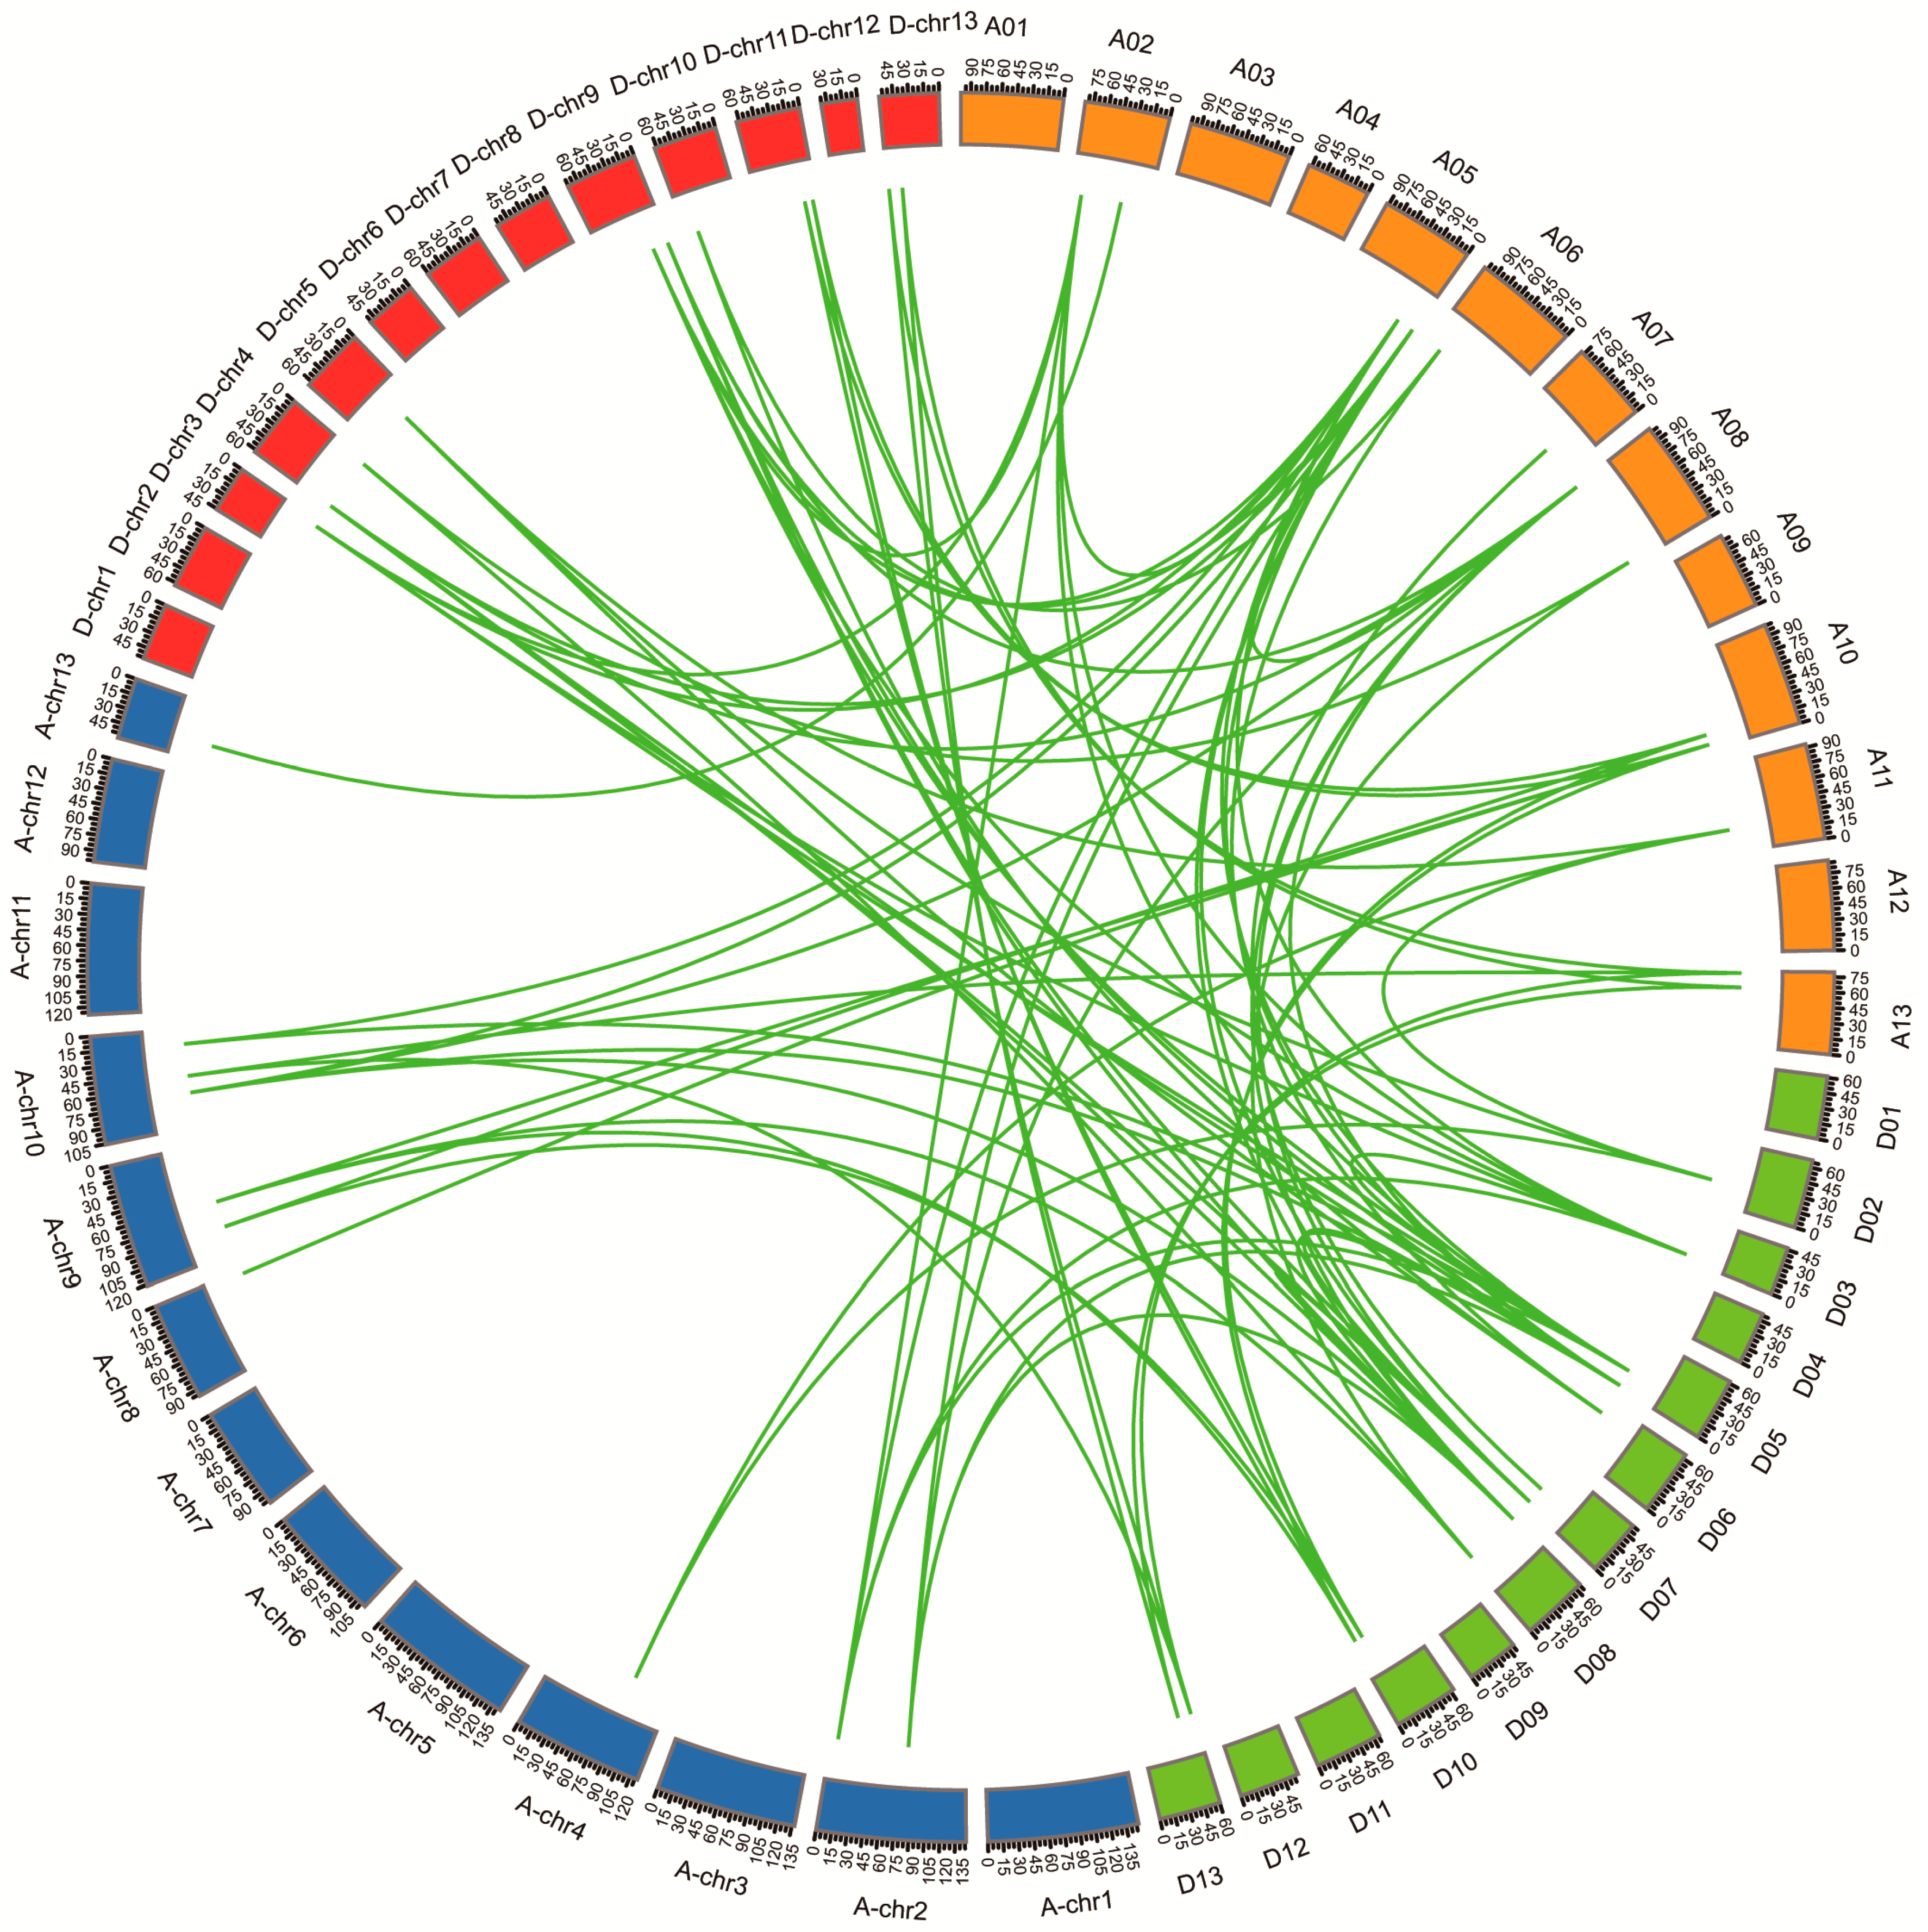
3.4. Chromosomal Locations, Duplication, and Collinearity Analysis of GhHH3 Members

Next, we mapped the GhHH3 genes onto their corresponding chromosomes with the GFF3 file. The GhHH3 genes were found to be equally distributed on At and Dt sub-genome chromosomes of AD cotton. All 34 GhHH3 genes were allotted to eight At sub-genomes as well as to eight Dt sub-genome chromosomes (Figure S1). In total, 17 GhHH3 genes were allotted to the At sub-genome and to the Dt sub-genome chromosomes, indicating the equal distribution of GhHH3 genes in both sub-genomes. A maximum number of genes (four genes) was allotted to A10 and its corresponding D10 chromosome. However, D02, A06, D06, A07, and A11 contained only one GhHH3 gene. A previous report indicated that translocation occurs between the A02 and A03 chromosome [22], which might be the major cause of gene distribution on homologous chromosomes. In contrast, no genes were mapped on A01, D01, A03, A04, D04, A09, D09, D11, A12, and D12 chromosomes. The equal number of genes mapped on chromosomes of At and Dt sub-genomes indicated that some genes might be lost during the process of evolution or that incomplete genome sequencing led to the identification of fewer genes than their actual numbers.
As an allotetraploid, G. hirsutum serves as a model to study the effect of naturally occurring polyploidy [24]. In order to study the locus relationship between the orthologous of At and Dt sub-genomes, collinearity analysis was performed. The analysis showed that most GhHH3 gene loci were highly conserved between the At and Dt sub-genomes (Figure 3 and Table S4). G. hirsutum is derived as the result of hybridization of two diploid cotton species resembling G. arboreum and G. raimondii and subsequent doubling of chromosomes [39,49]. In our study, we observed that each gene of the At or Dt sub-genomes had orthologous on A or D genomes and similarly the genes of any one of these four genomes (A, D, At, and Dt) had orthologous on any of the other three genomes. These findings indicated that cotton HH3 genes were not subjected to genomic rearrangements during the event leading to polyploidy. Collinearity analysis indicated that two paralogous gene pairs were found within the At sub-genome (Figure 3 and Table S4). Overall, a total of 81 orthologous/paralogous gene pairs were identified among four genomes (A, D, At, and Dt). Coupled with these findings, we deduced that orthologous/paralogous gene pairs were derived as a result of a segmental or whole genome duplication (WGD) event before polyploidy occurred.
Over evolutionary time, the duplicated genes experienced functional divergence including non-functionalization (lack of original functions), sub-functionalization (partition of original functions), and neo-functionalization (acquiring new functions) [50,51]. To check whether Darwinian positive selection pressure is also related to the divergence of GhHH3 family genes after duplication, we calculated the Ka/Ks (non-synonymous/synonymous) ratio of all identified orthologous/paralogous gene pairs. It has been established that Ka/Ks = 1.0 represents pseudogenes as a result of neutral selection, Ka/Ks < 1.0 demonstrates the tendency of duplicated genes for purifying selection, while ratio of Ka/Ks >1.0 exhibits positive selection of accelerated evolution. We found that the Ka/Ks ratio for 70 gene pairs were < 0.5, while that for eight gene pairs was between 0.5 and 1.0, and three exhibited a Ka/Ks ratio > 1.0 (Table S4), indicating that these three gene pairs experienced rapid evolution following duplication. As most Ka/Ks ratio were less than 1.0, we speculated that cotton HH3 genes were subjected to strong purifying selection pressure with restricted functional divergence as the result of segmental and whole genome duplication (WGD).

3.5. Promoter Cis-Element, Gene Structure, and Domain Architecture of the GhHH3 Gene Family

To investigate transcriptional regulation as well as the potential functions of GhHH3 genes, we predicted cis-elements in their promoter region and categorized them according to their related roles in plant growth and development, light, and stress responses. We found that the promoters of GhHH3s contain various cis-elements related to growth, development, light, and stress responses (Table S5). Most of the gene promoter regions contained various elements for plant growth and development including Skn-1, 3-AF1 binding site, CCGTCC-box, GCN4_motif, CAT-box, Sp1, circadian, dOCT, O2-site, and as-2-box. Similarly, light responsive cis-elements such as ACE, AE-box, ATCT-motif, Box 4, Box I, GA-motif, GAG-motif, GATA-motif, GT1-motif, MRE, and I-box were also detected in the promoters of various GhHH3 genes. Further, ARE, Box-W1, CGTCA-motif, EIRE, ERE, GARE-motif, HSE, LTR, P-box, TC-rich repeats, TCA-element, TGA-element, TGACG-motif, and W box were also found in many gene promoter regions, depicting their relatedness to various stress responses.
It has been reported that gene structure is associated with the evolution of different plant species [52], so gene structure analysis was used along with phylogenetic relationships to elucidate the evolutionary relationship among GhHH3 genes. An NJ tree was generated and with exon/introns and different motifs comprising the GhHH3 gene family (Figure S2A,B). All members of the GhHH3 gene family lack introns and have only one exon (Figure S2A). Moreover, all GhHH3 genes from At and Dt sub-genomes displayed a significant conserved motif pattern, as all the genes have the same motifs, except for GhHH3-24, GhHH3-5, GhHH3-7, and GhHH3-25 (Figure S2B). Overall, all genes exhibited a highly conserved pattern of gene structure and motif throughout At and Dt sub-genomes.

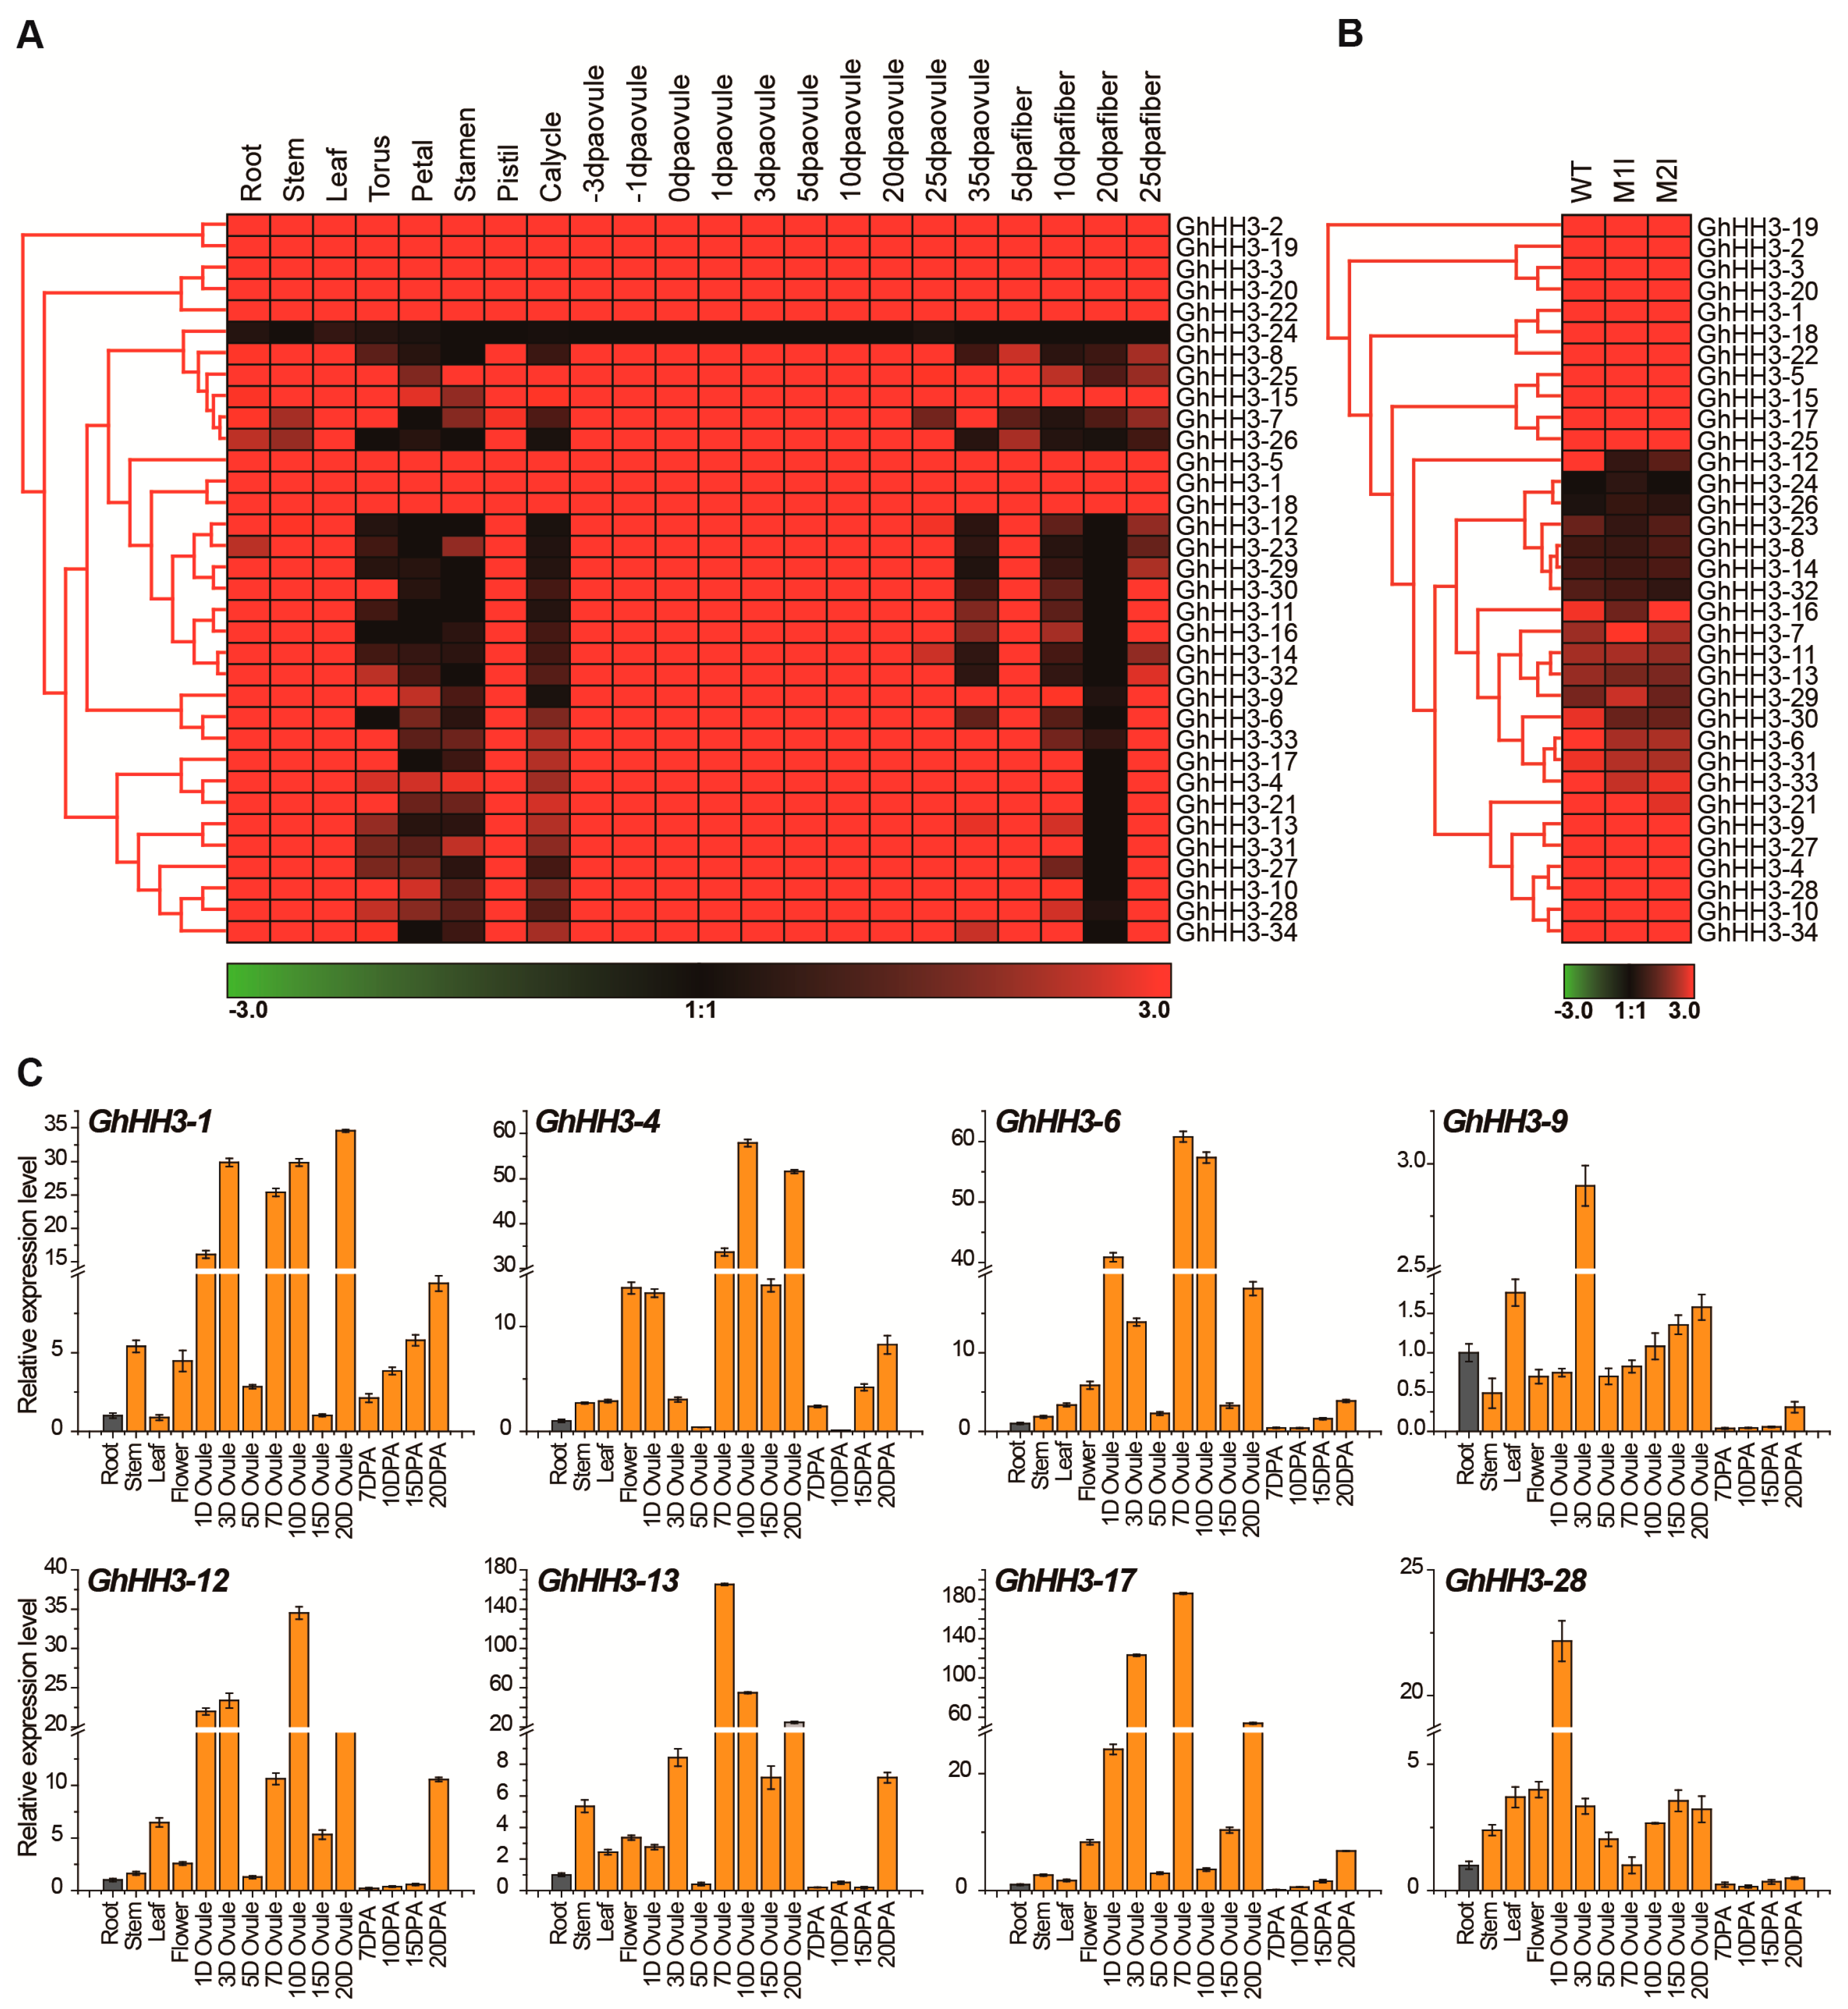
3.6. Expression Profiles of GhHH3 Members in Various Tissues and Developmental Stages

Gene expression predicts the biological functions of a gene, so we inspected the expression pattern of GhHH3 genes in different cotton tissues. First, we analyzed publicly available transcriptomic data downloaded from the National Center for Biotechnology Information (NCBI) (https://www.ncbi.nlm.nih.gov/pmc/articles/PMC4482290/) [53] and a heat map of all 34 GhHH3 genes for 22 different tissues was created (Figure 4A). We observed that all GhHH3 genes (except GhHH3-24) were widely expressed in vegetative (root, stem, and leaf) and reproductive (torus; petal; stamen; pistil; calycle; −3, −1, 0, 1, 3, 5, 10, 20, 25, and 35 DPA ovules) tissues, and fiber (5, 10, 20, and 25 DPA), demonstrating that GhHH3 genes play various biological functions. Some GhHH3 genes were not expressed in torus, petal, and stamen or at different fiber developmental stages. All genes expressing similar expression patterns were found closely clustered to each other. Further, we investigated the expression levels of GhHH3 genes in RNA-seq data of two fuzzless/lintless mutants (M1l and M2l) [54,55]. The results of the heat map indicated that in the M1l mutant, 11 GhHH3 genes were upregulated, while only 3 genes were downregulated. Similarly, 3 genes were found to be upregulated, while 10 genes were downregulated in the M2l mutant compared with wild type (WT). However, the GhHH3-24 expression level was not affected in either mutant. Overall, 2 genes were upregulated, and 16 genes were downregulated commonly in both observed mutants (Figure 4B and Table S6).
Fiber is the most important yield trait of cotton crop, so we selected 8 GhHH3 genes from 16 downregulated genes in both M1l and M2l mutants having significant differences. GhHH3-19, which has the common name GhHis3, was not highly expressed in the observed mutants, so it was used as a reference gene (internal control) for gene expression during qRT-PCR analysis in G. hirsutum [56]. The eight selected GhHH3 genes were further used to estimate tissue specific expression levels by qRT-PCR in root, stem, leaf, flower, ovule (1, 3, 5, 7, 10, 15, and 20 DPA ovule), and fiber (7, 10, 15, and 20 DPA fiber) to validate the previous findings (Figure 4C). The results indicated that all eight observed genes exhibited ubiquitous expression patterns in all observed tissues. Consistent with transcriptomic data analysis, all genes except GhHH3-1 had downregulated expression in different fiber stages, except at 20 DPA. Moreover, all observed genes had maximum expression in different stages of ovule (except for some stages at only some stages), similar to the transcriptomic data. This result indicated the validity of our findings and demonstrated that GhHH3 genes might play functional roles in different stages of ovule development, as all genes had conserved expression in ovule development. From here, we may speculate that GhHH3 genes were preferentially expressed in different stages of ovule development, elucidating their conserved role with limited functional divergence during evolution.

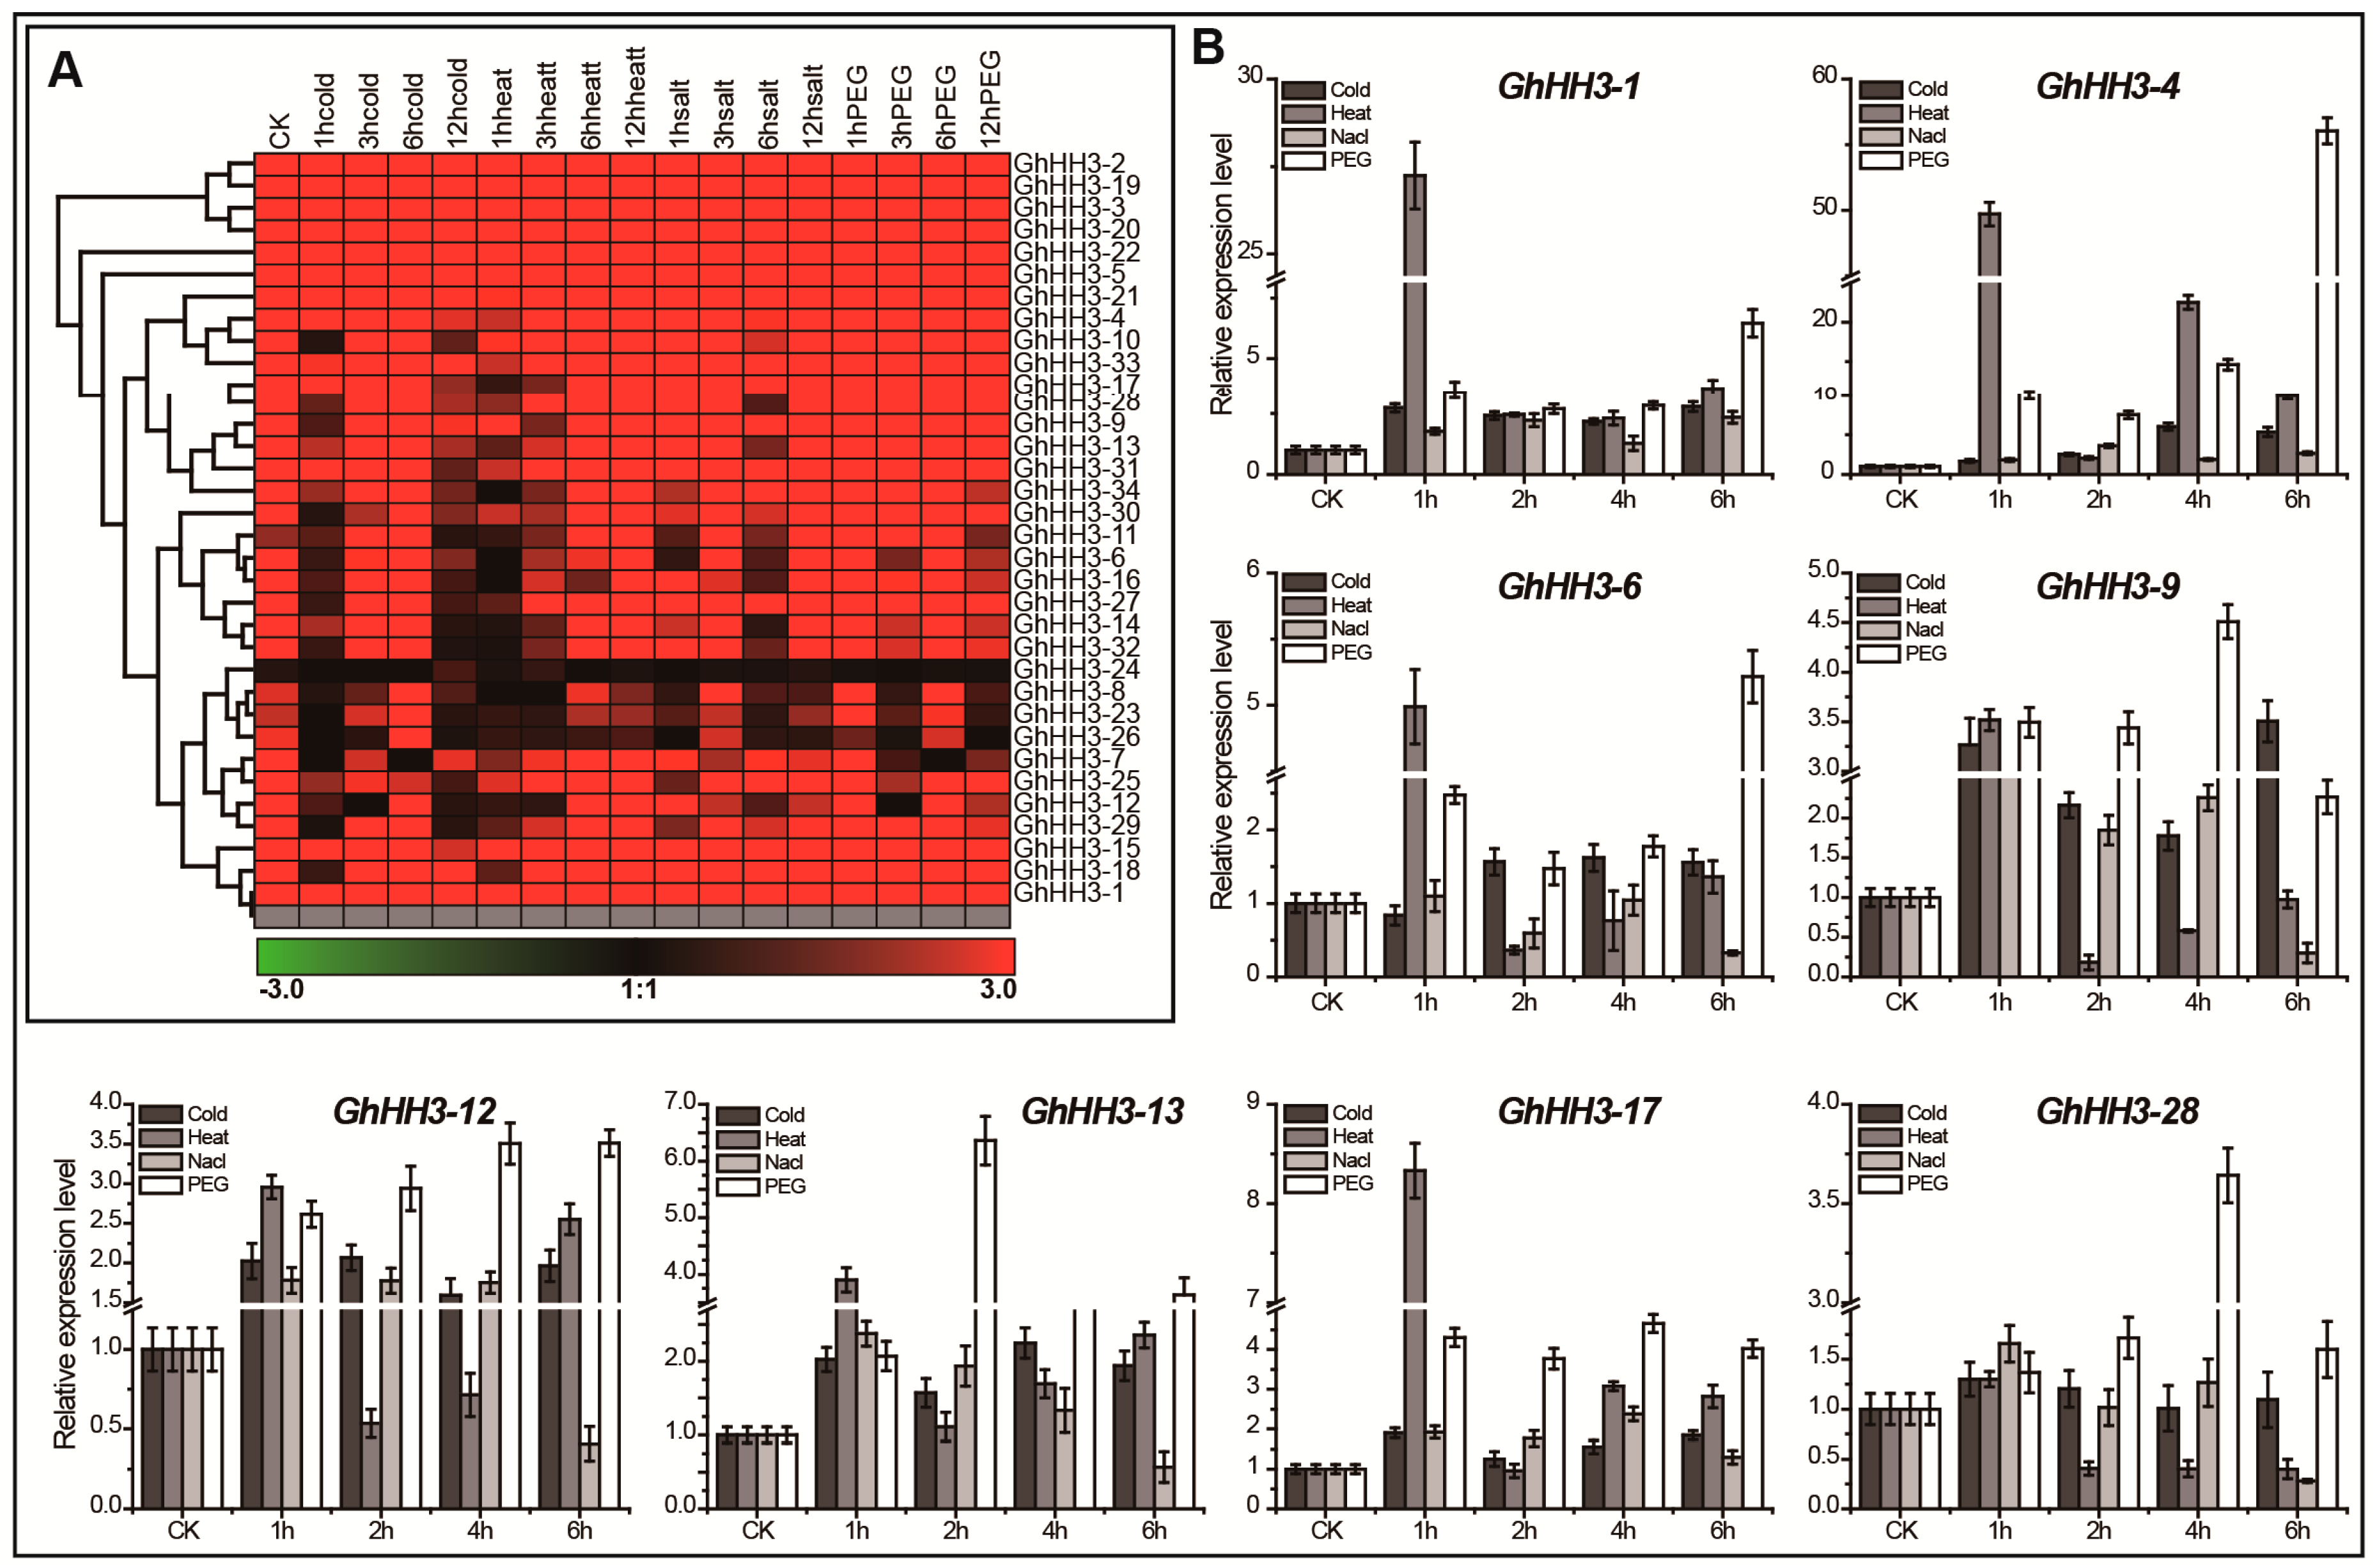
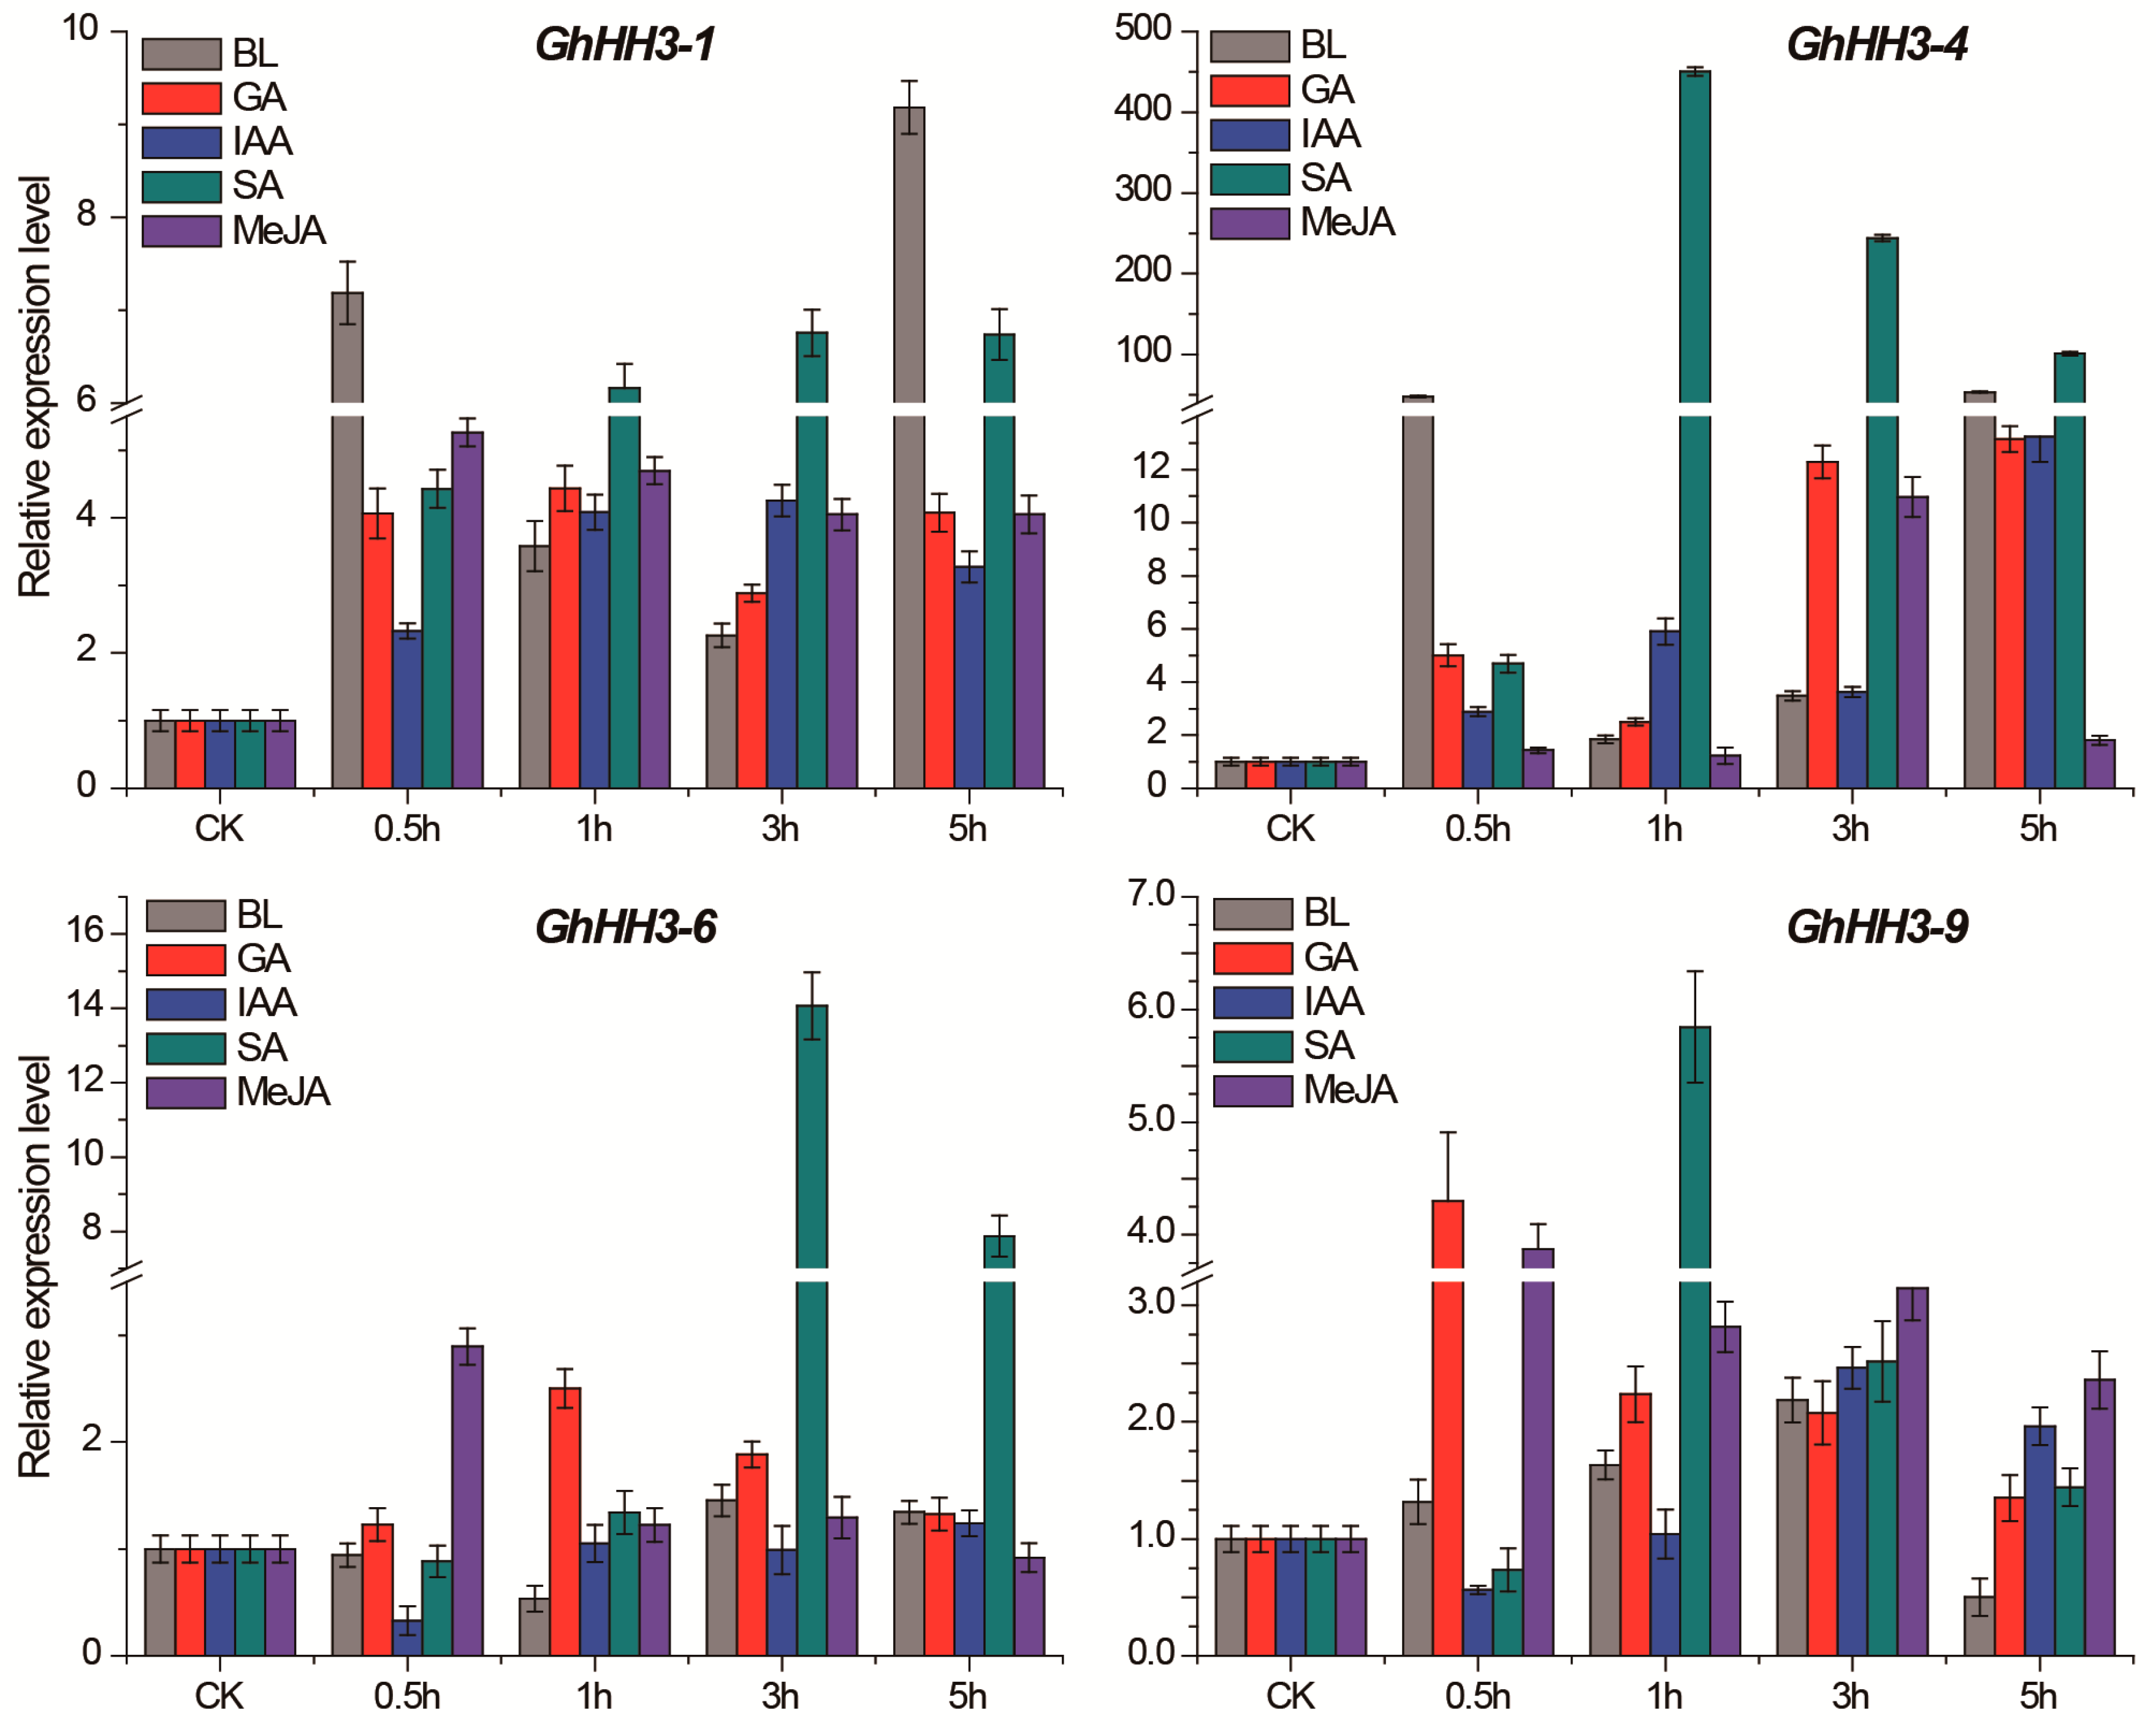
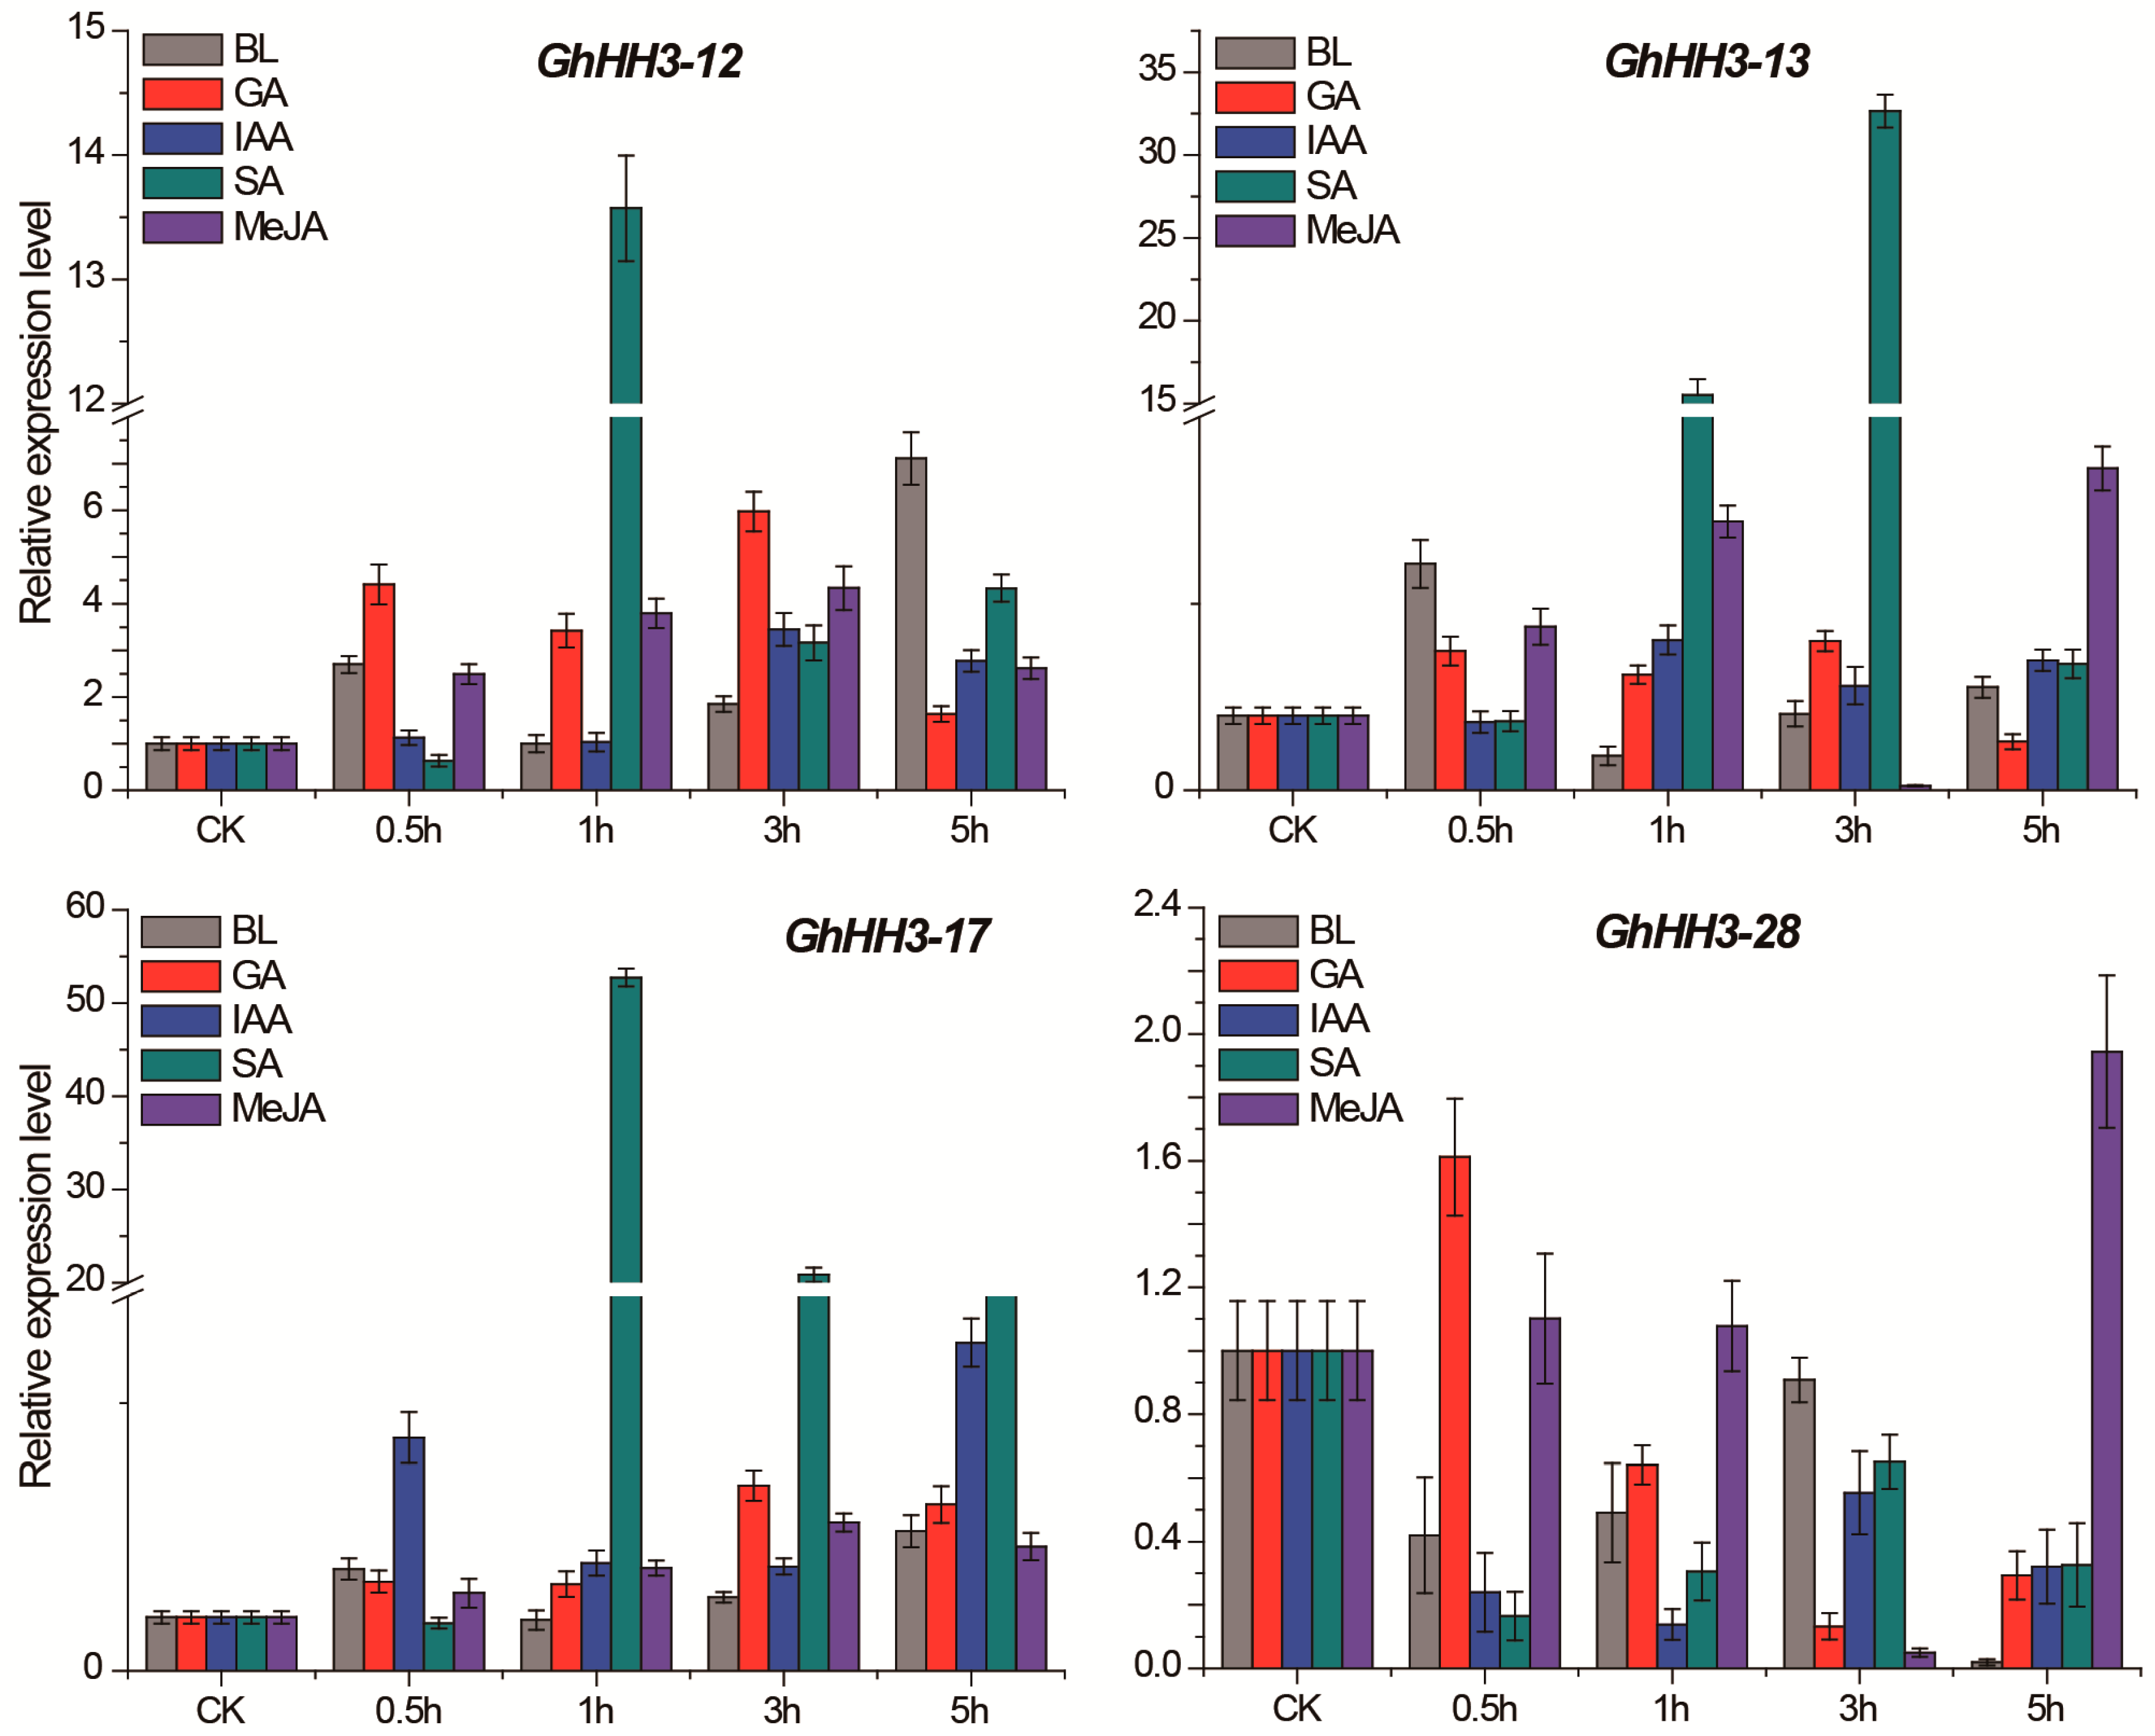
3.7. Responses of GhHH3 Members Under Various Abiotic Stresses and Phytohormonal Treatments

Cotton experiences various abiotic and hormonal stresses during its growth and development. Therefore, a comprehensive analysis of GhHH3 gene expression under various abiotic stresses including cold, heat, salt, and PEG was performed in this study. First, we estimated the expression level of all 34 GhHH3 genes using available transcriptomic data [22] and a heat map was generated. Genes depicting a similar response to different stresses were clustered together (Figure 5A). All genes showed widely variable responses and were upregulated (except GhHH3-24) under all observed stresses. However, the responses of some genes (including GhHH3-8, GhHH3-23, and GhHH3-26) were poor, but still upregulated at various stages. Further, the responses of eight selected genes under cold, heat, NaCl, and PEG were observed at different time points after treatment via qRT-PCR analysis (Figure 5B).
All genes had an upregulated response many times higher than that of the control at different time points for each treatment (except at some time points for different treatments). Additionally, GhHH3-1, GhHH3-4, and GhHH3-17 were fully upregulated at each time point for every stress stimulus. Moreover, GhHH3-9 and GhHH3-12 had downregulated expression only on heat exposure after 2, 4, and 6 h of treatment. Furthermore, GhHH3-13 was only downregulated at 6 h after NaCl treatment only; otherwise, it was upregulated at all time points after every stress stimulus. Together with these findings, GhHH3 genes exhibited obvious resistance against observed abiotic stresses, as their expression can be regulated by multiple stresses, suggesting that GhHH3 genes are possible candidates for breeding stress resistant cotton.
To explore the functional and physiological relevance of GhHH3 genes, we analyzed the expression pattern of eight selected genes under exposure to five phytohormonal stress stimuli including BL, GA, IAA, SA, and MeJA after 0.5, 1, 3, and 5 h of treatment (Figure 6). All GhHH3 genes were found to be regulated by different phytohormones. Seven out of eight observed genes (except GhHH3-28) were highly upregulated on each phytohormonal exposure, except for slight downregulation at some points for specific hormones. Further analysis demonstrated that GhHH3-1, GhHH3-4, and GhHH3-17 were highly and significantly upregulated at different time points with different hormones. Only GhHH3-28 was downregulated for most time points, except at a few including 0.5 h after GA and 0.5, 1, and 5 h after MeJA treatment. All genes except GhHH3-28 were highly upregulated at 1 and 3 h after SA treatment. Moreover, expression of all genes (including some time points in the case of GhHH3-28) was positively regulated at all time points after MeJA treatment. In conclusion, GhHH3 genes might play vital roles in phytohormonal cotton biology, as depicted by their regulation via various hormonal stress stimuli, and could prove an important resource for cotton biology improvement and subsequent studies.

4. Discussion

Extensive studies have been conducted to explore the roles and biological functions of histone H3 genes, as well as histone modification in various plant species [1,3,5,15,16,40,41,42,43,57,58,59,60,61,62,63,64]. The analysis of the HH3 gene family has been employed in Arabidopsis and rice in previous reports [1,2]. However, no systematic analysis of HH3 genes in cotton has been performed to date. In the current study, we performed a comprehensive analysis of HH3 genes in G. arboreum, G. hirsutum, and G. raimondii, but mainly focused on G. hirsutum to explore the roles of the HH3 gene family in cotton that might help to lay a foundation for their future study.

4.1. Cotton HH3s Have Been Highly Conserved During Evolution

In the current study, we identified 257 HH3 genes in 19 different plant species including dicotyledons (A. thaliana, G. arboreum, G. hirsutum, G. raimondii, B. napus, G. max, M. truncatula, P. trichocarpa, S. tuberosum, T. cacao, and V. vinifera), monocotyledons (O. sativa, Z. mays, and S. bicolor), A. comosus (angiosperm), P. taeda (gymnosperm), C. reinhardtii (chlorophyte), P. patens (bryophytes), and S. moellendorffii (lycophytes). Previously, 15 and 16 HH3 genes were reported in Arabidopsis and rice genomes, respectively, but evolutionary analyses of these genes have been conducted separately [1,2]. The phylostratum analysis of the HH3 gene family identified the earliest plant lineage as HH3 genes were present in C. reinhardtii (chlorophyte), indicating that HH3 genes originated from early land plants’ phylostratum, and potential orthologous genes of HH3 are present throughout the plant kingdom. Phylogenetic analysis indicated that all HH3 genes can be naturally classified into eight major clades. Phylogenetic tree showed that HH3-g and HH3-h clades are ancient groups having HH3 genes from all selected plant species except C. reinhardtii and P. patens, respectively, while the HH3-f clade could be more advance than others, lacking HH3 genes from A. comosus, S. moellendorffii, P. taeda, C. reinhardtii, and P. patens. The presence of HH3 genes in each selected plant species, with 34 HH3 genes from G. hirsutum and V. vinifera having only four genes, demonstrated that HH3 genes are evolutionarily conserved and experienced a large-scale expansion in plants. Further, in seven clades, the genes from monocots and dicots were evenly distributed, suggesting that the HH3 gene family is an ancient gene family in plants. Previously, the phylogenetic analysis of HH3 genes has been conducted in Arabidopsis and rice. There have been no phylogenetic analyses of HH3 among dicotyledons, monocotyledons, angiosperm, gymnosperm, chlorophyte, bryophytes, and lycophytes.
In this study, multiple sequence alignment used to generate sequence logos of conserved amino acid residues for monocots (rice) and dicots (Arabidopsis and G. hirsutum) indicated no composition bias of any specific conserved amino acid residue. In addition, all three observed species sequence logos were highly conserved, irrespective of N or C terminus. Previous reports indicated that histone proteins are highly conserved even in different plant species, although a series of variants have been discovered on the basis of amino acid differences in their sequences. These differences might range from a few amino acids to a large portion of a protein. Histone variant H3 was found to be positively associated with gene transcription. Previous genome-wide analysis of HH3 enrichment was observed toward promoters and transcription termination sites [3,4,5]. In the current study, amino acid residues in sequence logo analysis such as V, K, K, P, H, R, P, V, A, L, R, E, R, Q, K, T, E, L, L, R, L, V, I, R, A, A, L, Q, E, A, A, E, and so on were highly conserved.
The molecular weight, isoelectric point, and predicted subcellular localization of these genes were almost the same. The promoter sequences of all GhHH3 genes had almost the same distribution of cis-elements related to growth and development, as well as light and stress responses. Various studies have elucidated the high impact of light on plant growth and differentiation [44]. Cis-elements such as heat stress response element [45], abscisic acid (ABA) responsive elements [46], and dehydration-response elements [47] have been identified. Further, cis-elements for cold, TCA, and CGTCA elements regulate gene expression following exposure to MeJA and SA stress, respectively [48,65]. Moreover, TATC, P-box, and ethylene responsive elements were also observed. Additionally, presence of W-box conferred responses to ABA and drought stress [66]. The majority of GhHH3 genes containing these elements with typical features demonstrated the predicted functions in growth, development, abiotic, and hormonal stresses.
The distribution of GhHH3 genes on corresponding chromosomes illustrated the equal distribution on At- and Dt- sub genome chromosomes, as both contain 17 genes. Gene structure and protein motif distribution of all GhHH3 genes, except for a few, were highly similar, demonstrating that GhHH3 genes were highly conserved. It has been reported based on gene structure that introns played essential roles during the evolution of various plant species [52]. The established phenomenon is that there were more introns during the early expansion phase, followed by a subsequent decrease over time [67]. These findings showed that more advanced species had fewer introns in their genomes [68]. More or larger introns lead toward the generation of new functions.
Tandem duplications result in an increase in introns and the subsequent generation of some new genes [69]; however, we did not find evidence of tandem duplications in the current study. As GhHH3 genes did not experience tandem duplication (but only underwent segmental and whole genome duplication), GhHH3 genes have no introns and a lack of new genes and functional divergence. These findings were consistent with some previous reports. The lack of introns suggests that the GhHH3 gene family is an advanced gene family where introns were lost over evolutionary time, and that these genes have evolutionarily conserved functions in cotton growth and development.

4.2. Cotton HH3 Gene Enlargement During Evolutionary Processes

As an allotetraploid, cotton is an ideal material to investigate the effects of polyploidy [39]. The cotton A-genome (native to Africa and resembles G. arboreum and G. herbaceum) and the D-genome (native to Mexico and resembles G. raimondii) diverged about 5–10 mya (million years ago). Hybridization between the A- and D-genomes resulted in the doubling of chromosomes and eventually the generation of nascent AtDt (allotetraploid upland cotton) genomes occurred [49].
Here, a total of 34 GhHH3 genes were identified, a higher number of HH3 genes than any other observed species. Polyploidy is an important feature of upland cotton, which doubled the number of GhHH3 gene members as a result of segmental or whole genome duplication (WGD). A previous study indicated that a polyploidy event occurred during the evolution of flowering plants that helped them to adapt to new environmental conditions [70]. The number of HH3 genes in upland cotton increased significantly, as evidenced by a comparison with A- (G. arboreum) and D-genome (G. raimondii) cottons. However, gene loss always happens after hybridization during the phase of enhanced arrangement in the genomic sequences and chromosome doubling [71]. Compared with paleopolyploid maize as well as Brassica, the cotton genome exhibited minor changes [72,73].
Polyploidy mainly contributes toward duplication, and segmental as well as whole genome duplication are the main reasons for increased GhHH3 family members, as both duplication events occur frequently in plants [74]. Plant species such as Arabidopsis experienced WGD twice in the Brassicaceae lineage [75]. Similarly, cotton and cacao have the same ancestor and faced ancient duplication about 18–58 mya. Eventually, there was another nascent duplication event in cotton [23].
In our study, we did not find evidence of tandem duplication even though it is the main contributor to gene family expansion as the result of unequal crossing over, transposons insertion, chromosomal anomalies, as well as other reverse transcriptase-mediated processes. Duplication results in new genes that are redundant with old ones and this redundancy is considered a driving force of evolution [76]. A previous study indicated that gene duplication causes redundancy of the HH3 genes in Arabidopsis [1]. In the current study, we identified only two pairs of segmental duplications, while WGD contributed more in GhHH3 gene family enlargement.
Previously, sesame heat shock protein gene family expansion was found to be the result of segmental duplication [77]. Similarly, soybean WRKY, cotton GRAS, WOX, YABBY, MIKC-Type MADS-Box, and RING-H2 finger E3 ligase gene families also expanded as the result of segmental as well as whole genome duplication [34,77,78,79,80,81,82,83]. In light of the above findings and previous reports, we concluded that A-genome HH3 genes and At sub-genome GhHH3 genes had the same common ancestor, and the D-genome and Dt sub-genome HH3 genes also had the same common ancestor. Further, the phylogenetic and collinearity analysis strengthened our speculation that GhHH3 genes were highly conserved with limited functional divergence during evolution.

4.3. Functional Diversifications of GhHH3 Family Members

Several studies have been conducted to explore the biological roles of HH3 genes in many plant species including Arabidopsis and rice [3,4,5,64]. To our knowledge, there has been no systematic study to explore the molecular functions of HH3 genes in cotton. Tissue-specific expression levels of eight selected GhHH3 genes indicated that GhHH3 genes were highly expressed and played a positive role at various observed stages of ovule development. Precisely, all eight genes including GhHH3-1, GhHH3-4, GhHH3-6, GhHH3-9, GhHH3-12, GhHH3-13, GhHH3-17, and GhHH3-28 were significantly positively expressed in different stages of ovule development, suggesting their roles in the ovule development process. These results were consistent with previously published transcriptomic data. However, all observed genes except GhHH3-1 did not have a significant contribution toward cotton fiber development, similar to the results of transcriptomic data.
Further, in four abiotic stress conditions (cold, heat, NaCl, and PEG), all genes were positively regulated many times higher than the control at different time points. However, two genes, GhHH3-9 and GhHH3-12, had downregulated expression on heat exposure after 2, 4, and 6 h of treatment; in addition, GhHH3-13 was downregulated at 6 h after NaCl treatment. These findings were consistent with published transcriptomic data.
Further, the analysis of GhHH3 genes for five different hormonal treatments including BL, GA, IAA, SA, and MeJA at different time points indicated that expression of all genes was regulated at different time points of observations. Particularly, all genes except for GhHH3-28 were upregulated following exposure to SA and MeJA, depicting their particular roles under the exposure of these phytohormonal treatments. Coupled with these results, we found that GhHH3 genes preferentially expressed during different stages of ovule development. In addition, GhHH3 genes expression can be regulated by abiotic and hormonal stress stimuli responses, suggesting that GhHH3 genes are possible candidates for breeding abiotic and hormonal stresses in cotton.

5. Conclusions

Previous studies deliberately illustrated the biological role of HH3 proteins in different plant species. In the current study, we systematically identified 257 HH3 genes in 19 different plant species, including 34 HH3 genes in upland cotton G. hirsutum. Phylogenetic analysis classified these 257 HH3 genes into eight well categorized clades with polyploidy and duplication effects. All GhHH3 genes lacked introns and had highly conserved protein motif distributions. Conserved amino acid sequence logos of Arabidopsis, rice, and G. hirsutum indicated that HH3 genes were highly conserved during evolution. Cis-elements with particular features in the promoter regions of GhHH3 genes indicated their functional relatedness to growth, development, and stress responses. At- and Dt-sub genomes had an equal distribution of 34 GhHH3 genes on the chromosomes. Duplication and collinearity analysis of GhHH3 genes indicated that cotton HH3 genes experienced segmental and whole genome duplication over evolutionary time. Further, duplicated gene pairs had limited functional divergence and were highly conserved demonstrating that A-genome HH3 genes and At sub-genome GhHH3 genes had the same common ancestor, and D-genome and Dt sub-genome HH3 genes also had the same common ancestor. In addition, expression analysis showed that GhHH3 genes preferentially expressed in ovule development along with the fact that these genes expression can be regulated by abiotic and hormonal stresses and might prove a possible genetic material in cotton breeding for abiotic and hormonal stress conditions.

Supplementary Materials

The following are available online at https://www.mdpi.com/2073-4425/10/5/355/s1. Figure S1: Chromosomal distribution of GhHH3 genes on different chromosomes of G. hirsutum. A02 to A13 and D02 to D13 represent At and Dt sub-genomes G. hirsutum, respectively; Figure S2: Gene structure and domain architecture of GhHH3 genes along with phylogenetic tree constructed by NJ method. (a) Gene structure of all GhHH3 genes with phylogenetic analysis. (b) Domain architecture of GhHH3 genes depicting protein motif distribution; Table S1: List of all qPCR primers used in this study. Table S2: Gene ID and proposed names of all observed 19 different plant species including A. thaliana, B. napus, G. arboreum, G. hirsutum, G. max, G. raimondii, M. truncatula, O. sativa, P. trichocarpa, S. bicolor, S. tuberosum, T. cacao, V. vinifera. Z. mays, A. comosus, P. taeda, C. reinhardtii, P. patens, and S. moellendorffii; Table S3: Biophysical properties of GhHH3 genes including locus ID, start and end point, strand, CDs (coding sequence), protein length, MW (molecular weight), pl (isoelectric point), gravity values, and predicted subcellular localization; Table S4: Genes orthologous/paralogous of in At and Dt sub-genomes of G. hirsutum, G. arboreum (A genome), and G. raimondii (D genome). A total of 81 orthologous/paralogous gene pairs were identified as the result of segmental and whole genome duplication. Further, the Ka/Ks (non-synonymous/synonymous) ratio of all identified orthologous/paralogous gene pairs was calculated; Table S5. Promoter cis-element analysis of 34 GhHH3 genes. Predicted cis-element in the promoters of GhHH3 genes were characterized according to their relevance to growth and development, light, and stress responses as well; Table S6. RNA-seq data analysis of 34 GhHH3 genes in two fuzzless/lintless mutants (M1l and M2l). Further, genes were categorized on the basis of their up- or downregulated expression in these two mutants.

Author Contributions

Conceptualization, Z.Y. and Z.W.; methodology, G.Q., F.A., L.L., H.M. and S.M.; validation, G.Q., Z.Y. and Z.W.; writing—original draft preparation, G.Q., funding acquisition, Z.Y. All authors have read and approved the final manuscript.

Funding

This work was supported by the Major Research Plan of National Natural Science Foundation of China (No. 31690093).

Conflicts of Interest

The authors declare no conflict of interest. The funders had no role in the design of the study; in the collection, analyses, or interpretation of data; in the writing of the manuscript; or in the decision to publish the results.

References

  1. Okada, T.; Endo, M.; Singh, M.B.; Bhalla, P.L. Analysis of the histone H3 gene family in Arabidopsis and identification of the male-gamete-specific variant AtMGH3. Plant J. 2005, 44, 557–568. [Google Scholar] [CrossRef] [PubMed]
  2. Hu, Y.; Lai, Y. Identification and expression analysis of rice histone genes. Plant Physiol. Biochem. PPB 2015, 86, 55–65. [Google Scholar] [CrossRef]
  3. Shu, H.; Nakamura, M.; Siretskiy, A.; Borghi, L.; Moraes, I.; Wildhaber, T.; Gruissem, W.; Hennig, L. Arabidopsis replacement histone variant H3.3 occupies promoters of regulated genes. Genome Biol. 2014, 15, R62. [Google Scholar] [CrossRef]
  4. Stroud, H.; Otero, S.; Desvoyes, B.; Ramirez-Parra, E.; Jacobsen, S.E.; Gutierrez, C. Genome-wide analysis of histone H3.1 and H3.3 variants in Arabidopsis thaliana. Proc. Natl. Acad. Sci. USA 2012, 109, 5370–5375. [Google Scholar] [CrossRef] [PubMed]
  5. Wollmann, H.; Holec, S.; Alden, K.; Clarke, N.D.; Jacques, P.E.; Berger, F. Dynamic deposition of histone variant H3.3 accompanies developmental remodeling of the Arabidopsis transcriptome. PLoS Genet. 2012, 8, e1002658. [Google Scholar] [CrossRef] [PubMed]
  6. Talbert, P.B.; Henikoff, S. Histone variants--ancient wrap artists of the epigenome. Nat. Rev. Mol. Cell Biol. 2010, 11, 264–275. [Google Scholar] [CrossRef]
  7. Deal, R.B.; Henikoff, S. Histone variants and modifications in plant gene regulation. Curr. Opin. Plant Biol. 2011, 14, 116–122. [Google Scholar] [CrossRef]
  8. Szenker, E.; Ray-Gallet, D.; Almouzni, G. The double face of the histone variant H3.3. Cell Res. 2011, 21, 421–434. [Google Scholar] [CrossRef] [Green Version]
  9. Elsaesser, S.J.; Goldberg, A.D.; Allis, C.D. New functions for an old variant: No substitute for histone H3.3. Curr. Opin. Genet. Dev. 2010, 20, 110–117. [Google Scholar] [CrossRef]
  10. Talbert, P.B.; Ahmad, K.; Almouzni, G.; Ausio, J.; Berger, F.; Bhalla, P.L.; Bonner, W.M.; Cande, W.Z.; Chadwick, B.P.; Chan, S.W.; et al. A unified phylogeny-based nomenclature for histone variants. Epigenetics Chromatin 2012, 5, 7. [Google Scholar] [CrossRef]
  11. Postberg, J.; Forcob, S.; Chang, W.J.; Lipps, H.J. The evolutionary history of histone H3 suggests a deep eukaryotic root of chromatin modifying mechanisms. BMC Evol. Biol. 2010, 10, 259. [Google Scholar] [CrossRef] [PubMed]
  12. Deal, R.B.; Henikoff, J.G.; Henikoff, S. Genome-wide kinetics of nucleosome turnover determined by metabolic labeling of histones. Science 2010, 328, 1161–1164. [Google Scholar] [CrossRef] [PubMed] [Green Version]
  13. Goldberg, A.D.; Banaszynski, L.A.; Noh, K.M.; Lewis, P.W.; Elsaesser, S.J.; Stadler, S.; Dewell, S.; Law, M.; Guo, X.; Li, X.; et al. Distinct factors control histone variant H3.3 localization at specific genomic regions. Cell 2010, 140, 678–691. [Google Scholar] [CrossRef] [Green Version]
  14. Jin, C.; Zang, C.; Wei, G.; Cui, K.; Peng, W.; Zhao, K.; Felsenfeld, G. H3.3/H2A.Z double variant-containing nucleosomes mark ‘nucleosome-free regions’ of active promoters and other regulatory regions. Nat. Genet. 2009, 41, 941–945. [Google Scholar] [CrossRef]
  15. Ahmad, K.; Henikoff, S. The histone variant H3.3 marks active chromatin by replication-independent nucleosome assembly. Mol. Cell 2002, 9, 1191–1200. [Google Scholar] [CrossRef]
  16. Wong, L.H.; McGhie, J.D.; Sim, M.; Anderson, M.A.; Ahn, S.; Hannan, R.D.; George, A.J.; Morgan, K.A.; Mann, J.R.; Choo, K.H. ATRX interacts with H3.3 in maintaining telomere structural integrity in pluripotent embryonic stem cells. Genome Res. 2010, 20, 351–360. [Google Scholar] [CrossRef] [Green Version]
  17. Celeste, A.; Petersen, S.; Romanienko, P.J.; Fernandez-Capetillo, O.; Chen, H.T.; Sedelnikova, O.A.; Reina-San-Martin, B.; Coppola, V.; Meffre, E.; Difilippantonio, M.J.; et al. Genomic instability in mice lacking histone H2AX. Science 2002, 296, 922–927. [Google Scholar] [CrossRef] [PubMed]
  18. Fernandez-Capetillo, O.; Mahadevaiah, S.K.; Celeste, A.; Romanienko, P.J.; Camerini-Otero, R.D.; Bonner, W.M.; Manova, K.; Burgoyne, P.; Nussenzweig, A. H2AX is required for chromatin remodeling and inactivation of sex chromosomes in male mouse meiosis. Dev. Cell 2003, 4, 497–508. [Google Scholar] [CrossRef]
  19. Du, X.M.; Huang, G.; He, S.P.; Yang, Z.E.; Sun, G.F.; Ma, X.F.; Li, N.; Zhang, X.Y.; Sun, J.L.; Liu, M.; et al. Resequencing of 243 diploid cotton accessions based on an updated A genome identifies the genetic basis of key agronomic traits. Nat. Genet. 2018, 50, 796–802. [Google Scholar] [CrossRef]
  20. Ma, Z.; He, S.; Wang, X.; Sun, J.; Zhang, Y.; Zhang, G.; Wu, L.; Li, Z.; Liu, Z.; Sun, G.; et al. Resequencing a core collection of upland cotton identifies genomic variation and loci influencing fiber quality and yield. Nat. Genet. 2018, 50, 803–813. [Google Scholar] [CrossRef]
  21. Wang, M.; Wang, P.; Lin, M.; Ye, Z.; Li, G.; Tu, L.; Shen, C.; Li, J.; Yang, Q.; Zhang, X. Evolutionary dynamics of 3D genome architecture following polyploidization in cotton. Nat. Plants 2018, 4, 90–97. [Google Scholar] [CrossRef]
  22. Zhang, T.Z.; Hu, Y.; Jiang, W.K.; Fang, L.; Guan, X.Y.; Chen, J.D.; Zhang, J.B.; Saski, C.A.; Scheffler, B.E.; Stelly, D.M.; et al. Sequencing of allotetraploid cotton (Gossypium hirsutum L. acc. TM-1) provides a resource for fiber improvement. Nat. Biotechnol. 2015, 33, 531–537. [Google Scholar] [CrossRef]
  23. Li, F.G.; Fan, G.Y.; Wang, K.B.; Sun, F.M.; Yuan, Y.L.; Song, G.L.; Li, Q.; Ma, Z.Y.; Lu, C.R.; Zou, C.S.; et al. Genome sequence of the cultivated cotton Gossypium arboreum. Nat. Genet. 2014, 46, 567–572. [Google Scholar] [CrossRef] [PubMed]
  24. Paterson, A.H.; Wendel, J.F.; Gundlach, H.; Guo, H.; Jenkins, J.; Jin, D.C.; Llewellyn, D.; Showmaker, K.C.; Shu, S.Q.; Udall, J.; et al. Repeated polyploidization of Gossypium genomes and the evolution of spinnable cotton fibres. Nature 2012, 492, 423–427. [Google Scholar] [CrossRef]
  25. Jones, P.; Binns, D.; Chang, H.Y.; Fraser, M.; Li, W.; McAnulla, C.; McWilliam, H.; Maslen, J.; Mitchell, A.; Nuka, G.; et al. InterProScan 5: Genome-scale protein function classification. Bioinformatics 2014, 30, 1236–1240. [Google Scholar] [CrossRef] [PubMed]
  26. Letunic, I.; Doerks, T.; Bork, P. SMART: Recent updates, new developments and status in 2015. Nucleic Acids Res. 2015, 43, D257–D260. [Google Scholar] [CrossRef]
  27. Kumar, S.; Stecher, G.; Tamura, K. MEGA7: Molecular evolutionary genetics analysis version 7.0 for bigger datasets. Mol. Biol. Evol. 2016, 33, 1870–1874. [Google Scholar] [CrossRef]
  28. Crooks, G.E.; Hon, G.; Chandonia, J.M.; Brenner, S.E. WebLogo: A sequence logo generator. Genome Res. 2004, 14, 1188–1190. [Google Scholar] [CrossRef] [PubMed]
  29. Hu, B.; Jin, J.; Guo, A.Y.; Zhang, H.; Luo, J.; Gao, G. GSDS 2.0: An upgraded gene feature visualization server. Bioinformatics 2015, 31, 1296–1297. [Google Scholar] [CrossRef]
  30. Bailey, T.L.; Williams, N.; Misleh, C.; Li, W.W. MEME: Discovering and analyzing DNA and protein sequence motifs. Nucleic Acids Res. 2006, 34, W369–W373. [Google Scholar] [CrossRef]
  31. Li, J.; Yu, D.; Qanmber, G.; Lu, L.; Wang, L.; Zheng, L.; Liu, Z.; Wu, H.; Liu, X.; Chen, Q.; et al. GhKLCR1, a kinesin light chain-related gene, induces drought-stress sensitivity in Arabidopsis. Sci. China Life Sci. 2019, 62, 63–75. [Google Scholar] [CrossRef] [PubMed]
  32. Lescot, M.; Dehais, P.; Thijs, G.; Marchal, K.; Moreau, Y.; Van de Peer, Y.; Rouze, P.; Rombauts, S. PlantCARE, a database of plant cis-acting regulatory elements and a portal to tools for in silico analysis of promoter sequences. Nucleic Acids Res. 2002, 30, 325–327. [Google Scholar] [CrossRef] [PubMed] [Green Version]
  33. Pandey, A.; Misra, P.; Alok, A.; Kaur, N.; Sharma, S.; Lakhwani, D.; Asif, M.H.; Tiwari, S.; Trivedi, P.K. Genome-wide identification and expression analysis of homeodomain leucine zipper subfamily IV (HDZ IV) gene family from Musa accuminata. Front Plant Sci 2016, 7, 20. [Google Scholar] [CrossRef] [PubMed]
  34. Yang, Z.E.; Gong, Q.; Qin, W.Q.; Yang, Z.R.; Cheng, Y.; Lu, L.L.; Ge, X.Y.; Zhang, C.J.; Wu, Z.X.; Li, F.G. Genome-wide analysis of WOX genes in upland cotton and their expression pattern under different stresses. BMC Plant Biol. 2017, 17, 113. [Google Scholar] [CrossRef] [PubMed]
  35. Krzywinski, M.; Schein, J.; Birol, I.; Connors, J.; Gascoyne, R.; Horsman, D.; Jones, S.J.; Marra, M.A. Circos: An information aesthetic for comparative genomics. Genome Res. 2009, 19, 1639–1645. [Google Scholar] [CrossRef] [Green Version]
  36. Suyama, M.; Torrents, D.; Bork, P. PAL2NAL: Robust conversion of protein sequence alignments into the corresponding codon alignments. Nucleic Acids Res. 2006, 34, W609–W612. [Google Scholar] [CrossRef]
  37. Yang, Z.H. PAML 4: Phylogenetic analysis by maximum likelihood. Mol. Biol. Evol. 2007, 24, 1586–1591. [Google Scholar] [CrossRef]
  38. Yang, Z.R.; Zhang, C.J.; Yang, X.J.; Liu, K.; Wu, Z.X.; Zhang, X.Y.; Zheng, W.; Xun, Q.Q.; Liu, C.L.; Lu, L.L.; et al. PAG1, a cotton brassinosteroid catabolism gene, modulates fiber elongation. New Phytol. 2014, 203, 437–448. [Google Scholar] [CrossRef]
  39. Wendel, J.F.; Cronn, R.C. Polyploidy and the evolutionary history of cotton. Adv. Agron. 2003, 78, 139–186. [Google Scholar] [Green Version]
  40. Hu, Y.; Liu, D.; Zhong, X.; Zhang, C.; Zhang, Q.; Zhou, D.X. CHD3 protein recognizes and regulates methylated histone H3 lysines 4 and 27 over a subset of targets in the rice genome. Proc. Natl. Acad. Sci. USA 2012, 109, 5773–5778. [Google Scholar] [CrossRef] [Green Version]
  41. Li, T.; Chen, X.; Zhong, X.; Zhao, Y.; Liu, X.; Zhou, S.; Cheng, S.; Zhou, D.X. Jumonji C domain protein JMJ705-mediated removal of histone H3 lysine 27 trimethylation is involved in defense-related gene activation in rice. Plant Cell 2013, 25, 4725–4736. [Google Scholar] [CrossRef]
  42. Li, C.; Huang, L.; Xu, C.; Zhao, Y.; Zhou, D.X. Altered levels of histone deacetylase OsHDT1 affect differential gene expression patterns in hybrid rice. PLoS ONE 2011, 6, e21789. [Google Scholar] [CrossRef]
  43. Qin, F.J.; Sun, Q.W.; Huang, L.M.; Chen, X.S.; Zhou, D.X. Rice SUVH histone methyltransferase genes display specific functions in chromatin modification and retrotransposon repression. Mol. Plant 2010, 3, 773–782. [Google Scholar] [CrossRef]
  44. Fankhauser, C.; Chory, J. Light control of plant development. Annu. Rev. Cell Dev. Biol. 1997, 13, 203–229. [Google Scholar] [CrossRef]
  45. Diaz-Martin, J.; Almoguera, C.N.; Prieto-Dapena, P.; Espinosa, J.M.; Jordano, J. Functional interaction between two transcription factors involved in the developmental regulation of a small heat stress protein gene promoter. Plant Physiol. 2005, 139, 1483–1494. [Google Scholar] [CrossRef]
  46. Narusaka, Y.; Nakashima, K.; Shinwari, Z.K.; Sakuma, Y.; Furihata, T.; Abe, H.; Narusaka, M.; Shinozaki, K.; Yamaguchi-Shinozaki, K. Interaction between two cis-acting elements, ABRE and DRE, in ABA-dependent expression of Arabidopsis rd29A gene in response to dehydration and high-salinity stresses. Plant J. 2003, 34, 137–148. [Google Scholar] [CrossRef]
  47. Song, C.P.; Agarwal, M.; Ohta, M.; Guo, Y.; Halfter, U.; Wang, P.C.; Zhu, J.K. Role of an Arabidopsis AP2/EREBP-type transcriptional repressor in abscisic acid and drought stress responses. Plant Cell 2005, 17, 2384–2396. [Google Scholar] [CrossRef]
  48. Wen, F.; Zhu, H.; Li, P.; Jiang, M.; Mao, W.Q.; Ong, C.; Chu, Z.Q. Genome-wide evolutionary characterization and expression analyses of WRKY family genes in Brachypodium distachyon. DNA Res. 2014, 21, 327–339. [Google Scholar] [CrossRef]
  49. Li, F.; Fan, G.; Lu, C.; Xiao, G.; Zou, C.; Kohel, R.J.; Ma, Z.; Shang, H.; Ma, X.; Wu, J.; et al. Genome sequence of cultivated Upland cotton (Gossypium hirsutum TM-1) provides insights into genome evolution. Nat. Biotechnol. 2015, 33, 524–530. [Google Scholar] [CrossRef]
  50. Prince, V.E.; Pickett, F.B. Splitting pairs: The diverging fates of duplicated genes. Nat. Rev. Genet. 2002, 3, 827–837. [Google Scholar] [CrossRef]
  51. Vandepoele, K.; Simillion, C.; Van de Peer, Y. Evidence that rice and other cereals are ancient aneuploids. Plant Cell 2003, 15, 2192–2202. [Google Scholar] [CrossRef]
  52. Roy, S.W.; Gilbert, W. The evolution of spliceosomal introns: Patterns, puzzles and progress. Nat. Rev. Genet. 2006, 7, 211–221. [Google Scholar]
  53. Tuttle, J.R.; Nah, G.; Duke, M.V.; Alexander, D.C.; Guan, X.; Song, Q.; Chen, Z.J.; Scheffler, B.E.; Haigler, C.H. Metabolomic and transcriptomic insights into how cotton fiber transitions to secondary wall synthesis, represses lignification, and prolongs elongation. BMC Genom. 2015, 16, 477. [Google Scholar] [CrossRef]
  54. Wang, Q.Q.; Liu, F.; Chen, X.S.; Ma, X.J.; Zeng, H.Q.; Yang, Z.M. Transcriptome profiling of early developing cotton fiber by deep-sequencing reveals significantly differential expression of genes in a fuzzless/lintless mutant. Genomics 2010, 96, 369–376. [Google Scholar] [CrossRef] [Green Version]
  55. Naoumkina, M.; Thyssen, G.N.; Fang, D.D. RNA-seq analysis of short fiber mutants Ligon-lintless-1 (Li 1 ) and -2 (Li 2 ) revealed important role of aquaporins in cotton (Gossypium hirsutum L.) fiber elongation. BMC Plant Biol. 2015, 15, 65. [Google Scholar] [CrossRef]
  56. Wang, M.; Wang, Q.; Zhang, B. Evaluation and selection of reliable reference genes for gene expression under abiotic stress in cotton (Gossypium hirsutum L.). Gene 2013, 530, 44–50. [Google Scholar] [CrossRef]
  57. Du, Z.; Li, H.; Wei, Q.; Zhao, X.; Wang, C.; Zhu, Q.; Yi, X.; Xu, W.; Liu, X.S.; Jin, W.; et al. Genome-wide analysis of histone modifications: H3K4me2, H3K4me3, H3K9ac, and H3K27ac in Oryza sativa L. Japonica. Mol. Plant 2013, 6, 1463–1472. [Google Scholar] [CrossRef]
  58. Zong, W.; Zhong, X.; You, J.; Xiong, L. Genome-wide profiling of histone H3K4-tri-methylation and gene expression in rice under drought stress. Plant Mol. Biol. 2013, 81, 175–188. [Google Scholar] [CrossRef]
  59. Malone, B.M.; Tan, F.; Bridges, S.M.; Peng, Z.H. Comparison of four chip-seq analytical algorithms using rice endosperm H3K27 trimethylation profiling data. PLoS ONE 2011, 6, e25260. [Google Scholar] [CrossRef]
  60. Li, X.; Wang, X.; He, K.; Ma, Y.; Su, N.; He, H.; Stolc, V.; Tongprasit, W.; Jin, W.; Jiang, J.; et al. High-resolution mapping of epigenetic modifications of the rice genome uncovers interplay between DNA methylation, histone methylation, and gene expression. Plant Cell 2008, 20, 259–276. [Google Scholar] [CrossRef]
  61. Yokoo, T.; Saito, H.; Yoshitake, Y.; Xu, Q.; Asami, T.; Tsukiyama, T.; Teraishi, M.; Okumoto, Y.; Tanisaka, T. Se14, encoding a JmjC domain-containing protein, plays key roles in long-day suppression of rice flowering through the demethylation of H3K4me3 of RFT1. PLoS ONE 2014, 9, e96064. [Google Scholar] [CrossRef]
  62. Chen, Q.; Chen, X.; Wang, Q.; Zhang, F.; Lou, Z.; Zhang, Q.; Zhou, D.X. Structural basis of a histone H3 lysine 4 demethylase required for stem elongation in rice. PLoS Genet. 2013, 9, e1003239. [Google Scholar] [CrossRef]
  63. Ding, B.; Bellizzi Mdel, R.; Ning, Y.; Meyers, B.C.; Wang, G.L. HDT701, a histone H4 deacetylase, negatively regulates plant innate immunity by modulating histone H4 acetylation of defense-related genes in rice. Plant Cell 2012, 24, 3783–3794. [Google Scholar] [CrossRef]
  64. Sun, C.; Fang, J.; Zhao, T.; Xu, B.; Zhang, F.; Liu, L.; Tang, J.; Zhang, G.; Deng, X.; Chen, F.; et al. The histone methyltransferase SDG724 mediates H3K36me2/3 deposition at MADS50 and RFT1 and promotes flowering in rice. Plant Cell 2012, 24, 3235–3247. [Google Scholar] [CrossRef]
  65. Maestrini, P.; Cavallini, A.; Rizzo, M.; Giordani, T.; Bernardi, R.; Durante, M.; Natali, L. Isolation and expression analysis of low temperature-induced genes in white poplar (Populus alba). J. Plant Physiol. 2009, 166, 1544–1556. [Google Scholar] [CrossRef]
  66. Singh, K.B.; Foley, R.C.; Onate-Sanchez, L. Transcription factors in plant defense and stress responses. Curr. Opin. Plant Biol. 2002, 5, 430–436. [Google Scholar] [CrossRef]
  67. Roy, S.W.; Penny, D. A very high fraction of unique intron positions in the intron-rich diatom Thalassiosira pseudonana indicates widespread intron gain. Mol. Biol. Evol. 2007, 24, 1447–1457. [Google Scholar] [CrossRef]
  68. Roy, S.W.; Gilbert, W. Complex early genes. Proc. Natl. Acad. Sci. USA 2005, 102, 1986–1991. [Google Scholar] [CrossRef] [Green Version]
  69. Iwamoto, M.; Maekawa, M.; Saito, A.; Higo, H.; Higo, K. Evolutionary relationship of plant catalase genes inferred from exon-intron structures: Isozyme divergence after the separation of monocots and dicots. Theor. Appl. Genet. 1998, 97, 9–19. [Google Scholar] [CrossRef]
  70. Ramsey, J.; Schemske, D.W. Pathways, mechanisms, and rates of polyploid formation in flowering plants. Annu. Rev. Ecol. Syst. 1998, 29, 467–501. [Google Scholar] [CrossRef]
  71. Paterson, A.H.; Bowers, J.E.; Chapman, B.A. Ancient polyploidization predating divergence of the cereals, and its consequences for comparative genomics. Proc. Natl. Acad. Sci. USA 2004, 101, 9903–9908. [Google Scholar] [CrossRef] [Green Version]
  72. Woodhouse, M.R.; Schnable, J.C.; Pedersen, B.S.; Lyons, E.; Lisch, D.; Subramaniam, S.; Freeling, M. Following tetraploidy in maize, a short deletion mechanism removed genes preferentially from one of the two homologs. PLoS Biol. 2010, 8, e1000409. [Google Scholar] [CrossRef] [PubMed]
  73. Gaeta, R.T.; Pires, J.C.; Iniguez-Luy, F.; Leon, E.; Osborn, T.C. Genomic changes in resynthesized Brassica napus and their effect on gene expression and phenotype. Plant Cell 2007, 19, 3403–3417. [Google Scholar] [CrossRef]
  74. Cannon, S.B.; Mitra, A.; Baumgarten, A.; Young, N.D.; May, G. The roles of segmental and tandem gene duplication in the evolution of large gene families in Arabidopsis thaliana. BMC Plant Biol. 2004, 4, 10. [Google Scholar] [CrossRef]
  75. Wang, X.W.; Wang, H.Z.; Wang, J.; Sun, R.F.; Wu, J.; Liu, S.Y.; Bai, Y.Q.; Mun, J.H.; Bancroft, I.; Cheng, F.; et al. The genome of the mesopolyploid crop species Brassica rapa. Nat. Genet. 2011, 43, 1035–1359. [Google Scholar] [CrossRef]
  76. Flagel, L.E.; Wendel, J.F. Gene duplication and evolutionary novelty in plants. New Phytol. 2009, 183, 557–564. [Google Scholar] [CrossRef] [PubMed] [Green Version]
  77. Dossa, K.; Diouf, D.; Cisse, N. Genome-wide investigation of Hsf genes in sesame reveals their segmental duplication expansion and their active role in drought stress response. Front. Plant Sci. 2016, 7, 1522. [Google Scholar] [CrossRef]
  78. Jia, J.T.; Zhao, P.C.; Cheng, L.Q.; Yuan, G.X.; Yang, W.G.; Liu, S.; Chen, S.Y.; Qi, D.M.; Liu, G.S.; Li, X.X. MADS-box family genes in sheepgrass and their involvement in abiotic stress responses. BMC Plant Biol. 2018, 18, 42. [Google Scholar] [CrossRef]
  79. Qanmber, G.; Yu, D.; Li, J.; Wang, L.; Ma, S.; Lu, L.; Yang, Z.; Li, F. Genome-wide identification and expression analysis of Gossypium RING-H2 finger E3 ligase genes revealed their roles in fiber development, and phytohormone and abiotic stress responses. J. Cotton Res. 2018, 1, 1. [Google Scholar] [CrossRef]
  80. Yang, Z.E.; Gong, Q.; Wang, L.L.; Jin, Y.Y.; Xi, J.P.; Li, Z.; Qin, W.Q.; Yang, Z.R.; Lu, L.L.; Chen, Q.J.; et al. Genome-wide study of YABBY genes in upland cotton and their expression patterns under different stresses. Front Genet 2018, 9, 33. [Google Scholar] [CrossRef]
  81. Zhang, B.; Liu, J.; Yang, Z.E.; Chen, E.Y.; Zhang, C.J.; Zhang, X.Y.; Li, F.G. Genome-wide analysis of GRAS transcription factor gene family in Gossypium hirsutum L. BMC Genom. 2018, 19, 348. [Google Scholar] [CrossRef]
  82. Yin, G.J.; Xu, H.L.; Xiao, S.Y.; Qin, Y.J.; Li, Y.X.; Yan, Y.M.; Hu, Y.K. The large soybean (Glycine max) WRKY TF family expanded by segmental duplication events and subsequent divergent selection among subgroups. BMC Plant Biol. 2013, 13, 148. [Google Scholar] [CrossRef]
  83. Ren, Z.; Yu, D.; Yang, Z.; Li, C.; Qanmber, G.; Li, Y.; Li, J.; Liu, Z.; Lu, L.; Wang, L.; et al. Genome-wide identification of the MIKC-type MADS-box gene family in Gossypium hirsutum L. unravels their roles in flowering. Front. Plant Sci. 2017, 8, 384. [Google Scholar] [CrossRef]
Figure 1. Phylogenetic tree of histone H3 (HH3) genes from 19 plant species. (A) The phylostratum analysis of the HH3 gene family. (B) Phylogenetic tree divided all 257 HH3 genes into eight clades from HH3-a to HH3-h. Bootstrap values were also mentioned near the node of each branch.
Genes 10 00355 g001
Figure 2. Sequence logos of conserved amino acid residues generated for three plant species including Arabidopsis (first), rice (second), and Gossypium hirsutum (third) exhibited highly conserved sequence logos during the evolution of dicots and monocots plant species.
Genes 10 00355 g002aGenes 10 00355 g002b
Figure 3. Gene duplication among HH3 genes in cotton including G. arboreum (A-genome), G. hirsutum (At and Dt sub-genome), and G. raimondii (D-genome). Red lines linking two different genes represent the orthologous pairs diverged from the same ancestor. A01–A13 (mustard colored blocks) represent the chromosomes of At sub-genome and D01–D13 (light green colored blocks) exhibit the chromosomes of Dt sub-genome. Similarly, A-chr1-A-chr13 (blue colored blocks) and D-chr1-D-chr13 (red colored blocks) demonstrate G. arboreum and G. raimondii chromosomes, respectively.
Genes 10 00355 g003
Figure 4. Tissue specific expression patterns analysis of GhHH3 genes in different tissues of the plant. (A) Heat map generated for the expression of 34 GhHH3 genes in 22 different tissues. Data obtained from publically available transcriptomic data and the color bar (down) indicate the values of expression level. (B) Heat map of all GhHH3 relative expressions in two fuzzless/lintless mutants (M1l and M2l) as compared with wild type (WT) plants. Data were extracted from published RNA-seq data and the color bar (down) indicates the expression level. (C) Relative expression level of eight selected GhHH3 genes in different tissue estimated by qRT-PCR analysis. Error bars indicate the standard deviations (SD) of three independent biological repeats.
Genes 10 00355 g004
Figure 5. Expression patterns analysis of GhHH3 genes under the treatment of four different abiotic stresses (cold, heat, sodium chloride (NaCl), and polyethylene glycol (PEG)). (A) Heat map of all GhHH3 gene family members generated using publically available transcriptomic data. Color bar (down) indicated the response of that gene under specific treatment. (B) Expression pattern of eight GhHH3 genes in cotton seedlings under same abiotic stresses estimated by qRT-PCR analysis. The error bars exhibit standard deviations (SD) of three independent biological repeats.
Genes 10 00355 g005
Figure 6. Expression analysis of selected GhHH3 genes in cotton seedlings under exposure to five different phytohormonal stress stimuli including brassinolide (BL), gibberellic acid (GA), indole-3-acetic acid (IAA), salicylic acid (SA), and methyl jasmonate (MeJA). Error bars indicated standard deviations (SD) among three independent biological experiments.
Genes 10 00355 g006aGenes 10 00355 g006b

