High-Intensity Ultrasound Treatment on Soy Protein after Selectively Proteolyzing Glycinin Component: Physical, Structural, and Aggregation Properties

Abstract
:
1. Introduction
2. Materials and Methods
2.1. Materials
2.2. Preparation of Native Soy Protein Isolate (SPI)
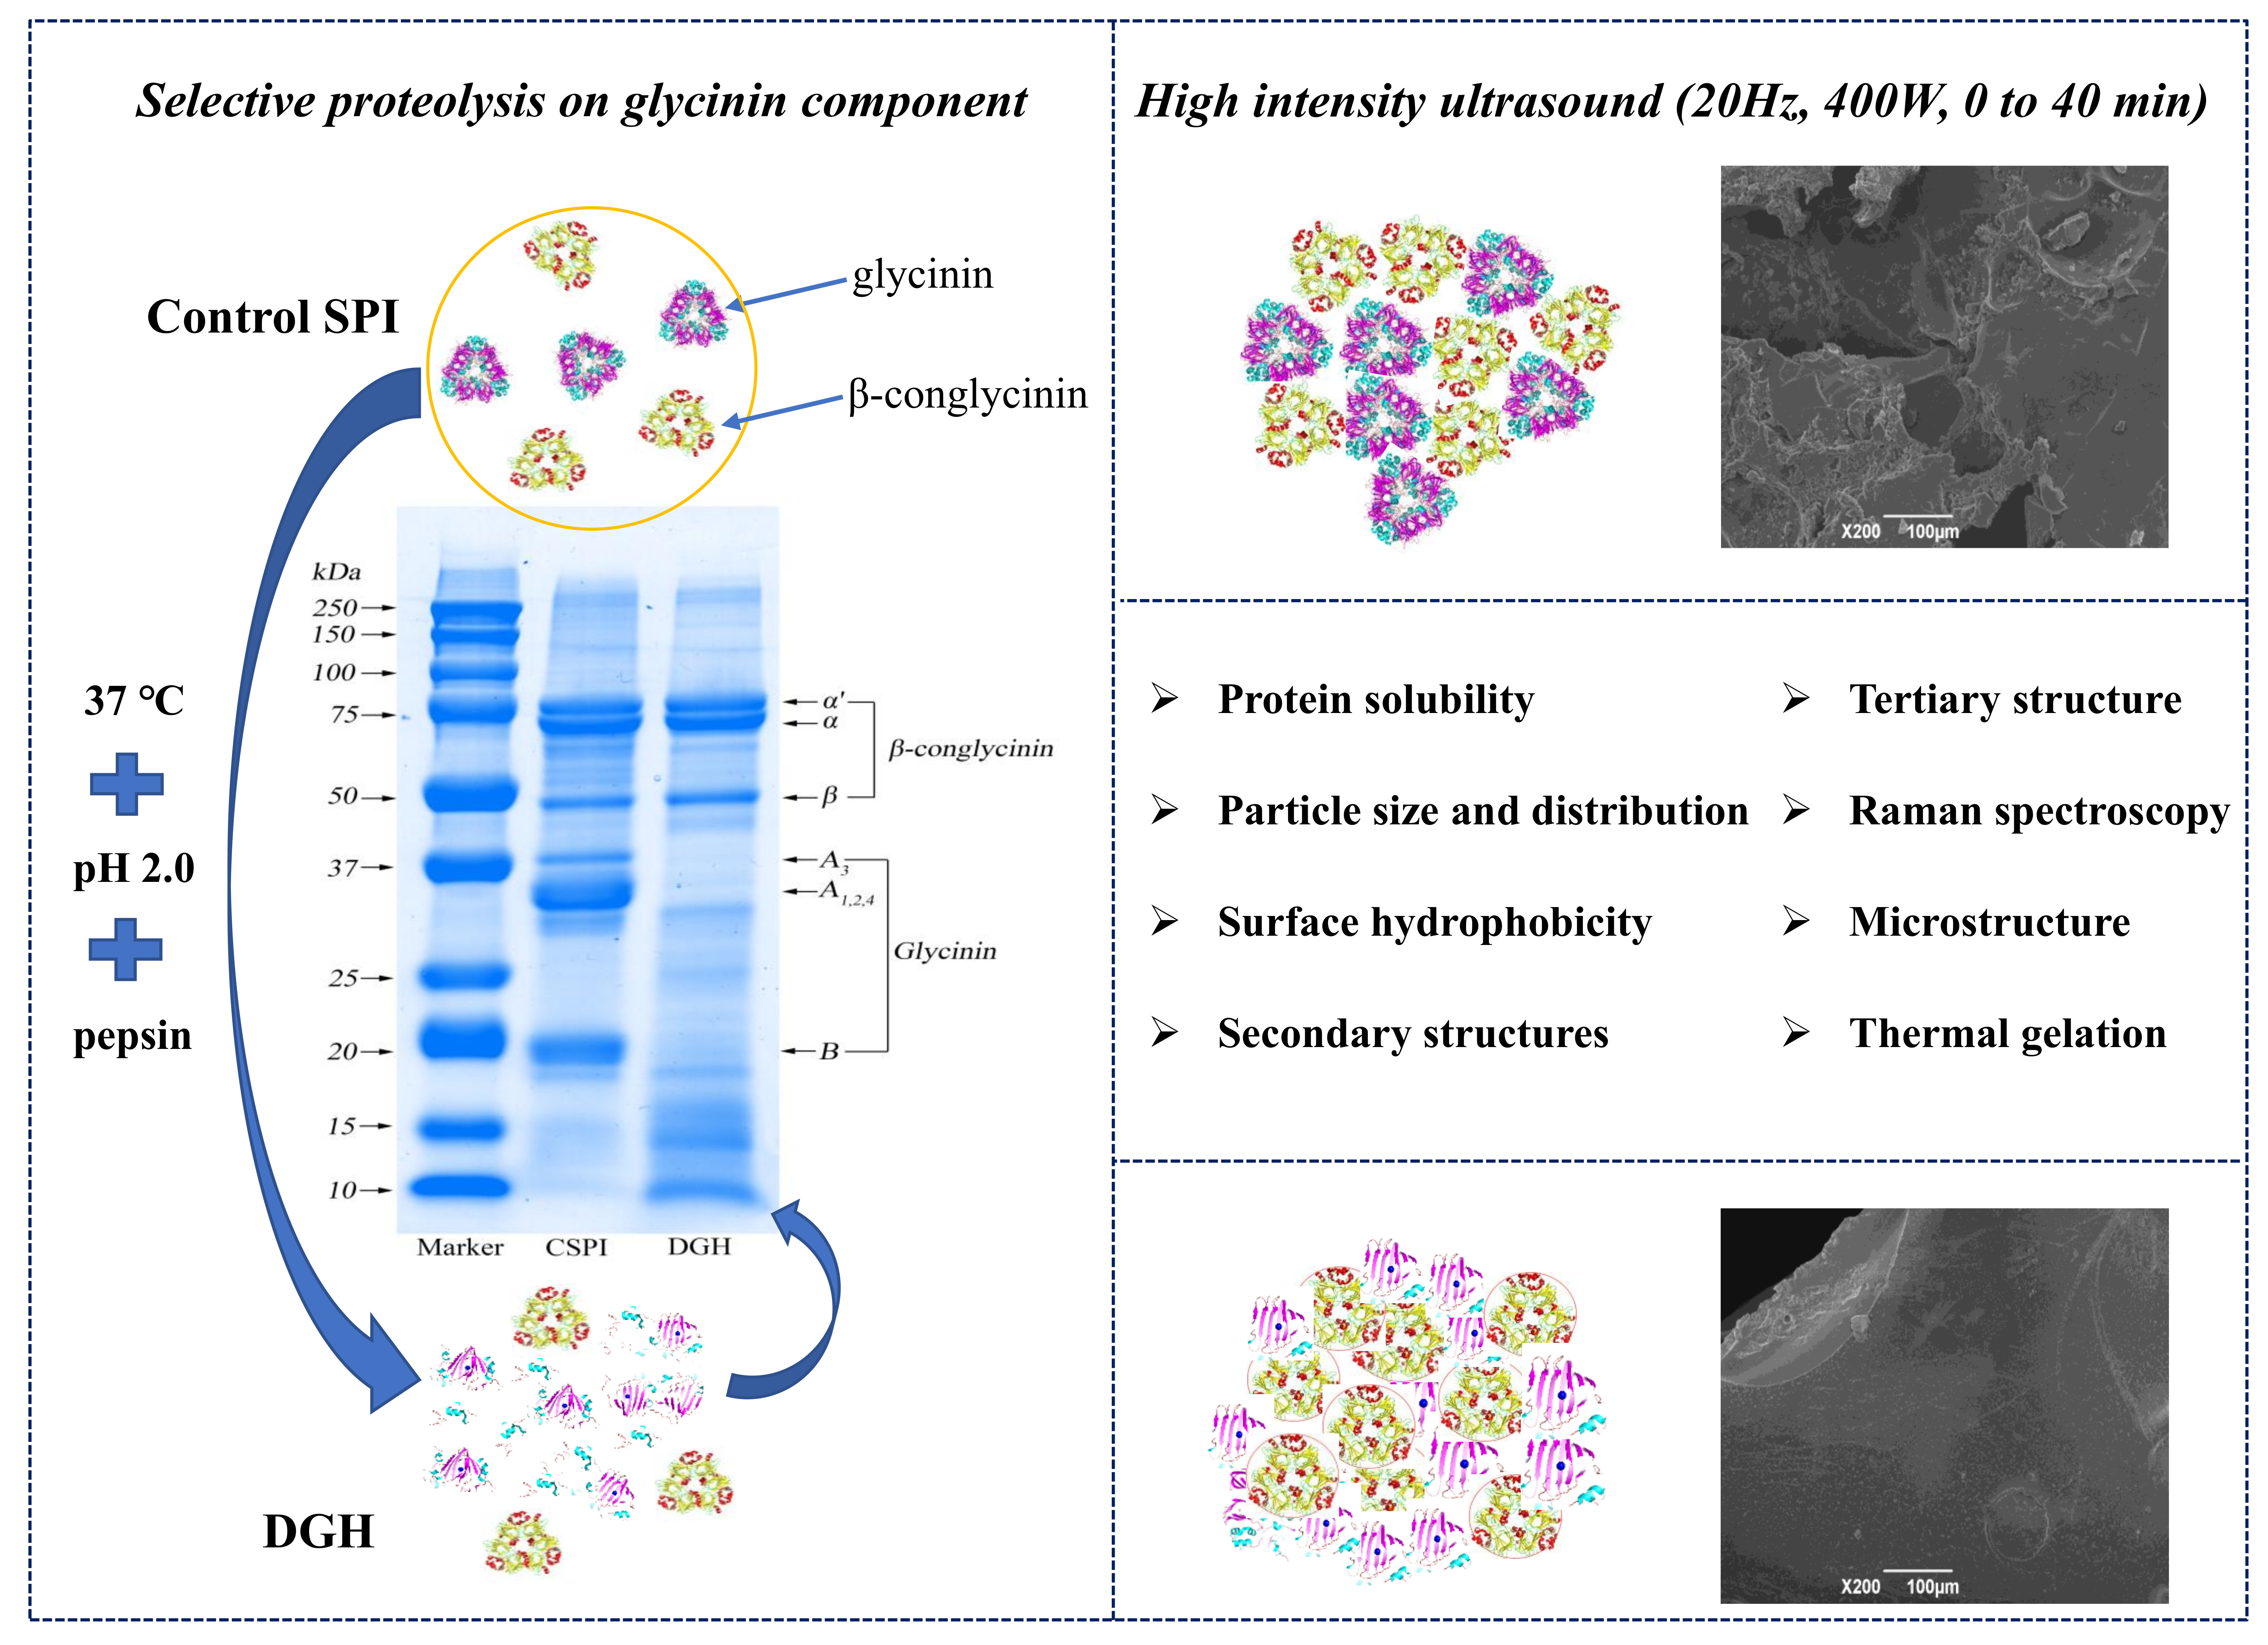
2.3. Selective Proteolysis on Glycinin Component
2.4. High-Intensity Ultrasound (HIU) Treatment of Proteins
2.5. Sodium Dodecyl Sulfate-Polyacrylamide Gel Electrophoresis (SDS-PAGE) Analysis
2.6. Determination of Protein Solubility
2.7. Dynamic Light Scattering (DLS)
2.8. Surface Hydrophobicity (H0) Measurement
2.9. Circular Dichroism Spectra Measurement
2.10. Intrinsic Fluorescence Spectra Measurement
2.11. FT-Raman Spectra Measurement
2.12. Scanning Electron Microscopy (SEM)
2.13. Low-Amplitude Oscillatory Measurement
2.14. Statistical Analysis
3. Results and Discussion
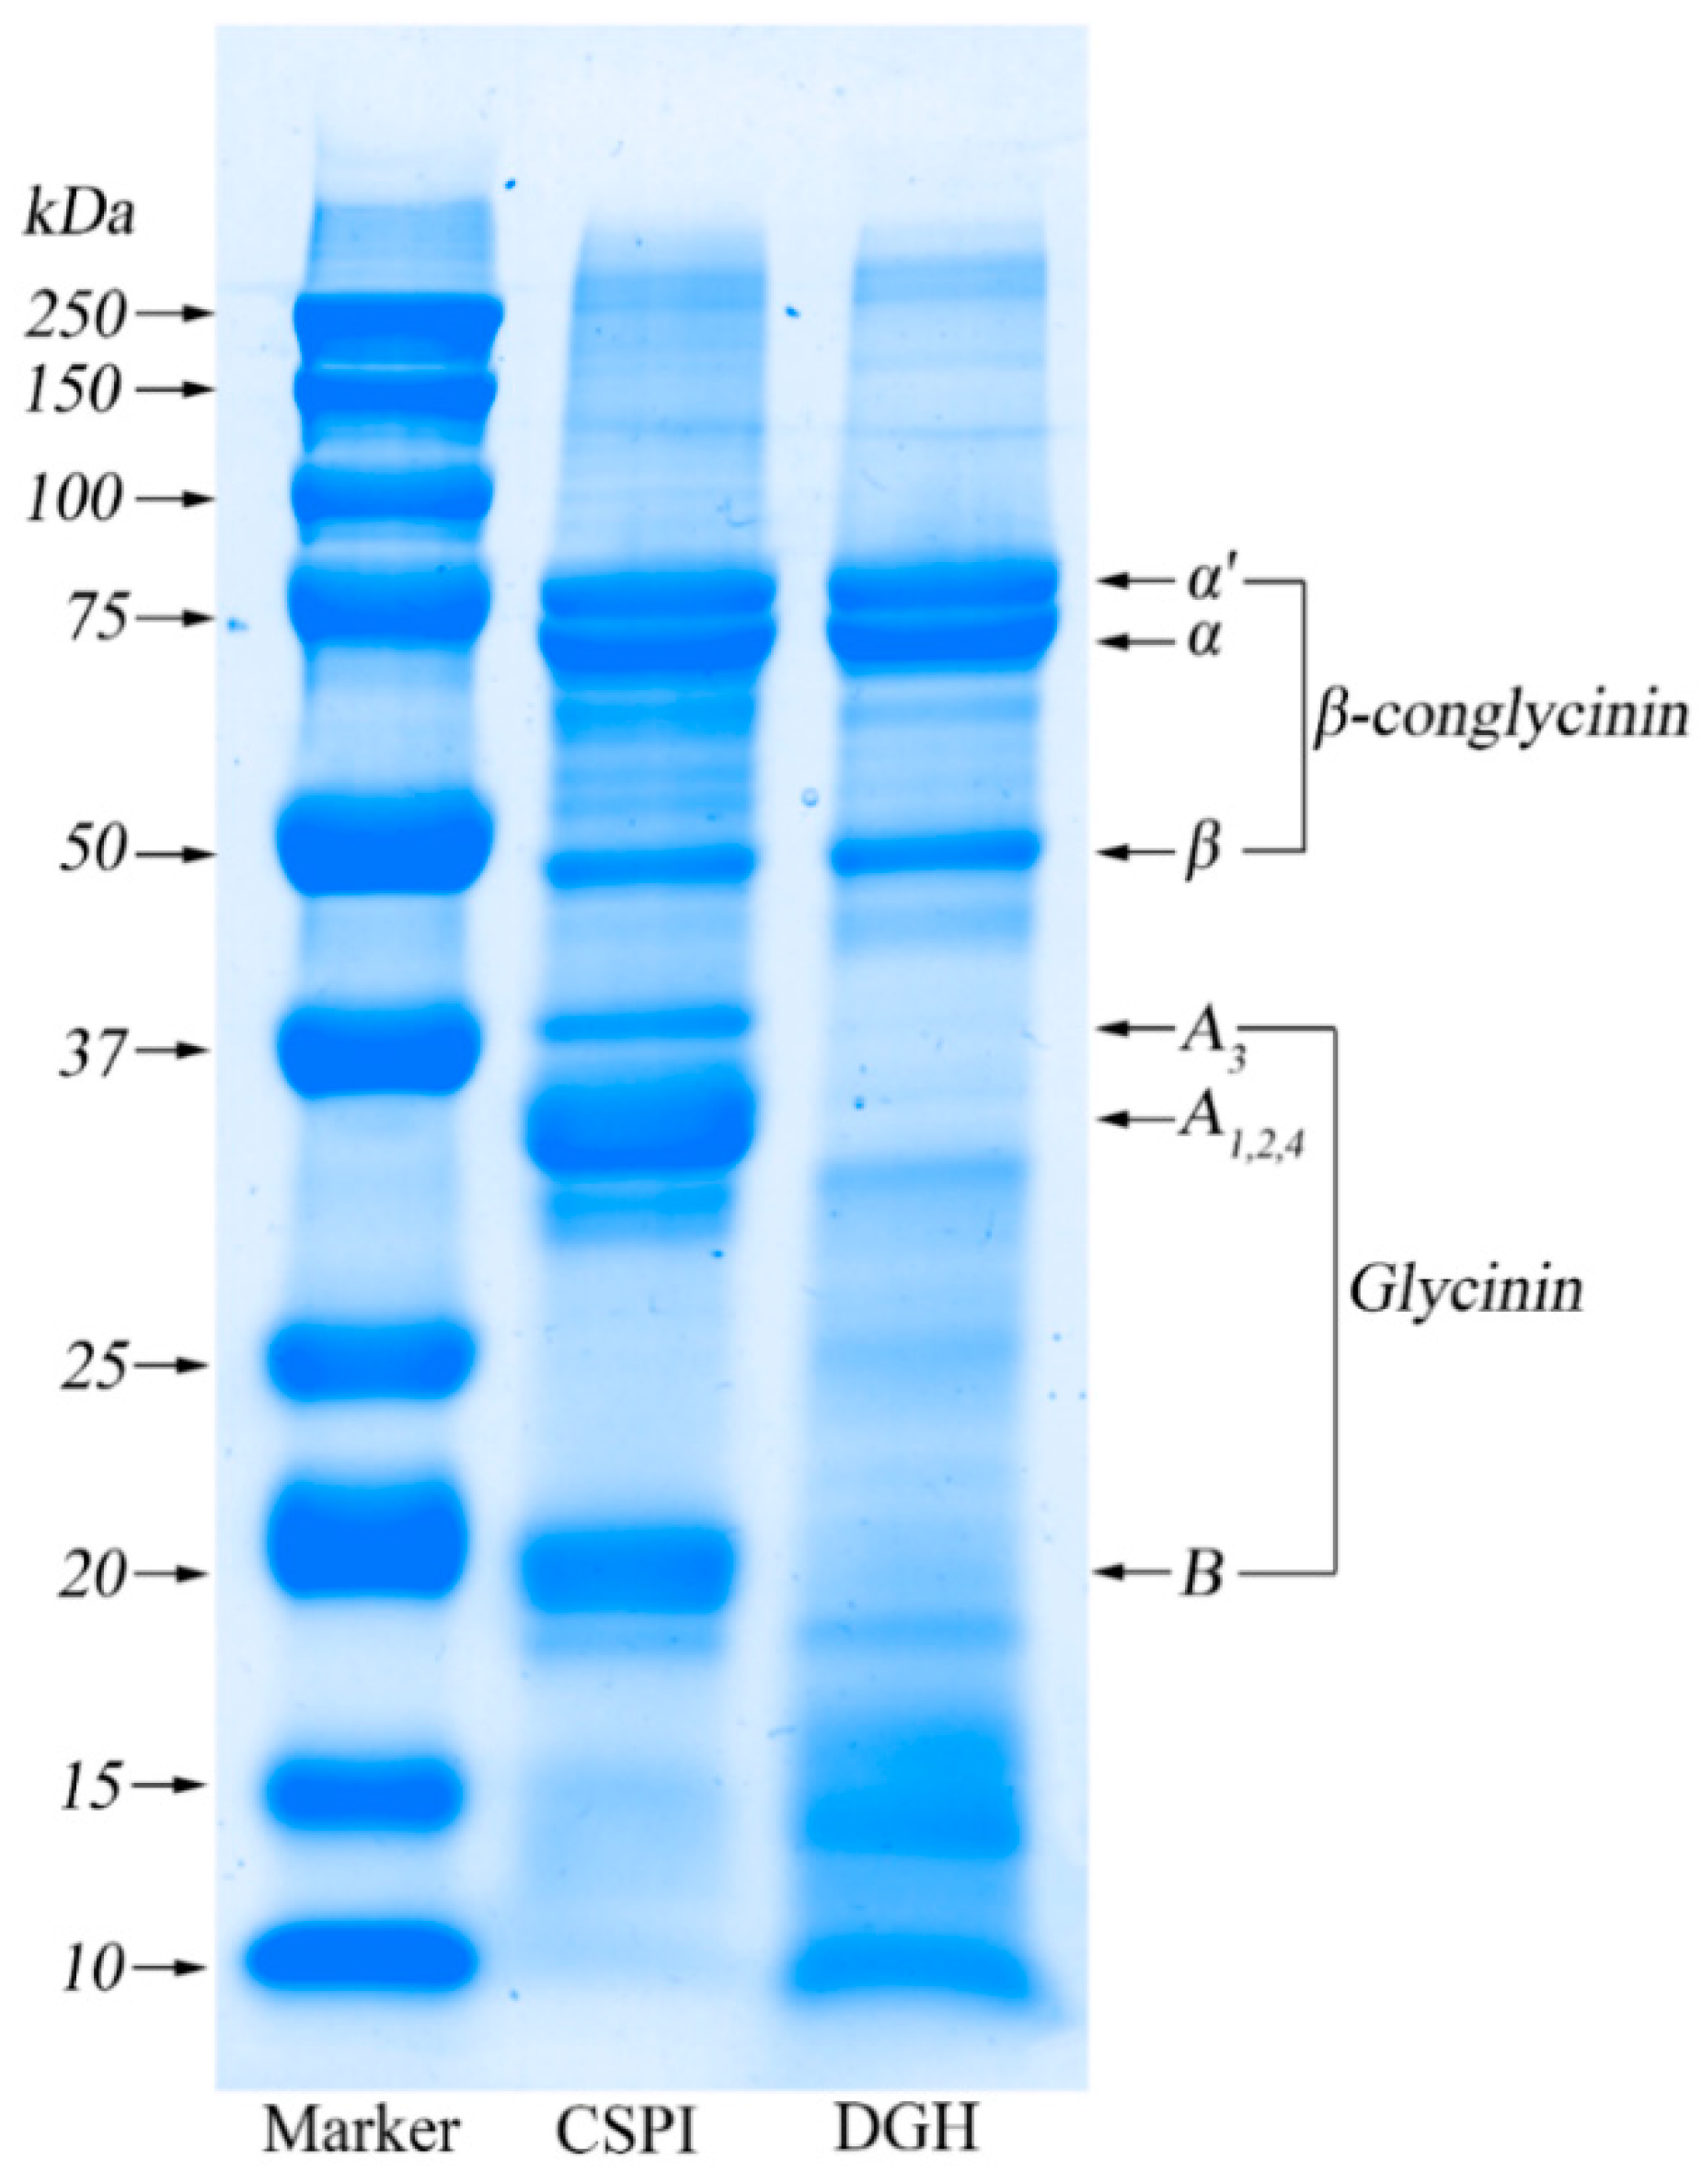
3.1. SDS-PAGE
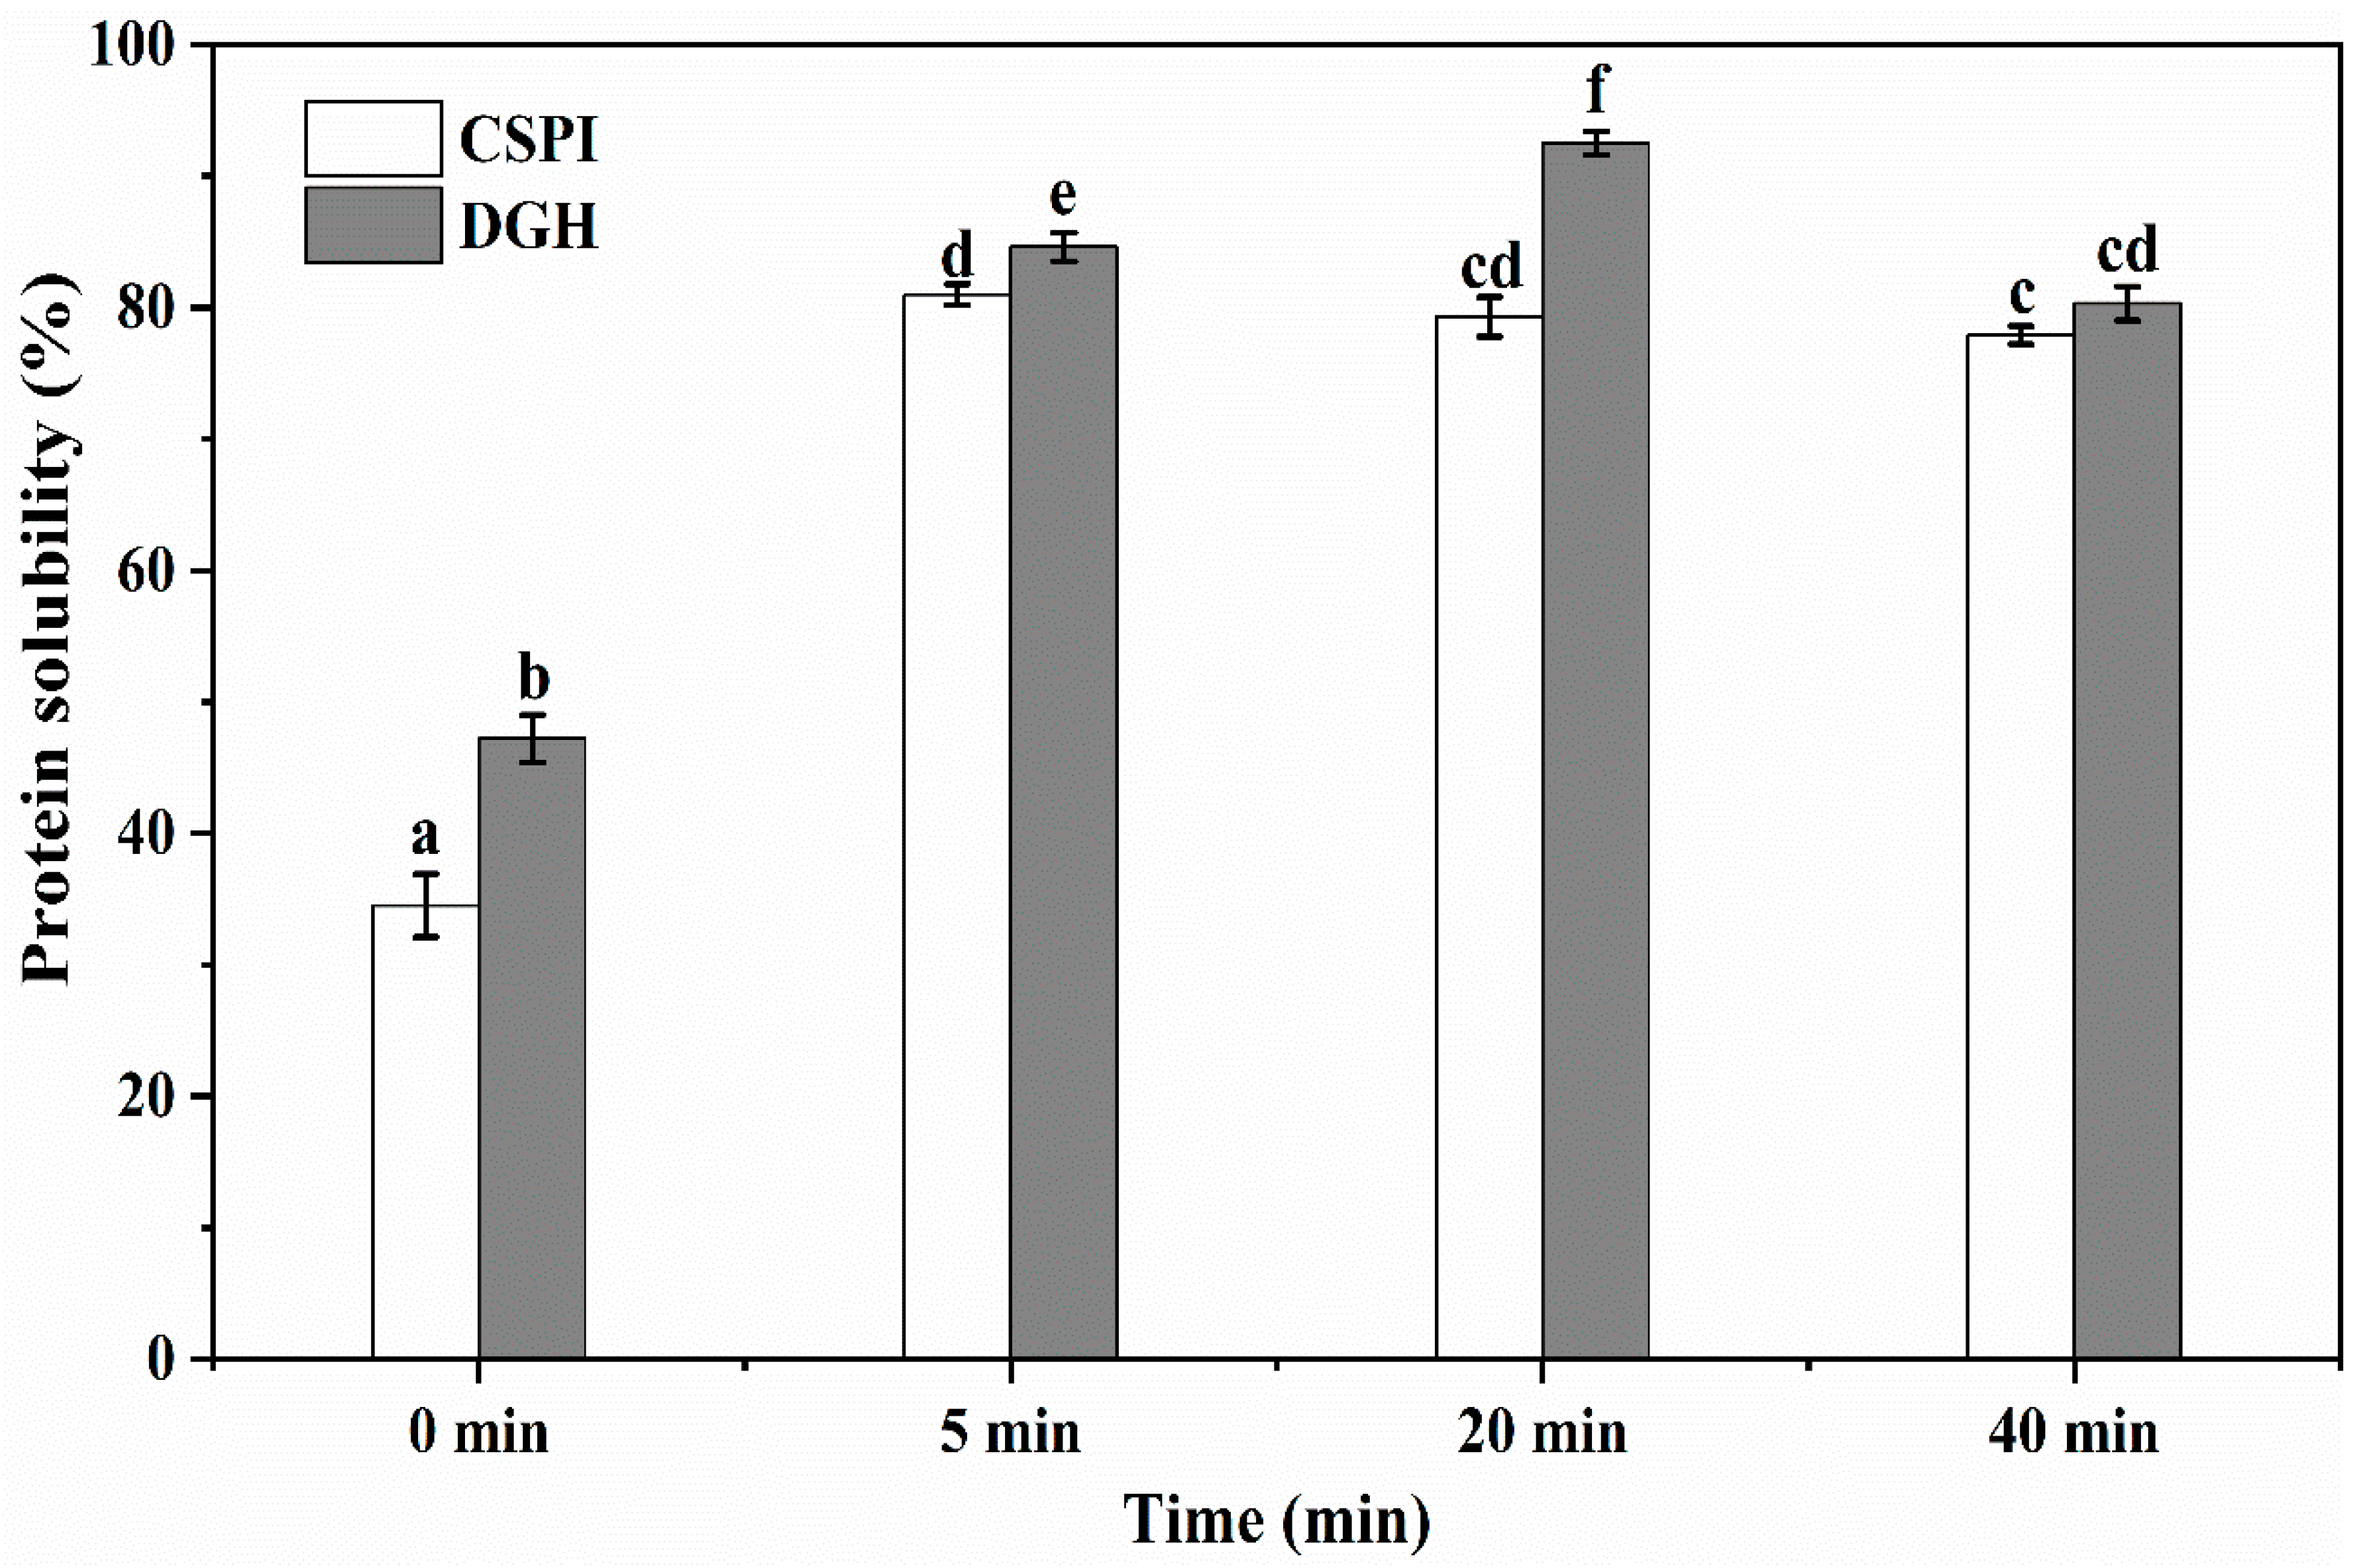
3.2. Solubility
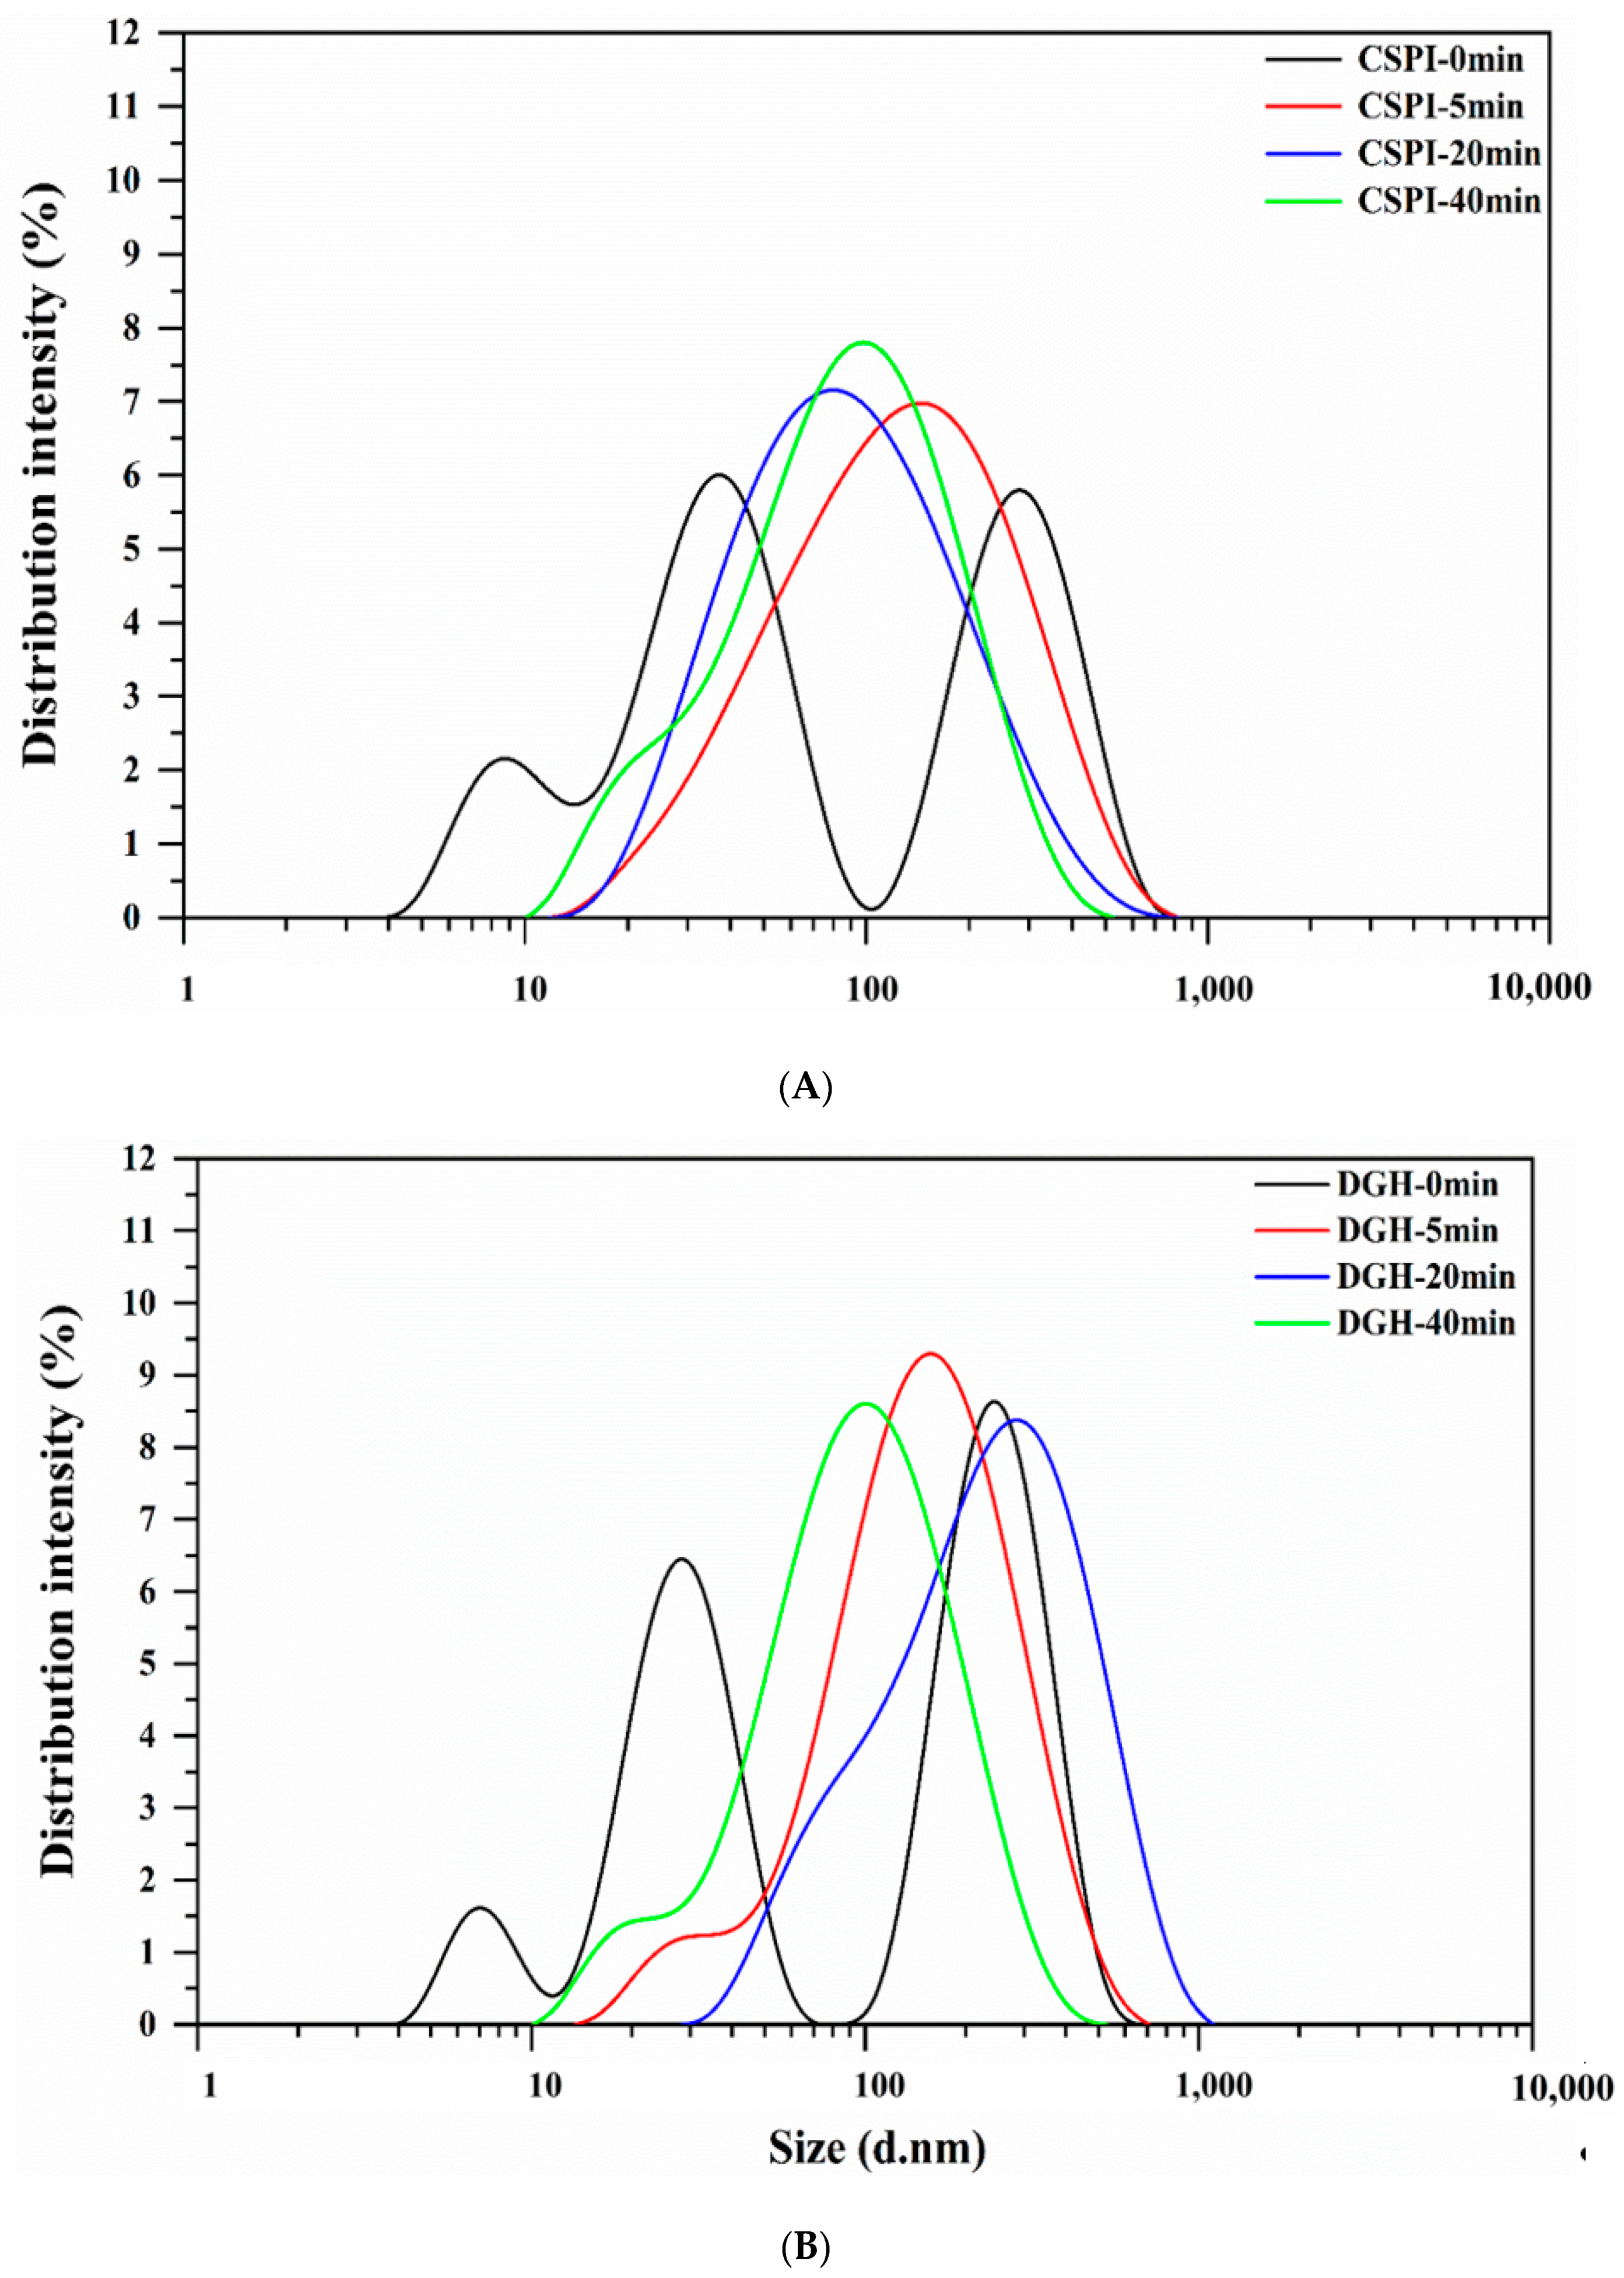
3.3. Particle Size
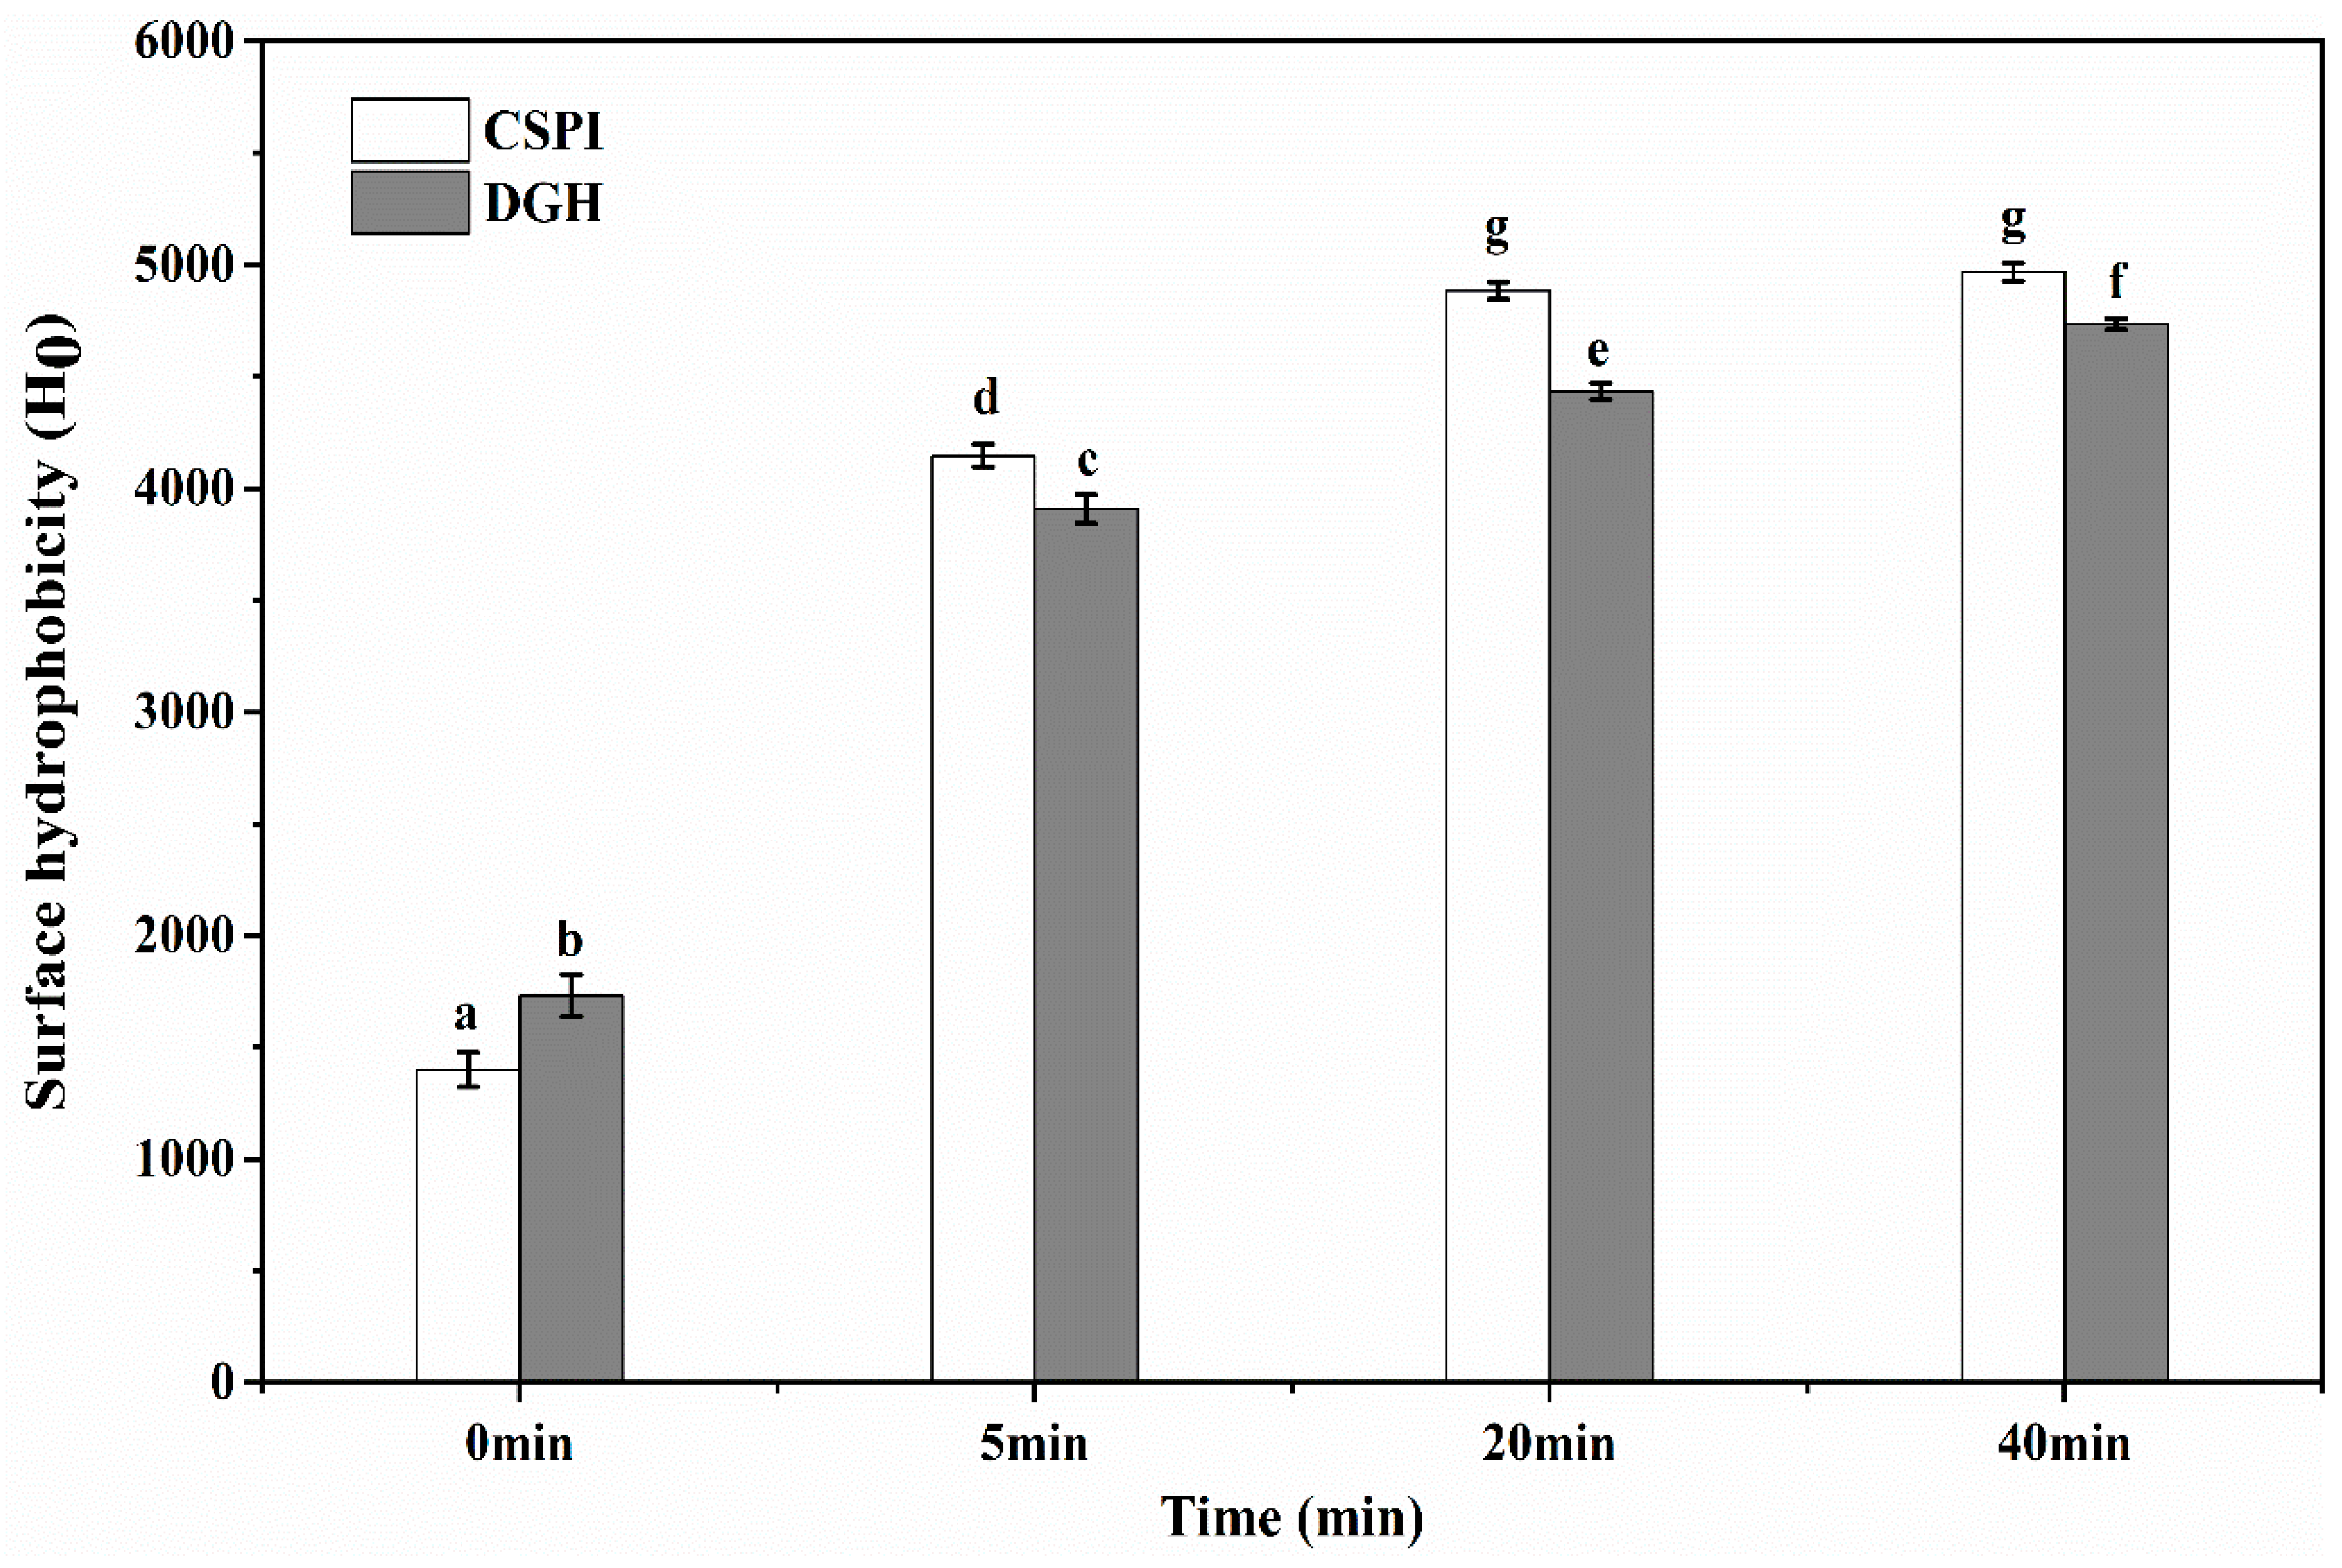
3.4. Surface Hydrophobicity
3.5. Circular Dichroism Spectroscopy
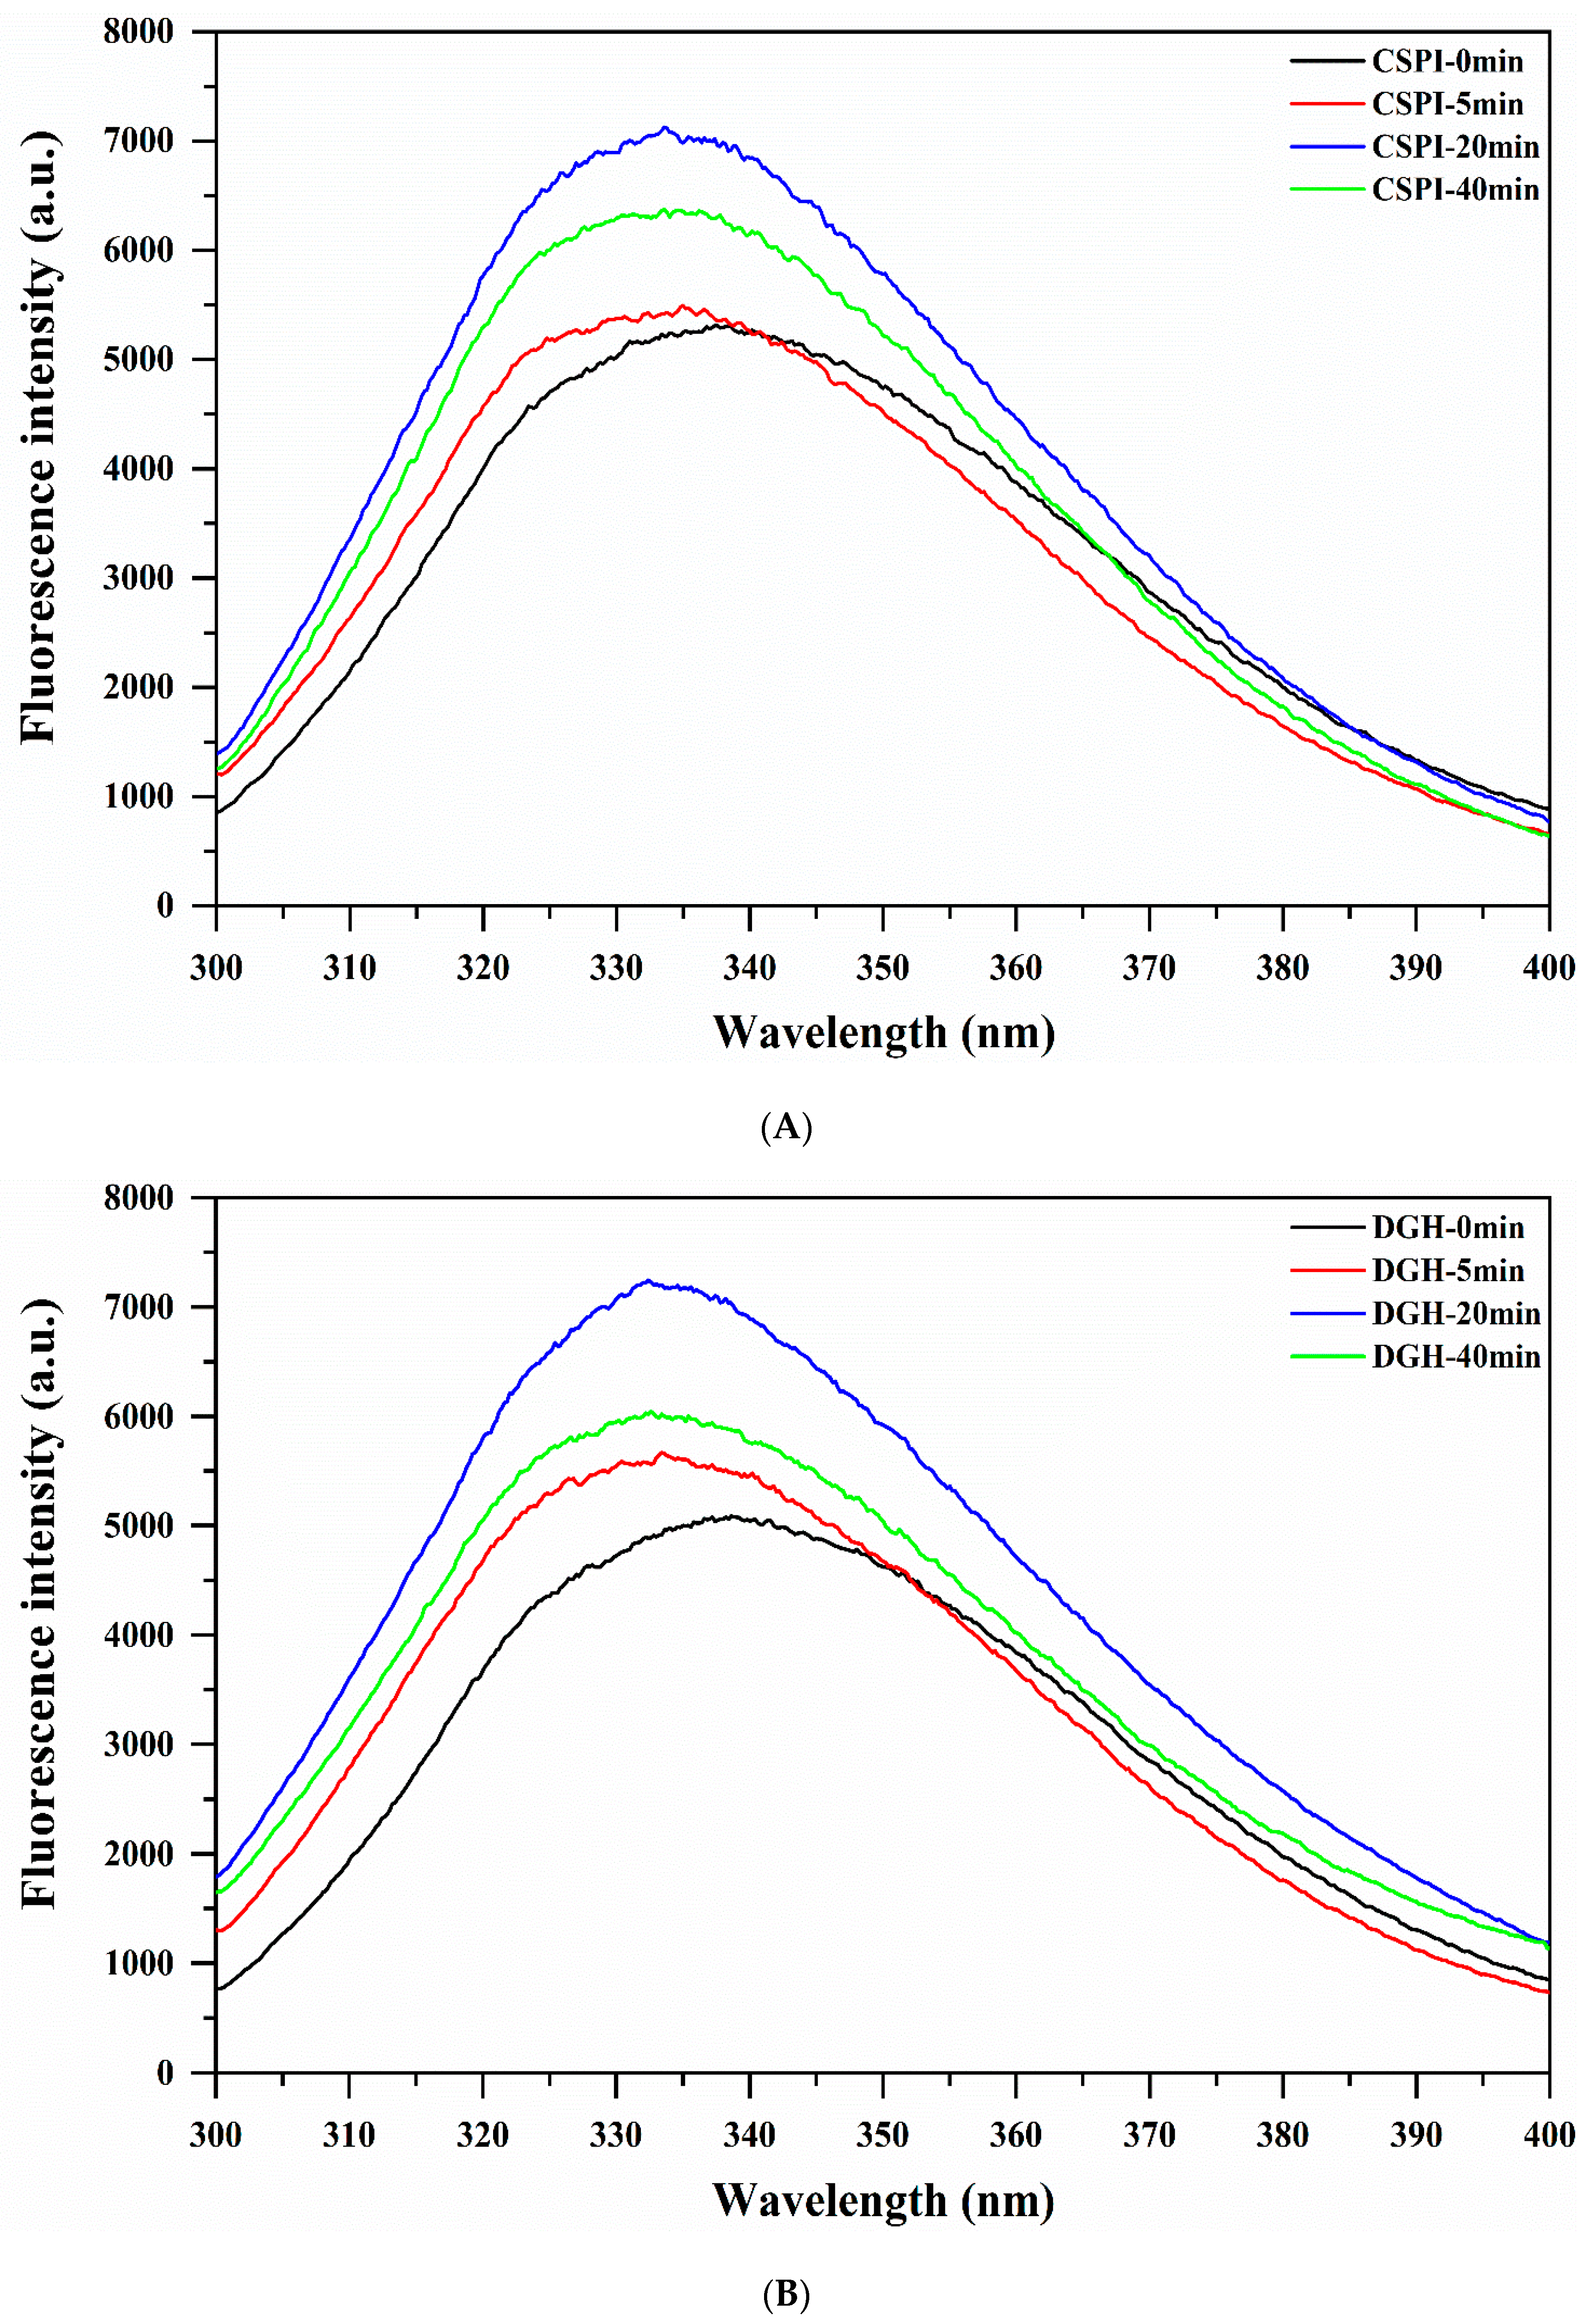
3.6. Intrinsic Fluorescence Spectroscopy
3.7. FT-Raman Spectroscopy
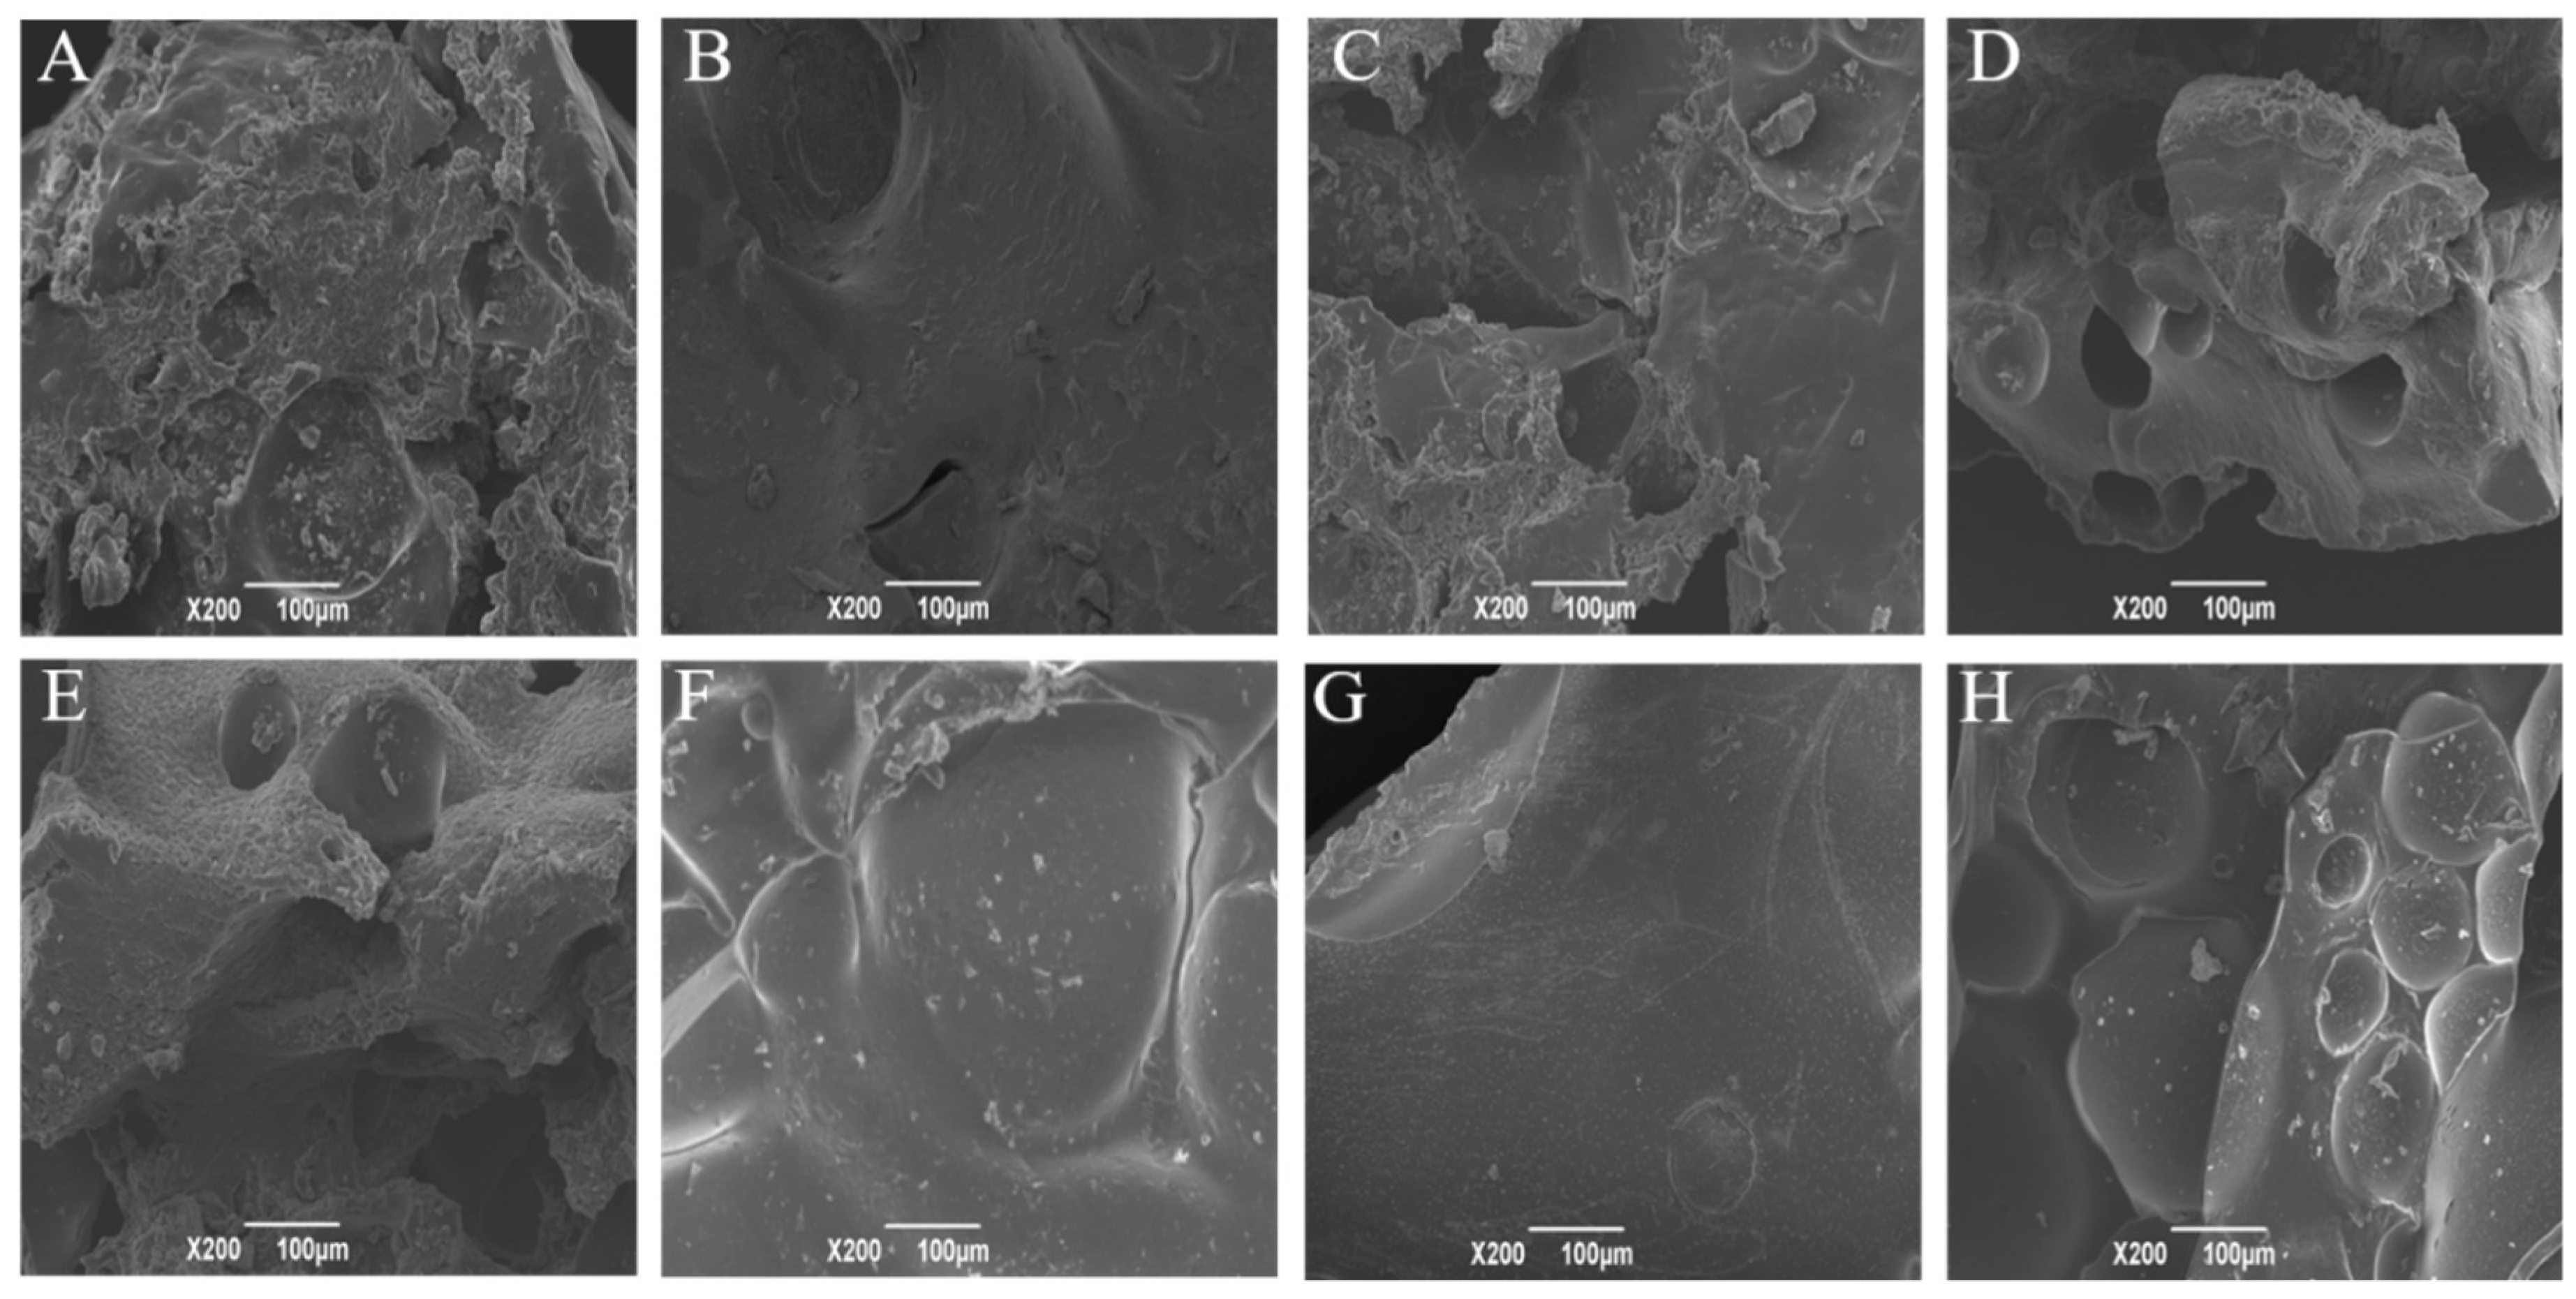
3.8. Scanning Electron Microscopy (SEM)
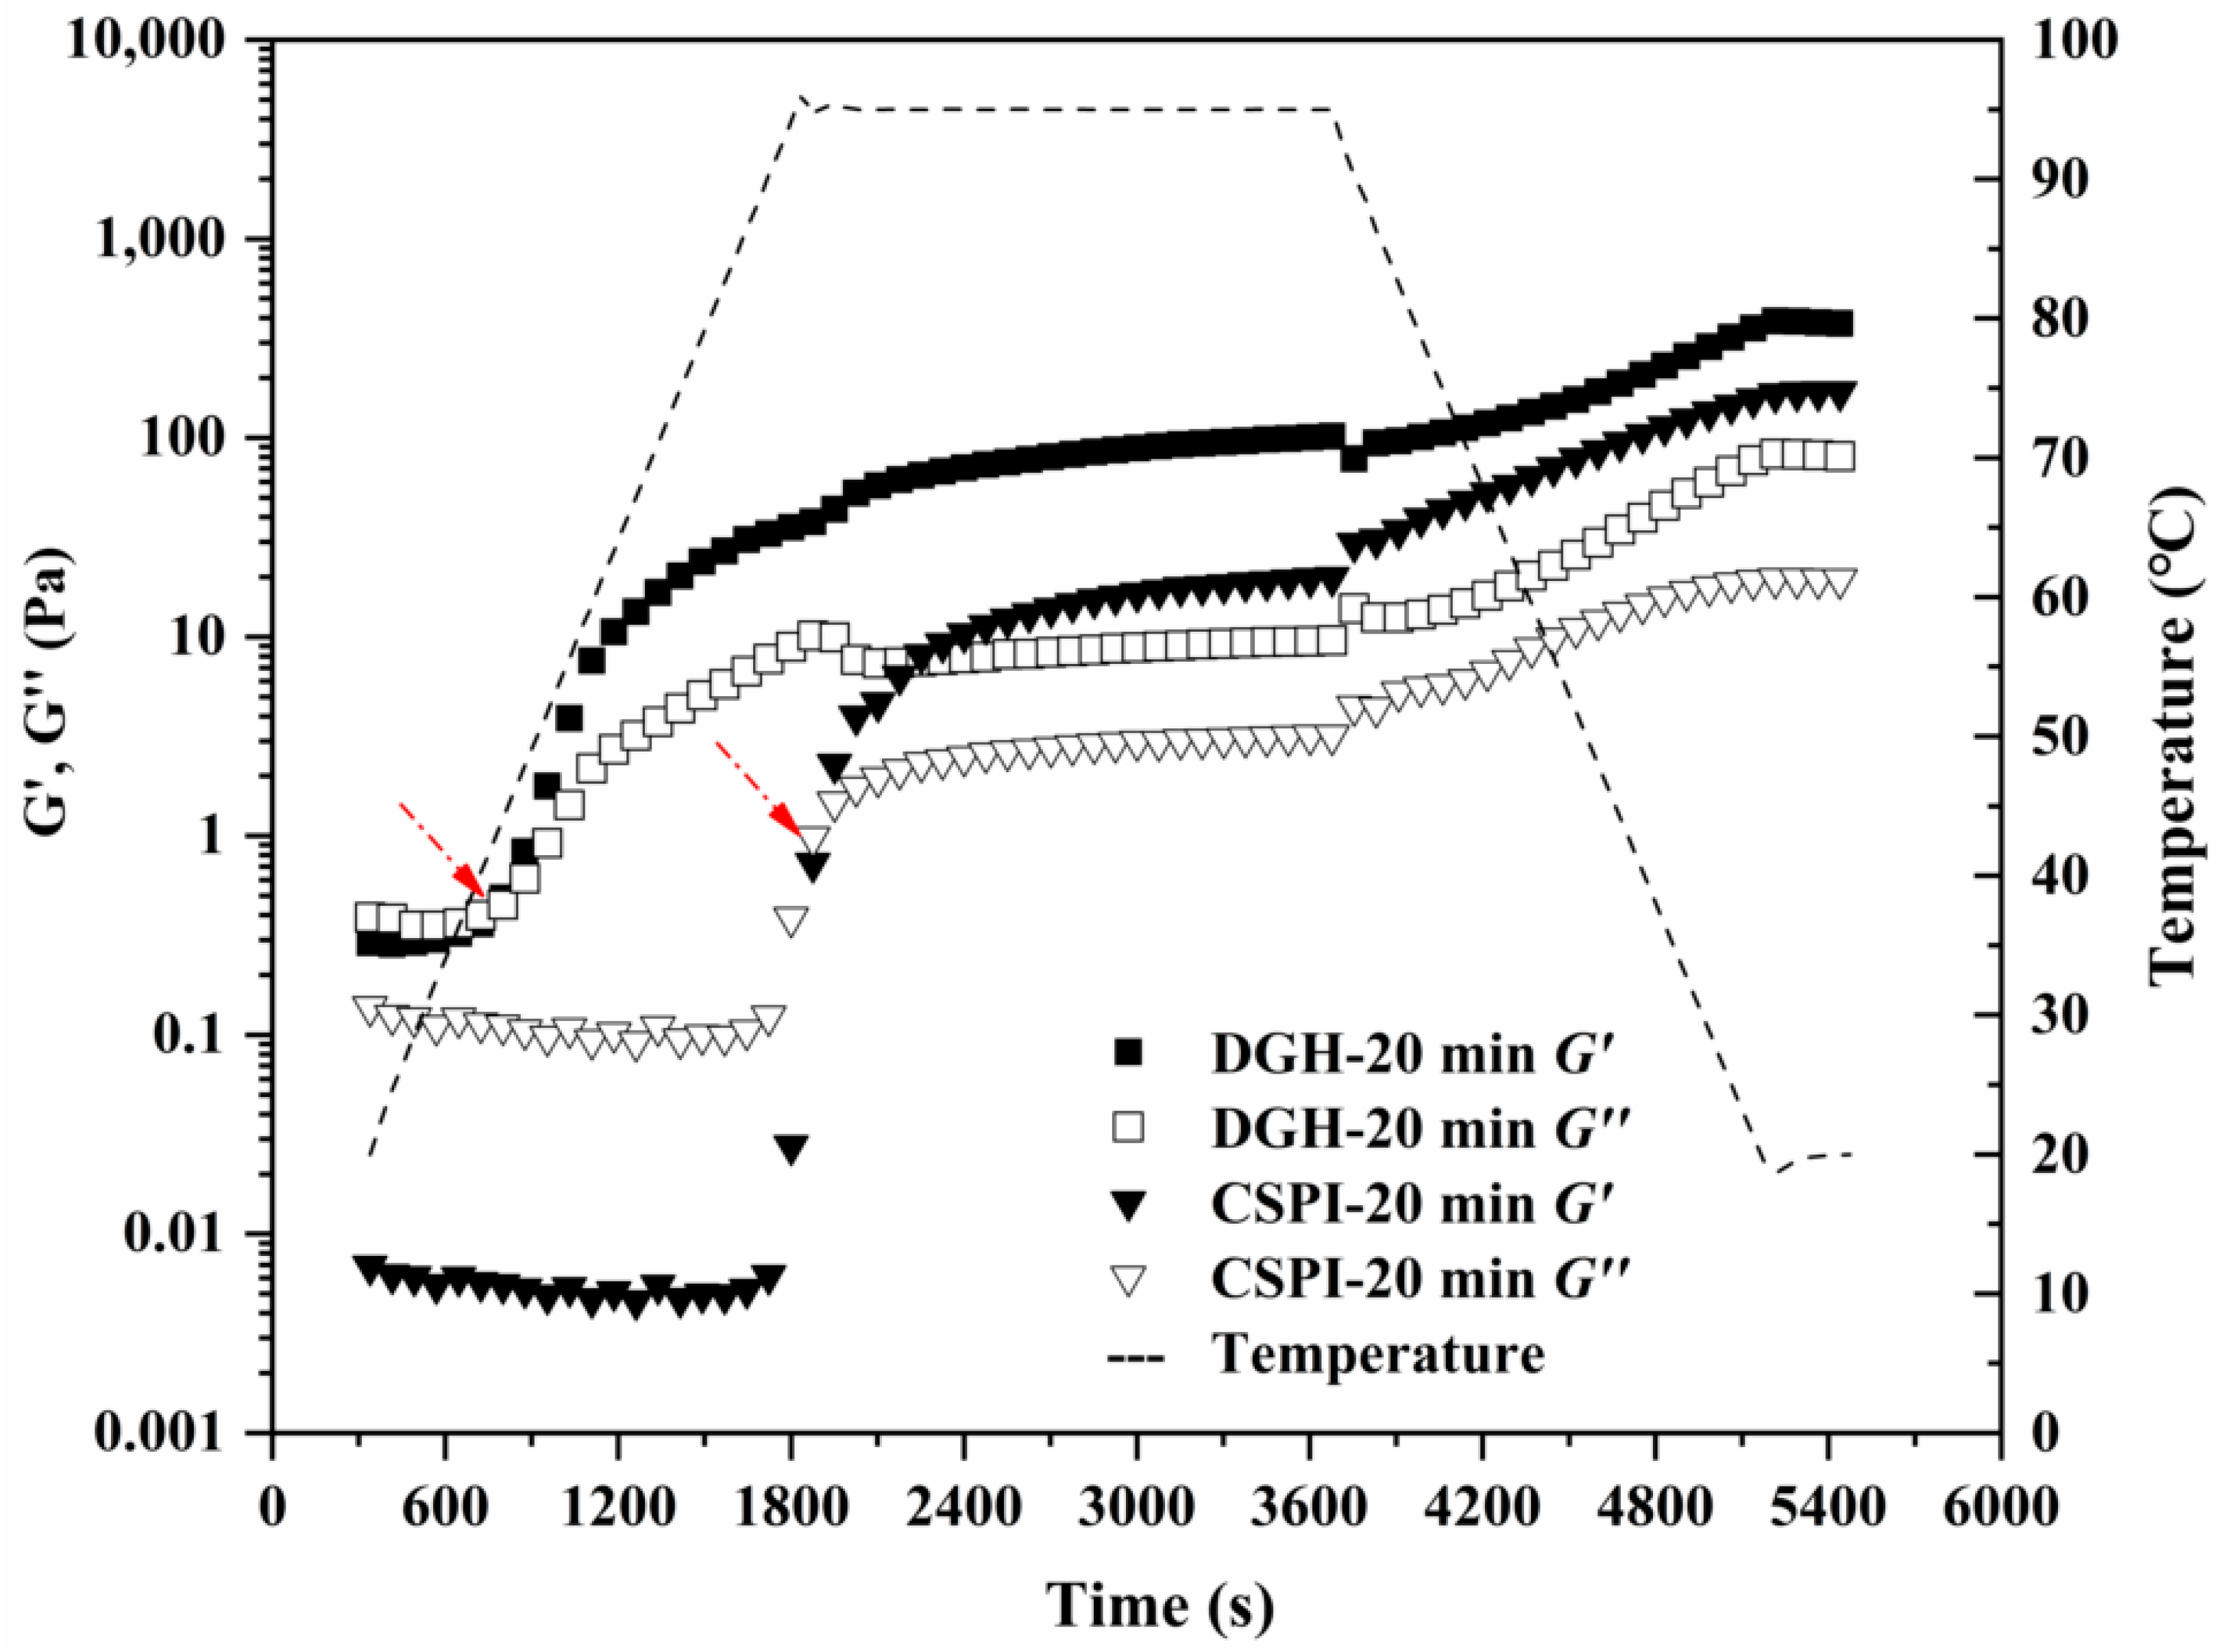
3.9. Gelling Property
4. Conclusions
Author Contributions
Funding
Acknowledgments
Conflicts of Interest
References
- Téllez-Morales, J.A.; Hernández-Santo, B.; Rodríguez-Miranda, J. Effect of ultrasound on the techno-functional properties of food components/ingredients: A review. Ultrason. Sonochem. 2020, 61. [Google Scholar] [CrossRef] [PubMed]
- Zhou, M.; Liu, J.; Zhou, Y.; Huang, X.; Liu, F.; Pan, S.; Hu, H. Effect of high intensity ultrasound on physicochemical and functional properties of soybean glycinin at different ionic strengths. Innov. Food Sci. Emerg. Technol. 2016, 34, 205–213. [Google Scholar] [CrossRef]
- Jambrak, A.R.; Lelas, V.; Mason, T.J.; Krešić, G.; Badanjak, M. Physical properties of ultrasound treated soy proteins. J. Food Eng. 2009, 93, 386–393. [Google Scholar] [CrossRef]
- Arzeni, C.; Martínez, K.; Zema, P.; Arias, A.; Pérez, O.E.; Pilosof, A.M.R. Comparative study of high intensity ultrasound effects on food proteins functionality. J. Food Eng. 2012, 108, 463–472. [Google Scholar] [CrossRef]
- Hu, H.; Wu, J.; Li-Chan, E.C.Y.; Zhu, L.; Zhang, F.; Xu, X.; Fan, G.; Wang, L.; Huang, X.; Pan, S. Effects of ultrasound on structural and physical properties of soy protein isolate (SPI) dispersions. Food Hydrocoll. 2013, 30, 647–655. [Google Scholar] [CrossRef]
- Zheng, T.; Li, X.; Taha, A.; Wei, Y.; Hu, T.; Fatamorgana, P.B.; Zhang, Z.; Liu, F.; Xu, X.; Pan, S.; et al. Effect of high intensity ultrasound on the structure and physicochemical properties of soy protein isolates produced by different denaturation methods. Food Hydrocoll. 2019, 97, 105216. [Google Scholar] [CrossRef]
- Hu, H.; Cheung, I.W.Y.; Pan, S.; Li-Chan, E.C.Y. Effect of high intensity ultrasound on physicochemical and functional properties of aggregated soybean β-conglycinin and glycinin. Food Hydrocoll. 2015, 45, 102–110. [Google Scholar] [CrossRef]
- Chen, L.; Chen, J.; Ren, J.; Zhao, M. Effects of ultrasound pretreatment on the enzymatic hydrolysis of soy protein isolates and on the emulsifying properties of hydrolysates. J. Agric. Food Chem. 2011, 59, 2600–2609. [Google Scholar] [CrossRef]
- Li, W.; Wang, Y.; Zhao, H.; He, Z.; Zeng, M.; Qin, F.; Chen, J. Improvement of emulsifying properties of soy protein through selective hydrolysis: Interfacial shear rheology of adsorption layer. Food Hydrocoll. 2016, 60, 453–460. [Google Scholar] [CrossRef]
- Li, W.; Wang, Y.; Li, J.; Jiao, Y.; Chen, J. Synergistic and competitive effects of monoglycerides on the encapsulation and interfacial shear rheological behavior of soy proteins. Food Hydrocoll. 2019, 89, 631–636. [Google Scholar] [CrossRef]
- Margatan, W.; Ruud, K.; Wang, Q.; Markowski, T.; Ismail, B. Angiotensin converting enzyme inhibitory activity of soy protein subjected to selective hydrolysis and thermal processing. J. Agric. Food Chem. 2013, 61, 3460–3467. [Google Scholar] [CrossRef] [PubMed]
- Xia, W.; Zhang, H.; Chen, J.; Hu, H.; Rasulov, F.; Bi, D.; Huang, X.; Pan, S. Formation of amyloid fibrils from soy protein hydrolysate: Effects of selective proteolysis on β-conglycinin. Food Res. Int. 2017, 100, 268–276. [Google Scholar] [CrossRef] [PubMed]
- Mat, D.J.L.; Cattenoz, T.; Souchon, I.; Michon, C.; Le Feunteun, S. Monitoring protein hydrolysis by pepsin using pH-stat: In vitro gastric digestions in static and dynamic pH conditions. Food Chem. 2018, 239, 268–275. [Google Scholar] [CrossRef] [PubMed]
- Laemmli, U.K. Cleavage of structural proteins during the assembly of the head of Bacteriophage T4. Nature 1970, 225, 680–685. [Google Scholar] [CrossRef] [PubMed]
- Huang, L.; Ding, X.; Li, Y.; Ma, H. The aggregation, structures and emulsifying properties of soybean protein isolate induced by ultrasound and acid. Food Chem. 2019, 279, 114–119. [Google Scholar] [CrossRef]
- Kato, A.; Nakai, S. Hydrophobicity determined by a fluorescence probe method and its correlation with surface properties of proteins. Biochim. Biophys. Acta 1980, 624, 13–20. [Google Scholar] [CrossRef]
- Jiang, L.; Wang, J.; Li, Y.; Wang, Z.; Liang, J.; Wang, R.; Chen, Y.; Ma, W.; Qi, B.; Zhang, M. Effects of ultrasound on the structure and physical properties of black bean protein isolates. Food Res. Int. 2014, 62, 595–601. [Google Scholar] [CrossRef]
- Li-Chan, E.C.Y. The applications of Raman spectroscopy in food science. Trends Food Sci. Technol. 1996, 7, 361–370. [Google Scholar] [CrossRef]
- Puppo, M.C.; Añón, M.C. Soybean protein dispersions at acid pH. Thermal and rheological properties. J. Food Sci. 1999, 64, 50–56. [Google Scholar] [CrossRef]
- Tang, C.H.; Wang, X.Y.; Yang, X.Q.; Li, L. Formation of soluble aggregates from insoluble commercial soy protein isolate by means of ultrasonic treatment and their gelling properties. J. Food Eng. 2009, 92, 432–437. [Google Scholar] [CrossRef]
- Wang, J.M.; Xia, N.; Yang, X.Q.; Yin, S.W.; Qi, J.R.; He, X.T.; Yuan, D.B.; Wang, L.J. Adsorption and dilatational rheology of heat-treated soy protein at the oil-water interface: Relationship to structural properties. J. Agric. Food Chem. 2012, 60, 3302–3310. [Google Scholar] [CrossRef] [PubMed]
- Shanmugam, A.; Chandrapala, J.; Ashokkumar, M. The effect of ultrasound on the physical and functional properties of skim milk. Innov. Food Sci. Emerg. Technol. 2012, 16, 251–258. [Google Scholar] [CrossRef]
- Guo, J.; Yang, X.Q.; He, X.T.; Wu, N.N.; Wang, J.M.; Gu, W.; Zhang, Y.Y. Limited aggregation behavior of β-conglycinin and its terminating effect on glycinin aggregation during heating at pH 7.0. J. Agric. Food Chem. 2012, 60, 3782–3791. [Google Scholar] [CrossRef] [PubMed]
- Mori, T.; Nakamura, T.; Utsumi, S. Gelation Mechanism of Soybean 11S Globulin: Formation of Soluble Aggregates as Transient Intermediates. J. Food Sci. 1982, 47, 26–30. [Google Scholar] [CrossRef]
- Petruccelli, S.; Añón, M.C. Thermal Aggregation of Soy Protein Isolates. J. Agric. Food Chem. 1995, 43, 3035–3041. [Google Scholar] [CrossRef]
- Xiong, W.; Li, J.; Li, B.; Wang, L. Physicochemical properties and interfacial dilatational rheological behavior at air-water interface of high intensity ultrasound modified ovalbumin: Effect of ionic strength. Food Hydrocoll. 2019, 97, 105210. [Google Scholar] [CrossRef]
- Xiong, W.; Wang, Y.; Zhang, C.; Wan, J.; Shah, B.R.; Pei, Y.; Zhou, B.; Li, J.; Li, B. High intensity ultrasound modified ovalbumin: Structure, interface and gelation properties. Ultrason. Sonochem. 2016, 31, 302–309. [Google Scholar] [CrossRef]
- Sun, Y.; Chen, J.; Zhang, S.; Li, H.; Lu, J.; Liu, L.; Uluko, H.; Su, Y.; Cui, W.; Ge, W.; et al. Effect of power ultrasound pre-treatment on the physical and functional properties of reconstituted milk protein concentrate. J. Food Eng. 2014, 124, 11–18. [Google Scholar]
- Chandrapala, J.; Zisu, B.; Palmer, M.; Kentish, S.; Ashokkumar, M. Effects of ultrasound on the thermal and structural characteristics of proteins in reconstituted whey protein concentrate. Ultrason. Sonochem. 2011, 18, 951–957. [Google Scholar] [CrossRef]
- Malik, M.A.; Saini, C.S. Heat treatment of sunflower protein isolates near isoelectric point: Effect on rheological and structural properties. Food Chem. 2019, 276, 554–561. [Google Scholar] [CrossRef]
- Zhu, Z.; Zhu, W.; Yi, J.; Liu, N.; Cao, Y.; Lu, J.; Decker, E.A.; McClements, D.J. Effects of sonication on the physicochemical and functional properties of walnut protein isolate. Food Res. Int. 2018, 106, 853–861. [Google Scholar] [CrossRef] [PubMed]
- Lee, H.; Yildiz, G.; dos Santos, L.C.; Jiang, S.; Andrade, J.E.; Engeseth, N.J.; Feng, H. Soy protein nano-aggregates with improved functional properties prepared by sequential pH treatment and ultrasonication. Food Hydrocoll. 2016, 55, 200–209. [Google Scholar] [CrossRef]
- Jiang, L.; Wang, Z.; Li, Y.; Meng, X.; Sui, X.; Qi, B.; Zhou, L. Relationship between surface hydrophobicity and structure of soy protein isolate subjected to different ionic strength. Int. J. Food Prop. 2015, 18, 1059–1074. [Google Scholar] [CrossRef]
- Gülseren, I.; Güzey, D.; Bruce, B.D.; Weiss, J. Structural and functional changes in ultrasonicated bovine serum albumin solutions. Ultrason. Sonochem. 2007, 14, 173–183. [Google Scholar] [CrossRef] [PubMed]
- Wang, J.Y.; Yang, Y.L.; Tang, X.Z.; Ni, W.X.; Zhou, L. Effects of pulsed ultrasound on rheological and structural properties of chicken myofibrillar protein. Ultrason. Sonochem. 2017, 38, 225–233. [Google Scholar] [CrossRef]
- Li-Chan, E.C.Y.; Ismail, A.A.; Sedman, J.; van de Voort, F.R. Vibrational Spectroscopy of Food and Food Products. In Handbook of Vibrational Spectroscopy; John Wiley & Sons, Ltd: Hoboken, NJ, USA, 2006; ISBN 9780470027325. [Google Scholar]
- Linlaud, N.; Ferrer, E.; Puppo, M.C.; Ferrero, C. Hydrocolloid interaction with water, protein, and starch in wheat dough. J. Agric. Food Chem. 2011, 59, 713–719. [Google Scholar] [CrossRef]
- Byanju, B.; Rahman, M.M.; Hojilla-Evangelista, M.P.; Lamsal, B.P. Effect of high-power sonication pretreatment on extraction and some physicochemical properties of proteins from chickpea, kidney bean, and soybean. Int. J. Biol. Macromol. 2020, 145, 712–721. [Google Scholar] [CrossRef] [Green Version]
- Renkema, J.M.S.; Van Vliet, T. Heat-induced gel formation by soy proteins at neutral pH. J. Agric. Food Chem. 2002, 50, 1569–1573. [Google Scholar] [CrossRef]


| Sample | CSPI | DGH | ||
|---|---|---|---|---|
| Band | MW (kDa) | Content (%) | MW (kDa) | Content (%) |
| α’ | 79.0 | 9.3 | 80.2 | 13.2 |
| α | 70.4 | 13.6 | 71.5 | 25.7 |
| β | 49.5 | 10.6 | 50.4 | 20.1 |
| A3 | 39.2 | 7.6 | 38.6 | 0.1 |
| A1,2,4 | 33 | 27.6 | 32.5 | 1.9 |
| Small fractions | 32~22 | 4.2 | 32~22 | 1.2 |
| B | 19.7 | 25.5 | 20.1 | 0.5 |
| Small fractions | <18.3 | 1.6 | <18.3 | 37.3 |
| Sample | CSPI | DGH | ||
|---|---|---|---|---|
| Z-Average (nm) | PDI | Z-Average (nm) | PDI | |
| 0 min | 66.09 ± 4.93 a | 0.428 ± 0.040 b | 48.90 ± 0.45 a | 0.897 ± 0.108 b |
| 5 min | 90.52 ± 1.13 c | 0.341 ± 0.033 a | 119.57 ± 1.36 c | 0.321 ± 0.038 a |
| 20 min | 72.10 ± 0.03 b | 0.382 ± 0.012 ab | 131.90 ± 1.64 d | 0.308 ± 0.010 a |
| 40 min | 67.42 ± 0.19 ab | 0.374 ± 0.012 a | 75.29 ± 1.59 b | 0.412 ± 0.028 a |
| Composition (%) | CSPI-0 min | CSPI-5 min | CSPI-20 min | CSPI-40 min |
| α-helix structure | 0.83 ± 0.25 a | 8.18 ± 0.39 b | 9.10 ± 0.14 c | 9.03 ± 0.07 c |
| β-sheet structure | 66.43 ± 0.29 c | 61.20 ± 0.87 b | 57.35 ± 0.49 a | 59.60 ± 1.77 b |
| β-turn structure | 0.00 ± 0.00 a | 1.08 ± 0.38 ab | 3.35 ± 0.78 c | 1.80 ± 0.92 b |
| Random coil structure | 32.74 ± 0.53 b | 29.54 ± 0.28 a | 30.20 ± 0.14 a | 29.57 ± 0.78 a |
| Ordered structure | 67.26 ± 0.53 ab | 69.38 ± 0.65 c | 66.45 ± 0.64 a | 68.63 ± 1.70 bc |
| Unordered structure | 32.74 ± 0.53 bc | 30.62 ± 0.65 a | 33.55 ± 0.64 c | 31.37 ± 1.70 ab |
| Composition (%) | DGH-0 min | DGH-5 min | DGH-20 min | DGH-40 min |
| α-helix structure | 0.33 ± 0.21 a | 7.19 ± 0.24 b | 6.83 ± 0.23 b | 7.40 ± 0.44 b |
| β-sheet structure | 60.23 ± 0.57 a | 63.00 ± 0.68 b | 64.90 ± 0.72 c | 63.67 ± 0.87 bc |
| β-turn structure | 0.00 ± 0.00 a | 0.15 ± 0.12 ab | 0.23 ± 0.14 ab | 0.50 ± 0.46 b |
| Random coil structure | 39.44 ± 0.50 c | 29.66 ± 0.34 b | 28.04 ± 0.59 a | 28.43 ± 0.06 a |
| Ordered structure | 60.56 ± 0.50 a | 70.19 ± 0.44 b | 71.73 ± 0.58 c | 71.07 ± 0.50 bc |
| Unordered structure | 39.44 ± 0.50 c | 29.81 ± 0.44 b | 28.27 ± 0.58 a | 28.93 ± 0.50 ab |
| Sample | CSPI | DGH | ||
|---|---|---|---|---|
| λmax (nm) | FI (a.u.) | λmax (nm) | FI (a.u.) | |
| 0 min | 337.4 | 5311.7 ± 10.6 b | 338.6 | 5085.3 ± 24.0 a |
| 5 min | 335.0 | 5493.3 ± 46.7 c | 333.4 | 5668.7 ± 18.4 d |
| 20 min | 333.6 | 7126.0 ± 31.1 g | 332.4 | 7244.0 ± 32.5 h |
| 40 min | 333.6 | 6371.7 ± 53.0 f | 332.6 | 6040.7 ± 15.5 e |
| Band Assignment [Wavenumber (cm−1)] | CSPI-0 min | CSPI-5 min | CSPI-20 min | CSPI-40 min |
| S-S stretching (g-g-g) [500–510] | 1.02 ± 0.02 b | 0.97 ± 0.01 a | 0.97 ± 0.02 a | 0.95 ± 0.03 a |
| S-S stretching (g-g-t) [515–530] | 0.93 ± 0.02 a | 0.99 ± 0.02 b | 1.01 ± 0.03 b | 0.99 ± 0.01 b |
| S-S stretching (t-g-t) [535–545] | 0.91 ± 0.01 a | 0.97 ± 0.01 b | 0.96 ± 0.02 b | 0.97 ± 0.03 b |
| Tyrosine doublet [850 cm−1/830] | 1.07 ± 0.02 d | 0.93 ± 0.02 a | 0.97 ± 0.01 b | 1.01 ± 0.03 c |
| C-H2 bending [1448–1452] | 1.11 ± 0.03 b | 1.03 ± 0.02 a | 1.09 ± 0.03 b | 1.13 ± 0.04 b |
| C-H stretching [2929–2937] | 1.70 ± 0.04 b | 1.55 ± 0.05 a | 1.69 ± 0.04 b | 1.68 ± 0.03 b |
| Band Assignment [Wavenumber (cm−1)] | DGH-0 min | DGH-5 min | DGH-20 min | DGH-40 min |
| S-S stretching (g-g-g) [500–510] | 1.03 ± 0.04 c | 0.94 ± 0.01 ab | 0.96 ± 0.02 b | 0.90 ± 0.03 a |
| S-S stretching (g-g-t) [515–530] | 0.91 ± 0.02 a | 1.05 ± 0.02 b | 1.13 ± 0.05 c | 0.99 ± 0.04 b |
| S-S stretching (t-g-t) [535–545] | 0.88 ± 0.01 a | 1.04 ± 0.03 c | 1.11 ± 0.04 d | 0.96 ± 0.04 b |
| Tyrosine doublet [850 cm−1/830] | 1.14 ± 0.04 c | 0.96 ± 0.02 b | 0.88 ± 0.02 a | 1.03 ± 0.06 b |
| C-H2 bending [1448–1452] | 1.23 ± 0.05 c | 1.16 ± 0.03 b | 1.01 ± 0.02 a | 1.17 ± 0.02 bc |
| C-H stretching [2929–2937] | 1.84 ± 0.08 c | 1.62 ± 0.05 b | 1.44 ± 0.03 a | 1.70 ± 0.06 b |
© 2020 by the authors. Licensee MDPI, Basel, Switzerland. This article is an open access article distributed under the terms and conditions of the Creative Commons Attribution (CC BY) license (http://creativecommons.org/licenses/by/4.0/).
Share and Cite
Xia, W.; Pan, S.; Cheng, Z.; Tian, Y.; Huang, X. High-Intensity Ultrasound Treatment on Soy Protein after Selectively Proteolyzing Glycinin Component: Physical, Structural, and Aggregation Properties. Foods 2020, 9, 839. https://doi.org/10.3390/foods9060839
Xia W, Pan S, Cheng Z, Tian Y, Huang X. High-Intensity Ultrasound Treatment on Soy Protein after Selectively Proteolyzing Glycinin Component: Physical, Structural, and Aggregation Properties. Foods. 2020; 9(6):839. https://doi.org/10.3390/foods9060839
Chicago/Turabian StyleXia, Wenjie, Siyi Pan, Zhe Cheng, Yan Tian, and Xingjian Huang. 2020. "High-Intensity Ultrasound Treatment on Soy Protein after Selectively Proteolyzing Glycinin Component: Physical, Structural, and Aggregation Properties" Foods 9, no. 6: 839. https://doi.org/10.3390/foods9060839