Analytical and Sample Preparation Techniques for the Determination of Food Colorants in Food Matrices


1
Department of Chemical Engineering, Aristotle University of Thessaloniki, 54124 Thessaloniki, Greece
2
Laboratory of Forensic Medicine & Toxicology, Department of Medicine, Aristotle University of Thessaloniki, 54124 Thessaloniki, Greece
3
BIOMIC AUTH Center for Interdisciplinary Research of the Aristotle University of Thessaloniki, Innovation Area of Thessaloniki, 57001 Thermi, Greece
*
Author to whom correspondence should be addressed.
Foods 2020, 9(1), 58; https://doi.org/10.3390/foods9010058
Submission received: 28 November 2019
/
Revised: 27 December 2019
/
Accepted: 3 January 2020
/
Published: 7 January 2020
(This article belongs to the Special Issue Application of Analytical Chemistry to Foods and Food Technology)
Abstract
:Color additives are widely used by the food industry to enhance the appearance, as well as the nutritional properties of a food product. However, some of these substances may pose a potential risk to human health, especially if they are consumed excessively and are regulated, giving great importance to their determination. Several matrix-dependent methods have been developed and applied to determine food colorants, by employing different analytical techniques along with appropriate sample preparation protocols. Major techniques applied for their determination are chromatography with spectophotometricdetectors and spectrophotometry, while sample preparation procedures greatly depend on the food matrix. In this review these methods are presented, covering the advancements of existing methodologies applied over the last decade.
1. Introduction
Codex Alimentarius gives a definition for food additives as “any substance that its intentional addition of which to a food aiming for a technological (including organoleptic) purpose in the manufacture, processing, preparation treatment, packing, packaging, transport or holding of such food results, or may be reasonably expected to result, in it or its by-products becoming a component of the food or otherwise affecting the characteristics of such foods” [1,2]. Carocho et al. highlighted that the definition given by the Codex Alimentarius does not include the term contaminants or substances added to food for maintaining or improving nutritional qualities [2].
In food technology, food colorants, of several types, are chemical substances that are added to food matrices, to enhance or sustain the sensory characteristics of the food product, which may be affected or lost during processing or storage, and in order to retain the desired color appearance [3,4,5]. These are classified based on several criteria: firstly, based on their origin in nature, nature-identical or, if synthetic, whether they are organic or inorganic. Another classification could be based on their solubility (e.g., soluble or insoluble) or covering ability (e.g., transparent or opaque), though an overlap may exist among one or more of these classifications. The most common and widely used classification is based on the distinction between soluble and insoluble color additives (colorants or pigments), which can be further categorized as natural or synthetic [4].
In addition, as described by Martins et al., there were several food additives that had been used extensively in the past but are no longer allowed, due to existing evidence of their side effects, toxicity in the medium- and long-term, as well as a high frequency of potential health incidents [6]. It is also important to note that, apart from synthetic food colorants, certain commercial additives of plant or animal origin have also been suspended [3,6,7,8].
It is clear that the analysis of trace amounts of food colorants is essential with the proper analytical techniques applied, with high specificity and selectivity. Ni et al. has reported that there is increasing interest in the monitoring of the concentration of synthetic food colorants in various products [9].
The analytical methods and sample preparation protocols presented hereafter cover the main techniques that have been applied over the last decade (2008 onwards).
2. Natural Food Colorants
Natural additives have been used since ancient times. In certain cases, they were used for the preservation of foodstuffs. Nowadays, most consumers seem to be in favor of the use of the natural, as opposed to the synthetic ones, which are considered by the food industry to be more efficient. In the meantime, there is also considerable interest in the overall reduction of food colorants to food products [4,5,10]. The classification of naturally derived colorants can become very complex because of the wide variety of innate properties of the coloring substances. They can be derived from a variety of sources in nature, and therefore, natural colorants also exhibit a wide variety of chemical compositions that affect properties, solubilities, and stabilities differently, and they can have different sources as plant-origin or animal-origin [10].
As reported by Carocho et al., there are benefits linked with the use of natural additives over their respective synthetic ones, which in certain cases present a greater potency over the synthetic ones. The latter in most cases present a single effect on the foodstuff in question. Nevertheless, natural additives are often produced using different methods, i.e., extraction from plants or produced by microorganisms, although there is a tendency to consider them safer than their respective synthetic additive. In general, toxicity is a factor that must be thoroughly assessed and evaluated, to ensure health and safety [2,5,10].
Synthetic colorants have a large span of application and are proportionally lower in cost, than their respective natural substances. However, natural colorants are gradually replacing the synthetic ones as they tend to be considered safer, while presenting higher color specificity, no side effects or related toxicity, and conferring health improving effects and functional benefits to the food itself [6,11,12]. A good example for this beneficial effect is the class of yeast-derived natural pigments (e.g., monascin; a yellow natural pigment). These present certain features, apart from food coloring, such as biological activity, reported potential anti-cancer, anti-inflammatory, anti-diabetic, and anti-cholesterolemic effects [6,13,14].
As reported by Martins et al., numerous references highlighted the effective and/or selective use of food colorants. Therefore, for the approved food colorants with an “E” code, individual Acceptable Daily Intakes (ADI) have been approved and established, expressed mostly as mass fractions (i.e., mg/kg per body weight (b.w), which can be used for specific purposes (i.e., colorants) in specific food products (i.e., biscuits, chocolates, cheeses etc.) [6].
Commonly, naturally occurring food colorants can be allocated in different sub-categories, namely anthocyanins, carotenoids, beet colorants, and phenolic compounds. In addition, annatto, carminic acid, and some curcuminoids have been studied, particularly curcumin. Finally, other colorants remain to be assessed and evaluated in order to be authorized with an “E” code.
Anthocyanins are a widely studied natural food colorants group, mainly obtained from flowers, fruits, leaves, and even whole plants with a color range that goes from red to purple and blue. Commercial anthocyanins, such as cyanidin 3-glucoside, pelargonidin 3-glucoside, and peonidin 3-glucoside have been used effectively [2,4,6].
Carotenoids are another cluster of naturally derived colorants with a renowned technological effect. They present coloring attributes along with certain bioactive as well as antioxidant properties and are being used extensively in the food industry as natural preservatives [4,6,7,10,15] apart from food colorants [7]. Their main source is extracts from plant roots, flowers, and leaves, as well as from algae, yeasts, and aquatic animals. This category mainly includes Lutein, astaxanthin, and lycopene [2,6], the most widely used carotenoids used with others such as crocin and crocetin, still under investigation [4,5,6].
Red-purple colorants derived from beets and beetroot (Beta vulgaris L.) root is the principal source of these natural colorants but also fruit of Hylocereus polyrhizus (Weber) Britton and Rose, Opuntia ficus-indica [L.] Miller, Opuntia stricta (Haw). Haw and Rivina humilis L. are also rich in these colorant substances, namely, the betacyanins and betalains, which are the most frequently studied and already authorized (E162). They are being used in various food products such as burgers, desserts, ice creams, jams, jellies, soups, sauces, sweets, drinks, dairy products, and yogurts [2,4,5,6].
Other natural food colorants are considered the phenolic compounds, where flavanones, flavones (4′,5,7-trihydroxyflavones), and flavonols (fisetin, myricetin, myricitin, quercetin, and rutin) have been studied. As reported by Martins et al., currently only the commercially available products are being used (i.e., myricetin and myricitrin from Myrica cerifera L. roots). Phenolic compounds do not yet have an approved “E” code nor an ADI value [6] with many still being studied and examined since their safety, stability, and spectrum of activity still remain unclear [6,16].
Another category of natural food colorant is the curcuminoids with the most widely known and used colorant in this group being curcumin (E100), usually isolated from Curcuma longa L. rhizomes.
Other natural used colorants are the annatto (E160b) group, as well as bixin and norbixin which are extracts from Bixa orellana L. seeds [2,4,5,6]. In addition, carminic acid (E120) with a yellow to red-orange food color is already largely used, either naturally occurring or of synthetic origin with an ADI of 5 mg/kg b.w [6] or crocin. Nevertheless, there are other food colorants under investigation, including c-phycocyanin (blue pigment isolated from Arthrospira platensis) and c-phycoerythrin (red-orange pigment from blue-green algae). Other naturally occurring pigments, which are commercially available, are being studied, such as geniposide, monascorubrin, and purple corn color [4,5,6].
3. Synthetic Food Colorants
Based on increasing demand, mainly from the consumer, for products that are more visually attractive, several synthetic food colorants have been developed for use in food production, to increase certain quality and organoleptic characteristics. However, it is reported that over time, most of the synthetic food colorants were excluded due to repeated side effects as well as to their short- and/or long-term toxicity and eventually to potential carcinogenic effects [3,6,11].
Thus, a change in consumer expectations has been reported, which is largely in favor of the natural colorants [6,17].
Apart from this, also from a regulatory point of view, there is increasing attention and interest related to the risk assessment of these colorants used in food products (i.e., azo-dyes). In case of the azo-dyes, a limiting factor for their use is their potential carcinogenicity, which occurs after their reduction to carcinogenic metabolites into the intestine [3,18,19]. These metabolites are produced in the human body, though their toxic effect depends on the ingested amount of the target substance/colorant [3,18,20]. However, it is reported that regular evaluation and assessment of potential toxicity of food colorants by regulatory authorities is necessary [3,18,21].
4. Toxicological Aspects and Regulatory Framework
Based on various scientific findings, several toxicity effects, have been reported including behavioral effects on children, effects on the respiratory system, connection with allergies, development of attention deficit hyperactivity disorder (ADHD) in children, or neuro-developmental effects at the No-Adverse Effect Limit levels [3,18,21]. In any case, further investigation to assess the potential associated risks of these compounds is needed [3,4,5,6,7,8,9,11,14,18].
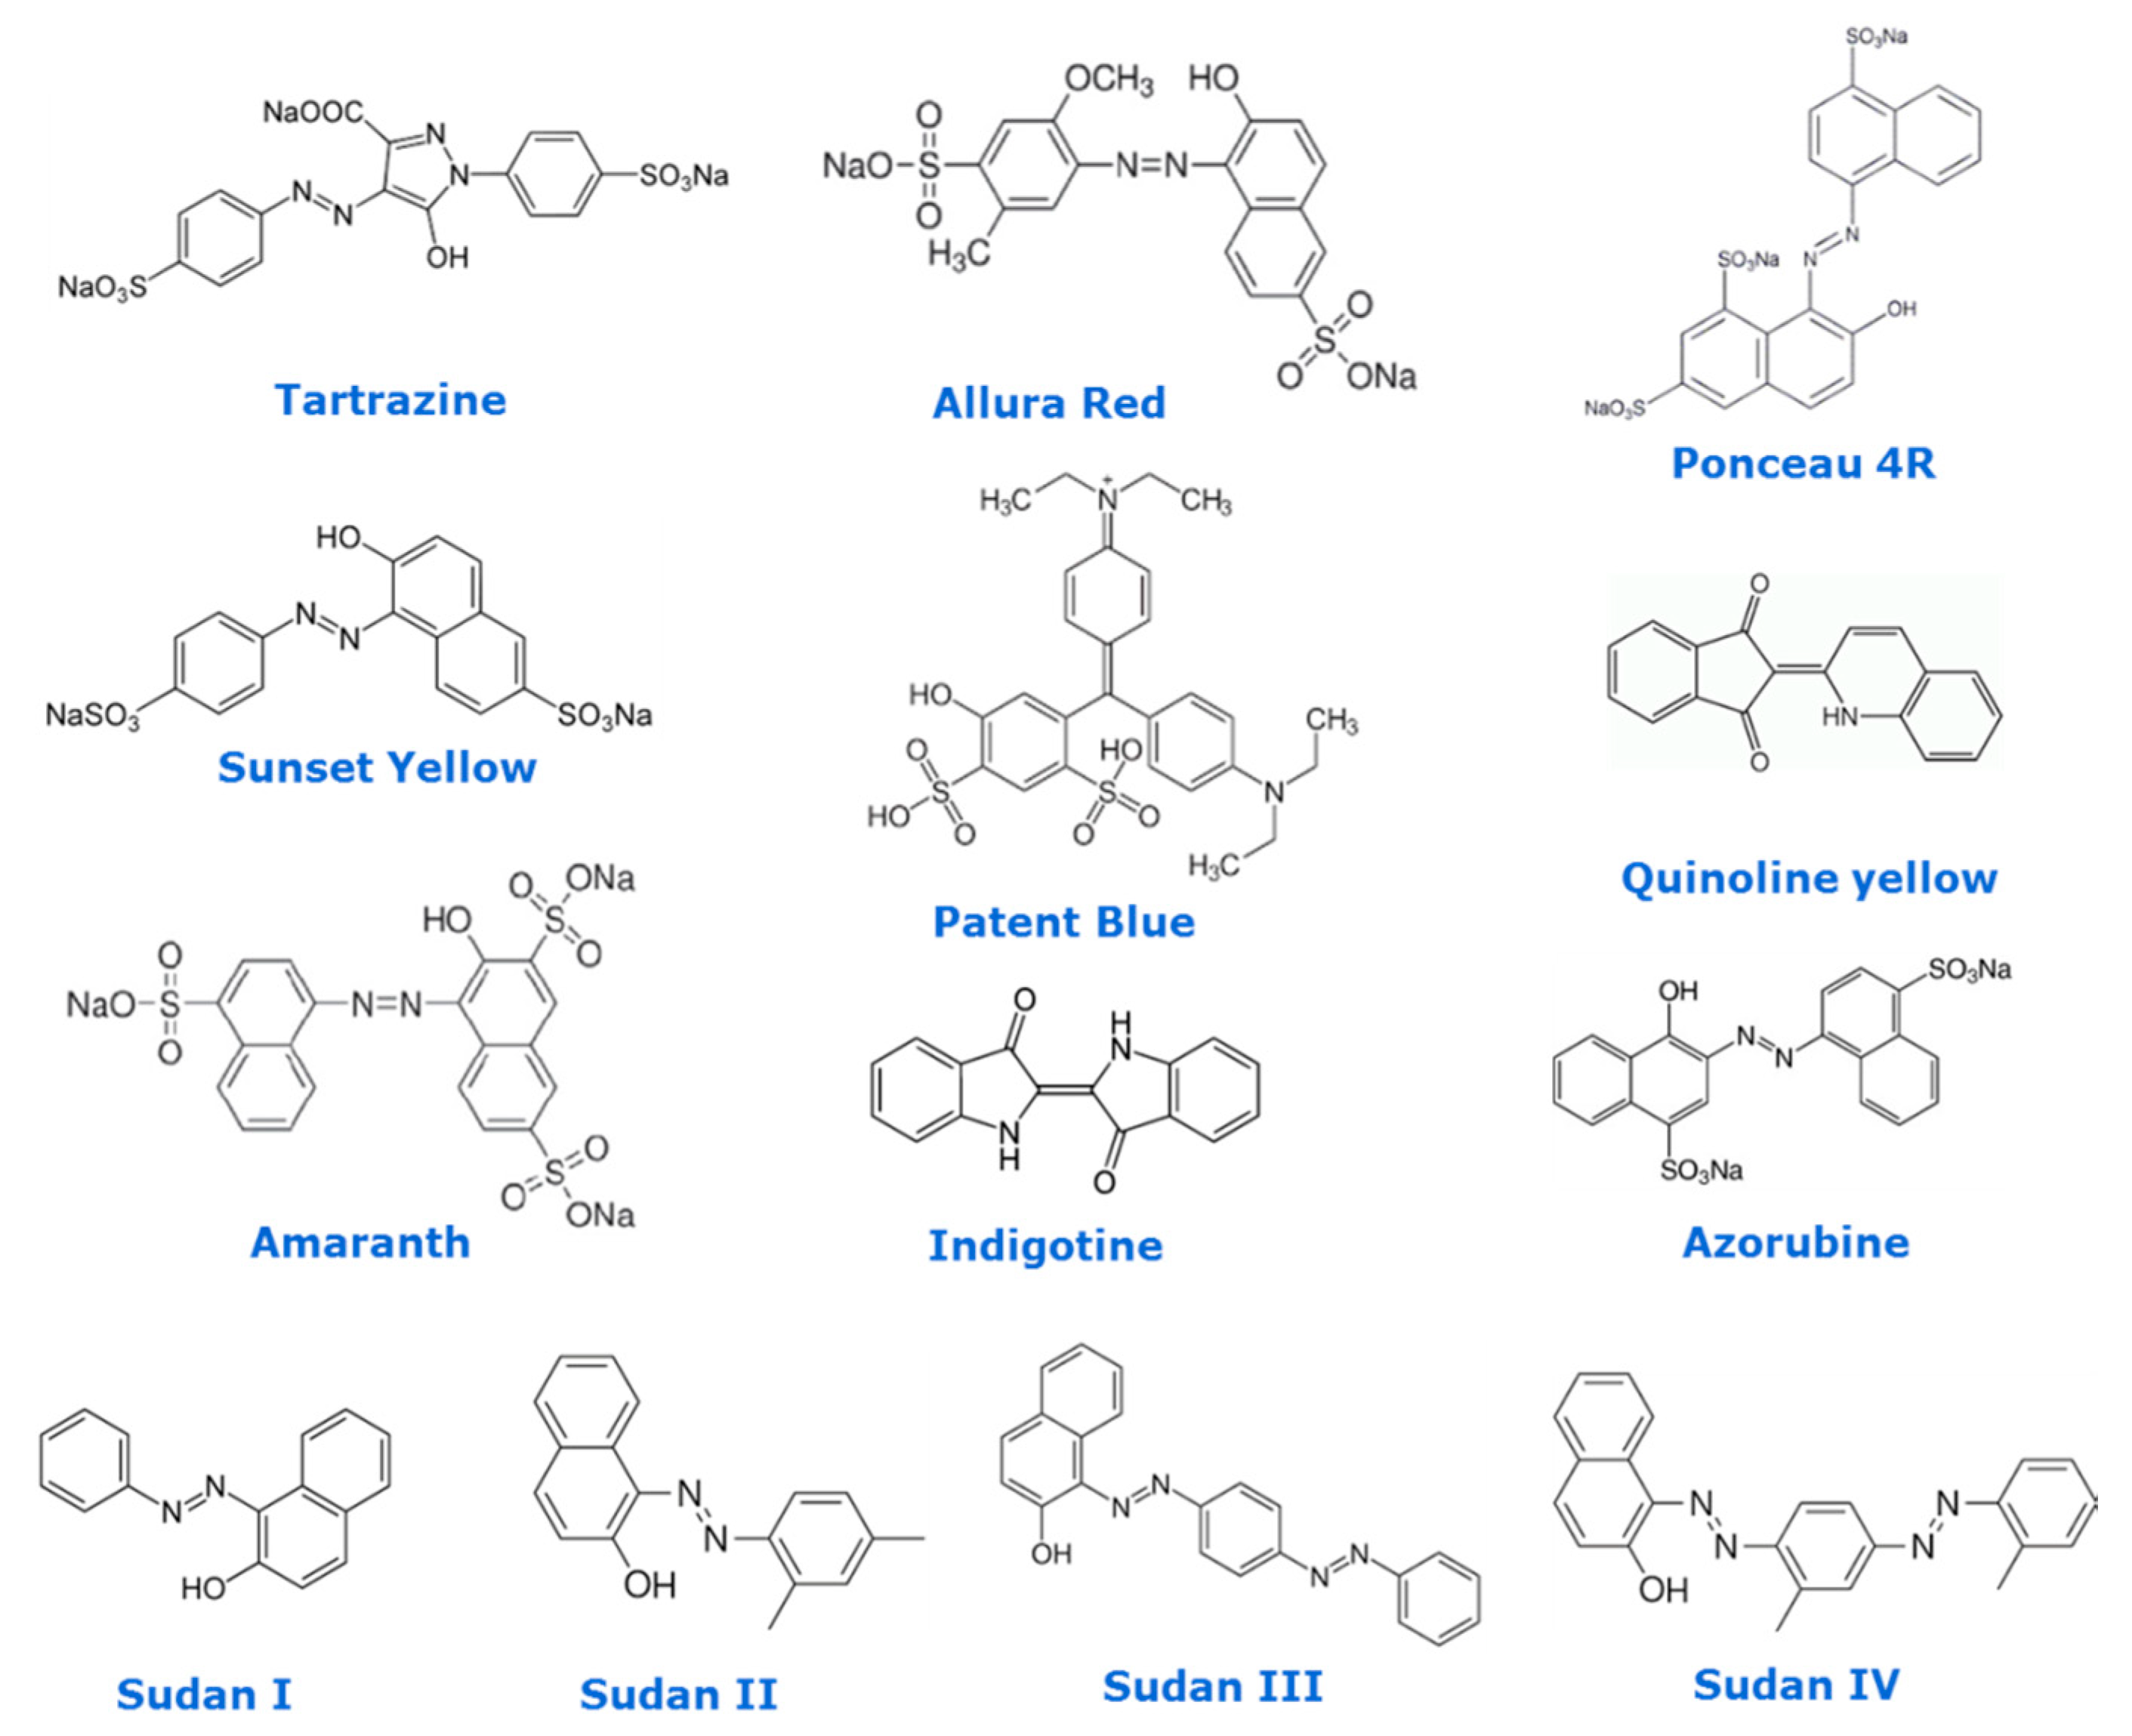
Several groups have indicated the toxic effect of some of groups of these substances. As an example, Mpountoukas et al. have tested the food colorants amaranth, erythrosine, and tartrazine by in vitro experiments, and they concluded there was an in vitro toxic effect on human lymphocytes as they bound to DNA [22]. Many other studies have shown the chemical property of synthetic colorants, namely, Tartrazine [23], azorubine [17,24,25], Allura Red [17,26,27] Sunset Yellow, Quinoline Yellow [17], and Patent Blue [28], to bind to human serum albumin (HSA). Masone and Chanforan compared binding affinities of artificial colorants to human serum albumin (HSA), exhibiting more affinity to HSA than to their natural equivalents’ colorants and interacting with its functions. The results supported the hypothesis of their potential risk to human health [17]. Finally, there are dyes, which are rather inexpensive, and which have been used in the food industry, such as Sudan I–IV, which are classified as both a toxic and carcinogenic [24,25,26,27,28,29,30,31]. In Figure 1, basic structures of colorants used in the food industry some of them with toxicological concern (Sudan I–IV) are presented.
The main regulatory authorities, EFSA in Europe and the US Food and Drug Administration (FDA) in the United States, are responsible for the evaluation and assessment of food products to enhance and promote health safety [2,4,5]. The European Union, set a re-evaluation program of food additives, including food colorants, to be performed by EFSA by 2020, based on the EU Regulation 257/2010. This re-evaluation program was set in order to assess the safety of all authorized food additives in the European Union before 20 January 2009 [32].
The regulatory framework in Europe, in brief, contains the authorization procedure in Regulation (EU) No. 1331/2008, the rules on food additives with a list of approved color additives and their conditions of use in Regulations (EU) No 1333/2008 and 1129/2011, the specifications for food additives in Regulation (EU) 231/2012, and finally for labelling in Regulations (EU) No. 1169/2011 and 1333/2008. Respectively, in the United States, the color additives are included in Title 21 CFR Part 70, listing food additives (exempt from certification, including specifications and conditions of use) in Title 21 CFR Part 73, and certification of donor additives in Title 21 CFR Part 80 [4,5,10,33].
However, despite the existence of different regulatory frameworks, the overall approach follows similar steps, which are based on well-established risk assessment procedures [33].
Authorization for the use of food colorants in the production of food products is subject to a number of toxicity tests, in order to define and evaluate acute, sub-chronic and chronic toxicity, hepatotoxicity, carcinogenicity, mutagenicity, teratotoxicity, genotoxicity, reproductive toxicity, accumulation in the body, bioenergy effects, and immunotoxicity [3,4,5,6,7,8,9,11,14,18].
5. Analytical Methodologies for the Determination of Food Colorants
5.1. Analytical Techniques in the Use of Natural Food Colorants Determinations
The available bibliography concerning the methods of analysis for the natural colorants is limited, compared to that for the synthetic ones, and it is exclusively oriented to their determination in the different naturally deriving products.
All the relative information concerning analytical methods for natural colorants, including tested matrices, analytical technology, type of detection and settings, analytical columns if used, elution parameters, mobile phases, injection volumes, and analytical figures of merit (LOD, LOQ), have been reviewed and are summarized in Table 1.
It can be concluded from Table 1 that evaluation of methods’ performance criteria was not within the aims of the above-mentioned reports, as they were focusing in activity, bioavailability, processing impact, and adulteration. Thus, no analytical figures of merit are reported in these papers.
From Table 1 and Figure 2 it could be perceived that the predominant technique is HPLC combined with spectrophotometric (UV-Vis) or Diode Array (DAD) detectors, followed by HPLC by MS/MS. Spectrophotometric UV-Vis methods seem also to be preferred by the researchers in this field as they show low instrument cost and do not involve expert skill. However, it should be considered that the individual features of the spectra obtained for single colors are highly dependent on the pH-adjustment of the solution or the mobile phase, using proper acid or alkali. The pH adjustment certainly affects maximum absorption wavelength, where shifts and intensities based on the different pH can be observed. Although sample preparation is much less demanding in comparison to the LC methods, these techniques present a significant disadvantage, which is the lack of ability to analyze simultaneously a bigger number of food colorants.
5.2. Sample Preparation for Natural Colorant Analysis
Several sample preparation protocols are reported in the literature by applying various techniques. The applied protocol is strongly dependent by the type and nature of the food sample. Below in Table 2, a short description of the sample preparation protocols is given, along with their application for the clean-up of food samples, for the quantification of natural food colorants. A hydrolysis step with a deprotonation step (ethanol, HCl solution) is being reported depending on the food matrix, including dilution methods and SFE with supercritical CO2.
5.3. Analytical Techniques in the Use of Synthetic Food Colorants Determinations
The need to determine synthetic colorants in food matrices originating from their known toxicity, renders the analytical task even more challenging as food matrices are ordinarily very complex. Various analytical techniques are used to determine synthetic food colorants in food samples, including spectrophotometry, thin layer chromatography, capillary electrophoresis, high performance liquid chromatography and mass spectrometry (MS).
Certain chemical properties and characteristics of the substances/colorants that influence their separation, such as hydrophilicity/hydrophobicity, existence of acidic or alkaline groups should to be taken into account. Using a Reversed Phase (RP) liquid chromatography separation, more polar compounds are eluting first followed by the less polar. However, their chromatographic separation is normally performed at neutral pH (ca. 7), and thus, any presence of acidic or alkaline groups could affect the elution sequence.
Ordinarily, organic solvents such as methanol, acetonitrile, or their mixture are used for analysis by HPLC. The addition of acetonitrile improves significantly chromatographic peaks’ shape (i.e., asymmetry). Nevertheless, the addition of an inorganic electrolyte as a chemical modifier to the mobile phase can be considered as important in order to advance the separation of all the ionizable species [12,28,37,49].
Food colorants are compounds that absorb exceedingly in the visible region. Thus, spectrophotometry is sufficient and appropriate for their quantitative analysis. It is generally preferred as a quite straightforward technique, with respective low instrumental cost (i.e., compared to MS/MS). However, in several cases, its main drawback is the lack of specificity, as in case of mixtures of absorbing species. A solution to overcome the problem of specificity is the application of mass spectrometry (MS). In this case, all spectral interventions or interferences, presented on UV–Vis/DAD detectors, are overpassed. High analytical sensitivity could succeed, even in more difficult food matrices, though after proper clean-up. In addition, tandem MS technique could provide structural information based on the molecular mass/ion and the respective fragmentation pattern. Regarding the ionization mode, in most cases, for synthetic colorants, the electro spray ionization (ESI) is preferred because synthetic food colorants are polar molecules, and their ionization efficiency depends on the existence of matrix interferences, present in sample or in the mobile phase. In general, negative mode (ESI-) is more effective, though in other non-regulated substances (i.e., Sudan I-IV) the positive ionization is preferred. During the MS/MS analysis, chemical modifiers (i.e., HCOONH4 or CH3COONH4) are added to the mobile phases, in order to improve and facilitate the better ionization of each target analyte.
Capillary electrophoresis follows in frequency of use the HPLC-DAD/UV-Vis or MS/MS techniques, applied for the quantification of food colorants. These methods present good separation of both small and large molecules, using high voltages. Other reported techniques are FIA (Flow Injection Analysis) and TLC (Thin Layer Chromatography). These could be considered as relatively simple analytical techniques, even for quantification, though in certain cases they could lack specificity and could be affected by matrix interferences.
For synthetic food colorants, all the respective references containing details about the tested matrices, analytical techniques, detection and settings, analytical columns if used, elution, mobile phases, injection volumes, and figures of merit (LOD, LOQ) are presented below in Table 3.
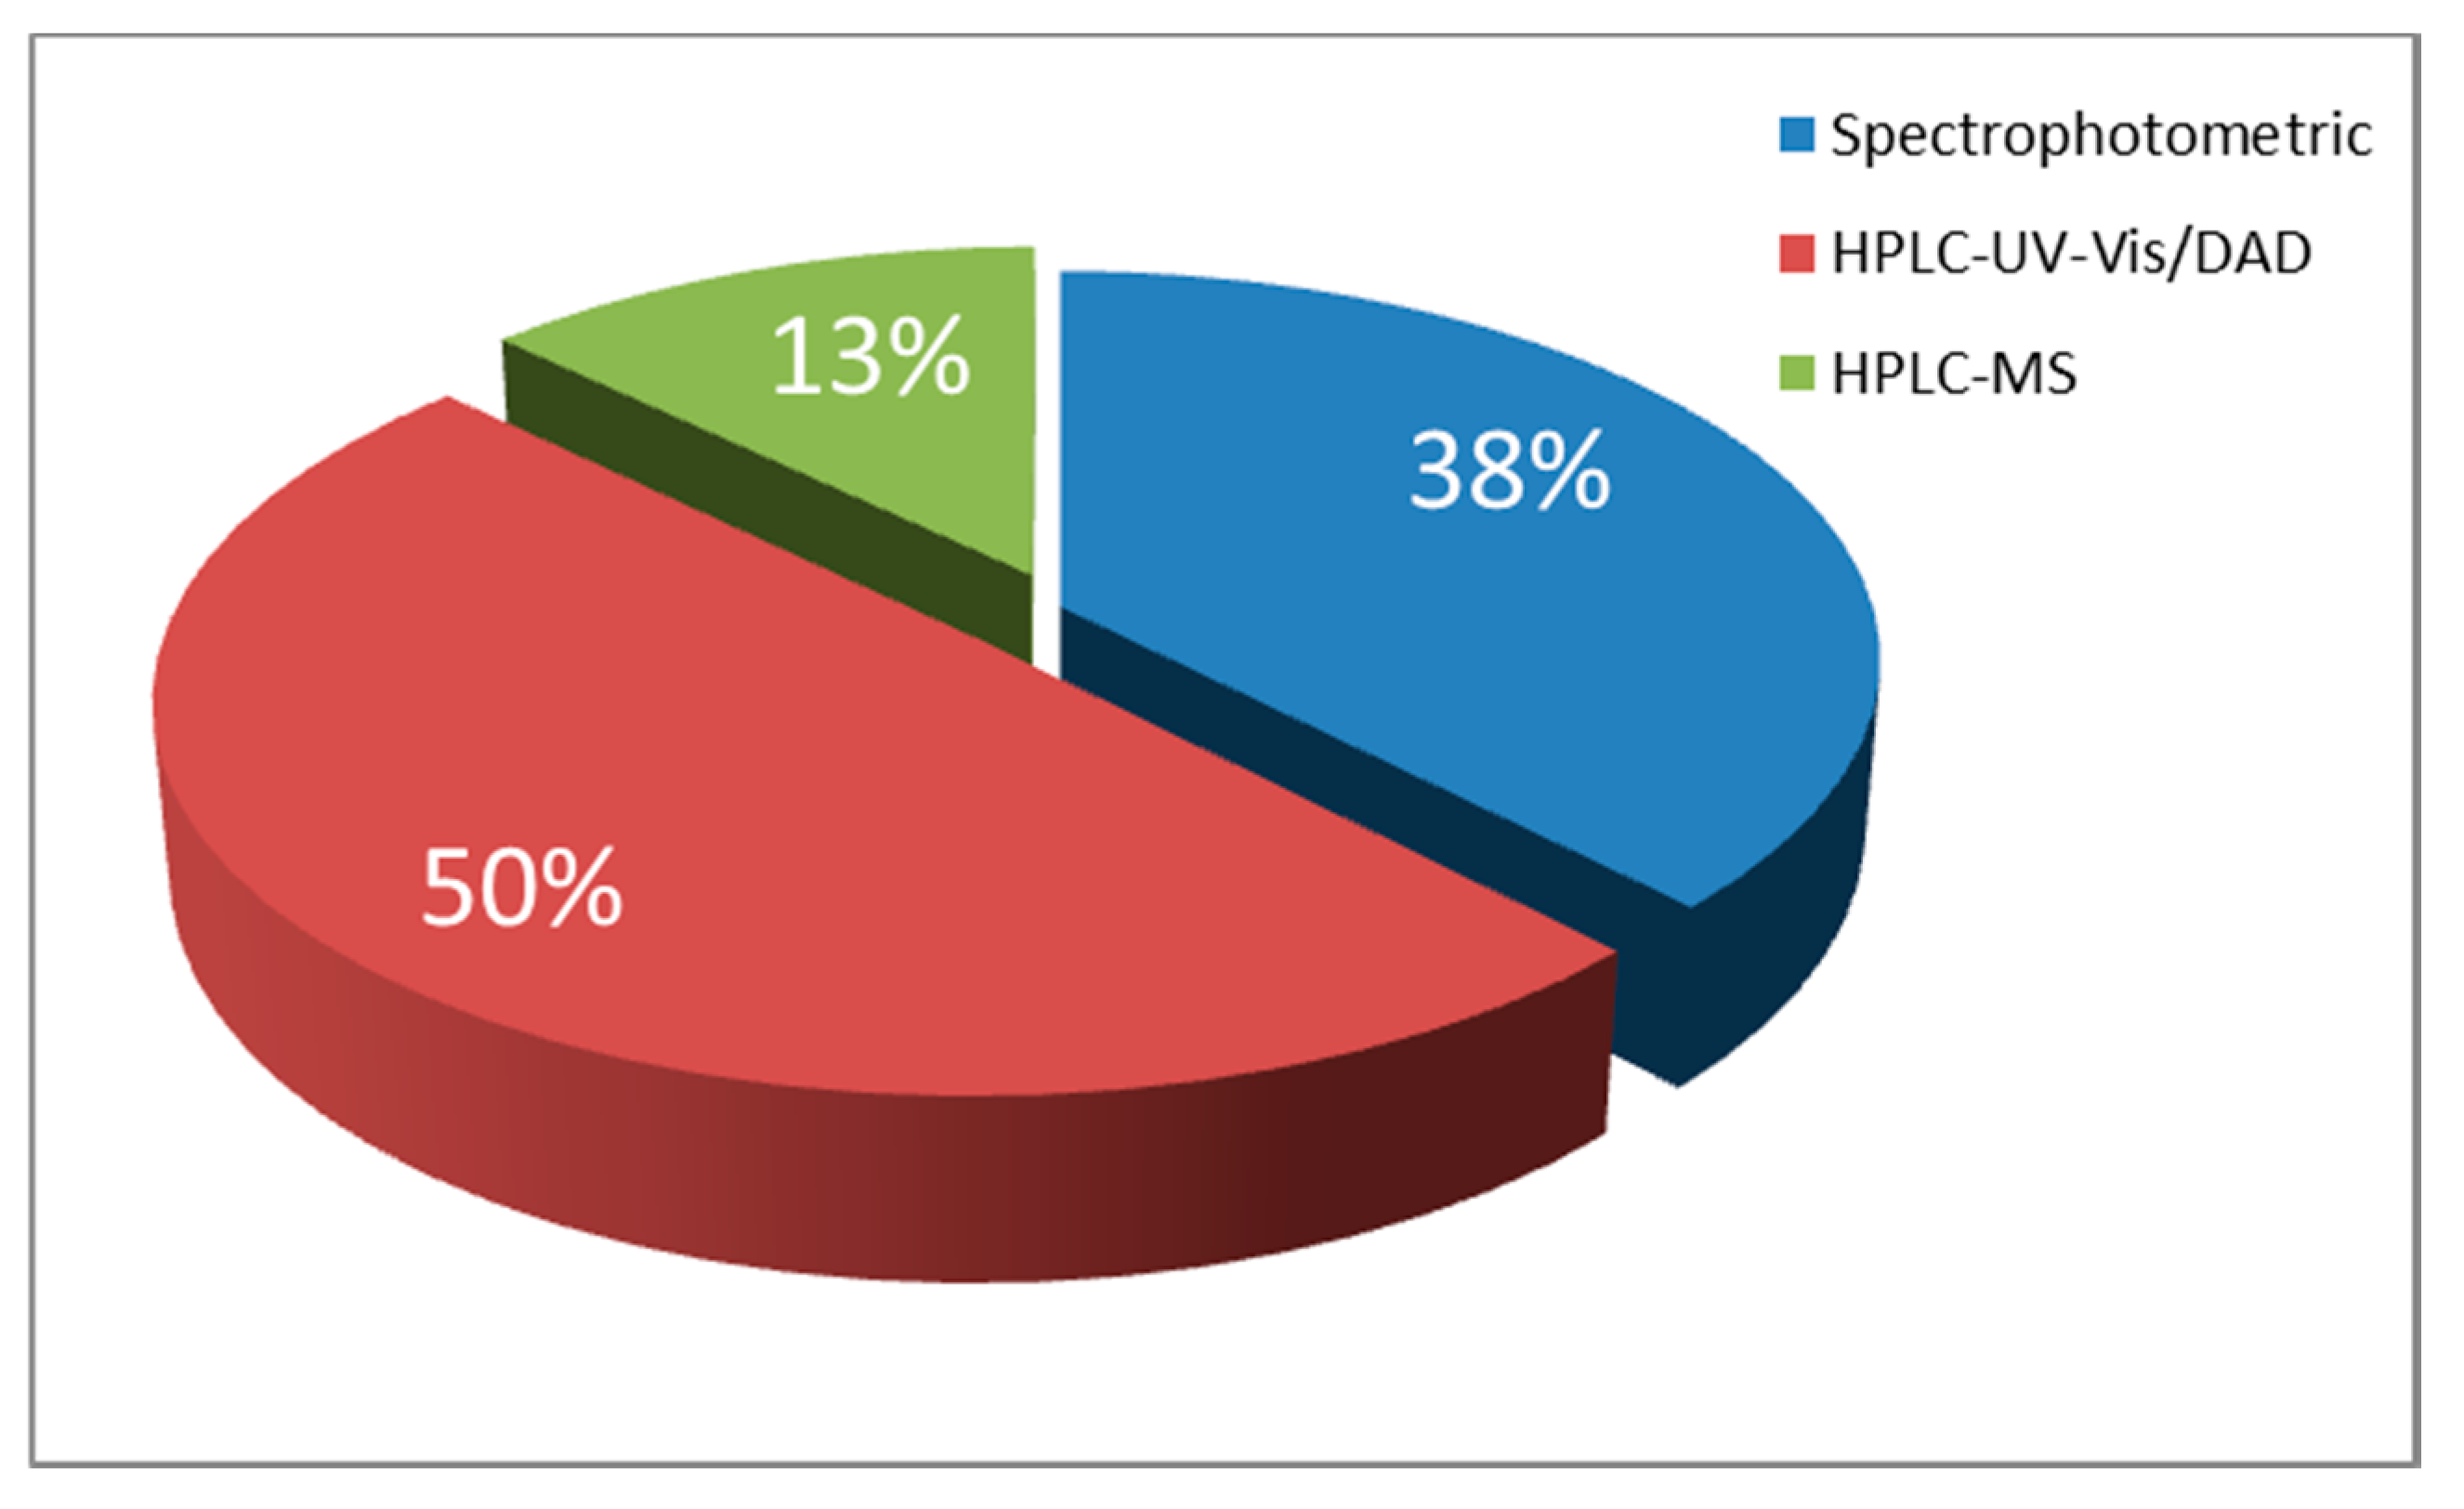
As it could be extrapolated from Table 3, a significant number of LC-MS, LC-MS/MS or LC-UV/Vis methods are available, which are dedicated to simultaneous detection of either a significant or limited number of artificial colorants (whether authorized or delisted), even including illegal Sudan-type dyes. In addition, to Table 3, Figure 3 gives the percentage distribution of the analytical techniques, regarding the analysis of synthetic food colorants. It could be easily concluded that HPLC/U(H)PLC is the most frequently applied technique, followed by capillary electrophoresis and enzyme-linked immunosorbent assay (ELISA) as well as other residual methods. In the case of ELISA, it needs to be highlighted that it cannot be applied for a group of substances/food colorants but only for standalone substances, for which the monoclonal antibodies have been developed.
The applied analytical techniques are followed by proper detection approaches. In this framework, simple detector UV-Vis/DAD is mostly applied, followed by MS/MS detectors, UV-Vis spectrometry, and electrochemical detection. The UV-Vis/DAD detection wavelengths depend on the analyte color (i.e., blue, yellow, red) set in any case in the maximum absorbance.
Regarding the MS, listed and EU-approved food colorants could be analyzed in the negative ionization, while for other substances (i.e., Sudan I-IV) positive ionization is applied.
From observation among the available methods of analysis (Table 3 and Figure 3), it could be concluded that traditional TLC methods require a significant sample preparation step and a time-consuming analytical procedure. On the other hand, the HPLC methods need longer analysis time, compared to the respective LC-MS/MS methods, in order to obtain good separation for the same number of analytes [87,88,89].
As reported recently by Periat et al., full-scan screening methods using HR-MS (High Resolution Mass Spectrometry) have proven to be an alternative to triple quadrupole methods as they could maximize the number of control and analyzed target colorants. Main advantages of the HR-MS can be the reduced sample preparation and the combined targeted analysis with untargeted screening of food colorants with high MS resolving power. Quadropole Time-of-Flight (QTOF) used by Li et al. and by Periat et al. for the detection and identification of coloring compounds in spices provided not only mass accuracy but also MS/MS spectra information and thus increased selectivity. A drawback of the approach could be the high cost of the instrumentation [85,86]. As reported by Li et al., HR-MS accurate mass measurements can detect a large number of target analytes, avoiding isobaric interferences in complex samples [89]. A combination of an ESI (or APCI) ionization with an anion trap analyzer linked to a TOF mass analyzer (ESI/APCI-IT-TOF/MS) provides simultaneously multi tandem MS (up to MS2) with respective mass accuracy. Currently, there is an increasing interest on the fragmentation mechanism of synthetic food dyes; use of ESI-IT-TOF/MSn in positive as well as in negative ionization modes [87,88,89] has been increased.
5.4. Sample Preparation for the Determination of Synthetic Colorants in Foods
Currently, there is no generally accepted/standard method for synthetic colorant extraction in laboratories. Nevertheless, most extraction procedures follow a common approach, which normally involves firstly the release of desired analytes from their matrices, followed afterwards by removal of extraneous matter/interferences by applying an efficient extraction protocol (i.e., solid–liquid or liquid–liquid extraction) [90].
The applied sample preparation protocols are strongly dependent on the type and nature of the food sample. A short description of the sample preparation protocols, along with their application to the clean-up of food samples, for the analysis of synthetic food colorants is given in Table 4.
Membrane filtration involves the permeation of the analyte through a thin layer of material. Explicitly, in case of beverages, when filtration is involved, a degassing step needs to be done in advance, in order to remove CO2 [90].
Solid phase extraction (SPE) is one of the most commonly used techniques in determination of food colorants, presenting certain advantages such as simplicity. Polyamide resin used for SPE cleanup retains polar compounds with chemical groups that can be protonated. In acidic pH, during SPE, the colorants are adsorbed to the polyamide stationary phase mainly by Van der Waals interactions. Other hydrophilic substances can mask SPE interaction sites by reducing their binding power for the colorants and consequently reducing the capacity of the cartridges. Some substances, such as amaranth, are strongly retained by SPE cartridges, and the ammonia solution used for elution could be insufficient for its release (low recoveries).
Dispersive solid phase extraction (d-SPE) analysis is a simple sample preparation methodology that is suitable for a wide variety of food and agricultural products, as is also QuEChERS, introduced for pesticides from Anastassiades et al. [91]. In case of synthetic colorants, a modified QuEChERS method has been reported (magnetic-dSPE) using cross-linking magnetic polymer (NH2-LDC-MP) containing less hydrophilic amino groups and more lipophilic styrene monomer for cleaning up the synthetic food colorants from wine and soft drinks [53].
Liquid–liquid extraction (LLE) deals with the separation of substances based on their relative solubility in two different immiscible liquids. Common solvents for the extraction of synthetic food colorants from food matrices are water, ethanol, methanol, isopropyl alcohol, ammoniac ethanol, ethyl acetate, ammonia, cyclohexane, and tetra-n-butyl ammonium phosphate. Wu et al. has also reported an extraction method based on Ionic liquid dispersive liquid phase microextraction using the ionic liquid (1-Octyl-3-methylimidazolium tetrafluoroborate ((C8MIM)(BF4))) [81].
In the literature, a limited number of protocols exists dealing with other types of extraction methods for synthetic food colorants, such as MAE and Ultrasound Assisted Extraction (UAE). These kinds of extractions require special instrumentation and most probably can be beneficial for a laboratory, as extractions with organic solvents are characterized by consumption of high volumes of solvents, are time consuming, and in some cases have low recoveries [90].
6. Conclusions
The use of food colorants in the production of foods leads to the need for the development of accurate, precise, sensitive, and selective analytical methods for their analysis and quantification. Certain interest in the impacts of food colorants is being reported worldwide. There is a plethora of analytical research works that deal with the analytical challenge of the analysis and quantification of either natural or synthetic food colorants. The research community gives more attention to the appropriate analysis, in sufficient concentration or mass fraction levels, mostly to synthetic food colorants rather than natural ones.
Analytical methodologies have much more to offer in this direction and, as it could be concluded from synthetic colorants, HPLC is the most frequently used followed by capillary electrophoresis. In terms of detection methods, the simple UV-Vis/DAD is the predominant one followed by tandem MS. The analytical techniques and sample preparation methodologies presented cover the existing methodologies mainly applied during the last decade.
Regarding sample preparation, this is highly sample dependent. It could involve the application of different extraction techniques, such as membrane filtration, liquid–liquid and solid phase extraction techniques, for cleaning-up the highly complex matrix of food products. Sample preparation is of great importance and must be carefully developed, in order to avoid or eliminate existing matrix interferences aiming to the development of simple, selective, and precise methods of extraction.
In the case of simple liquid samples, dilution and injection are preferred, though in other cases such as high protein content foods, specific steps need to be followed for sufficient sample clean-up.
Author Contributions
Conceptualization, E.T., H.G., and K.N.; methodology, K.N.; formal analysis, E.T. and K.N.; investigation, K.N.; resources, E.T. and K.N.; data curation, E.T.; writing—original draft preparation, K.N.; writing—review and editing, H.G. and E.T.; visualization, E.T.; supervision, E.T.; project administration, E.T. All authors have read and agreed to the published version of the manuscript.
Funding
This research received no external funding.
Acknowledgments
We acknowledge support of this work by the project “FoodOmicsGR Comprehensive Characterisation of Foods” (MIS 5029057) which is implemented under the Action “Reinforcement of the Research and Innovation Infrastructure”, funded by the Operational Programme Competitiveness, Entrepreneurship and Innovation (NSRF2014-2020) and co-financed by Greece and the European Union (European Regional Development Fund).
Conflicts of Interest
The authors declare no conflict of interest.
References
- Codex Alimentarius. Available online: http://www.codexalimentarius.org/standards/gsfa/ (accessed on 18 September 2018).
- Carocho, M.; Morales, P.; Ferreira, I.C.F.R. Natural food additives: Quo vadis? Trans Food Sci. Technol. 2015, 45, 284–295. [Google Scholar] [CrossRef]
- Amchova, P.; Kotolova, H.; Ruda-Kucerova, J. Health safety issues of synthetic food colorants. Reg. Toxic. Pharm. 2015, 73, 914–922. [Google Scholar] [CrossRef]
- Aberamound, A. A Review Article on Edible Pigments Properties and Sources as Natural Biocolorants in Foodstuff and Food Industry. World J. Dairy Food Sci. 2011, 6, 71–78. [Google Scholar]
- Burrows, A.J.D. Palette of Our Palates: A Brief History of Food Coloring and Its Regulation. Compreh. Rev. Food Sci. Food Saf. 2009, 9, 394–408. [Google Scholar] [CrossRef]
- Martins, N.; Roriz, C.L.; Morales, P.; Barros, L.; Ferreira, I.C. Food colorants: Challenges, opportunities and current desires of agro-industries to en-sure consumer expectations and regulatory practices. Trends Food Sci. Technol. 2016, 52, 1–15. [Google Scholar] [CrossRef] [Green Version]
- Rodriguez-Amaya, D.B. Natural food pigments and colorants. Curr. Opin. Food Sci. 2016, 7, 20–26. [Google Scholar] [CrossRef]
- Tumolo, T.; Lanfer-Marquez, U.M. Copper chlorophyllin: A food colorant with bioactive properties? Food Res. Int. 2012, 46, 451–459. [Google Scholar] [CrossRef]
- Ni, Y.; Wang, Y.; Kokot, S. Simultaneous kinetic spectrophotometric analysis of five synthetic food colorants with the aid of chemometrics. Talanta 2009, 78, 432–441. [Google Scholar] [CrossRef]
- Sigurdson, G.T.; Tang, P.; Giusti, M.M. Natural colorants: food colorants from natural sources. Annu. Rev. Food Sci. Technol. 2017, 8, 261–280. [Google Scholar] [CrossRef]
- Carocho, M.; Barreiro, M.F.; Morales, P.; Ferreira, I.C. Adding molecules to food, pros and cons: A review on synthetic and natural food additives. Compr. Rev. Food Sci. Food Saf. 2014, 13, 377–399. [Google Scholar] [CrossRef]
- Dias, M.I.; Ferreira, I.C.; Barreiro, M.F. Microencapsulation of bioactives for food applications. Food Funct. 2015, 6, 1035–1052. [Google Scholar] [CrossRef] [PubMed] [Green Version]
- Patakova, P. Monascus secondary metabolites: Production and biological activity. J. Ind. Microbiol. Biotechnol. 2013, 40, 169–181. [Google Scholar] [CrossRef] [PubMed]
- Wang, C.; Chen, D.; Chen, M.; Wang, Y.; Li, Z.; Li, F. Stimulatory effects of blue light on the growth, monascin and ankaflavin production in Monascus. Biotechnol. Lett. 2015, 37, 1043–1048. [Google Scholar] [CrossRef]
- Dias, M.G.; Camoes, M.F.G.; Oliveira, L. Carotenoids in traditional Portuguese fruits and vegetables. Food Chem. 2009, 113, 808–815. [Google Scholar] [CrossRef]
- Carocho, M.; Ferreira, I.C. A review on antioxidants, prooxidants and related controversy: Natural and synthetic compounds, screening and analysis methodologies and future perspectives. Food Chem. Toxicol. 2013, 51, 15–25. [Google Scholar] [CrossRef]
- Masone, D.; Chanforan, C. Study on the interaction of artificial and natural food colorants with human serum albumin: A computational point of view. Comput. Biol. Chem. 2015, 56, 152–158. [Google Scholar] [CrossRef]
- Oplatowska-Stachowiak, M.; Elliottt, C.T. Food colors: Existing and emerging food safety concerns. Crit. Rev. Food Sci. Nutr. 2017, 57, 524–548. [Google Scholar] [CrossRef]
- Feng, J.; Cerniglia, C.E.; Chen, H. Toxicological significance of azo dye metabolism by human intestinal microbiota. Front. Biosci. 2012, 4, 568–586. [Google Scholar] [CrossRef]
- Golka, K.; Kopps, S.; Myslak, Z.W. Carcinogenicity of azo colorants: Influence of solubility and bioavailability. Toxicol. Lett. 2004, 151, 203–210. [Google Scholar] [CrossRef]
- Vojdani, A.; Vojdani, C. Immune reactivity to food coloring. Altern. Ther. Health Med. 2015, 21, 52–62. [Google Scholar]
- Mpountoukas, P.; Pantazaki, A.; Kostareli, E.; Christodoulou, P.; Kareli, D.; Poliliou, S.; Mourelatos, C.; Lambropoulou, V.; Lialiaris, T. Cytogenetic evaluation and DNA interaction studies of the food colorants amaranth, erythrosine and tartrazine. Food Chem. Toxic. 2010, 48, 2934–2944. [Google Scholar] [CrossRef]
- Pan, X.; Qin, P.; Liu, R.; Wang, J. Characterizing the Interaction between tartra-zine and two serum albumins by a hybrid spectroscopic approach. J. Agric. Food Chem. 2011, 59, 6650–6656. [Google Scholar] [CrossRef] [PubMed]
- Basu, A.; Kumar, G.S. Study on the interaction of the toxic food additive Carmoisine with serum albumins: A microcalorimetric investigation. J. Hazard Mater. 2014, 273, 200–206. [Google Scholar] [CrossRef] [PubMed]
- Datta, S.; Mahapatra, N.; Halder, M. pH-insensitive electrostatic interaction of carmoisine with two serum proteins: A possible caution on its uses in food and pharmaceutical industry. J. Photochem. Photobiol. B 2013, 124, 50–62. [Google Scholar] [CrossRef] [PubMed]
- Wang, L.; Zhang, G.; Wang, Y. Binding properties of food colorant Allura Red with human serum albumin in vitro. Mol. Biol. Rep. 2014, 41, 3381–3391. [Google Scholar] [CrossRef]
- Wu, D.; Yan, J.; Wang, J.; Wang, Q.; Li, H. Characterisation of interaction between food colourant A Allura red AC and human serum albumin: Multi-spectroscopic analyses and docking simulations. Food Chem. 2015, 170, 423–429. [Google Scholar] [CrossRef]
- Tellier, F.; Steibel, J.; Chabrier, R.; Ble, F.X.; Tubaldo, H.; Rasata, R.; Chambron, J.; Duportail, G.; Simon, H.; Rodier, J.F.; et al. Sentinel lymph nodes fluorescence detection and imaging using Patent Blue V bound to human serum albumin. Biomed. Opt. Exp. 2012, 3, 2306–2316. [Google Scholar] [CrossRef] [Green Version]
- Wang, Y.; Wei, D.; Yang, H.; Yang, Y.; Xing, W.; Li, Y. Development of a highly sensitive and specific monoclonal antibody-based enzyme-linked immunosorbent assay (ELISA) for detection of Sudan I in food samples. Talanta 2009, 77, 1783–1789. [Google Scholar] [CrossRef]
- Moller, P.; Wallin, H. Genotoxic hazards of azo pigments and other colorants related to 1-phenylazo-2-hydroxynaphthalene. Mutat. Res. 2000, 462, 13–30. [Google Scholar] [CrossRef]
- Stiborova, M.; Martinek, V.; Rydlova, H.; Hodek, P.; Frei, E. Sudan I is a Potential Carcinogen for Humans: Evidence for Its Metabolic Activation and Detoxication by Human Recombinant Cytochrome P450 1A1 and Liver Microsomes. Cancer Res. 2002, 62, 5678–5684. [Google Scholar]
- European Food Safety Authority. Available online: http://www.efsa.europa.eu (accessed on 15 September 2018).
- Lehto, S.; Buchweitz, M.; Klimm, A.; Straßburger, R.; Bechtold, C.; Ulberth, F. Comparison of food colour regulations in the EU and the US: A review of cur-rent provisions. Food Addit. Contam. 2017, 34, 335–355. [Google Scholar] [CrossRef] [PubMed] [Green Version]
- Dykes, L.; Rooney, W.L.; Rooney, L.W. Evaluation of phenolics and antioxidant activity of black sorghum hybrids. J. Cereal Sci. 2013, 58, 278–283. [Google Scholar] [CrossRef]
- Sivakumar, V.; Vijaeeswarri, J.; Anna, J.L. Effective natural dye extraction from different plant materials using ultrasound. Ind. Crop. Prod. 2011, 33, 116–122. [Google Scholar] [CrossRef]
- Sagdic, O.; Ekici, L.; Ozturk, I.; Tekinay, T.; Polat, B.; Tastemur, B.; Senturk, B. Cytotoxic and bioactive properties of different color tulip flowers and degradation kinetic of tulip flower anthocyanins. Food Chem. Toxicol. 2013, 58, 432–439. [Google Scholar] [CrossRef] [PubMed]
- Longo, L.; Scardino, A.; Vasapollo, G. Identification and quantification of anthocyanins in the berries of Pistacia lentiscus L., Phillyrea latifolia L. and Rubia peregrina L. Innov. Food Sci. Emerg. Technol. 2007, 8, 360–364. [Google Scholar] [CrossRef]
- Stintzing, F.C.; Schieber, A.; Carle, R. Betacyanins in fruits from red-purple pitaya, Hylocereus polyrhizus (Weber) Britton & Rose. Food Chem. 2002, 77, 101–106. [Google Scholar]
- Ravichandran, K.; Saw, N.M.M.T.; Mohdaly, A.A.; Gabr, A.M.; Kastell, A.; Riedel, H.; Cai, Z.-Z.; Knorr, D.; Smetanska, I. Impact of processing of red beet on betalain content and antioxidant activity. Food Res. Int. 2013, 50, 670–675. [Google Scholar] [CrossRef]
- Cassano, A.; Conidi, C.; Drioli, E. Physico-chemical parameters of cactus pear (Opuntia ficus-indica) juice clarified by microfiltration and ultrafiltration processes. Desalination 2010, 250, 1101–1104. [Google Scholar] [CrossRef]
- Otalora, M.C.; Carriazo, J.G.; Iturriaga, L.; Nazareno, M.A.; Osorio, C. Micro-encapsulation of betalains obtained from cactus fruit (Opuntia ficus- indica) by spray drying using cactus cladode mucilage and maltodextrin as encapsulating agents. Food Chem. 2015, 187, 174–181. [Google Scholar] [CrossRef]
- Khan, M.I.; Giridhar, P. Enhanced chemical stability, chromatic properties and regeneration of betalains in Rivina humilis L. berry juice. LWT—Food Sci. Technol. 2014, 58, 649–657. [Google Scholar] [CrossRef]
- Sun, M.; Temelli, F. Supercritical carbon dioxide extraction of carotenoids from carrot using canola oil as a continuous co-solvent. J. Supercrit. Fluids 2006, 37, 397–408. [Google Scholar] [CrossRef]
- Sobral, D.; Costa, R.G.B.; Machado, G.M.; Paula, J.C.J.; Teodoro, V.A.M.; Nunes, N.M.; Pinto, M.S. Can lutein replace annatto in the manufacture of Prato cheese? LWT—Food Sci. Technol. 2016, 68, 349–355. [Google Scholar] [CrossRef]
- Khalil, M.; Raila, J.; Ali, M.; Islam, K.M.S.; Schenk, R.; Krause, J.-P.; Schweigert, F.H.; Rawel, H. Stability and bioavailability of lutein ester supplements from Tagetes flower prepared under food processing conditions. J. Funct. Foods 2012, 4, 602–610. [Google Scholar] [CrossRef]
- Grewe, C.; Menge, S.; Griehl, C. Enantioselective separation of all-E- astaxanthin and its determination in microbial sources. J. Chromatogr. A 2007, 1166, 97–100. [Google Scholar] [CrossRef] [PubMed]
- Wada, M.; Kido, H.; Ohyama, K.; Ichibangase, T.; Kishikawa, N.; Ohba, Y.; Nakashima, M.N.; Kuroda, N.; Nakashima, K. Chemiluminescent screening of quenching effects of natural colorants against reactive oxygen species: Evaluation of grape seed, monascus, gardenia and red radish extracts as multi-functional food additives. Food Chem. 2007, 101, 980–986. [Google Scholar] [CrossRef]
- Thalhamer, B.; Buchberger, W. Adulteration of beetroot red and paprika extract based food colorant with Monascus red pigments and their detection by HPLC-QTof MS analyses. Food Control 2019, 105, 58–63. [Google Scholar] [CrossRef]
- Minioti, K.S.; Sakellariou, C.F.; Thomaidis, N.S. Determination of 13 synthetic food colorants in water-soluble foods by reversed-phase high- performance liquid chromatography coupled with diode-array detector. Anal. Chim. Acta 2007, 583, 103–110. [Google Scholar] [CrossRef]
- Ai, Y.-J.; Wu, Y.-X.; Dong, Q.-M.; Li, J.-B.; Xu, B.-J.; Yu, Z.; Ni, D. Rapid qualitative and quantitative determination of food colorants by both T Raman spectra and Surface-enhanced Raman Scattering (SERS). Food Chem. 2018, 241, 427–433. [Google Scholar] [CrossRef]
- Al-Degs, Y.S. Determination of three dyes in commercial soft drinks using HLA/GO and liquid chromatography. Food Chem. 2009, 117, 485–490. [Google Scholar] [CrossRef]
- Bonan, S.; Fedrizzi, G.; Menotta, S.; Elisabetta, C. Simultaneous determination of synthetic dyes in foodstuffs and beverages by high-performance liquid chromatography coupled with diode-array detector. Dyes Pigment. 2013, 99, 36–40. [Google Scholar] [CrossRef]
- Chen, X.H.; Zhao, Y.G.; Shen, H.Y.; Zhou, L.X.; Pan, S.D.; Jin, M.C. Fast determination of seven synthetic pigments from wine and soft drinks using magnetic dispersive solid-phase extraction followed by liquid chromatography–tandem mass spectrometry. J. Chromatogr. A 2014, 1346, 123–128. [Google Scholar] [CrossRef]
- De Andrade, F.I.; Guedes, M.I.F.; Vieira, Í.G.; Mendes, F.N.P.; Rodrigues, P.A.S.; Maia, C.S.C.; Ávila, M.M.M.; Ribeiro, L.d.M. Determination of synthetic food dyes in commercial soft drinks by TLC and ion-pair HPLC. Food Chem. 2014, 157, 193–198. [Google Scholar] [CrossRef] [PubMed]
- El-Sheikh, A.H.; Al-Degs, Y.S. Spectrophotometric determination of food dyes in soft drinks by second order multivariate calibration of the absorbance spectra-pH data matrices. Dyes Pigments 2013, 97, 330–339. [Google Scholar] [CrossRef]
- Gosetti, F.; Gianotti, V.; Polati, S.; Gennaro, M.C. HPLC–MS degradation study of E110 Sunset Yellow FCF in a commercial beverage. J. Chromatogr. A 2005, 1090, 107–115. [Google Scholar] [CrossRef] [PubMed]
- Gosetti, F.; Frascarolo, P.; Mazzucco, E.; Gianotti, V.; Bottaro, M.; Gennaro, M.C. Photodegradation of E110 and E122 dyes in a commercial aperitif: A high performance liquid chromatography–diode array–tandem mass spectrometry study. J. Chromatogr. A 2008, 1202, 58–63. [Google Scholar] [CrossRef]
- Gosetti, F.; Chiuminatto, U.; Mazzucco, E.; Calabrese, G.; Gennaro, M.C.; Marengo, E. Identification of photodegradation products of Allura Red AC (E129) in a beverage by ultra-high performance liquid chromatography–quadrupole- time-of-flight mass spectrometry. Anal. Chim. Acta 2012, 746, 84–89. [Google Scholar] [CrossRef]
- Gosetti, F.; Chiuminatto, U.; Mazzucco, E.; Calabrese, G.; Gennaro, M.C.; Marengo, E. Non-target screening of Allura Red AC photodegradation products in a beverage through ultra-high performance liquid chromatography coupled with hybrid triple quadrupole/linear ion trap mass spectrometry. Food Chem. 2013, 136, 617–623. [Google Scholar] [CrossRef]
- Harp, B.P.; Miranda-Bermudez, E.; Barrows, J.N. Determination of seven certified color additives in food products using liquid chromatography. J. Agric. Food Chem. 2013, 61, 3726–3736. [Google Scholar] [CrossRef]
- Huang, H.-Y.; Shih, Y.-C.; Chen, Y.-C. Determining eight colorants in milk beverages by capillary electrophoresis. J. Chromatogr. A 2002, 959, 317–325. [Google Scholar] [CrossRef]
- Huang, H.-Y.; Chiu, C.-W.; Sue, S.-L.; Cheng, C.-F. Analysis of food colorants by capillary electrophoresis with large- volume sample stacking. J. Chromatogr. A 2003, 995, 29–36. [Google Scholar] [CrossRef]
- Karanikolopoulos, G.; Gerakis, A.; Papadopoulou, K.; Mastrantoni, I. Determination of synthetic food colorants in fish products by an HPLC-DAD method. Food Chem. 2015, 177, 197–203. [Google Scholar] [CrossRef] [PubMed]
- Khanavi, M.; Hajimahmoodi, M.; Ranjbar, A.M.; Oveisi, M.R.; Ardekani, M.R.S.; Mogaddam, G. Development of a green chromatographic method for simultaneous determination of food colorants. Food Anal. Methods 2012, 5, 408–415. [Google Scholar] [CrossRef]
- Kirschbaum, J.; Krause, C.; Brückner, H. Liquid chromatographic quantification of synthetic colorants in fish roe and caviar. Eur. Food Res. Technol. 2006, 222, 572–579. [Google Scholar] [CrossRef]
- Kong, C.; Fodjo, E.K.; Li, D.; Cai, Y.; Huang, D.; Wang, Y.; Shen, X. Chitosan-based ad-sorption and freeze deproteinization: Improved extraction and purifica-tion of synthetic colorants from protein-rich food samples. Food Chem. 2015, 188, 240–247. [Google Scholar] [CrossRef]
- Liao, Q.G.; Li, W.H.; Luo, L.G. Applicability of accelerated solvent extraction for synthetic colorants analysis in meat products with ultrahigh performance liquid chromatography–photodiode array detection. Anal. Chim. Acta 2012, 716, 128–132. [Google Scholar] [CrossRef]
- Liu, F.-J.; Liu, C.-T.; Li, W.; Tang, A.-N. Dispersive solid-phase micro- extraction and capillary electrophoresis separation of food colorants in beverages using diamino moiety functionalized silica nanoparticles as both extractant and pseudostationary phase. Talanta 2015, 132, 366–372. [Google Scholar] [CrossRef]
- Ma, M.; Luo, X.; Chen, B.; Su, S.; Yao, S. Simultaneous determination of water-soluble and fat-soluble synthetic colorants in foodstuff by high- perfo-mance liquid chromatography-diode array detection-electrospray mass spectrometry. J. Chromatogr. A 2006, 1103, 170–176. [Google Scholar] [CrossRef]
- Ma, K.; Yang, Y.N.; Jiang, X.X.; Zhao, M.; Cai, Y.Q. Simultaneous determination of 20 food additives by high performance liquid chromatography with photo-diode array detector. Chin. Chem. Lett. 2012, 23, 492–495. [Google Scholar] [CrossRef]
- Medeiros, R.A.; Lourencao, B.C.; Rocha-Filho, R.C.; Fatibello-Filho, O. Flow injection simultaneous determination of synthetic colorants in food using multiple pulse amperometric detection with a boron-doped diamond electrode. Talanta 2012, 99, 883–889. [Google Scholar] [CrossRef]
- Medeiros, R.A.; Lourencao, B.C.; Rocha-Filho, R.C.; Fatibello-Filho, O. Simultaneous voltammetric determination of synthetic colorants in food using a cathodically pretreated boron-doped diamond electrode. Talanta 2012, 97, 291–297. [Google Scholar] [CrossRef]
- Ryvolova, M.; Taborský, P.; Vrabel, P.; Krasenský, P.; Preisler, J. Sensitive determination of erythrosine and other red food colorants using capillary electrophoresis with laser-induced fluorescence detection. J. Chromatogr. A 2007, 1141, 206–211. [Google Scholar] [CrossRef] [PubMed]
- Prado, M.A.; Boas, L.F.V.; Bronze, M.R.; Godoy, H.T. Validation of methodology for simultaneous determination of synthetic dyes in alcoholic beverages by capillary electrophoresis. J. Chromatogr. A 2006, 1136, 231–236. [Google Scholar] [CrossRef] [PubMed]
- Shen, Y.; Zhang, X.; Prinyawiwatkul, W.; Xu, Z. Simultaneous determination of red and yellow artificial food colourants and carotenoid pigments in food products. Food Chem. 2014, 157, 553–558. [Google Scholar] [CrossRef] [PubMed]
- Sorouraddin, M.H.; Rostami, A.; Saadati, M.A. simple and portable multi-colour light emitting diode based photocolourimeter for the analysis of mixtures of five common food dyes. Food Chem. 2011, 127, 308–313. [Google Scholar] [CrossRef]
- Soylak, M.; Unsal, Y.E.; Tuzen, M. Spectrophotometric determination of trace levels of allura red in water samples after separation and pre-concentration. Food Chem. Toxicol. 2011, 49, 1183–1187. [Google Scholar] [CrossRef]
- Sun, H.; Sun, N.; Li, H.; Zhang, J.; Yang, Y. Development of multiresidue analysis for 21 synthetic colorants in meat by microwave-assisted extraction–solid-phase extraction–reversed-phase ultrahigh performance liquid chromatography. Food Anal. Methods 2013, 6, 1291–1299. [Google Scholar] [CrossRef]
- Tang, B.; Xi, C.; Zou, Y.; Wang, G.; Li, X.; Zhang, L.; Chen, D.; Zhang, J. Simultaneous determination of 16 synthetic colorants in hotpot condiment by high performance liquid chromatography. J. Chromatogr. B 2014, 960, 87–91. [Google Scholar] [CrossRef]
- Turak, F.; Ozgur, M.U. Simultaneous determination of allura red and ponceau 4R in drinks with the use of four derivative spectrophotometric methods and comparison with high-performance liquid chromatography. J. AOAC Int. 2013, 96, 1377–1386. [Google Scholar] [CrossRef]
- Vidotti, E.C.; Costa, W.F.; Oliveira, C.C. Development of a green chromatographic method for determination of colorants in food samples. Talanta 2006, 68, 516–521. [Google Scholar] [CrossRef]
- Wu, H.; Guo, J.B.; Du, L.M.; Tian, H.; Hao, C.X.; Wang, Z.F.; Wang, J.Y. A rapid shaking-based ionic liquid dispersive liquid phase micro extraction for the simultaneous determination of six synthetic food colourants in soft drinks, sugar-and gelatin-based confectionery by high-performance liquid chromatography. Food Chem. 2013, 141, 182–186. [Google Scholar] [CrossRef]
- Xie, Y.; Li, Y.; Niu, L.; Wang, H.; Qian, H.; Yao, W. A novel surface-enhanced Raman scattering sensor to detect prohibited colorants in food by graphene/silver nanocomposite. Talanta 2012, 100, 32–37. [Google Scholar] [CrossRef] [PubMed]
- Xing, Y.; Meng, M.; Xue, H.; Zhang, T.; Yin, Y.; Xi, R. Development of a polyclonal antibody-based enzyme-linked immunosorbent assay (ELISA) for detection of sunset yellow FCF in food samples. Talanta 2012, 99, 125–131. [Google Scholar] [CrossRef] [PubMed]
- Yoshioka, N.; Ichihashi, K. Determination of 40 synthetic food colors in drinks and candies by high- performance liquid chromatography using a short column with photodiode array detection. Talanta 2008, 74, 1408–1413. [Google Scholar] [CrossRef] [PubMed]
- Zou, T.; He, P.; Yasen, A.; Li, Z. Determination of seven synthetic dyes in animal feeds and meat by high performance liquid chromatography with diode array and tandem mass detectors. Food Chem. 2013, 138, 1742–1748. [Google Scholar] [CrossRef] [PubMed]
- Tsai, C.-F.; Kuo, C.-H.; Shih, D.Y.-C. Determination of 20 synthetic dyes in chili powders and syrup-preserved fruits by liquid chromatography/tandem mass spectrometry. J. Food Drug Anal. 2015, 23, 453–462. [Google Scholar] [CrossRef] [PubMed] [Green Version]
- Périat, A.; Bieri, S.; Mottier, N. SWATH-MS screening strategy for the determination of food dyes in spices by UHPLC-HRMS. Food Chem. X 2019, 1, 100009. [Google Scholar] [CrossRef]
- Li, X.Q.; Zhang, Q.H.; Ma, K.; Li, H.M.; Guo, Z. Identification and determination of 34 water-soluble synthetic dyes in foodstuff by high performance liquid chromatography–diode array detection–ion trap time-of-flight tandem mass spectrometry. Food Chem. 2015, 182, 316–326. [Google Scholar] [CrossRef]
- Yamjala, K.; Nainar, M.S.; Ramisetti, N.R. Methods for the analysis of azo dyes employed in food industry—A review. Food Chem. 2016, 192, 813–824. [Google Scholar] [CrossRef]
- Anastassiades, M.; Lehotay, S.J.; Stajnbaher, D.; Schenck, F.J. Fast and easy multiresidue method employing acetonitrile extraction/partitioning and “dispersive solid-phase extraction” for the determination of pesticide residues in produce. J. AOAC Int. 2003, 86, 412–431. [Google Scholar]
Figure 1.
Chemical structures of selected regulated food colorants.

Figure 2.
Distribution of techniques used for the analysis of natural food colorants.

Figure 3.
Distribution of techniques for the analysis of synthetic food colorants.


Table 1.
Methods for the analysis of natural food colorants in various food products.
| Food Colorant | Food Matrix | Analytical Technique | Detection | Detection Settings (i.e., λ, Ionisation) | Column | Elution | Mobile Phase | Inj. Volume | Figures of Merit (LOD, LOQ, Linear Range) | Ref. |
|---|---|---|---|---|---|---|---|---|---|---|
| 3-Deoxy-anthocyanidins | Sorghum bicolor (L.) Moench seeds | High Pressure Liquid Chromato-graphy (HPLC) | Diode Array Detection (DAD) | 485 nm | Luna C18 column (150 × 4.6 mm, 5 mm) | Gradient | 4% HCOOH in H2O (v/v) (Solvent A) and acetonitrile (Solvent B) | 20 μL | n/a | [34] |
| Anthocyanin-derived extracts | Acacia decurrens Willd. Bark | Spectrophotometric analysis | UV-Vis | 400–800 nm | n/a | n/a | n/a | n/a | [35] | |
| -Tulipa gesneriana L. | Spectrophotometric analysis | UV-Vis | 765 nm | n/a | n/a | n/a | n/a | n/a | [36] | |
| Cyanidin 3-glucoside | -Pistacia lentiscus L. fruits; -Santalum album L. fruits | HPLC | DAD | 520 nm, 440 nm, 310 nm and 280 nm | SS Wakosil C18 (150 × 4.6 mm, 5 μm) | Gradient | 0.1% trifluoroacetic acid (TFA) in H2O (solvent A) and 0.1% TFA in acetonitrile (Solvent B) | 20 μL | n/a | [37] |
| Cyanidin 3-glucoside | -Pistacia lentiscus L. fruits; -Santalum album L. fruits | HPLC | ESI-MS | SS Wakosil C18 (150 × 4.6 mm, 5 μm) | Gradient | 0.1% TFA in H2O (solvent A) and 0.1% TFA in acetonitrile (Solvent B | 20 μL | n/a | [37] | |
| Betacyanins | -Hylocereus polyrhizus | HPLC | MS | ESI (+) | AQUA C18-reversed phase column, 5 μm | Gradient | (A) 2% (v/v) CH3COOH in H2O and (B)0.5% CH3COOH in H2O/acetonitrile (50/50, v/v) | n/a | [38] | |
| Betalains | Beta vulgaris L. roots | HPLC | UV-Vis | 538 nm; 480 nm | Lichrocart 250 × 4 RP-18 (5 μm) | Gradient | H2O (A) and acetonitrile (B). | 20 μL | n/a | [39] |
| Betalains | Opuntia ficus-indica [L.] | HPLC | UV-Vis | 245 nm | Luna C18(2) column (250 × 4.6 mm, 5 µm) | Isocratic | 20 mM KH2PO4/ Acetonitrile 95:5 v/v | 20 μL | n/a | [40] |
| Betalains | Opuntia ficus-indica [L.] | Spectrophotometric analysis | UV-Vis | λ = 536 nm | n/a | n/a | n/a | n/a | n/a | [41] |
| Betalains | Rivina humilis L. fruits, juice | Spectrophotometric analysis | UV-Vis | λ = 535 nm | n/a | n/a | n/a | n/a | n/a | [42] |
| α-carotene | Daucus carota L. roots | HPLC | UV-Vis | 450 nm | Supelcosil LC-18 column (15 cm × 4.6 cm, 5 μm) | Isocratic | Methanol/10% (v/v) Acetonitrile: H2O | 50 μL | n/a | [43] |
| Lutein | Commercial/Milk | HPLC | UV-Vis | 450 nm | RP C30 YMC (250 × 4.6 mm, 5 μm) | Isocratic | ethanol, tert-butyl-methyl-ether (MTBE) as the mobile phase | 50 μL | n/a | [44] |
| Lutein | Hawaii “T. erecta”, Carmen “T. patula”. | HPLC | DAD | 450 nm | Waters-Spherisorb column SC-04 (125 × 4.0 mm, ODS2, 3.0 μm) | Gradient | (A) Acetonitrile–methanol (9:1 v/v): (B) Ethyl acetate | 100 μL | n/a | [45] |
| Astaxanthin | Microalgae and yeasts | HPLC | DAD | 470 nm | Chiralcel OD-RH column (5 μm, 150 mm × 4.6 mm) | (A) Acetonitrile and (B) phosphoric acid (3.5 mM) | n/a | n/a | [46] | |
| Crocetin, Crocin | Grape seed, monascus, gardenia, and red radish | Spectrophotometric analysis | UV-Vis | 438 nm; 462 nm | n/a | n/a | n/a | n/a | n/a | [47] |
| Monascus red pigments | Beetroot red and paprika extract | High Resolution Mass Spectrometry | HPLC-QTOF-MS | ESI (+) | Kinetex c18 column (2.6 μm, 50 mm × 4.6 mm) | Gradient | (A) Acetonitrile; (B) H2O; (C) aqueous HCOOH 1% v/v | n/a | n/a | [48] |
Table 2.
Sample preparation techniques for the analysis of natural food colorants in food products.
| Food Colorant | Extraction/Sample Preparation | Ref. |
|---|---|---|
| 3-Deoxyanthocyanidins | Ground sample, with 1% HCl in methanol, centrifugation hydrolysis; | [34] |
| Anthocyanin-derived extracts | Comparison of different extraction methods (ultrasonic and natural extraction) vs. magnetic stirring | [35] |
| Extraction with ethanol: H2O (1:1 v/v) acidified with 0.01% HCl | [36] | |
| Cyanidin 3-glucoside | Extraction with 0.1% HCl (v/v) in methanol, combination of the extracts, evaporation, and dissolution | [37] |
| Betacyanins | Mixing with water, filtration, addition of ethanol (precipitation of pectic substances and proteins) | [38] |
| Betalains | Sample dissolution in ethanol, agitated and homogenized | [39] |
| Betalains | Filtration of water extract (no pH adjustment) | [40] |
| Betalains | Lyophilization and macerated with PBS (pH 5.0) in 1:5 w/w ratio, followed by spray-drying | [41] |
| Betalains | Dilution of the juice; filtration; addition of Se4+, Zn2+, and Cu2+ | [42] |
| α-carotene | Comparison between simple extraction and Supercritical Fluid extraction (CO2); Simple extraction: Hexane/acetone; SFE: SC-CO2 (SFE) | [43] |
| Lutein | Sample dilution in 95% ethanol and extraction with acetone and petroleum ether. Evaporation and reconstitution | [44] |
| Lutein | Extraction with organic solvent (isopropanol), centrifugation and supernatant extracted with hexane | [45] |
| Astaxanthin | Extraction with ethyl acetate, filtration | [46] |
| Crocetin, Crocin | Dilution in DMSO | [47] |
Table 3.
Analytical techniques for the determination of natural food colorants in food samples.
| Food Colorant | MATRIX | Analytical Technique | Detection | Column | Elution | Mobile Phase | Inj. Volume | Figures of Merit (LOD, LOQ) | Ref. |
|---|---|---|---|---|---|---|---|---|---|
| Brilliant blue | Liquid foods | CE | UV (λ = 220 nm) 36 cm capillary; Separation voltage (8 kV, −8 kV); | Fused-silica cappilaries of 375 od μm and 75 μm i.d | - | 30 mM PBS buffer (pH6), with 0.9 mg/mL dASNPs and 2 mM β-cyclodextrin (CD) | Electro kinetic injection | LOD = 0.36 mg/L LOQ = 0.63 mg/L | [2] |
| Amaranth, ponceau 4R, sunset yellow, tartrazine, brilliant blue | spectrophotometric kinetic method | UV-Vis λPrussian blue = 760 nm | n/a | n/a | n/a | n/a | LOD = 0.2–6.0 mg/L | [9] | |
| Sudan I | Non-alcoholic drinks, sweets, jellies | Enzyme-linked Immuno-sorbent assay (ELISA) | n/a | n/a | n/a | n/a | n/a | LOD = 0.07 ng/mL | [29] |
| Sudan I | Non-alcoholic drinks, jellies | HPLC | UV- Vis (478 nm) | C18 (250 × 4.6 mm, 5.0 μm) | Gradient | methanol/2% CH3COOH | 20 μL | LOD = 0.14 ng/mL | [29] |
| Tartrazine, quinoline Yellow, sunset yellow, Carmoisine, Amaranth, ponceau 4R, Erythrosine, Red 2G, allura Red AC, Patent Blue V, Indigo Carmine, brilliant blue, Green S | Beverages, dairy powders, jellies, candies, condiments, icings, syrups, extracts | HPLC | DAD Various wavelengths | Discovery C18 (250 mm × 4.6 mm 5 μm) | Gradient | CH3COONH4 0.13 M (pH = 7.5; NaOH)/methanol: acetonitrile 80:20 v/v | 20 μL | LOD = 1.87–22.1 μg/L | [49] |
| Tartrazine, sunset yellow, brilliant Blue, acid red | Powder | SERS-Raman | confocal microscope Raman spectrometer system | n/a | n/a | n/a | n/a | LOD = 10−7 M | [50] |
| Allura red, sunset yellow, tartrazine | Soft drinks | HPLC | DAD | n/a | Gradient | methanol (HPLC grade) and NaH2PO4/ Na2HPO4 buffer (0.10 M, pH = 7.0). | n/a | LOD = 0.06–0.30 μg/mL | [51] |
| Allura red, sunset yellow, tartrazine | Soft drinks | HLA-Go | - | - | - | - | - | - | [51] |
| Azorubine, amaranth, cochineal red A, red 2G, allura red, azocarmine B (AZO B), azocarmine G (AZO G), ponceau 2R, ponceau 6R, tartrazine, sunset yellow, quinoline yellow, orange II, metanil yellow (MY), patent blue V, indigo carmine, brilliant blue | Solid food/liquid beverages | HPLC | DAD DAD, λquant.: −620 nm (blue); −515 nm (red); −420 and 480 nm (yellow). | C8 (150 × 4.6 mm, 3 μm) | Gradient | Acetonitrile/sodium acetate (pH = 7) | 20 μL | 5–300 mg/kg (solid food samples) 5–100 mg/L (drinks) | [52] |
| Brilliant blue, Tartrazine, amaranth, carmine, sunset yellow, allura red, erythrosine | Wine and soft drinks | UFLC | ESI (−)-MS/MS | ODS II (100 mm × 2.0 mm; 2.2 μm) | Gradient | A: Acetonitrile: CH3COONH4 5.0 mM/ (B) H2O: CH3COONH4 5.0 mM | 5 μL | LOD = 0.45–1.51 μg/L LOQ = 1.51–5.00 μg/L | [53] |
| Brilliant blue, tartrazine, amaranth, sunset yellow | Wine and soft drinks | TLC-UV-Vis | UV-Vis | TLC-PET 20 × 20 silica gel | n/a | 8 mL 2-propanol and 3 mL NH4OH | 5 μL (standards) and 30 μL sample | n/a | [54] |
| Allura red, sunset yellow, tartrazine | Solid food/liquid beverages | Spectrophoto-metric BLLS/RBL | Absorbance spectra-pH data Spectral measurements (300–600 nm) at different pH | n.a | n.a | n.a | n.a | LOD = 0.54 mg/L | [55] |
| Sunset yellow | Beverage | HPLC | ESI (−)-MS | C18-ether column (150 mm × 4.6 mm, 5 μm) | Isocratic | (A) 63% aqueous solution 20 mM CH3COONH4: (B) 37% methanol | 20 μL | n/a | [56] |
| Carmoisine, sunset yellow | Beverage | HPLC | ESI (−)-MS | C18 column (250 mm × 2 mm, 4 μm) | Isocratic | (A) Methanol and (B) 10 mM HCOONH4 (45:55, v/v) | 20 μL | LOD = 10–12 μg/L | [57] |
| Allura red | Beverage | HPLC | ESI (−)-MS | HSS-T3 column (2.1 mm 100 mm, 1.8 μm) | Gradient | A: H2O: CH3COONH4 1.0 mM/ (B) Methanol: CH3COONH4 1.0 mM | 20 μL | n/a | [58,59] |
| Brilliant blue, tartrazine, allura red, amaranth, Azorubine, patent Blue V, ponceau 4R | Various food products | HPLC | DAD Various wavelengths | Xterra RP18 column (250 × 4.6 mm, 5 μm) | Gradient | A) 0.1 M CH3COONH4 in water and (B) 0.1 M CH3COONH4 in methanol | 20 μL | LOD = 0.02–1.49 mg/L | [60] |
| Brilliant blue, indigo carmine, allura red, carminic acid, ponceau 4R, sunset yellow, tartrazine | Dairy powders, color beverages, jellies, candies, condiments, icings, syrups, | CE | UV (200 nm) Condiiton with 1 M NaOH, H2O electrode polarity (25kV) | - | - | Running buffer of pH 10 (20 mM NaOH solution to 15 mM disodium tetraborate (borax) to 20 mM NaOH, until the desired pH | Large-volume injection | LODs 0.05–0.40 μg/mL | [61] |
| Brilliant blue, indigo carmine, allura red, carminic acid, ponceau 4R, sunset yellow, tartrazine, fast green FCF | Liquid foods | CE | UV (λ = 200 nm) Condiiton with 1 M NaOH, H2O electrode polarity (25kV) | - | Running buffer of pH 10 (20 mM NaOH to 15 mM disodium tetraborate (borax) to 20 mM NaOH, until desired pH | Large-volume injection | LOD = 0.002–0.026 μg/mL | [62] | |
| Sunset yellow, carmoisine, amaranth, ponceau 4R, erythrosine, red 2G, allura red | Soft drinks | HPLC | DAD Various wavelengths | Symmetry C18 (Waters, Milford, USA) column (150 mm × 4.6 mm, 5 μm) | Gradient | CH3COONH4 buffer (1% w/v) (0.13 M) (pH: 7.5) by addition of 0.1 M aq. NH3 (solvent A), methanol (solvent B) and acetonitrile (solvent C) | n/a | 0.5–1.4 μg/mL | [63] |
| Tartrazine, quinoline yellow, sunset yellow, carmoisine, ponceau 4R, allura red, indigo carmine, brilliant blue | Various foods and medicines | HPLC | DAD Various wavelengths | C18 column (250 mm × 4.6 mm, 5 μm) | Isocratic | A) Triton X-100 (0.25%, v/v) and (B) 50 mmol/L PBS (pH 7) | 20 μL | LOD = 0.05–0.44 μg/mL LOQ = 0.05–1.12 μg/mL | [64] |
| Tartrazine, sunset yellow, azorubine, amaranth, cochineal red, red 2G, allura red AC, Brilliant Black BN, brown FK, Brown HT Patent Blue V, brilliant Blue FCF, Green S | Fish roe | HPLC | DAD Various wavelengths | Xterra RP18 column (250 × 4.6 mm, 5 μm) | Gradient | (a) 100 mmol/L CH3COONa buffer (pH 7.0) and (b) Acetonitrile | 20 μL | LOD = 0.02--1.49 mg/L | [65] |
| Brilliant blue, Indigo carmine, allura red, erythrosine, ponceau 4R, sunset yellow, Lemon yellow | Protein-rich samples | HPLC | DAD Various wavelengths | RP-C18 Column | Gradient | Methanol- 20 mM of CH3COONH4 | 20 μL | LOD = 0.1–0.4 mg/kg | [66] |
| Brilliant blue, tartrazine, sunset yellow, amaranth, carminic acid, acid red, allura red | Meat products | UHPLC | PDA Various wavelengths | BEH C18 (100 × 2.1 mm, 1.7 μm | Gradient | Acetonitrile/ CH3COONH4 | 5 μL | LOD = 0.01 mg/kg LOQ = 0.05 mg/kg | [67] |
| Carminic acid, sunset yellow, tartrazine | Non-alcoholic drinks, sweets, jellies | Capillary Electrophoresis (CE) | UV (λ = 220 nm) 36 cm capillary; Separation voltage (8 kV, −8 kV); | Fused-silica capillaries of 375 od μm and 75 μm i.d | - | 30 mM PBS buffer (pH6), with 0.9 mg/mL dASNPs and 2 mM β-cyclodextrin (CD) | Electrokinetic injection | LOD = 0.03 -0.072 mg/L LOQ = 0.16–0.31 mg/L | [68] |
| Amaranth, Ponceau 4R, Sunset yellow, tartrazine, Sudan I-IV | Soft drinks/solid samples | HPLC-ESI (+)-MS | ESI (+)-MS | Spherigel C18 (250 × 4.6 mm, 5 μm) | gradient | aq. methanol 0.1% HCOOH/aqueous methanol 20 mM CH3COONH4/1% CH3COOH | 20 μL | LOD = 2.0–3.5 ng LOQ = 5.4–10.5 ng | [69] |
| Brilliant blue, allura red, amaranth, Erythrosine, ponceau 4R, sunset yellow, tartrazine | Soft drinks and processed meats | HPLC | DAD Various wavelengths | Inertsil ODS-SP column (250 × 4.6 mm, 5 μm) | Gradient | CH3COONH4 (0.1 M, pH = 7.2)—methanol-acetonitrile (9:1 v/v) | 20 μL | LOD: 0.005 μg/mL LOQ: 0.018 μg/mL | [70] |
| Brilliant blue, sunset yellow, tartrazine | Dairy powders, beverages, jellies, candies, syrups, extracts | Flow injection (FIA) | Amperometric detection (boron-doped diamondelectrode) | - | - | Edet.2 = −450 mV (100 ms duration) vs. Ag/AgCl (3.0 M KCl). | LOD = 0.8–3.5 μM | [71] | |
| Brilliant blue, sunset yellow, tartrazine | Beverages, jellies, candies, condiments, icings, syrups | Differential pulse voltammetry (DPV) | Cathodically pretreated boron-doped diamond (BDD) elctrode | - | - | 30 Hz; amplitude(a), 40 mV; for DPV scan rate (v), 0 mVs | - | LOD = 13.1–143 nM | [72] |
| Erythrosine, carmoisine, amaranth, ponceau 4R, Red 3G | Syrups | Capillary electrophoresis (CE) | Laser-induced fluorescence detection Various λexc./λemis.: (Nd:YAG laser with wavelength 532 nm and power 5 mW) | Fused silica capillary with I.D. 50 μm, O.D. 360 μm, length 30 cm | n/a | V = +17 kV (intensity of electrical field was 460 Vcm−1). | n/a | LOD = 0.2–0.4 μg/mL | [73] |
| Tartrazine, sunset yellow, azorrubine, bordeaux S, ponceau 4R, erytrosine, red no 40, patent blue V, indigo carmin, brilliant blue | Alcoholic beverages | CE | UV/vis PBS 10 mM with sodium dodecyl sulfate 10 mM, pH 11, and +25 kV of voltage | Fused silica capillary (73 cm) | n/a | Phosphate buffer solution of 10 mM with sodium dodecyl sulfate 10 mM, pH 11, and +25 kV voltage | n/a | LOD = 0.4–2.5 μg/mL LOQ = μg/mL | [74] |
| Tartazine, Amaranth, Sunset yellow, allura red, Lutein, lycopene, β-carotene | Various foodstuff | HPLC | DAD Various wavelengths | C18 column (250 mm × 4.6 mm, 5 μm) | Gradient | 1% CH3COONH4, methanol and acetone; | 20 μL | LOD = 0.2–50 ng/mL | [75] |
| Tartrazine, Quinoline yellow, Sunset Yellow, Carmoisine, Brilliant Blue | Solid foods | spectrophotometric method | UV-Vis Various wavelengths | n/a | n/a | n/a | n/a | LOQ = 1–5 μg/mL | [76] |
| Allura red | Liquid foods | spectrophotometric method | UV-Vis (506 nm) | n/a | n/a | n/a | n/a | LOD = 2.35 μg/L | [77] |
| Tartrazine, New red, Amaranth, Ponceau 4R, Sunset yellow, Allura red, Acid red, Brilliant Blue, Acid red, Erythrosine, Acid orange, Basic flavine O, Basic orange, Siperse blue 106, Crystal violet, Leucine malachite green, Leucine crystal violet | Meat | UHPLC | DAD (200–800 nm) | C18 column (2.1 mm × 50 mm, 1.7 μm) | Gradient | (A) 20 mM CH3COONH4–0.02% acetic acid (pH 5) and (B) acetonitrile | 2 μL | LOD = 0.96–2.16 μg/kg LOQ = 1.61–7.19 μg/kg | [78] |
| New red, Amaranth, Camine, Sunset yellow, Acid Red G, Allura red, Acid Scarlett GR, Erythrosine, Rhodamine B, Sudan I, Para red, Sudan II, Sudan III, Sudan red 7B, Sudab IV, Sudan Orange G | Hotpot condiment | HPLC | DAD Various wavelengths | C18 column (4.6 mm × 250 mm, 5 μm) | Gradient | (A) Methanol; (B) 0.01 M PBS (pH = 7.5) | 20 μL | LOD = 0.001–0.00 3 mg/kg | [79] |
| Allura Red, Ponceau 4R | Granulated drinks | UV–visible spectrophotometer | UV–visible spectrophotometer (ZCDS) | n/a | n/a | n/a | n/a | LOD = 0.059–0.102 μg/mL LOQ = 0.198–0.341 μg/mL | [80] |
| Brilliant Blue, Sunset Yellow, Tartrazine | Non-alcoholic drinks, sweets, jellies | HPLC | UV-Vis (630 nm, 480 nm, 430 nm) | Modified C18 column (250 × 4.6 mm, 5 μm) with a 0.25% (v/v) Triton X-100 aq. solution at pH 7 | Isocratic | 0.25 mL of Triton X-100 (Sigma) up to 100 mL with 50 mmol l−1 phosphate buffer solution at pH 7 | 20 μL | LOD = 0.143–0.080 mg/L | [81] |
| Tartrazine, Amaranth, Sunset Yellow, Allura red, Ponceau 4R, Erythrosine | Soft drinks, sugar and gelatin based confectionery | HPLC-UV | UV 430 nm, 510 nm | C18 column (250 mm × 4.6 mm, 5 μm | Gradient | (A) 0.1 mol/L ammonium acetate aqueous solution (pH 7.5, adjusted with 10 mol/L NaOH- methanol–acetonitrile (30:70, v/v) | 20 μL | LOD = 0.015–0.32 ng/mL | [82] |
| Allurea red, Amaranth, Erythrosine, Ponceau 4R, Sunset Yellow | Beverages, alcoholic drinks and fish foe | SERS-Raman | Radiation of 514.5 nm from an air-cooled argon ion laser was used for SERS excitation | n/a | n/a | n/a | n/a | LOD = 10−7–10−5 M | [83] |
| Sunset yellow | beverage, dried bean curd, braised pork | ELISA | n/a | n/a | n/a | n/a | LOD = 25 pg mL−1 | [84] | |
| (40 food colorants) Ponceau 6R, Tartrazine, Fast yellow AB, Amaranth, Indigotine, Naphthol yellow S, Chrysoine, Ponceau 4R, Sunset yellow FCF, Red 10B, Orange G, Acid violet 7, Brilliant black PN, Allura red AC, Yellow 2G, Red 2G, Uranine, Fast red E, Green S, Ponceau 2R, Azorubine, Orange I, Quinoline yellow, Martius yellow, Ponceau SX, Ponceau 3R, Fast green FCF, Eosine, Brilliant blue FCF, Orange II, Orange RN, Acid blue 1, Erythrosine, Amido black 10B, Acid red 52, Patent blue V, Acid green 9, Phloxine B, Benzyl violet 4B, Rose bengal | Drinks, syrups and candies | HPLC | HPLC–DAD | C18 column (50 mm × 4.6 mm, 1.8 μm) | Gradient | (A) 0.1 mol/L of CH3COONH4 pH 6.7 and (B) was Methanol–Acetonitrile (50:50, v/v) | 5 μL | LOD = 0.03–0.1 μg/g | [85] |
| Ponceau 4R, Sunset Yellow, Allura Red, Azophloxine, Ponceauxylidine, Erythrosine, Orange II | Animal feed and meat | LC | ESI (−)-MS | C18 column (2.1 mm × 150 mm, 5 μm) | Gradient | (A) 20 mmol/L CH3COONH4: Acetonitrile | LOD = 0.02–21.83 ng/mL | [86] | |
| New Coccine, Indigo Carmine, Erythrosine, Tartrazine, Sunset Yellow FCF, Fast Green FCF, Brilliant Blue FCF, Allura Red AC, Amaranth, Dimethyl Yellow, Fast Garnet GBC, Para Red, Sudan I, Sudan II, Sudan III, Sudan IV, Sudan Orange G, Sudan Red 7B, Sudan Red B, Sudan Red G | Chili powders; commercial syrup preserved fruits | LC | ESI (−) and ESI (+) MS/MS | Acclaim Polar Advantage C16 (3 mm, 4.6 × 150 mm) | Gradient | (A) Acetonitrile and (B) 20 mM CH3COONH4 –1.0% CH3COOH | LOQ = 0.005–1 mg/kg | [87] | |
| Multi-class (53 food colorants) | Spices | UHPLC | QTOF-MS (sequential window acquisition of all theoretical fragment-ion spectra- SWATH) | Acquity UPLC BEH C18 column (2.1 × 100 mm, 1.7 μm,) | Gradient | (A) Acetonitrile and (B) 10 mM CH3COONH4 pH = 6.7 | n/a | n/a | [88] |
| Multi-class (34 water soluble synthetic food colorants) | Beverages, syrup, chewing gum | HPLC | DAD-IT-TOF/MS (λ = 200–700 nm) | Atlantis™ dC18 (4.6 mm × 250 mm, 5 μm) | Gradient | (A)20 mM HCOONH4 buffer; (B) methanol/acetonitrile (1:1 v/v) | 20 μL | LODs = 0.009–0.102 μg/mL; LOQs = 0.045–0.203 μg/mL | [89] |
Table 4.
Sample preparation techniques for the determination of synthetic food colorants in food samples.
Table 4.
Sample preparation techniques for the determination of synthetic food colorants in food samples.
| Food Colorant | MATRIX | Extraction/Sample Preparation | Ref. |
|---|---|---|---|
| Amaranth, Ponceau 4R, Sunset Yellow, Tartrazine and Brilliant Blue | Reduction of iron (III) in sodium acetate/hydrochloric acid solution (pH 1.71) followed by a chromogenic reaction with potassium hexacyanoferrate (III) to form the Prussian blue species | [9] | |
| Sudan I | Non-alcoholic drinks, sweets, jellies | Extraction, sonication, centrifugation, filtration. Sample extracts or liquid samples were filtrated | [29] |
| Tartrazine, quinoline Yellow, Sunset Yellow, Carmoisine, Amaranth, Ponceau 4R, Erythrosine, Red 2G, Allura Red AC, Patent Blue V, Indigo Carmine, Brilliant Blue FCF, Green S | Dairy powders, color beverages, jellies, candies, condiments, icings, syrups, extracts | Beverages: degassed by stirring Solid: dissolved in water, ultrasonication, filtration | [49] |
| Tartrazine, Sunset yellow, Brilliant Blue, Acid red | Powder | Fabrication of flower-like silver nanostructures by adding 10 mL of ultrapure water, 2 mL of PVP solution (1%) and 0.2 mL of silver nitrate solution (1 mol/L) | [50] |
| Allura Red, Sunset Yellow, and Tartrazine | Soft drinks | Food solutions were prepared with dilution with methanol–water mixture (v/v, 50/50) | [51] |
| Azorubine, amaranth, cochineal red A, red 2G, allura red, azocarmine B (AZO B), azocarmine G (AZO G), ponceau 2R, ponceau 6R, tartrazine, sunset yellow, quinoline yellow, orange II, metanil yellow (MY), patent blue V, indigo carmine and brilliant blue FCF. | Solid food/liquid beverages | 4 g solid sample +20 mL ethanol-H2O (1:1 v/v), ultrasound and shaking, centrifugation, separation, and SPE in polyamide (PA) cartridge Beverages: degas (ultrasound), diluted 1.1 with H2O, centrifuge | [52] |
| Brilliant Blue FCF, Tartrazine, Amaranth, Carmine, Sunset yellow, Allura red, Erythrosine | Wine and soft drinks | Magnetic dispersive solid-phase extraction (M-dSPE): | [53] |
| Brilliant Blue FCF, Tartrazine, Amaranth, Sunset yellow, | Wine and soft drinks | Degassing followed by SPE with Sep-Pack C18 and elution with 2-propanol | [54] |
| Allura red, sunset yellow, tartrazine | Solid food/liquid beverages | Sample dilution (0.5–2.0 g) in 100 mL H2O | [55] |
| Sunset yellow | Beverage | No extraction | [56] |
| Carmoisine, sunset yellow | Beverage | Samples were diluted with water and filtered through 0.2 μm polypropylene membrane | [57] |
| Allura red | Beverage | filtered through 0.45 μm nylon filter and diluted 1:20 (v/v) in ultrapure water | [58,59] |
| Brilliant blue, tartrazine, allura red Amaranth, Azorubine, Patent Blue V, Ponceau 4R | Various food products | Beverages: sample sonicated, addition of aq. NH3, filtration; Solid: homogenization, addition of aq. NH3, sonication, centrifugation | [60] |
| Brilliant Blue FCF, Indigo carmine, Allura red, carminic acid, Ponceau 4R, Sunset yellow, tartrazine | Dairy powders, color beverages, jellies, candies, condiments, icings, syrups, extracts | Flavored milk samples: diluted with ethanol (1:1 v/v), SPE with PA cartridge | [61] |
| Brilliant Blue FCF, Indigo carmine, Allura red, carminic acid, Ponceau 4R, Sunset yellow, tartrazine, fast green FCF | Liquid foods | Beverages: degas (ultrasound) and directly to CE Milk: diluted with ethanol (1:1 v/v), SPE with PA cartridge Jelly: blended with ethanol: H2O 1:1 v/v at 65 °C × 4 h + SPE (Polyamide cartridge) | [62] |
| Sunset yellow, Carmoisine, Amaranth, Ponceau 4R, Erythrosine., Red 2G, Allura red | Soft drinks | Extraction stage, followed by sonification, centrifugation, and concentration step + clean up via SPE on polyamide (PA) cartridges | [63] |
| Tartrazine, Quinoline Yellow, Sunset Yellow, Carmoisine, Ponceau, 4R, Allura Red, Indigo Carmine, Brilliant Blue | Various foods and medicines | Homogenization, dissolution, filtration | [64] |
| Tartrazine, Sunset Yellow FCF, Azorubine Amaranth Cochineal Red, Red 2G), Allura Red AC, Brilliant Black BN, Brown FK and Brown HT, Patent Blue V, Brilliant Blue FCF, and Green S | Fish roe | Extraction with aq. NH3, centrifugation, pH adjustment, addition of PA sorbent and extraction with methanol | [65] |
| Brilliant blue, Indigo carmine, allura red, erythrosine, ponceau 4R, sunset yellow, Lemon yellow | Protein-rich samples | Purification/deproteinization with chitosan | [66] |
| Brilliant blue, tartrazine, sunset yellow, amaranth, carmininic acid, acid red, allura red | Meat products | ASE (static) with ethanol-H2O_NH3 75:24:1 v/v/v, 85oC for 10 min | [67] |
| Carminic acid, sunset yellow, tartrazine, brilliant blue. | Non-alcoholic drinks, sweets, jellies | d-SPME with diamino-moiety functionalized silica nanoparticles (dASNPs) and β-cyclodextrin (β-CD) and pseudo-stationary phases (PSPs). Optimization of pH (2.5), sorbent, amount of dASNPs; ionic strength; extraction time and mode; desorption time; interferences (no interferences identified) | [68] |
| Amaranth, Ponceau 4R, Sunset yellow, tartrazine, Sudan I-IV | Soft drinks/solid samples | Liquid: filtration, degassing Solid: homogenization, extraction with DMSO, sanitation, centrifugation, and filtration | [69] |
| Brilliant blue FCF, Allura red, Amaranth, Erythrosine, Ponceau 4R, Sunset Yellow, Tartrazine | Soft drinks and processed meats | [70] | |
| Brilliant blue, sunset yellow, tartrazine | Dairy powders, color beverages, jellies, candies, condiments, icings, syrups, extracts | Homogenization, addition in 0.1 M H2SO4 (gelatin dissolution), ultrasonic and dilution with supporting electrolyte | [71] |
| Brilliant blue, sunset yellow, tartrazine | Dairy powders, color beverages, jellies, candies, condiments, icings, syrups, extracts | - | [72] |
| Erythrosine, carmoisine, amaranth, ponceau 4R, Red 3G | Syrups | Dilution to PBS (20 mM, pH 11) as a background electrolyte (BGE) in the ratio of 1:10 or 1:2 for CE–LIF | [73] |
| Tartrazine, sunset yellow, azorrubine, bordeaux S, ponceau 4R, erytrosine, red no 40, patent blue V, indigo carmine, brilliant blue FCF | Alcoholic beverages | degassed by mechanical agitation and filtered | [74] |
| Tartazine, Amaranth, Sunset yellow, Allura red, Lutein, Lycopene, β-carotene | Various foodstuff | Ultrasound-assisted solvent extraction: immersion to methanol, sonication, centrifugation, extraction with acetone, evaporation. Liquid: 0.5 mL + 1 mL methanol; Solid: 0.2 g + 1 mL methanol | [75] |
| Tartrazine, Quinoline yellow, Sunset Yellow, Carmoisine, Brilliant Blue | Solid foods | Solid: a portion of food was diluted in H2O, centrifuges and diluted with equal volume of CH3COOH 3 M Liquid: a portion of was diluted in a mixture of NH3: ethanol 2:73%, mix, and centrifuged. | [76] |
| Allura red | Liquid foods | Sample filtered, pH adjusted (4.0), extraction with Acetonitrile by SPE (MCI GEL CHP20P resin) | [77] |
| Tartrazine, New red, Amaranth, Ponceau 4R, Sunset yellow, Allura red, Acid red, Brilliant Blue, Acid red, Erythrosine, Acid orange, Basic flavine O, Basic orange, Siperse blue 106, Crystal violet, Leucine malachite green, Leucine crystal violet | Meat | Microwave assisted extraction: sample with methanol/H2O (95:5 v/v) followed by SPE (C18 column), evaporation to dryness and reconstitution with methanol | [78] |
| New red, Amaranth, Carmine, Sunset yellow, Acid Red G, Allura red, Acid Scarlett GR, Erythrosine, Rhodamine B, Sudan I, Para red, Sudan II, Sudan III, Sudan red 7B, Sudab IV, Sudan Orange G | Hotpot condiment | Direct solvent extraction: sample with solvent (acetone-methanol), vortex, centrifugation, evaporation, pH adjustment | [79] |
| Allura Red, Ponceau 4R | Granulated drinks | Powdered sample dissolved in distilled water, | [80] |
| Brilliant Blue, Sunset Yellow, Tartrazine | Non-alcoholic drinks, sweets, jellies | Solid: dilution in H2O and filtration | [81] |
| Tartrazine, Amaranth, Sunset Yellow, Allura red, Ponceau 4R, Erythrosine | Soft drinks, sugar and gelatin based confectionery | Ionic liquid dispersive liquid phase microextraction. Sample + ionic liquid [1-Octyl-3-methylimidazolium tetrafluoroborate ([C8MIM][BF4])] and methanol addition. | [82] |
| Allura red, Amaranth, Erythrosine, Ponceau 4R, Sunset Yellow | Beverages, alcoholic drinks and fish foe | Synthesis of the G/Ag nanoparticle composite | [83] |
| Sunset yellow | Beverage, dried bean curd, braised pork | [84] | |
| (40 food colorants) Ponceau 6R, Tartrazine, Fast yellow AB, Amaranth, Indigotine, Naphthol yellow S, Chrysoine, Ponceau 4R, Sunset yellow FCF, Red 10B, Orange G, Acid violet 7, Brilliant black PN, Allura red AC, Yellow 2G, Red 2G, Uranine, Fast red E, Green S, Ponceau 2R, Azorubine, Orange I, Quinoline yellow, Martius yellow, Ponceau SX, Ponceau 3R, Fast green FCF, Eosine, Brilliant blue FCF, Orange II, Orange RN, Acid blue 1, Erythrosine, Amido black 10B, Acid red 52, Patent blue V, Acid green 9, Phloxine B, Benzyl violet 4B, Rose bengal. | Drinks, syrups, and candies | Drinks: degas, evaporation Solid: grind, mixing with solvent and SPE with PA column with 1% NH3/ethanol solution | [85] |
| Ponceau 4R, Sunset Yellow, Allura Red, Azophloxine, Ponceauxylidine, Erythrosine Orange II | Animal feed and meat | Homogenization, extraction with ethanol:NH3:H2O (80:1:19 v/v), evaporation, reconstitution | [86] |
| New Coccine, Indigo Carmine, Erythrosine, Tartrazine, Sunset Yellow FCF, Fast Green FCF, Brilliant Blue FCF, Allura Red AC, Amaranth, Dimethyl Yellow, Fast Garnet GBC, Para Red, Sudan I, Sudan II, Sudan III, Sudan IV, Sudan Orange G, Sudan Red 7B, Sudan Red B, Sudan Red G | Chili powders; commercial syrup preserved fruits | Homogenization and extraction with Acetonitrile twice | [87] |
| Multi-class (53 food colorants) | Spices | Extraction with H2O/methanol/acetonitrile/THF, 9:1:5:5, v/v/v/v) | [88] |
| Multi-class (34 water soluble synthetic food colorants) | Beverages, syrup, chewing gum | Beverages: degassing, pH adjustment, and dilution. Syrup: dilution, sonication, and pH adjustment. Chewing gum: washing with water, pH adjustment. | [89] |
© 2020 by the authors. Licensee MDPI, Basel, Switzerland. This article is an open access article distributed under the terms and conditions of the Creative Commons Attribution (CC BY) license (http://creativecommons.org/licenses/by/4.0/).
Share and Cite
MDPI and ACS Style
Ntrallou, K.; Gika, H.; Tsochatzis, E. Analytical and Sample Preparation Techniques for the Determination of Food Colorants in Food Matrices. Foods 2020, 9, 58. https://doi.org/10.3390/foods9010058
AMA Style
Ntrallou K, Gika H, Tsochatzis E. Analytical and Sample Preparation Techniques for the Determination of Food Colorants in Food Matrices. Foods. 2020; 9(1):58. https://doi.org/10.3390/foods9010058
Chicago/Turabian StyleNtrallou, Konstantina, Helen Gika, and Emmanouil Tsochatzis. 2020. "Analytical and Sample Preparation Techniques for the Determination of Food Colorants in Food Matrices" Foods 9, no. 1: 58. https://doi.org/10.3390/foods9010058
Note that from the first issue of 2016, this journal uses article numbers instead of page numbers. See further details here.