
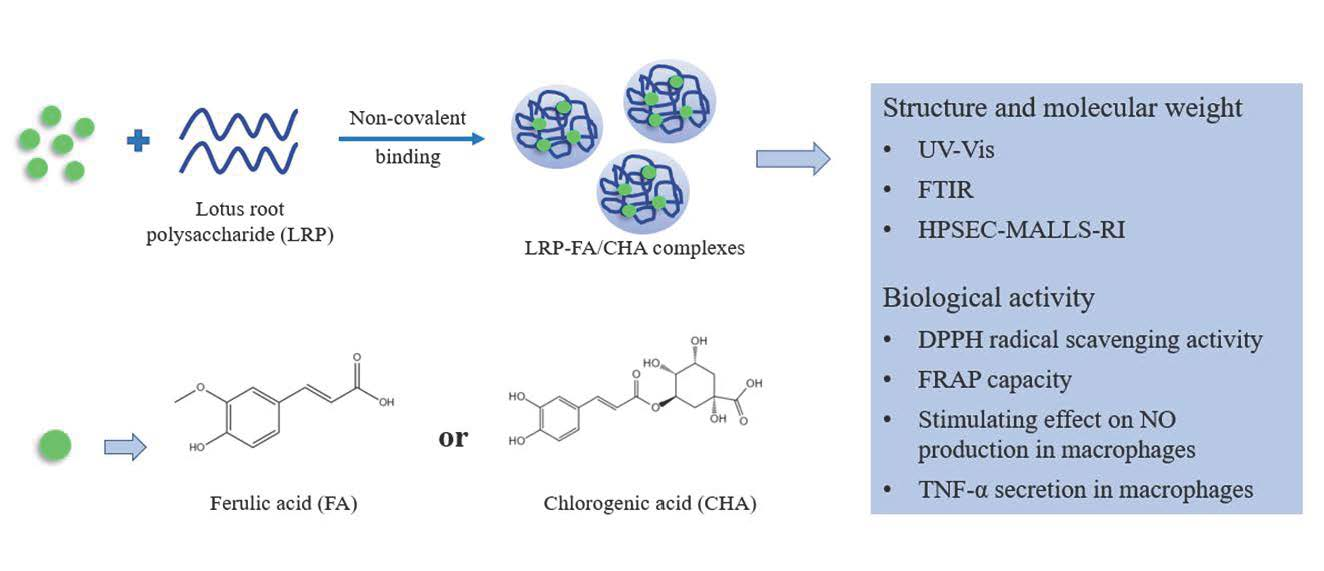
Physicochemical and Functional Changes in Lotus Root Polysaccharide Associated with Noncovalent Binding of Polyphenols

 ,
,
Abstract
: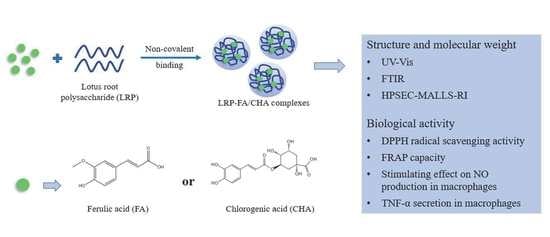
1. Introduction
2. Materials and Methods
2.1. Materials and Chemicals
2.2. Extraction of LRP
2.3. Composition Analysis of LRP
2.4. Preparation of LRP–Polyphenol Complexes
2.5. Spectral Analyses
2.6. Measurement of Molecular Weight Distribution
2.7. Evaluation of Antioxidant Capacity
2.8. Evaluation of Macrophage-Stimulating Activity
2.9. Statistical Analysis
3. Results and Discussion
3.1. Basic Composition of LRP
3.2. Factors Influencing the Formation of LRP–Polyphenol Complexes
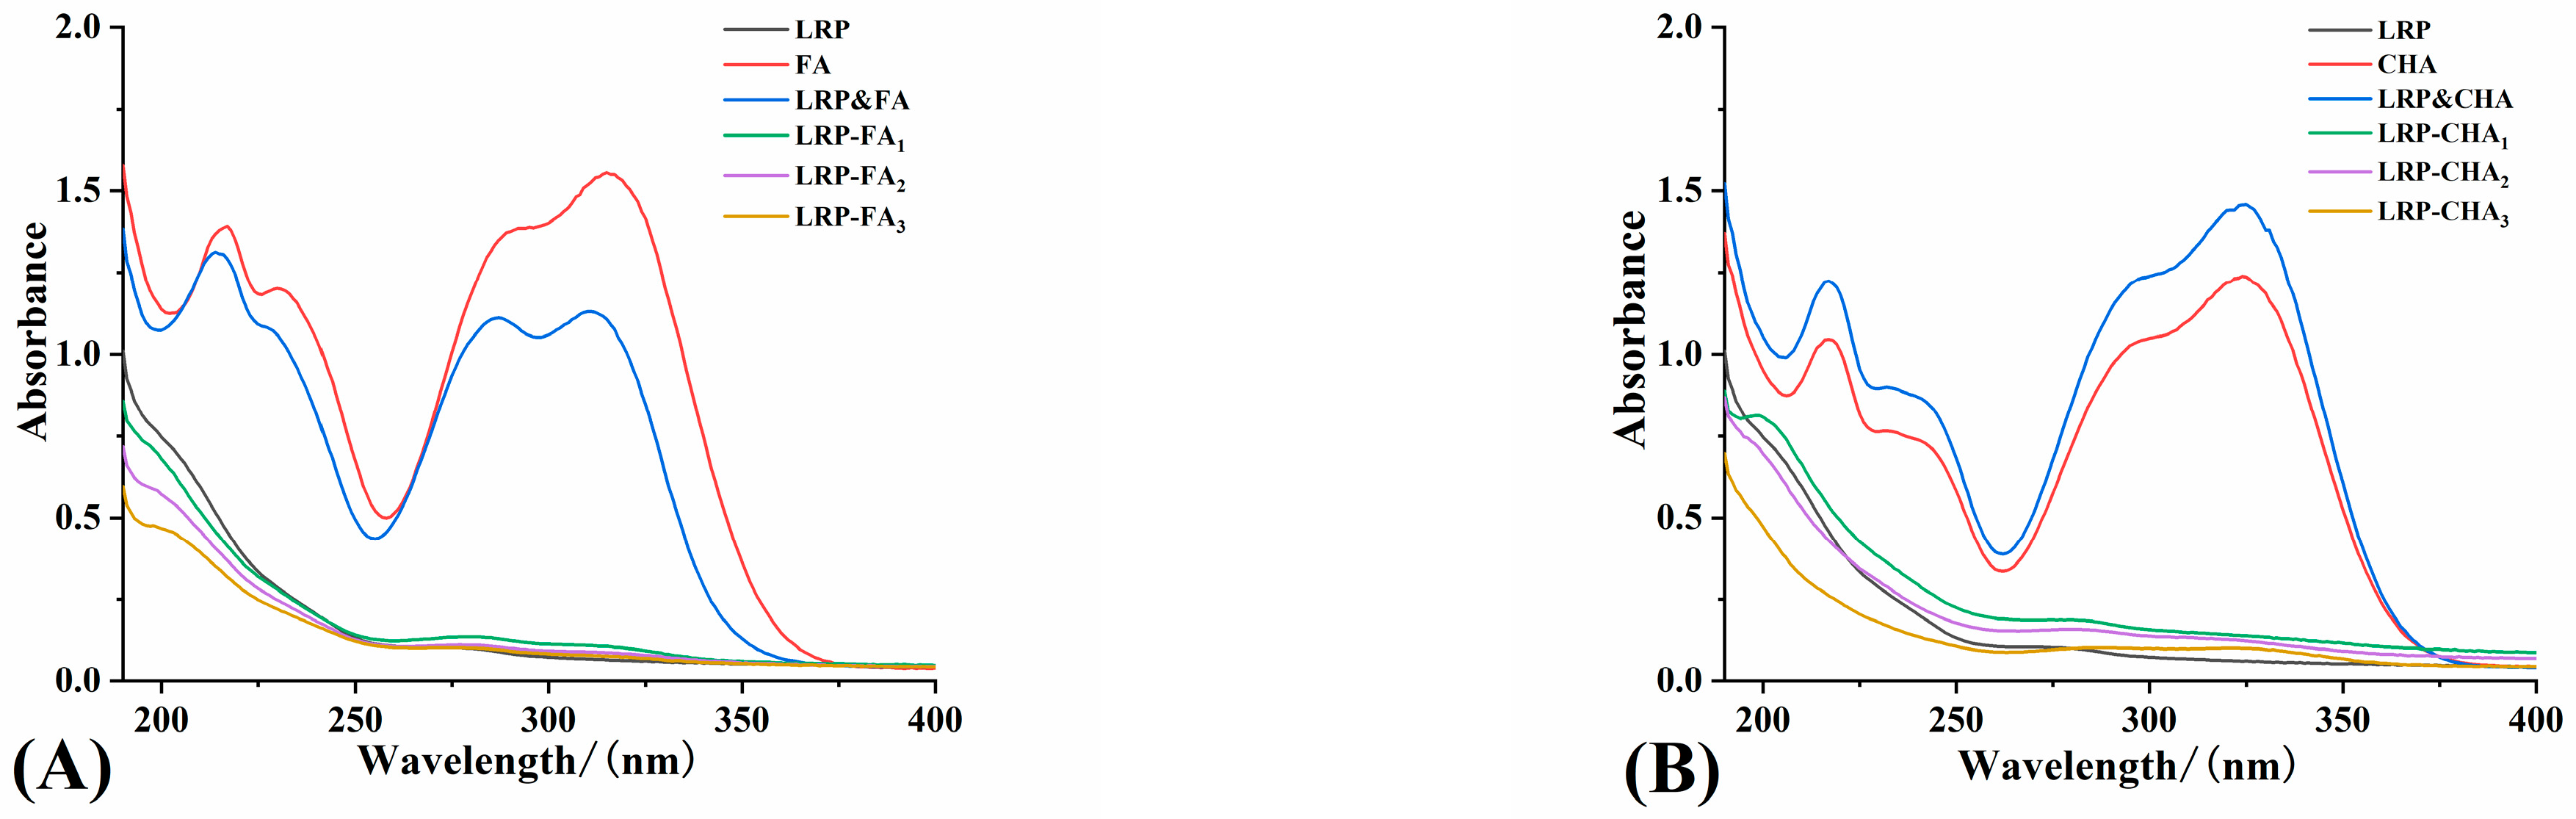
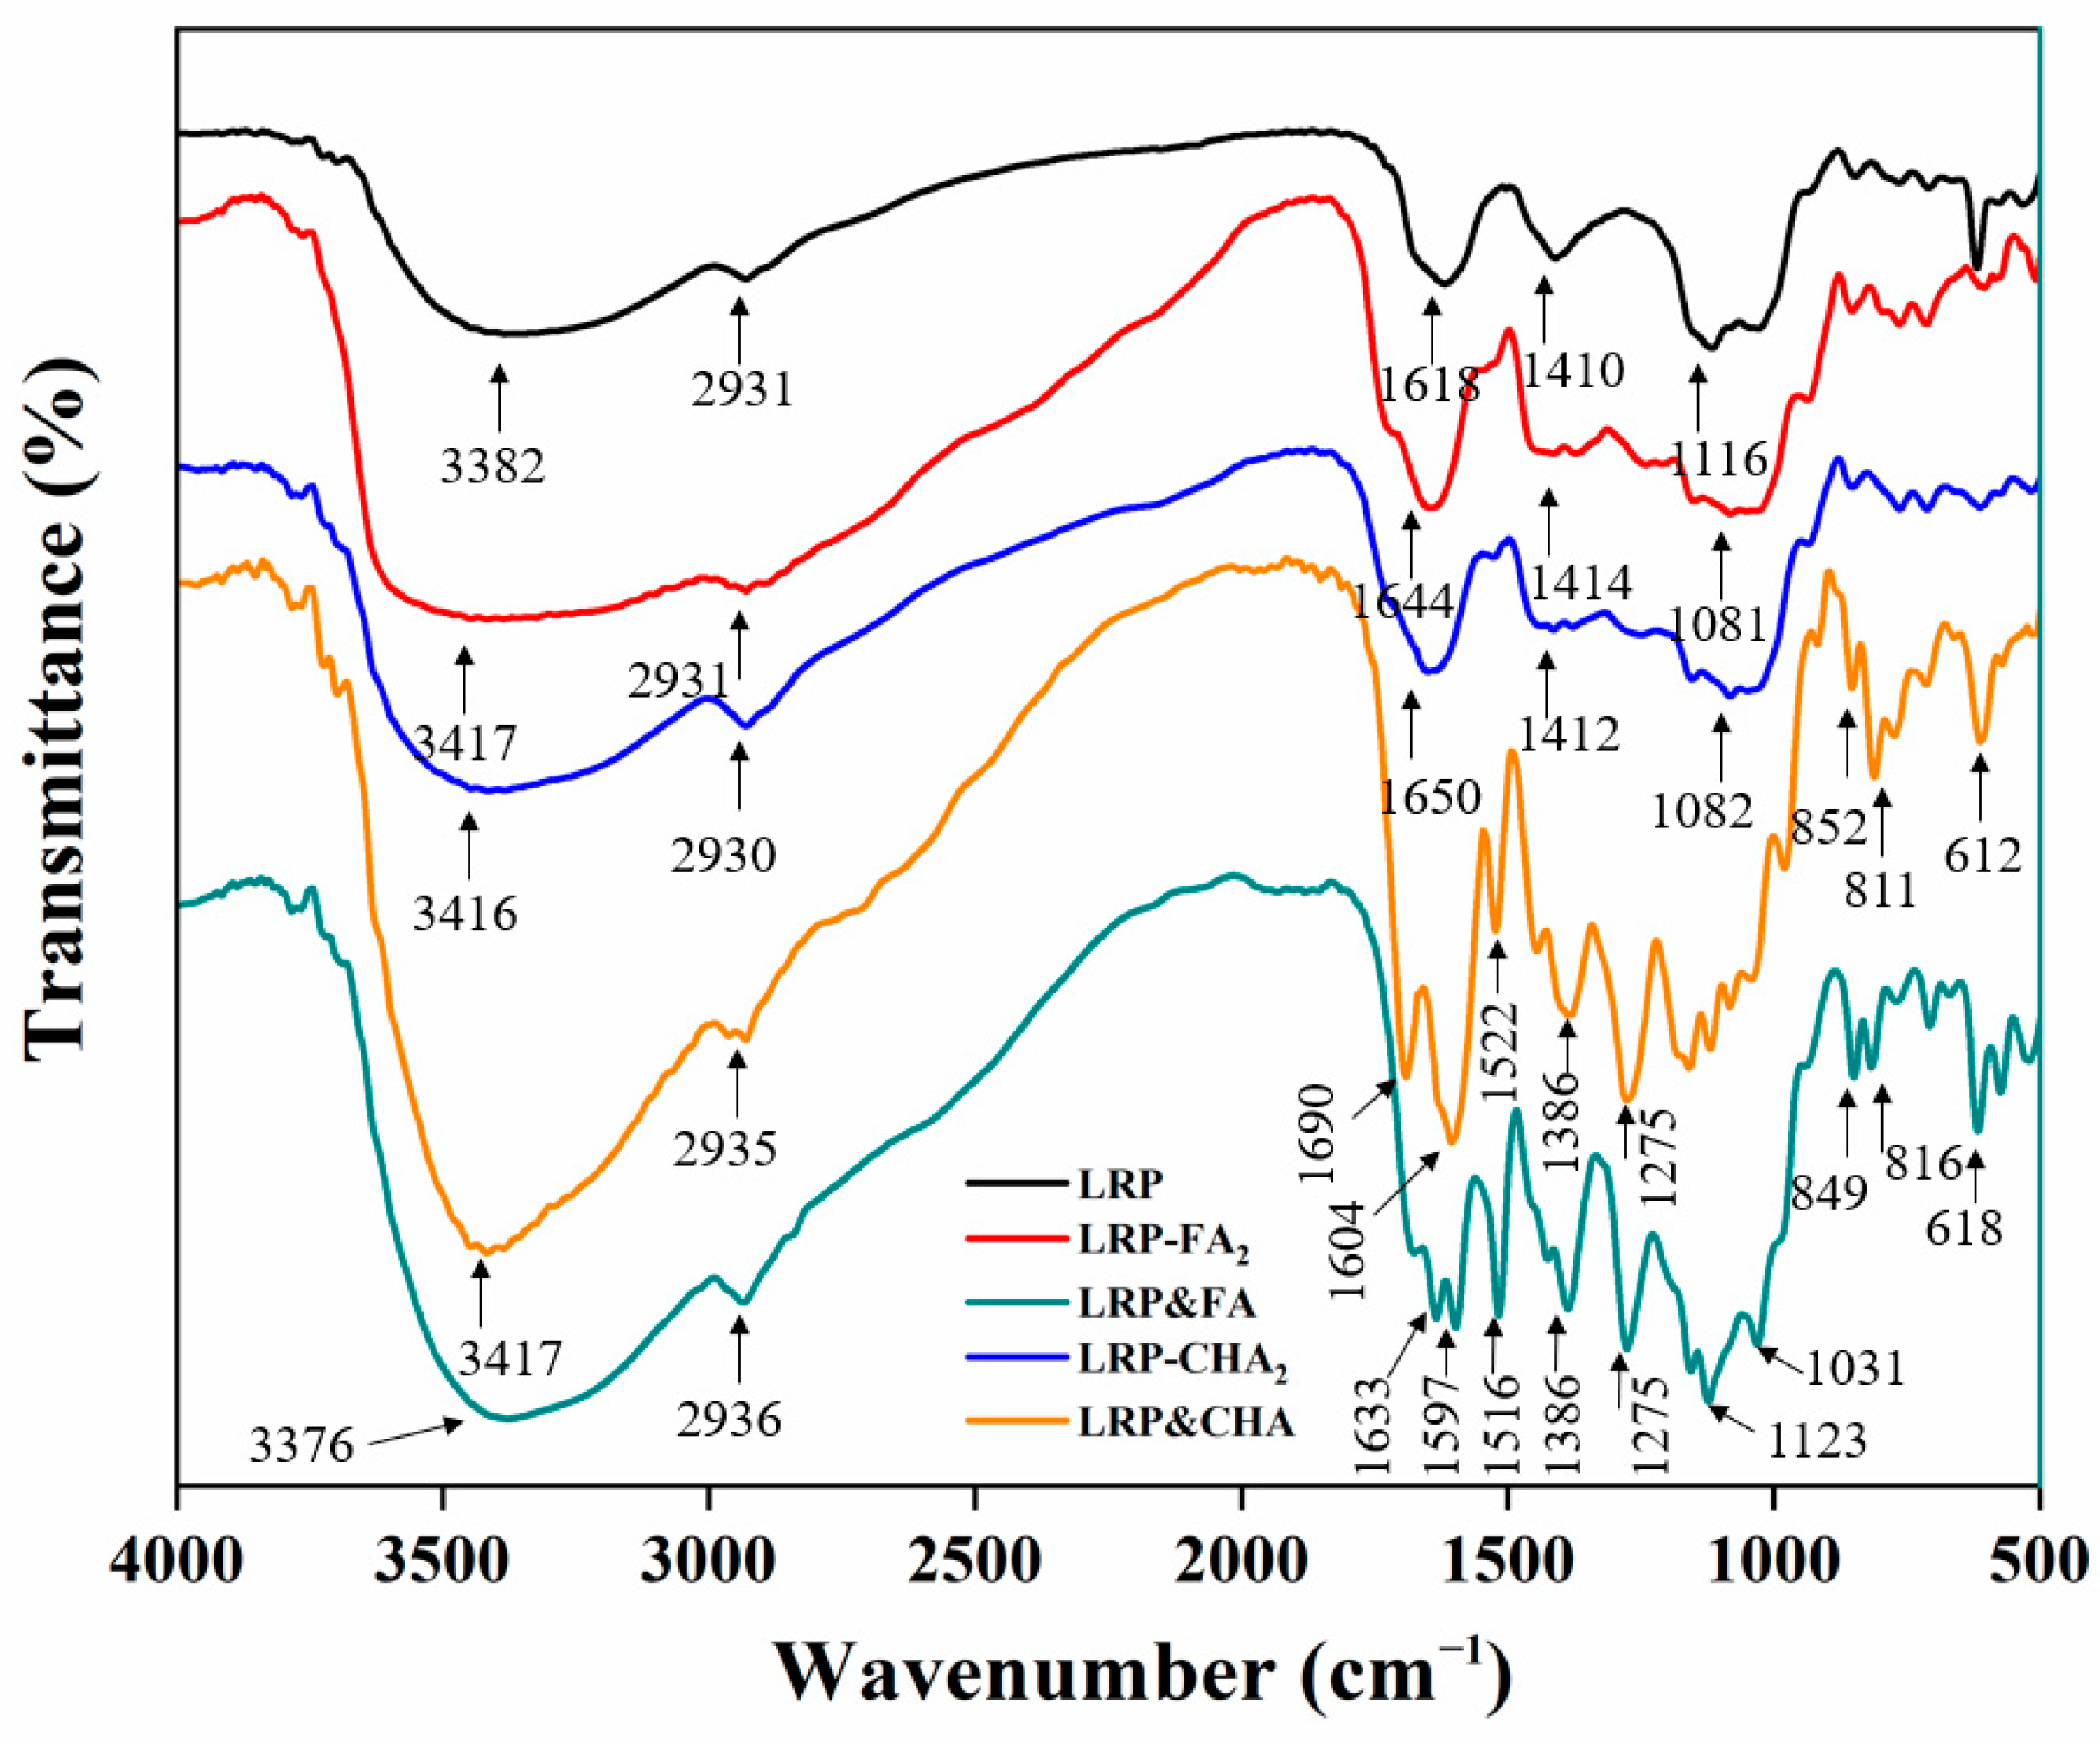
3.3. Spectral Features of LRP–Polyphenol Complexes
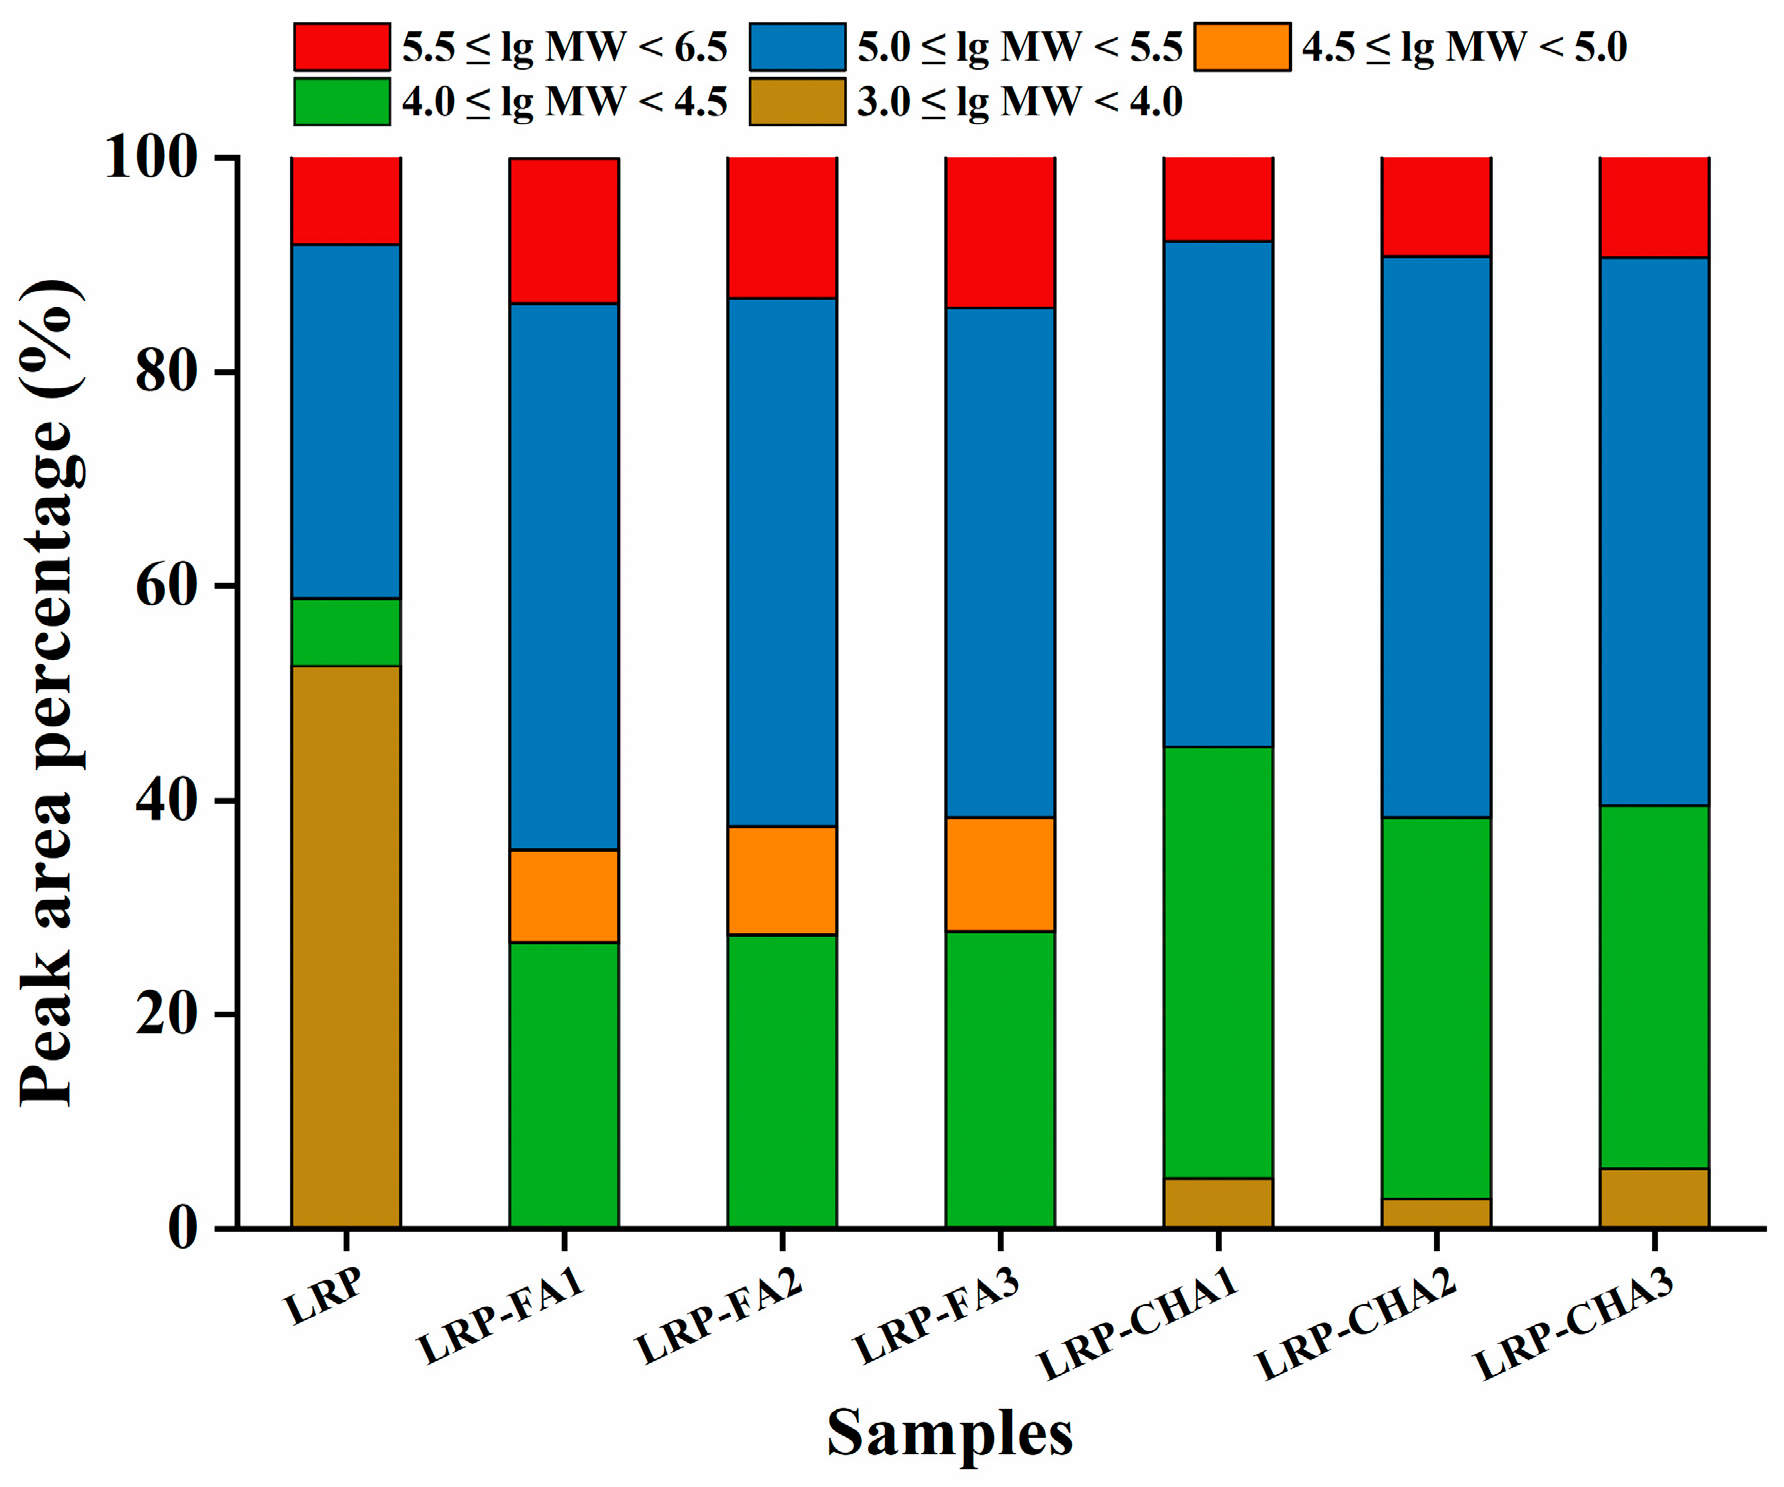
3.4. Molecular Weight Distribution of LRP–Polyphenol Complexes
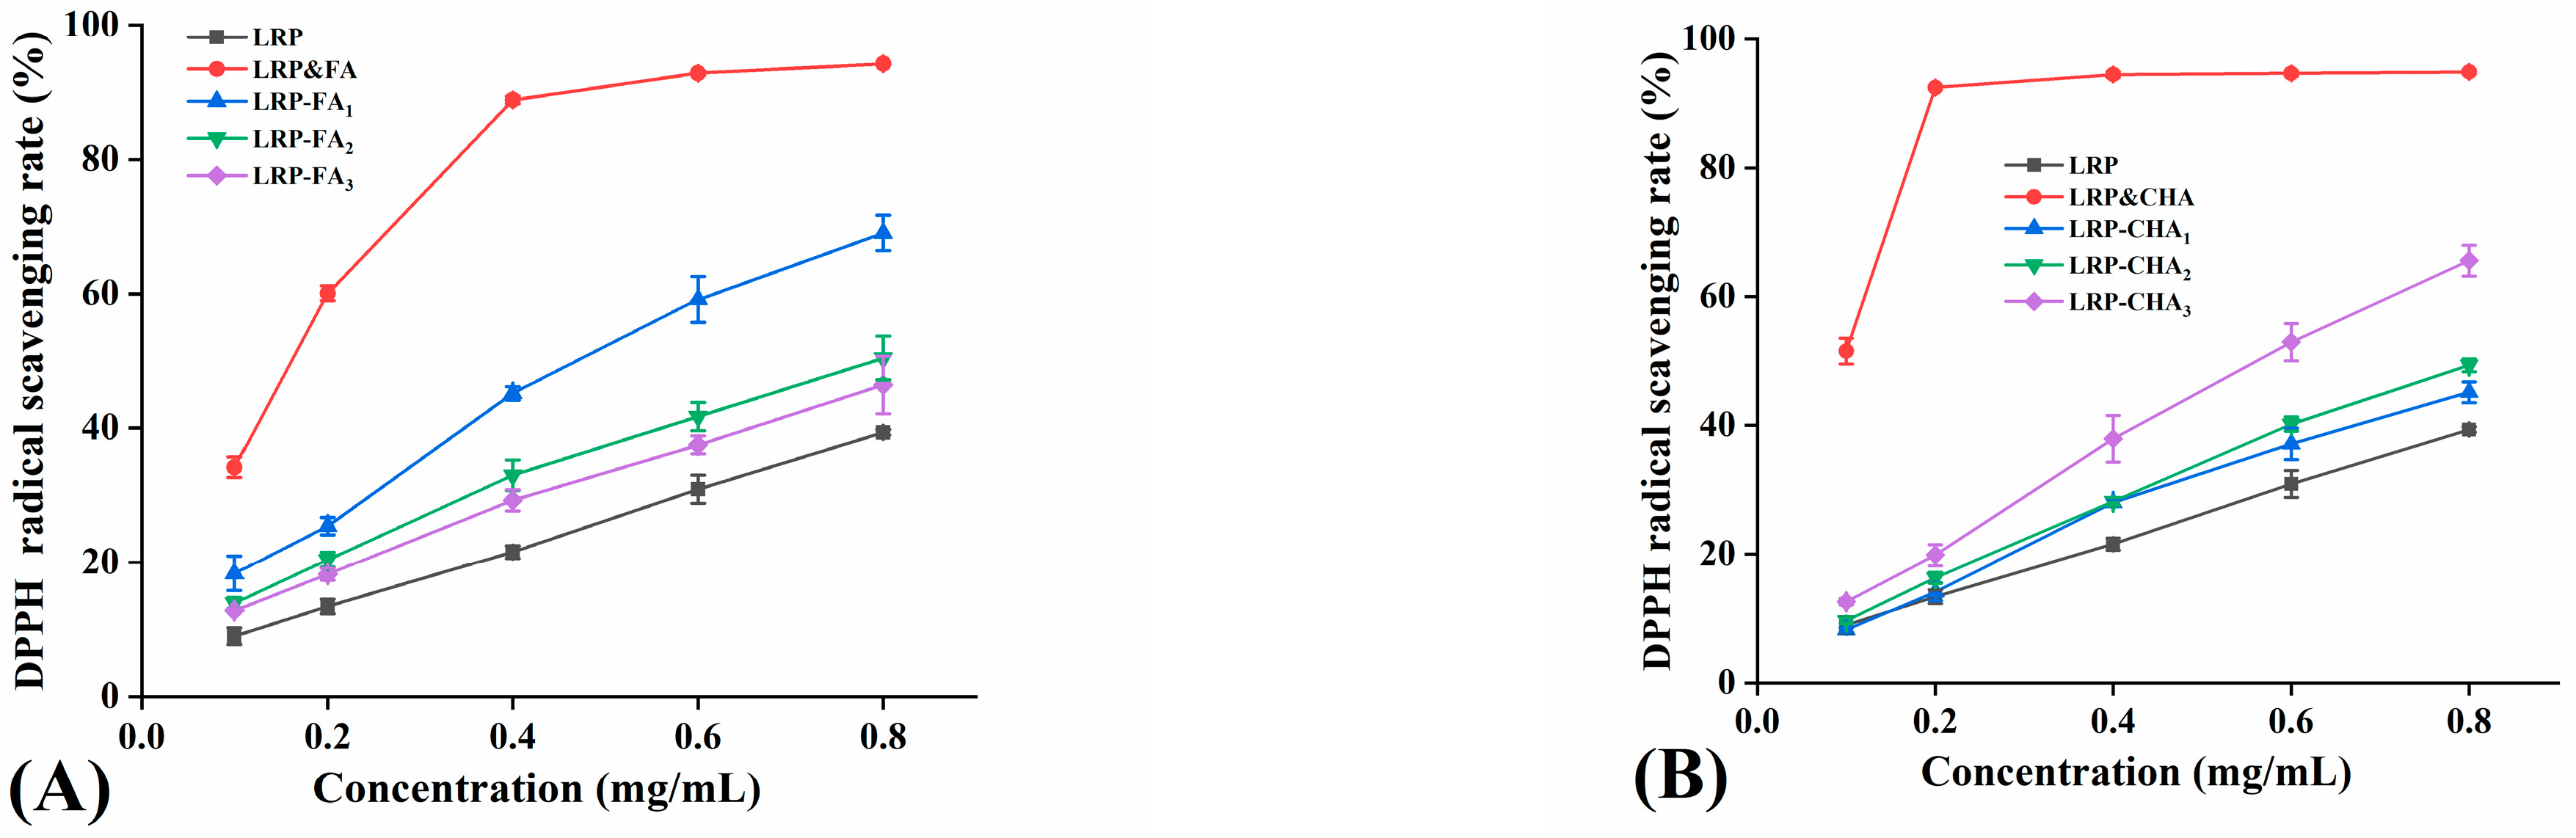
3.5. Antioxidant Activity of LRP–Polyphenol Complexes
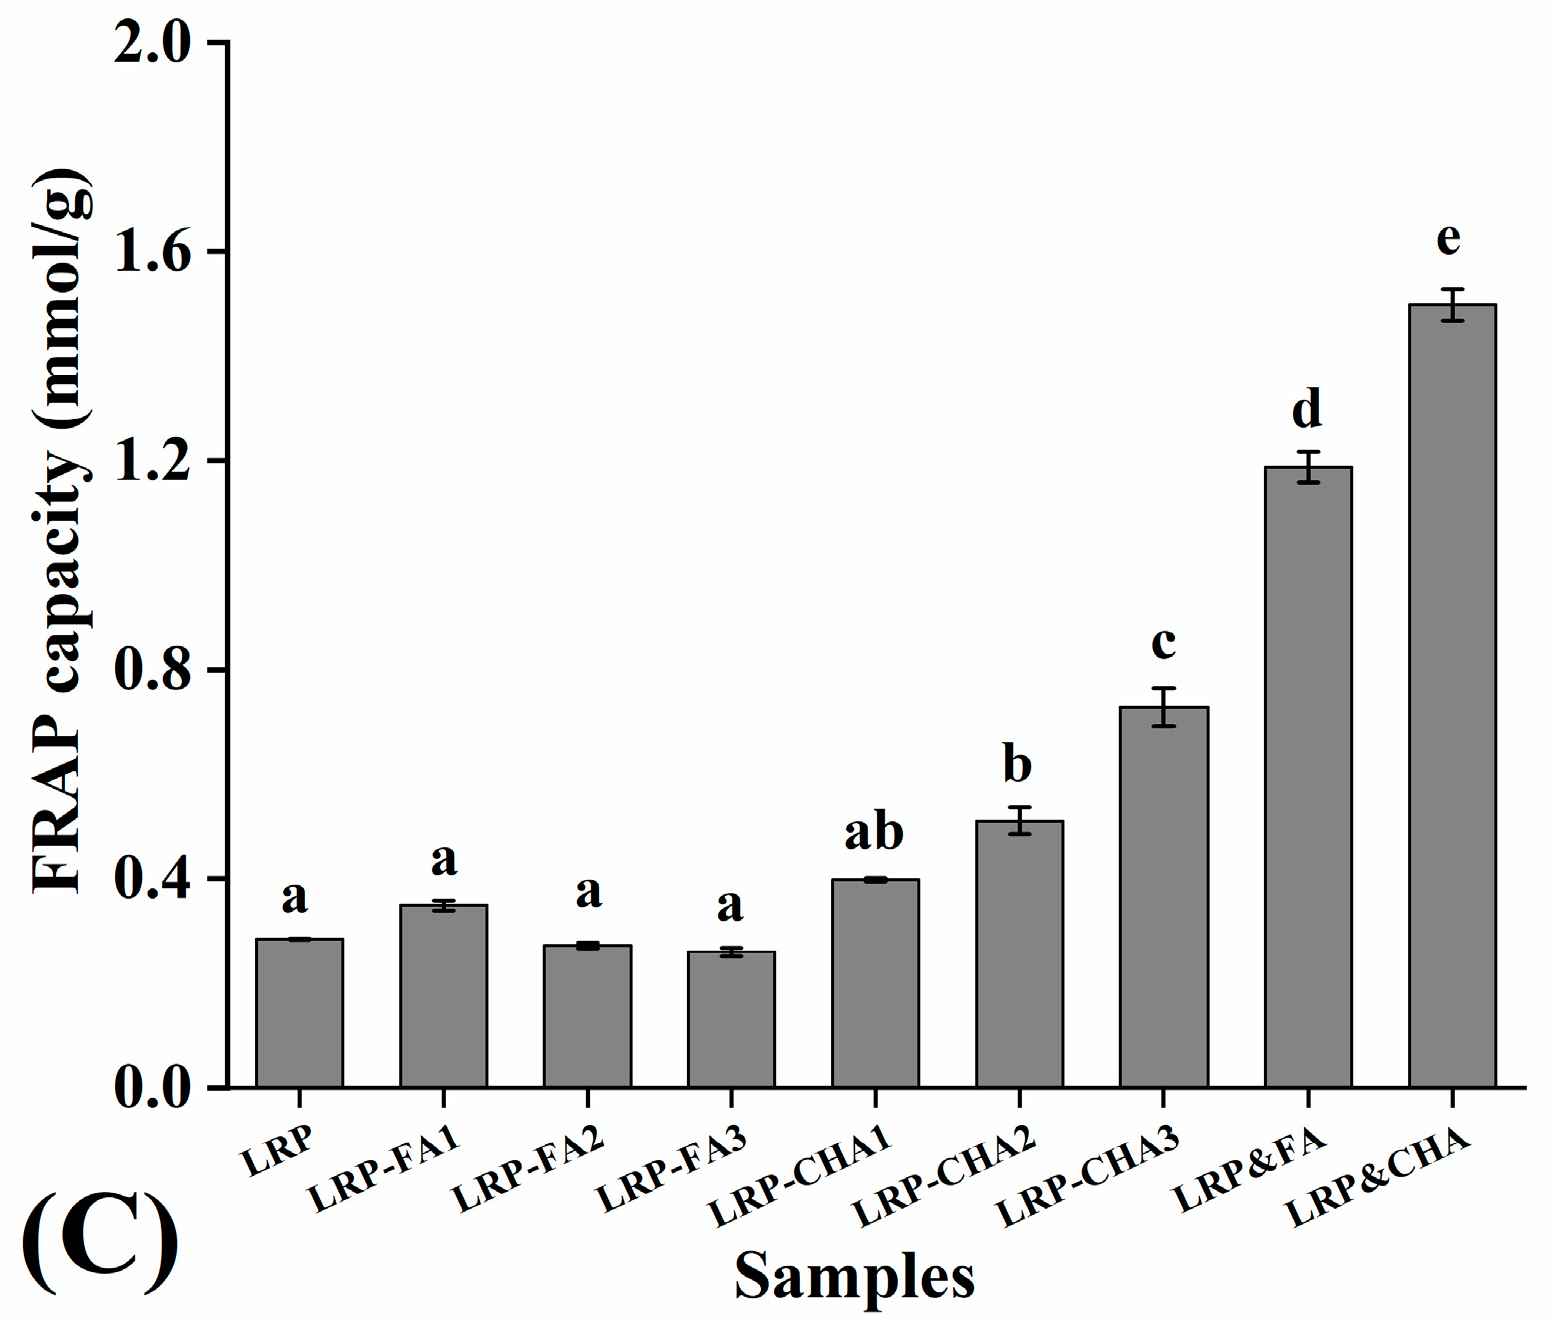
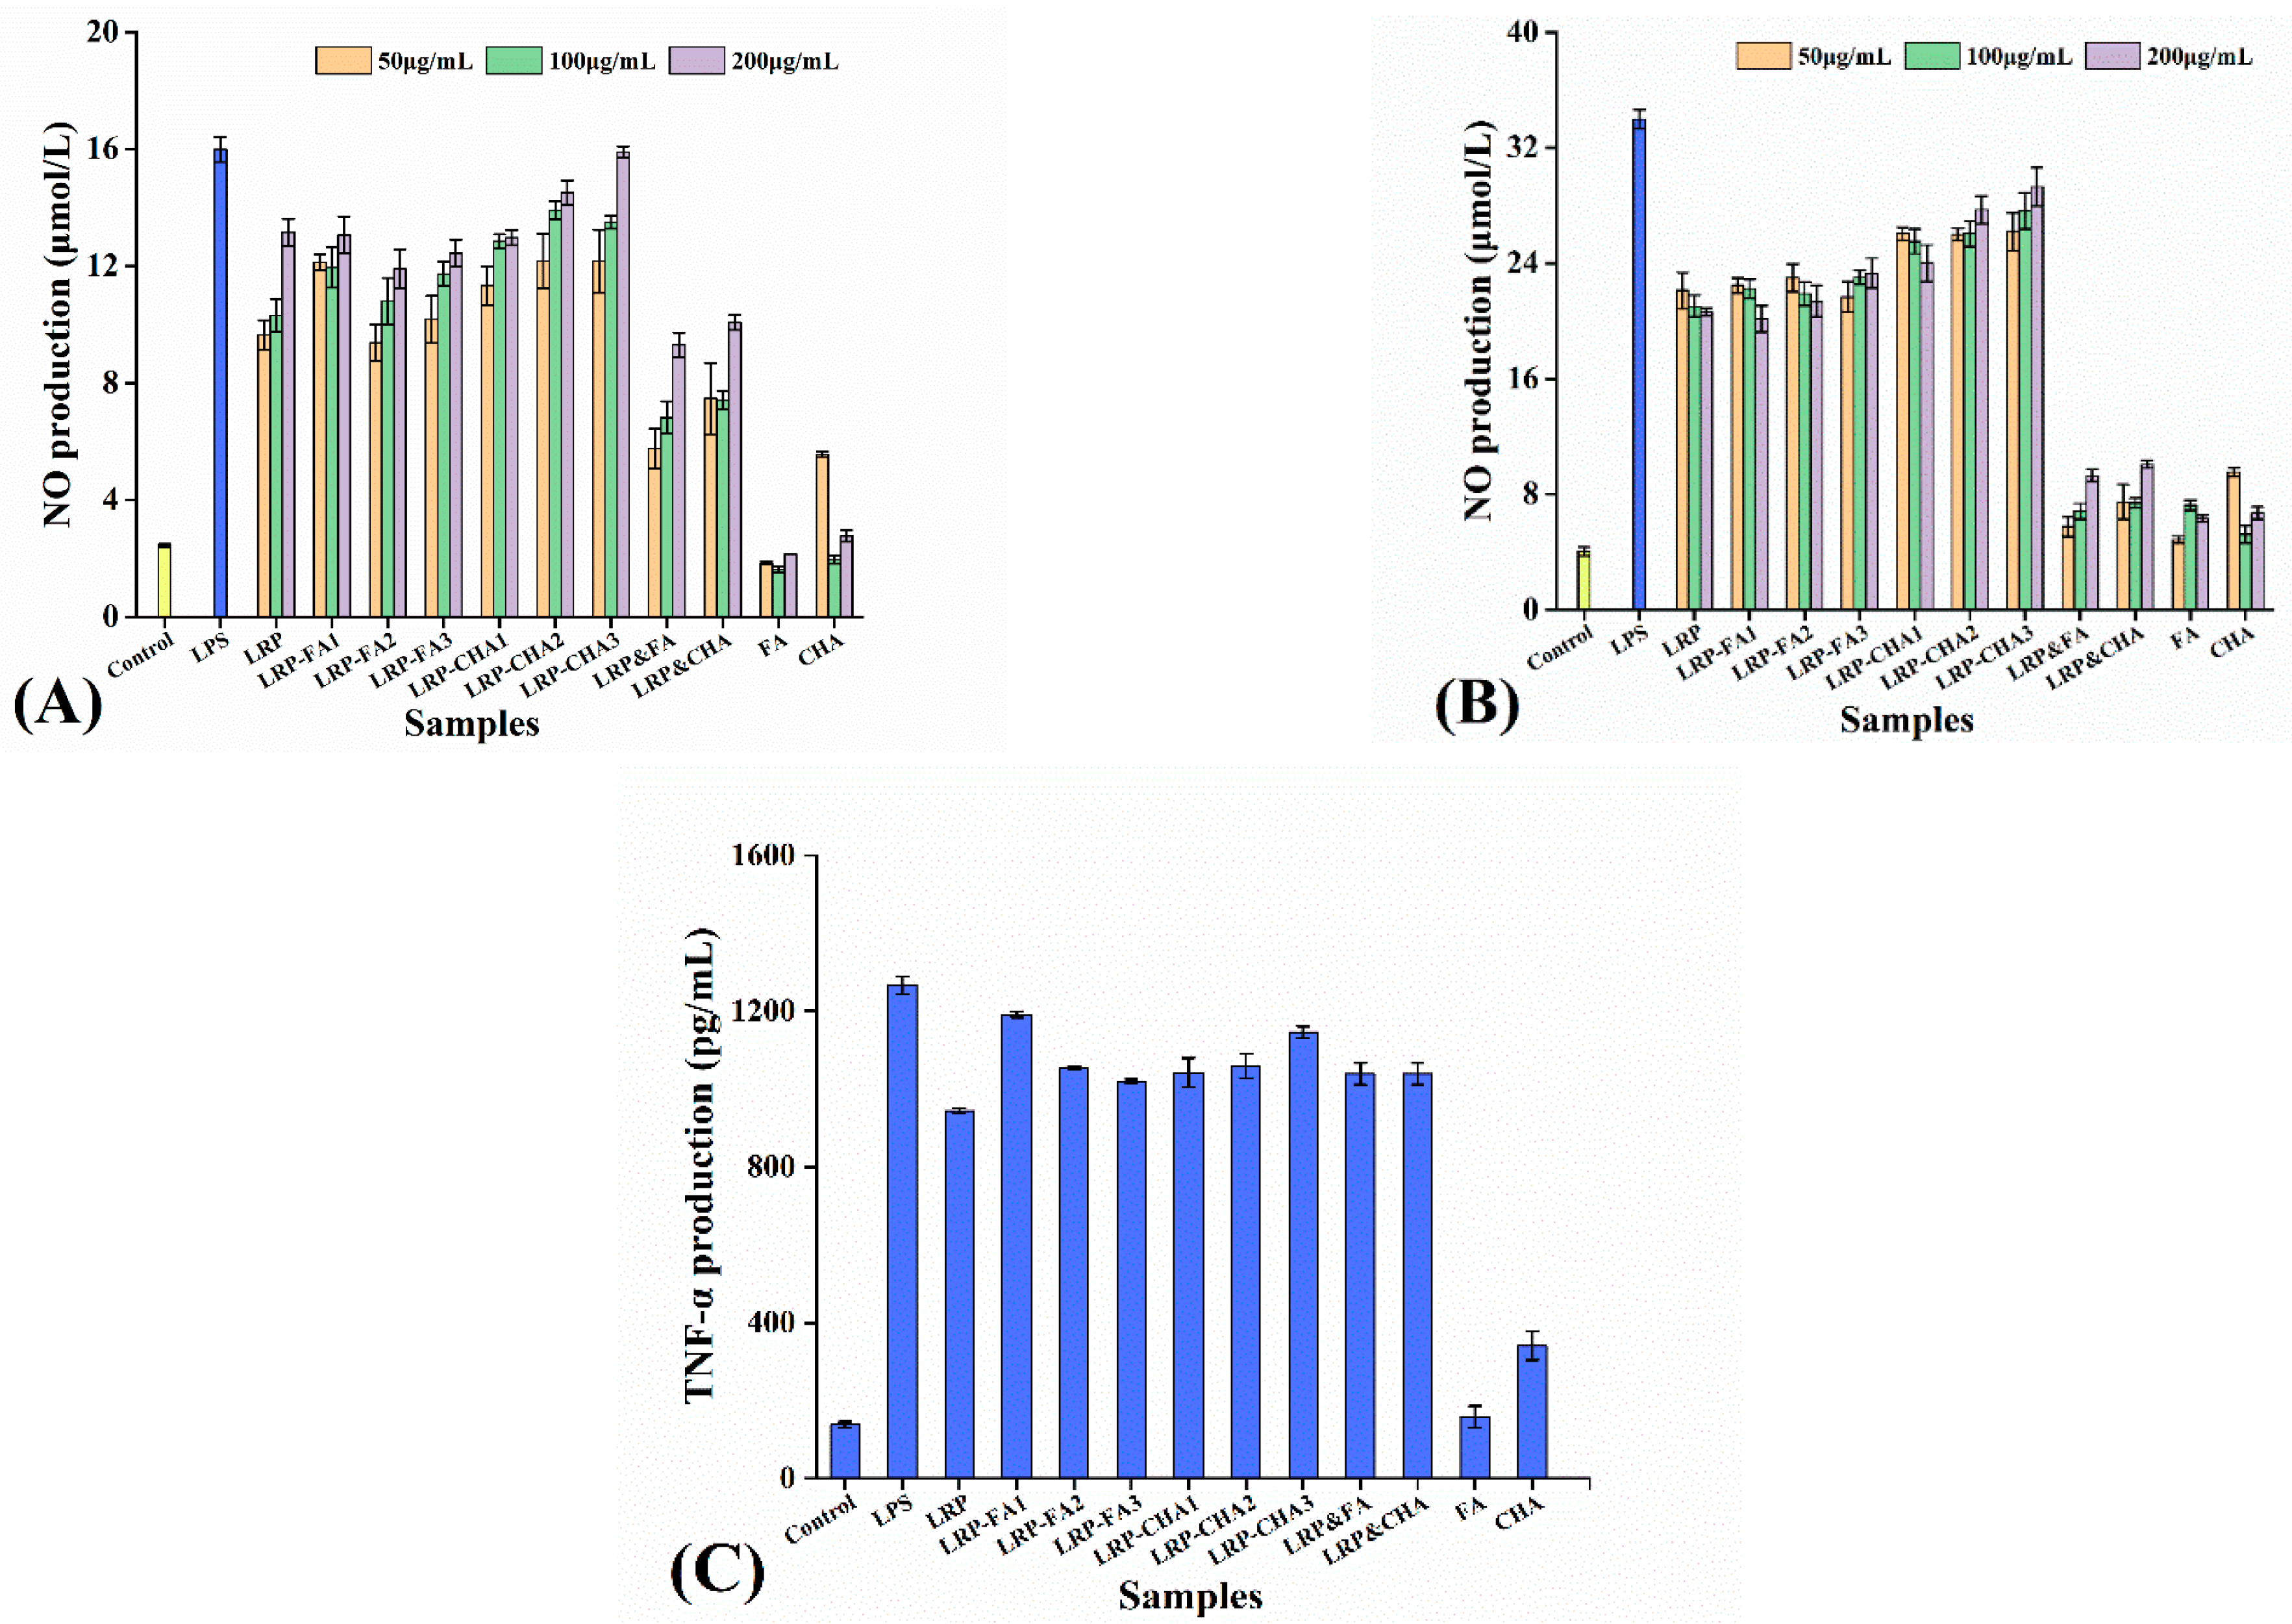
3.6. Macrophage-Stimulating Activity of LRP–Polyphenol Complexes
4. Conclusions
Supplementary Materials
Author Contributions
Funding
Data Availability Statement
Conflicts of Interest
References
- Zhu, F. Interactions between cell wall polysaccharides and polyphenols. Crit. Rev. Food Sci. Nutr. 2018, 58, 1808–1831. [Google Scholar] [CrossRef]
- Kojima, H.; Akaki, J.; Nakajima, S.; Kamei, K.; Tamesada, M. Structural analysis of glycogen-like polysaccharides having macrophage-activating activity in extracts of Lentinula edodes mycelia. J. Nat. Med. 2010, 64, 16–23. [Google Scholar] [CrossRef]
- Yan, Y.Y.; Yuan, S.; Zhao, S.; Xu, C.Y.; Zhang, X.F. Preparation and application of phosphorylated Lotus root polysaccharide. Food Sci. Technol. 2021, 42. [Google Scholar] [CrossRef]
- Li, D.; Rui, Y.X.; Guo, S.D.; Luan, F.; Liu, R.; Zeng, N. Ferulic acid: A review of its pharmacology, pharmacokinetics and derivatives. Life Sci. 2021, 284, 119921. [Google Scholar] [CrossRef] [PubMed]
- Mattila, P.; Hellström, J. Phenolic acids in potatoes, vegetables, and some of their products. J. Food Compos. Anal. 2007, 20, 152–160. [Google Scholar] [CrossRef]
- Renard, C.M.; Watrelot, A.A.; Le Bourvellec, C. Interactions between polyphenols and polysaccharides: Mechanisms and consequences in food processing and digestion. Trends Food Sci. Technol. 2017, 60, 43–51. [Google Scholar] [CrossRef]
- Padayachee, A.; Netzel, G.; Netzel, M.; Day, L.; Zabaras, D.; Mikkelsen, D.; Gidley, M.J. Binding of polyphenols to plant cell wall analogues—Part 2: Phenolic acids. Food Chem. 2012, 135, 2287–2292. [Google Scholar] [CrossRef]
- Le Bourvellec, C.; Le Quere, J.M.; Renard, C.M. Impact of noncovalent interactions between apple condensed tannins and cell walls on their transfer from fruit to juice: Studies in model suspensions and application. J. Agric. Food Chem. 2007, 55, 7896–7904. [Google Scholar] [CrossRef]
- Troszyńska, A.; Narolewska, O.; Robredo, S.; Estrella, I.; Hernández, T.; Lamparski, G.; Amarowicz, R. The effect of polysaccharides on the astringency induced by phenolic compounds. Food Qual. Prefer. 2010, 21, 463–469. [Google Scholar] [CrossRef]
- Liu, J.; Chen, F.; Tian, W.; Ma, Y.; Li, J.; Zhao, G. Optimization and characterization of curcumin loaded in octenylsuccinate oat beta-glucan micelles with an emphasis on degree of substitution and molecular weight. J. Agric. Food Chem. 2014, 62, 7532–7540. [Google Scholar] [CrossRef]
- Wu, M.; Zong, Y.; Zhao, B.; Zhu, H. Development status, problems and development ideas of aquatic vegetables industry in China. J. Changjiang Veg. 2019, 2, 35–41. [Google Scholar]
- Yi, Y.; Sun, J.; Xie, J.; Min, T.; Wang, L.M.; Wang, H.X. Phenolic Profiles and Antioxidant Activity of Lotus Root Varieties. Molecules 2016, 21, 863. [Google Scholar] [CrossRef] [PubMed] [Green Version]
- Hu, W.; Jiang, Y.; Xue, Q.; Sun, F.; Zhang, J.; Zhou, J.; Niu, Z.; Li, Q.; Li, F.; Shen, T. Structural characterisation and immunomodulatory activity of a polysaccharide isolated from lotus (Nelumbo nucifera Gaertn.) root residues. J. Funct. Foods 2019, 60, 103457. [Google Scholar] [CrossRef]
- Yi, Y.; Lamikanra, O.; Sun, J.; Wang, L.M.; Min, T.; Wang, H.X. Activity diversity structure-activity relationship of polysaccharides from lotus root varieties. Carbohydr. Polym. 2018, 190, 67–76. [Google Scholar] [CrossRef] [PubMed]
- Yi, Y.; Tang, H.S.; Sun, Y.; Xu, W.; Min, T.; Wang, H.X. Comprehensive characterization of lotus root polysaccharide-phenol complexes. Food Chem. 2022, 366, 130693. [Google Scholar] [CrossRef]
- Liu, X.; Bourvellec, C.L.; Renard, C. Interactions between cell wall polysaccharides and polyphenols: Effect of molecular internal structure. Compr. Rev. Food Sci. Food Saf. 2020, 19, 3574–3617. [Google Scholar] [CrossRef]
- DuBois, M.; Gilles, K.A.; Hamilton, J.K.; Rebers, P.T.; Smith, F. Colorimetric Method for Determination of Sugars and Related Substances. Anal. Chem. 1956, 28, 350–356. [Google Scholar] [CrossRef]
- Bermúdez-Oria, A.; Rodríguez-Gutiérrez, G.; Fernández-Prior, Á.; Knicker, H.; Fernández-Bolaños, J. Confirmation by solid-state NMR spectroscopy of a strong complex phenol-dietary fiber with retention of antioxidant activity in vitro. Food Hydrocoll. 2020, 102, 105584. [Google Scholar] [CrossRef]
- Yi, Y.; Huang, X.Y.; Zhong, Z.T.; Huang, F.; Li, S.Y.; Wang, L.M.; Min, T.; Wang, H.X. Structural and biological properties of polysaccharides from lotus root. Int. J. Biol. Macromol. 2019, 130, 454–461. [Google Scholar] [CrossRef]
- Han, M.M.; Yi, Y.; Wang, H.X.; Huang, F. Investigation of the Maillard Reaction between Polysaccharides and Proteins from Longan Pulp and the Improvement in Activities. Molecules 2017, 22, 938. [Google Scholar] [CrossRef] [Green Version]
- Wang, H.X.; Yi, Y.; Sun, J.; Lamikanra, O.; Min, T. Fingerprint profiling of polysaccharides from different parts of lotus root varieties. RSC Adv. 2018, 8, 16574–16584. [Google Scholar] [CrossRef] [Green Version]
- Tang, H.R.; Covington, A.D.; Hancock, R.A. Structure-activity relationships in the hydrophobic interactions of polyphenols with cellulose and collagen. Biopolymers 2003, 70, 403–413. [Google Scholar] [CrossRef]
- Wu, Z.; Li, H.; Ming, J.; Zhao, G. Optimization of adsorption of tea polyphenols into oat β-glucan using response surface methodology. J. Agric. Food Chem. 2011, 59, 378–385. [Google Scholar] [CrossRef]
- Jakobek, L.; Matic, P. Non-covalent dietary fiber—Polyphenol interactions and their influence on polyphenol bioaccessibility. Trends Food Sci. Technol. 2019, 83, 235–247. [Google Scholar] [CrossRef]
- Zhang, D.; Zhu, J.; Ye, F.; Zhao, G. Non-covalent interaction between ferulic acid and arabinan-rich pectic polysaccharide from rapeseed meal. Int. J. Biol. Macromol. 2017, 103, 307–315. [Google Scholar] [CrossRef] [PubMed]
- Wang, L.; Li, F.; Yang, Y. Interaction mechanism between polyphenols and polysaccharides and effect on polyphenolic properties: A review. Food Sci. 2017, 38, 276–282. [Google Scholar]
- Zou, X.; Liu, Q.; Huang, F.; Xiao, J.; Yi, Y. Preparation and Characterization of Lotus Root Polysaccharide-Chlorogenic Acid Complex. Mod. Food Sci. Technol. 2023, 39, 1–11. [Google Scholar]
- Le Bourvellec, C.; Renard, C.M. Non-covalent interaction between procyanidins and apple cell wall material. Part II: Quantification and impact of cell wall drying. Biochim. Biophys. Acta 2005, 1725, 1–9. [Google Scholar] [CrossRef] [PubMed]
- Liu, J.; Wang, X.; Yong, H.; Kan, J.; Jin, C. Recent advances in flavonoid-grafted polysaccharides: Synthesis, structural characterization, bioactivities and potential applications. Int. J. Biol. Macromol. 2018, 116, 1011–1025. [Google Scholar] [CrossRef]
- Li, S.; Li, J.; Zhu, Z.; Cheng, S.; He, J.; Lamikanra, O. Soluble dietary fiber and polyphenol complex in lotus root: Preparation, interaction and identification. Food Chem. 2020, 314, 126219. [Google Scholar] [CrossRef]
- Yi, Y.; Zhang, M.W.; Liao, S.T.; Zhang, R.F.; Deng, Y.Y.; Wei, Z.C.; Tang, X.J.; Zhang, Y. Structural features and immunomodulatory activities of polysaccharides of longan pulp. Carbohydr. Polym. 2012, 87, 636–643. [Google Scholar] [CrossRef]
- Wu, Y.; Lin, Q.; Chen, Z.; Xiao, H. The interaction between tea polyphenols and rice starch during gelatinization. Food Sci Technol. Int. 2011, 17, 569–577. [Google Scholar] [CrossRef] [Green Version]
- Singh, A.; Dutta, P.K.; Kumar, H.; Kureel, A.K.; Rai, A.K. Improved antibacterial and antioxidant activities of gallic acid grafted chitin-glucan complex. J. Polym. Res. 2019, 26, 1–11. [Google Scholar] [CrossRef]
- Zhou, P.; Feng, R.; Luo, Z.; Li, X.; Wang, L.; Gao, L. Synthesis, identification and bioavailability of Juglans regia L. polyphenols-Hohenbuehelia serotina polysaccharides nanoparticles. Food Chem. 2020, 329, 127158. [Google Scholar] [CrossRef] [PubMed]
- Corrêa, R.C.; Haminiuk, C.W.; Barros, L.; Dias, M.I.; Calhelha, R.C.; Kato, C.G.; Correa, V.G.; Peralta, R.M.; Ferreira, I.C. Stability and biological activity of Merlot (Vitis vinifera) grape pomace phytochemicals after simulated in vitro gastrointestinal digestion and colonic fermentation. J. Funct. Foods 2017, 36, 410–417. [Google Scholar] [CrossRef] [Green Version]
- Aytekin, A.O.; Morimura, S.; Kida, K. Synthesis of chitosan–caffeic acid derivatives and evaluation of their antioxidant activities. J. Biosci. Bioeng. 2011, 111, 212–216. [Google Scholar] [CrossRef] [PubMed]
- Guo, Z.; Xing, R.; Liu, S.; Yu, H.; Wang, P.; Li, C.; Li, P. The synthesis and antioxidant activity of the Schiff bases of chitosan and carboxymethyl chitosan. Bioorg. Med. Chem. Lett. 2005, 15, 4600–4603. [Google Scholar] [CrossRef]
- Wang, X.; Hunter, D.; Xu, J.; Ding, C. Metabolic triggered inflammation in osteoarthritis. Osteoarthr. Cartil. 2011, 41, 90–91. [Google Scholar] [CrossRef] [Green Version]
- Gong, W.; Han, R.; Li, H.; Song, J.; Yan, H.; Li, G.; Liu, A.; Cao, X.; Guo, J.; Zhai, S.; et al. Agronomic Traits and Molecular Marker Identification of Wheat-Aegilops caudata Addition Lines. Front. Plant Sci. 2017, 8, 1743. [Google Scholar] [CrossRef] [Green Version]
- Meng, Q.; Wang, Y.; Chen, F.; Xiao, T.; Zhang, L. Polysaccharides from Diaphragma juglandis fructus: Extraction optimization, antitumor, and immune-enhancement effects. Int. J. Biol. Macromol. 2018, 115, 835–845. [Google Scholar] [CrossRef]
- Wang, K.; Zhang, J.; Ping, S.; Ma, Q.; Chen, X.; Xuan, H.; Shi, J.; Zhang, C.; Hu, F. Anti-inflammatory effects of ethanol extracts of Chinese propolis and buds from poplar (Populus × canadensis). J. Ethnopharmacol. 2014, 155, 300–311. [Google Scholar] [CrossRef] [PubMed]


| Complexes | Preparation Conditions | Polyphenol Binding Amount (mg/g LRP) | ||
|---|---|---|---|---|
| Temperature (°C) | pH | Mass Ratio of LRP to Polyphenol | ||
| LRP-FA1 | 0 | 6 | 2:1 | 121.57 |
| LRP-FA2 | 15 | 5 | 2:1 | 61.18 |
| LRP-FA3 | 30 | 5 | 2:1 | 34.79 |
| LRP-CHA1 | 15 | 5 | 1:4 | 2359.58 |
| LRP-CHA2 | 15 | 5 | 1:2 | 1276.71 |
| LRP-CHA3 | 15 | 6 | 1:1 | 545.08 |
| Samples | Retention Time (min) | Molecular Weight (Da) | Peak Area Percentage (%) | Average Molecular Weight (Da) |
|---|---|---|---|---|
| LRP | 7.297–9.107 | 1.144 × 10⁶ (±0.791%) | 8.4 | 1.463 × 10⁵ |
| 9.077–11.490 | 1.359 × 10⁵ (±1.050%) | 33.1 | ||
| 11.490–12.184 | 2.628 × 10⁴ (±4.650%) | 6.3 | ||
| 12.184–13.934 | 9.036 × 10³ (±3.661%) | 20.6 | ||
| 13.934–14.718 | 3.695 × 10³ (±5.083%) | 12.7 | ||
| 14.748–18.398 | 6.798 × 10³ (±4.744%) | 18.3 | ||
| 21.868–24.402 | 2.494 × 10³ (±51.551%) | 0.9 | ||
| LRP-FA1 | 7.026–8.926 | 1.465 × 10⁶ (±0.723%) | 13.5 | 2.978 × 10⁵ |
| 8.926–11.400 | 1.730 × 10⁵ (±0.858%) | 50.3 | ||
| 11.400–12.637 | 2.898 × 10⁴ (±4.228%) | 19.5 | ||
| 12.637–13.994 | 4.509 × 10⁴ (±4.033%) | 7.5 | ||
| 13.994–15.291 | 3.066 × 10⁴ (±3.972%) | 7.2 | ||
| 15.291–15.985 | 7.438 × 10⁴ (±4.292%) | 1.2 | ||
| 17.373–19.002 | 1.283 × 10⁵ (±3.532%) | 0.7 | ||
| LRP-FA2 | 7.237–8.896 | 1.603 × 10⁶ (±0.721%) | 13.1 | 3.102 × 10⁵ |
| 8.896–11.340 | 1.820 × 10⁵ (±0.824%) | 48.7 | ||
| 11.340–12.516 | 2.681 × 10⁴ (±3.786%) | 19.3 | ||
| 12.516–13.873 | 3.354 × 10⁴ (±4.439%) | 8.8 | ||
| 13.873–15.261 | 2.407 × 10⁴ (±3.966%) | 8.1 | ||
| 15.261–16.076 | 5.990 × 10⁴ (±3.650%) | 1.4 | ||
| 17.312–18.821 | 1.179 × 10⁵ (±4.124%) | 0.6 | ||
| LRP-FA3 | 7.297–8.926 | 1.627 × 10⁶ (±0.688%) | 13.1 | 3.321 × 10⁵ |
| 8.926–11.309 | 1.894 × 10⁵ (±0.735%) | 48.7 | ||
| 11.309–12.516 | 2.956 × 10⁴ (±2.849%) | 19.3 | ||
| 12.516–13.904 | 3.674 × 10⁴(±2.926%) | 8.8 | ||
| 13.904–15.261 | 2.723 × 10⁴ (±2.523%) | 8.1 | ||
| 15.261–16.226 | 7.541 × 10⁴ (±2.588%) | 1.4 | ||
| 17.343–18.549 | 2.141 × 10⁵ (±2.951%) | 0.6 | ||
| LRP-CHA1 | 7.207–8.956 | 1.157 × 10⁶ (±0.660%) | 7.8 | 1.621 × 10⁵ |
| 8.956–11.370 | 1.365 × 10⁵ (±0.960%) | 47.2 | ||
| 11.400–12.576 | 1.840 × 10⁴ (±5.402%) | 19.8 | ||
| 12.576–13.934 | 2.211 × 10⁴ (±5.505%) | 8.2 | ||
| 13.934–15.020 | 1.253 × 10⁴ (±5.063%) | 7.5 | ||
| 15.020–16.317 | 1.676 × 10⁴ (±4.756%) | 4.8 | ||
| 17.011–18.700 | 4.540 × 10³ (±23.036%) | 4.7 | ||
| LRP-CHA2 | 7.177–8.931 | 1.184 × 10⁶ (±0.671%) | 9.2 | 1.913 × 10⁵ |
| 8.931–11.392 | 1.424 × 10⁵ (±0.955%) | 52.4 | ||
| 11.392–12.561 | 2.015 × 10⁴ (±5.290%) | 20.8 | ||
| 12.561–13.953 | 2.674 × 10⁴ (±4.907%) | 7.8 | ||
| 13.953–15.485 | 1.875 × 10⁴ (±3.172%) | 7.0 | ||
| 16.837–18.773 | 7.451 × 10³ (±25.715%) | 2.8 | ||
| 7.177–8.931 | 1.184 × 10⁶ (±0.671%) | 9.2 | ||
| LRP-CHA3 | 7.237–8.866 | 1.545 × 10⁶ (±0.691%) | 9.4 | 2.433 × 10⁵ |
| 8.866–11.340 | 1.724 × 10⁵ (±0.791%) | 51.2 | ||
| 11.340–12.546 | 2.422 × 10⁴ (±4.184%) | 20.4 | ||
| 12.546–13.964 | 3.613 × 10⁴ (±4.401%) | 7.5 | ||
| 13.964–15.291 | 2.728 × 10⁴ (±3.526%) | 6.0 | ||
| 16.528–19.122 | 8.365 × 10³ (±22.813%) | 5.6 |
Disclaimer/Publisher’s Note: The statements, opinions and data contained in all publications are solely those of the individual author(s) and contributor(s) and not of MDPI and/or the editor(s). MDPI and/or the editor(s) disclaim responsibility for any injury to people or property resulting from any ideas, methods, instructions or products referred to in the content. |
© 2023 by the authors. Licensee MDPI, Basel, Switzerland. This article is an open access article distributed under the terms and conditions of the Creative Commons Attribution (CC BY) license (https://creativecommons.org/licenses/by/4.0/).
Share and Cite
Liu, Q.; Zou, X.; Yi, Y.; Sun, Y.; Wang, H.; Jiang, X.; Peng, K. Physicochemical and Functional Changes in Lotus Root Polysaccharide Associated with Noncovalent Binding of Polyphenols. Foods 2023, 12, 1049. https://doi.org/10.3390/foods12051049
Liu Q, Zou X, Yi Y, Sun Y, Wang H, Jiang X, Peng K. Physicochemical and Functional Changes in Lotus Root Polysaccharide Associated with Noncovalent Binding of Polyphenols. Foods. 2023; 12(5):1049. https://doi.org/10.3390/foods12051049
Chicago/Turabian StyleLiu, Qiulan, Xiaoqin Zou, Yang Yi, Ying Sun, Hongxun Wang, Xueyu Jiang, and Kaidi Peng. 2023. "Physicochemical and Functional Changes in Lotus Root Polysaccharide Associated with Noncovalent Binding of Polyphenols" Foods 12, no. 5: 1049. https://doi.org/10.3390/foods12051049