
Effect of Pasteurization by Moderate Intensity Pulsed Electric Fields (PEF) Treatment Compared to Thermal Treatment on Quality Attributes of Fresh Orange Juice

Abstract
:1. Introduction
2. Materials and Methods
2.1. The Juice Preparation
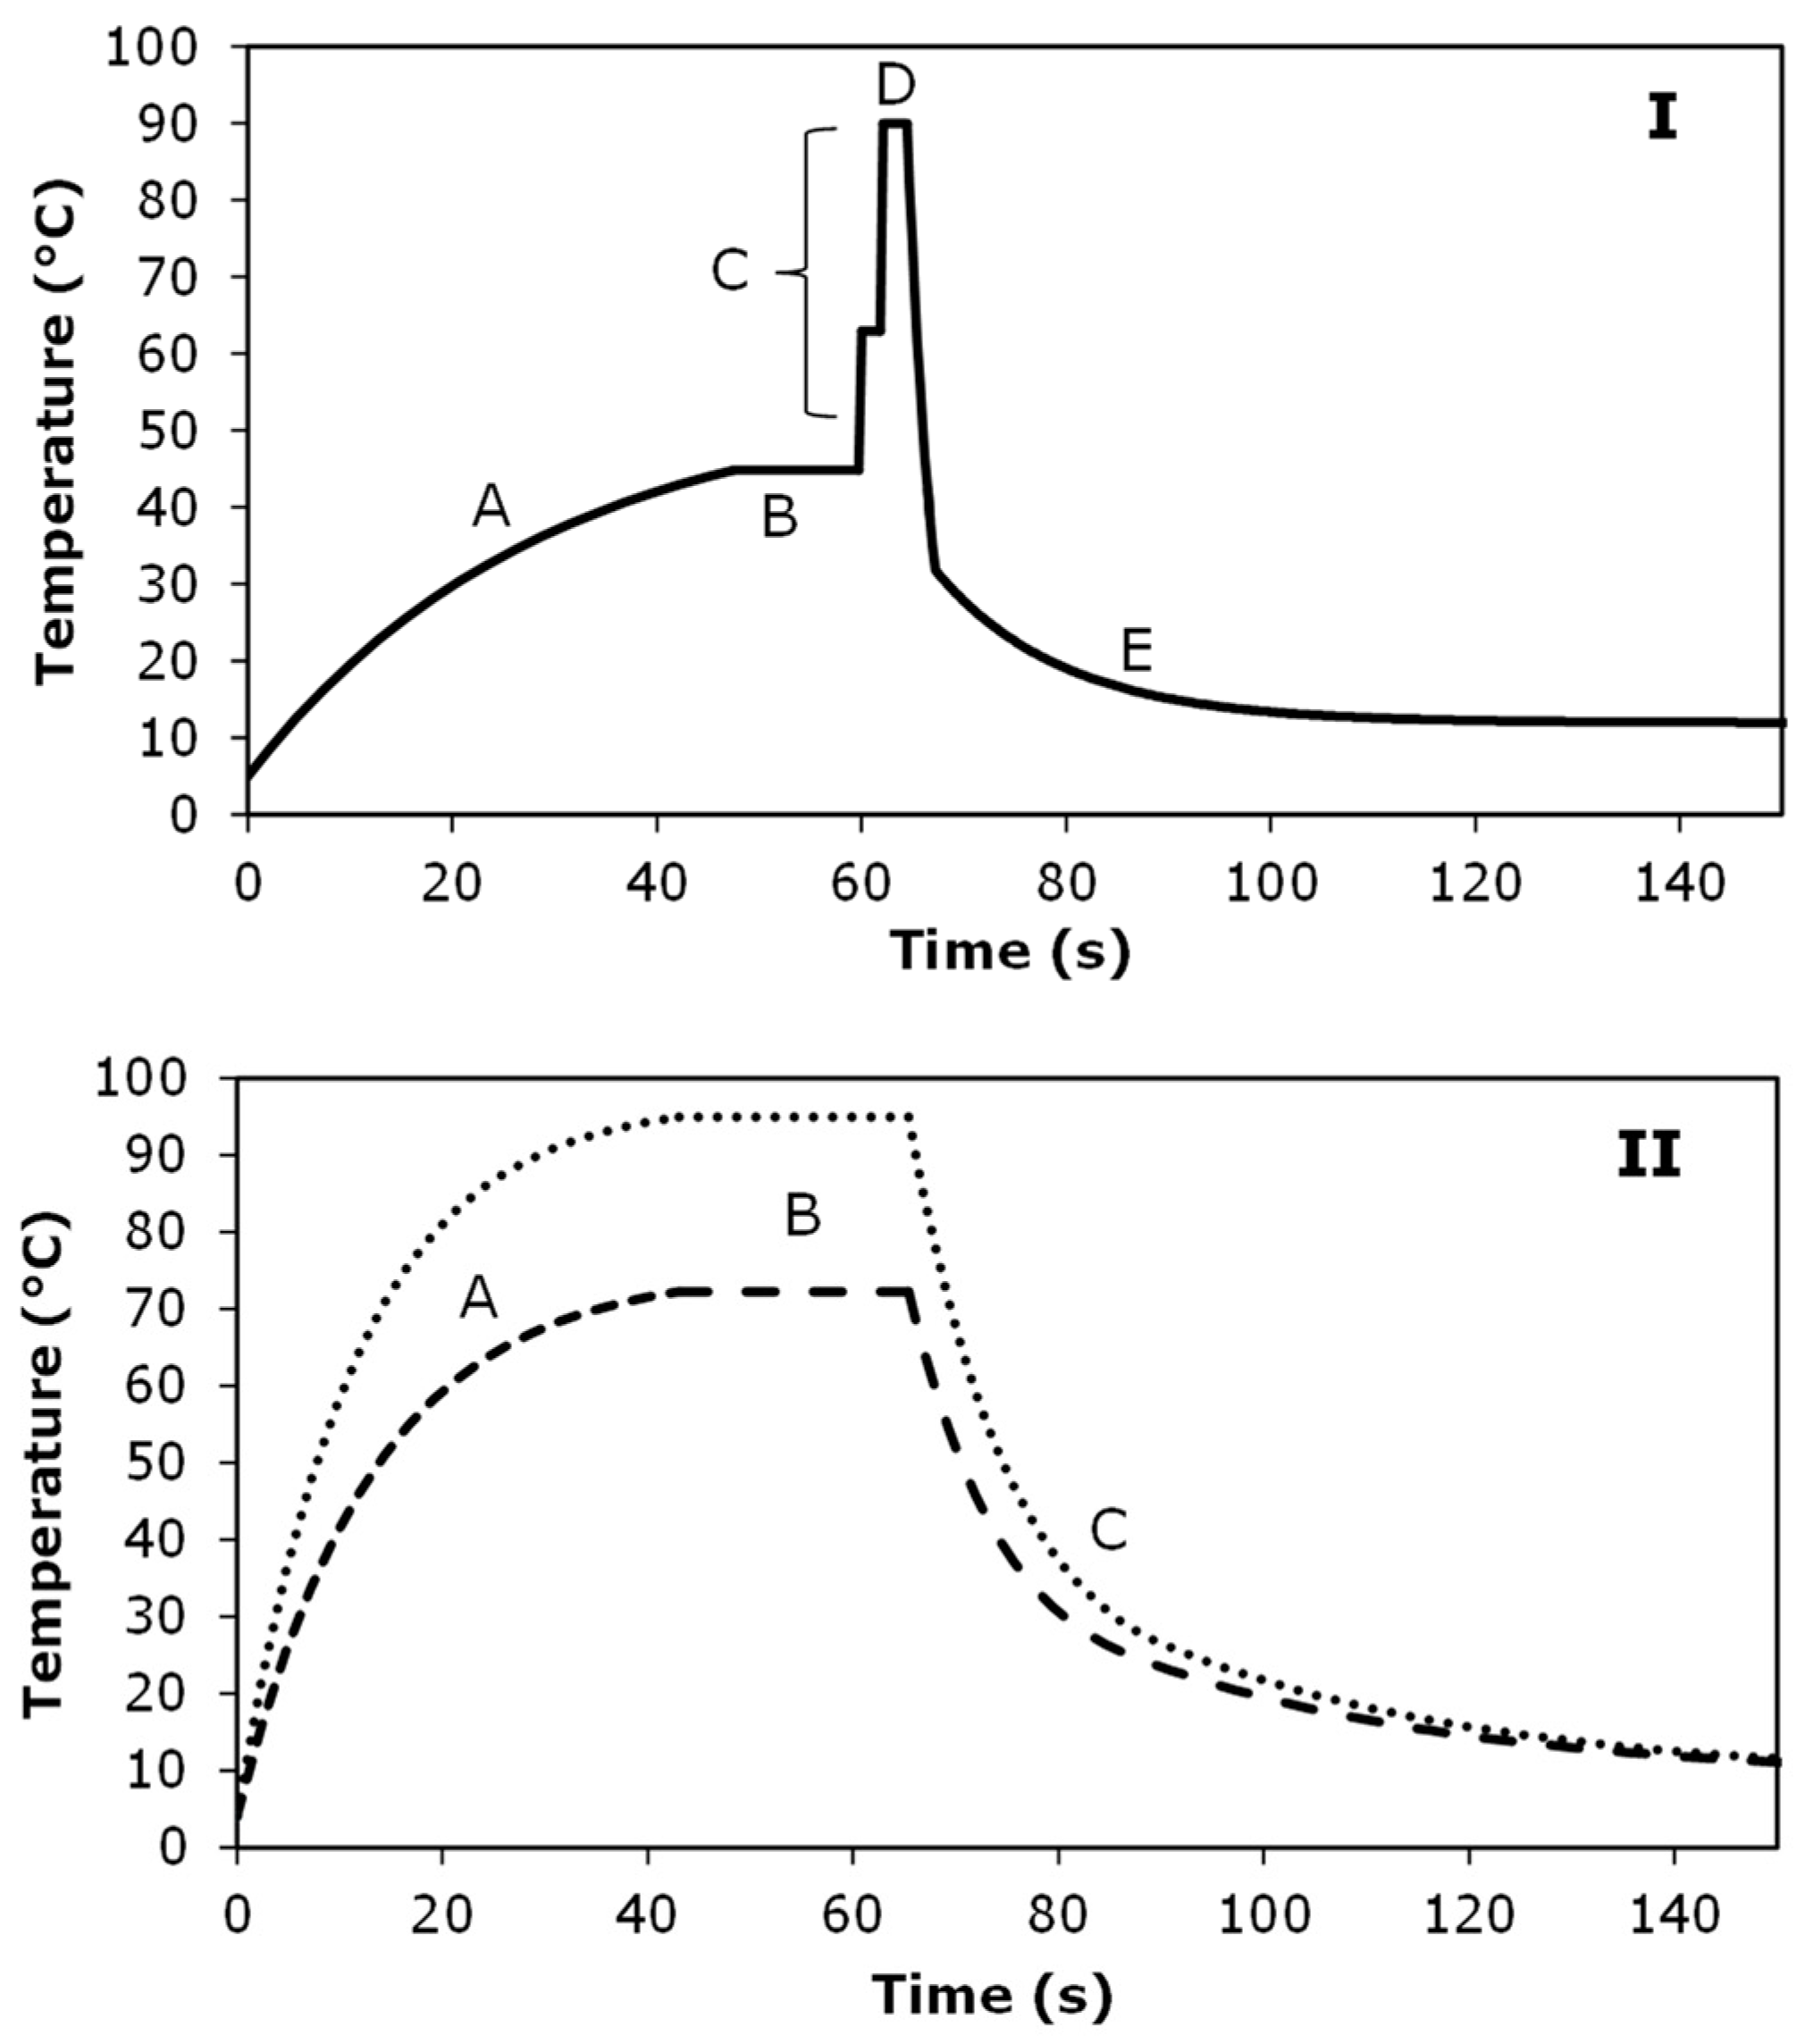
2.2. PEF Processing
2.3. Thermal Processing
2.4. Sampling and Storage of Samples
2.5. Dissolved Oxygen, Conductivity, pH and Soluble Solids
2.6. Color Measurements
2.7. Vitamin C Content
2.8. PME Activity
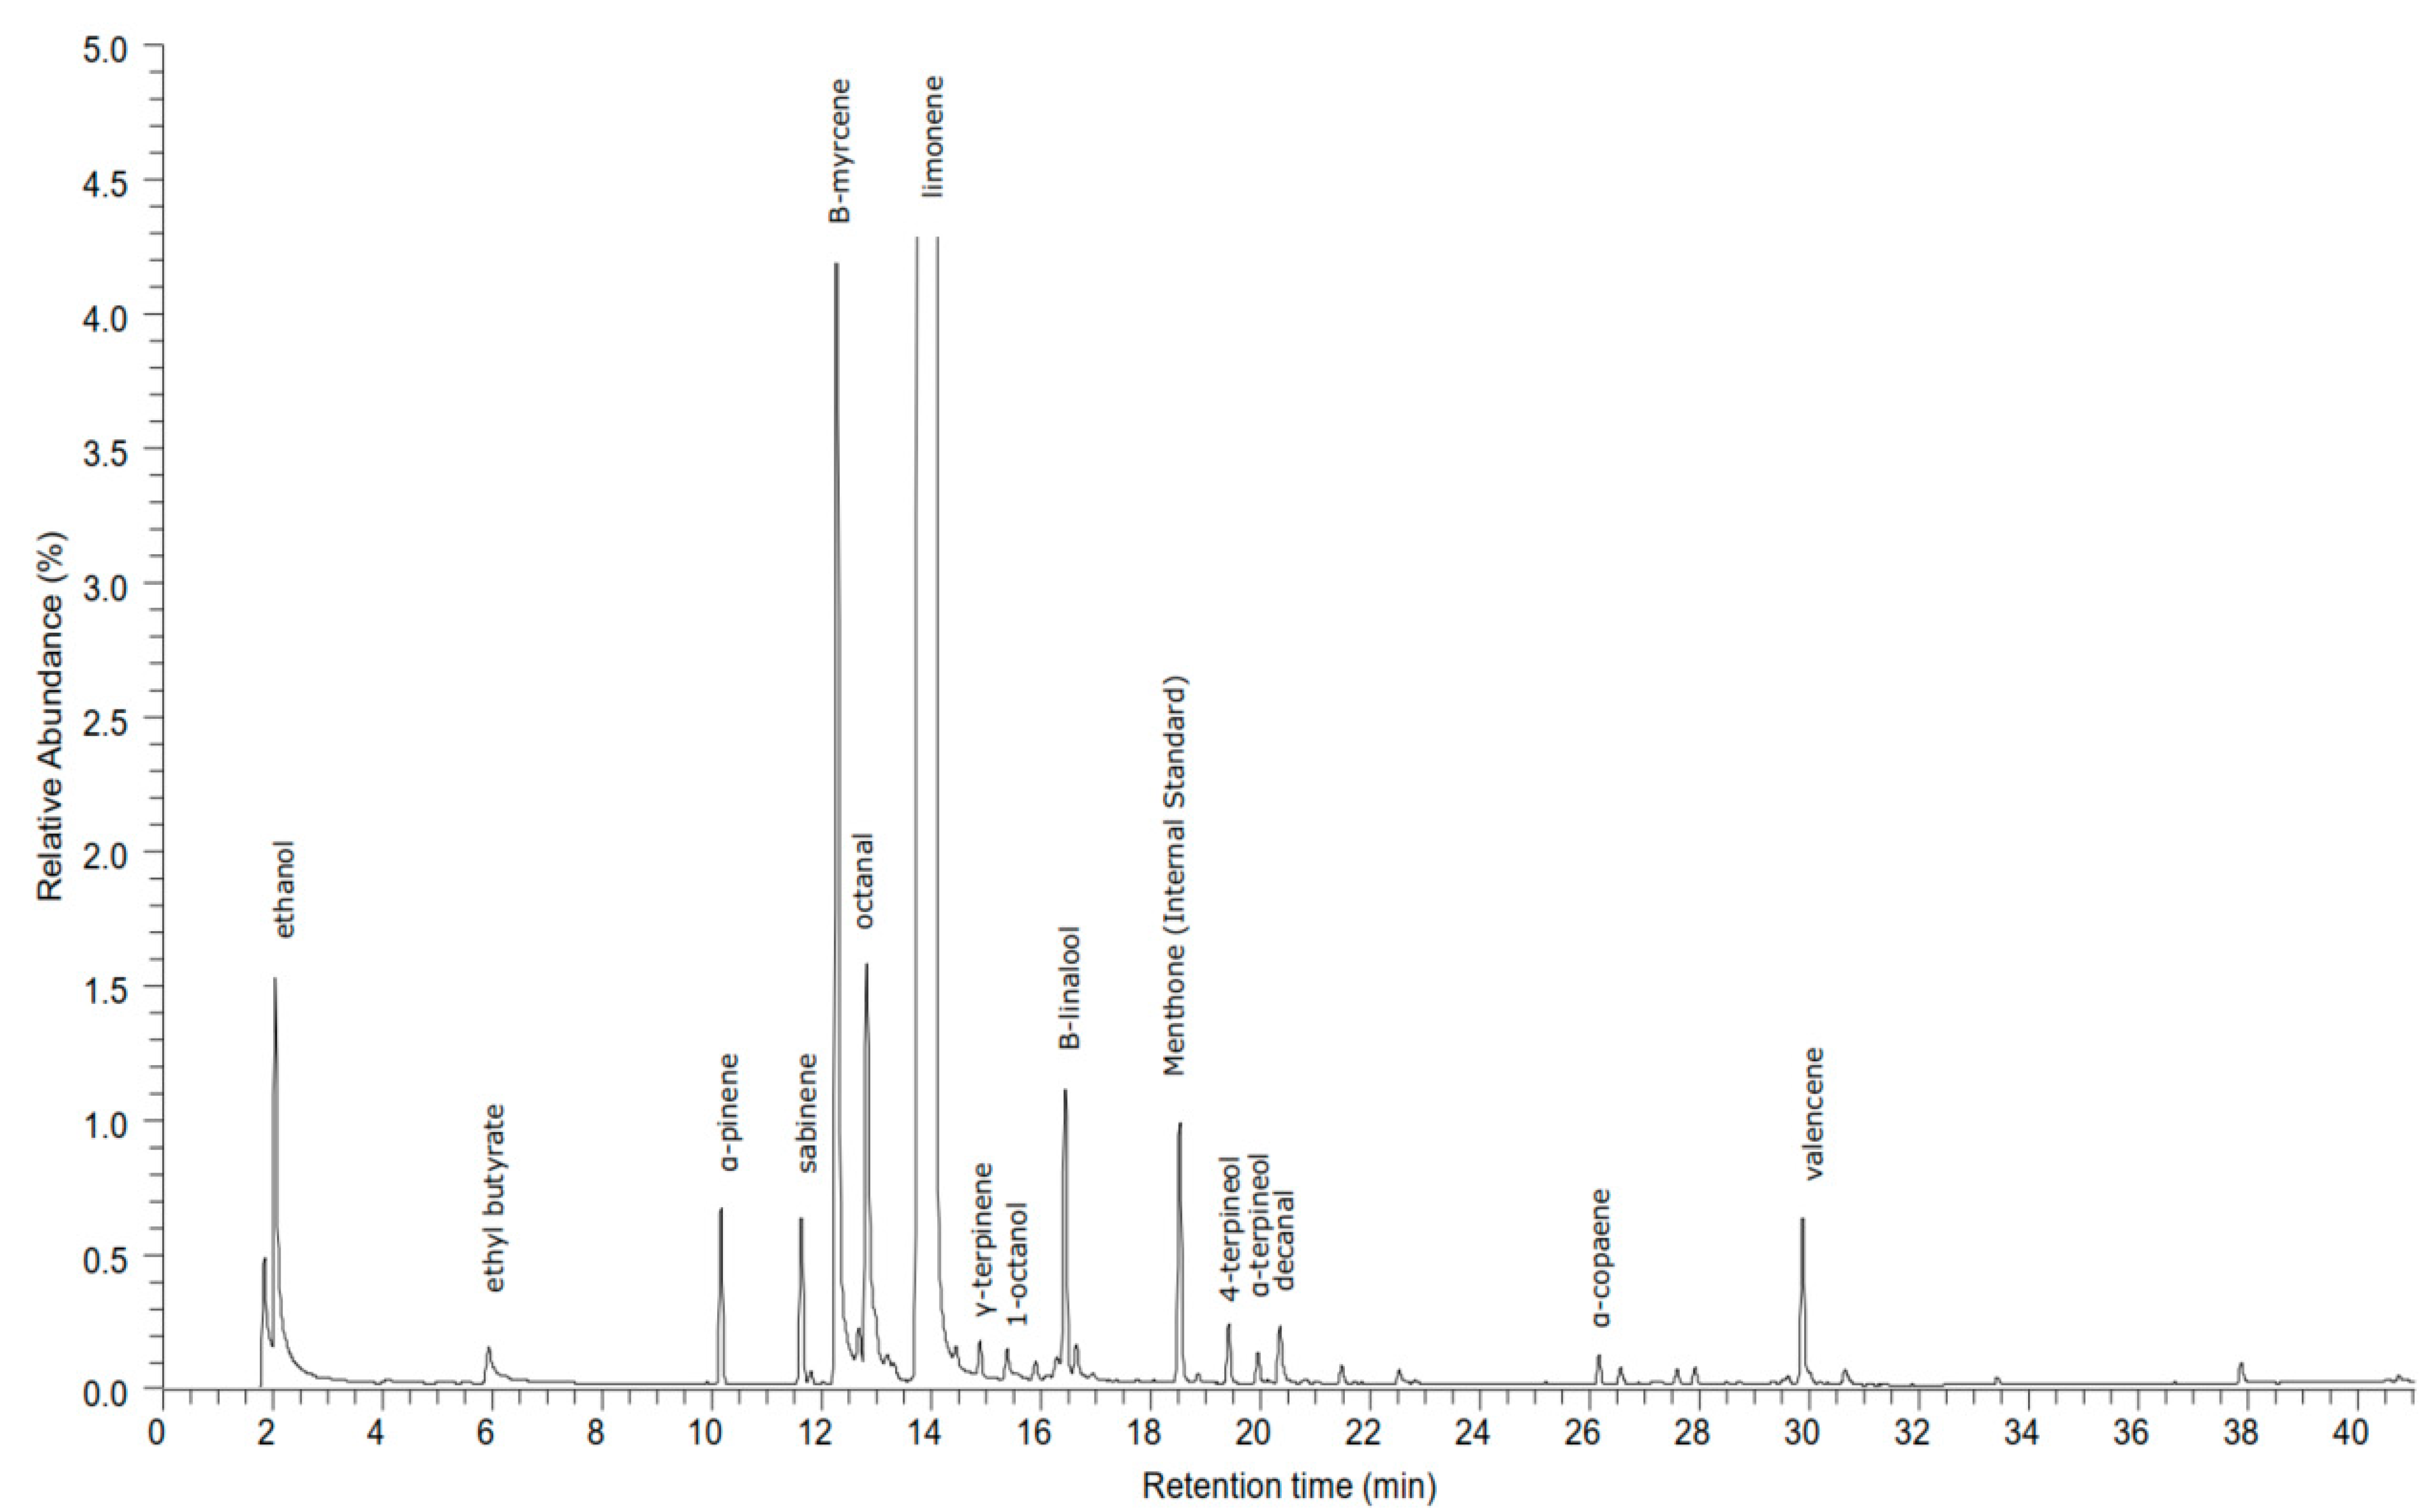
2.9. Volatiles
2.10. Data Acquisition and Statistical Analysis
3. Results
3.1. Dissolved Oxygen and Electrical Conductivity
3.2. pH and Soluble Solids
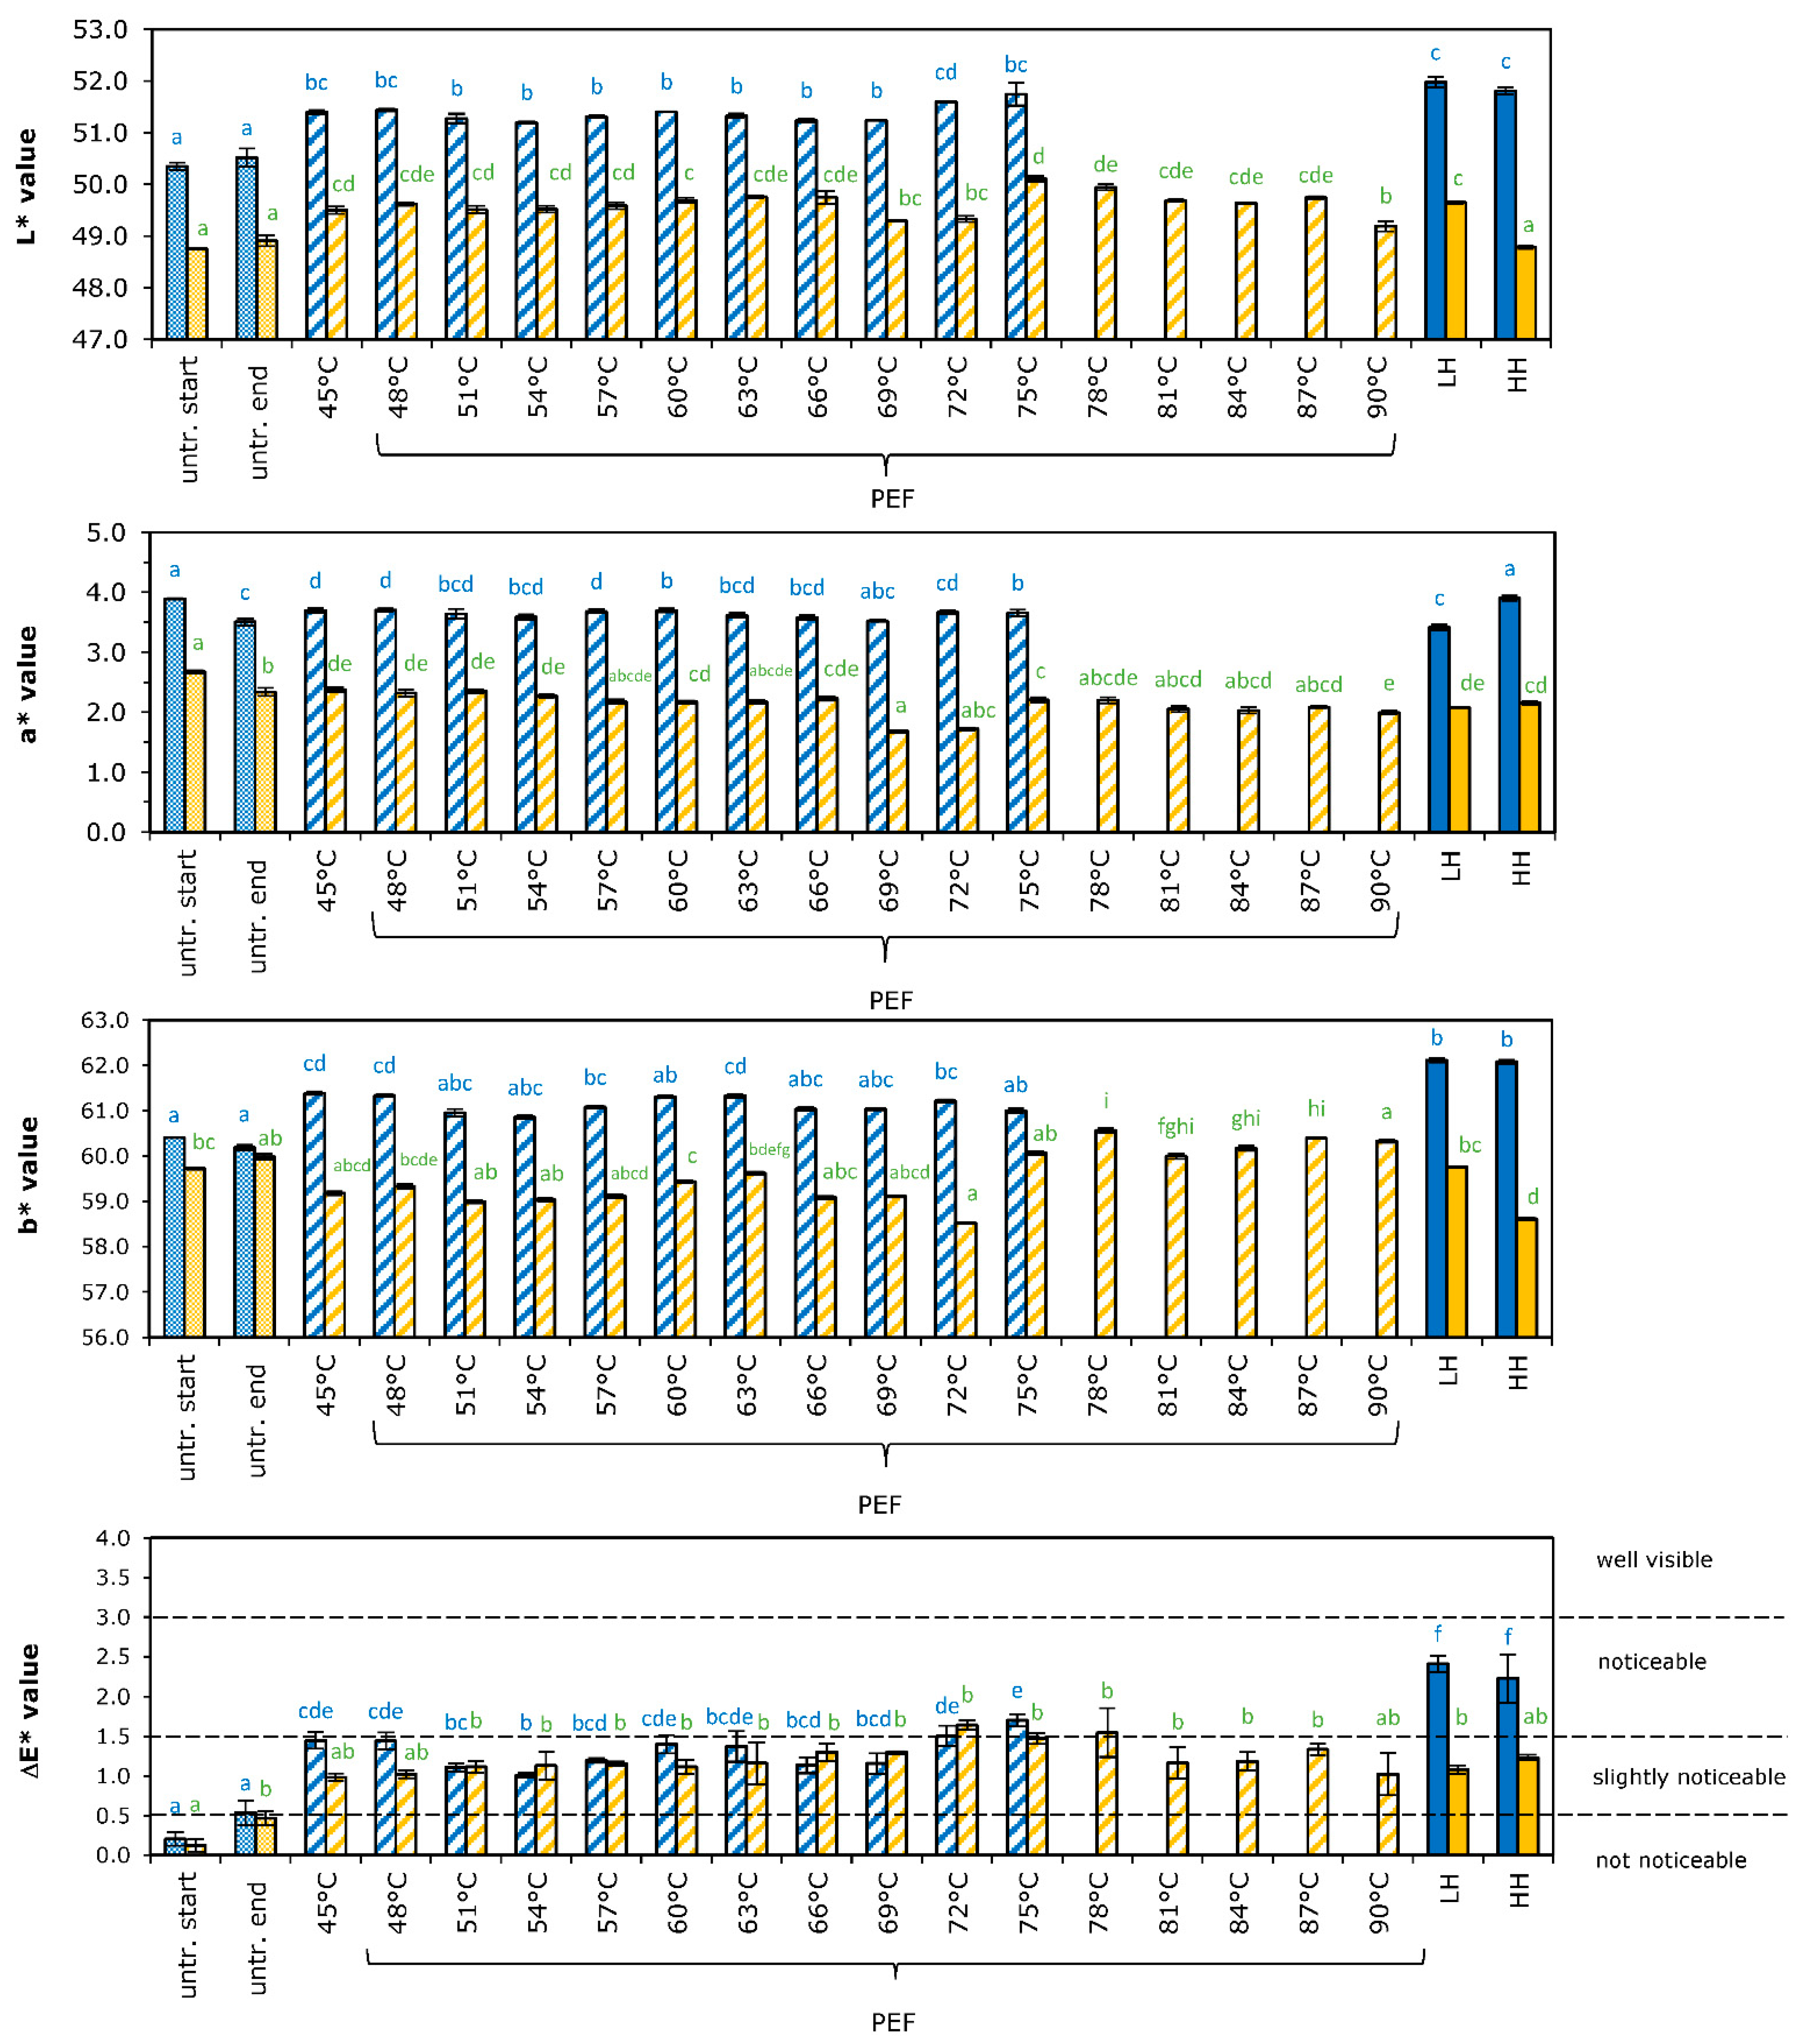
3.3. Color
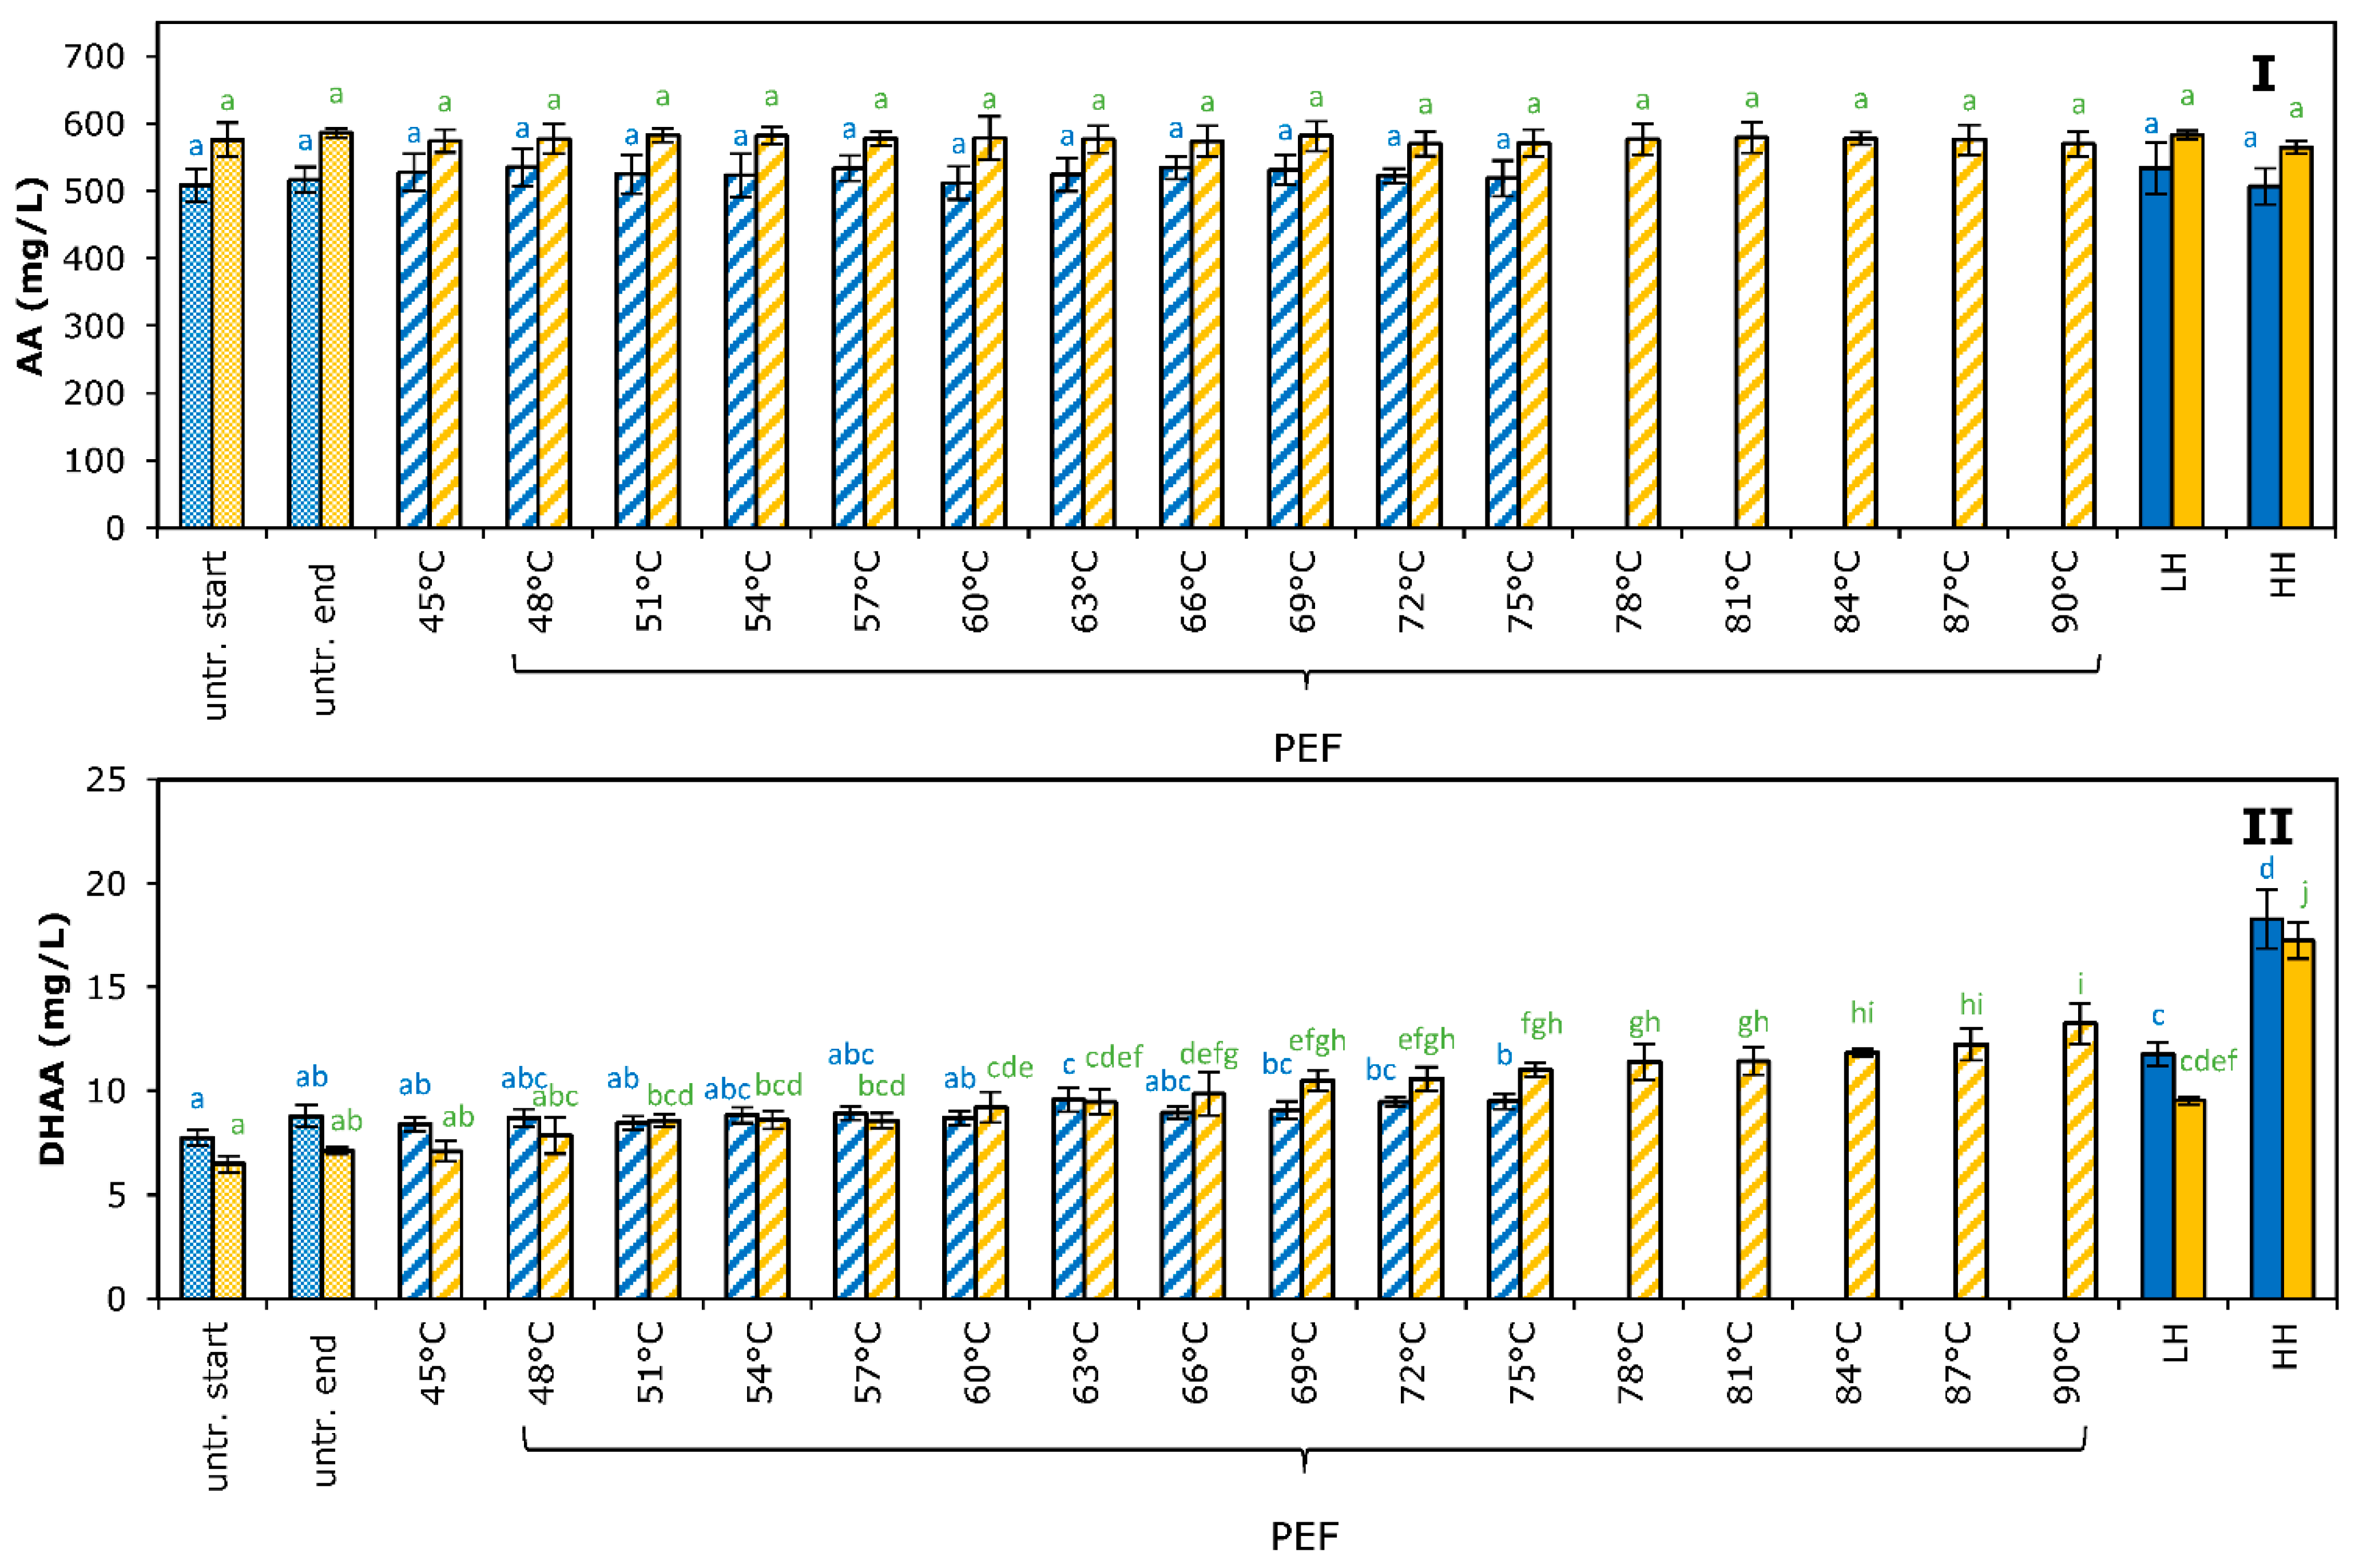
3.4. Vitamin C
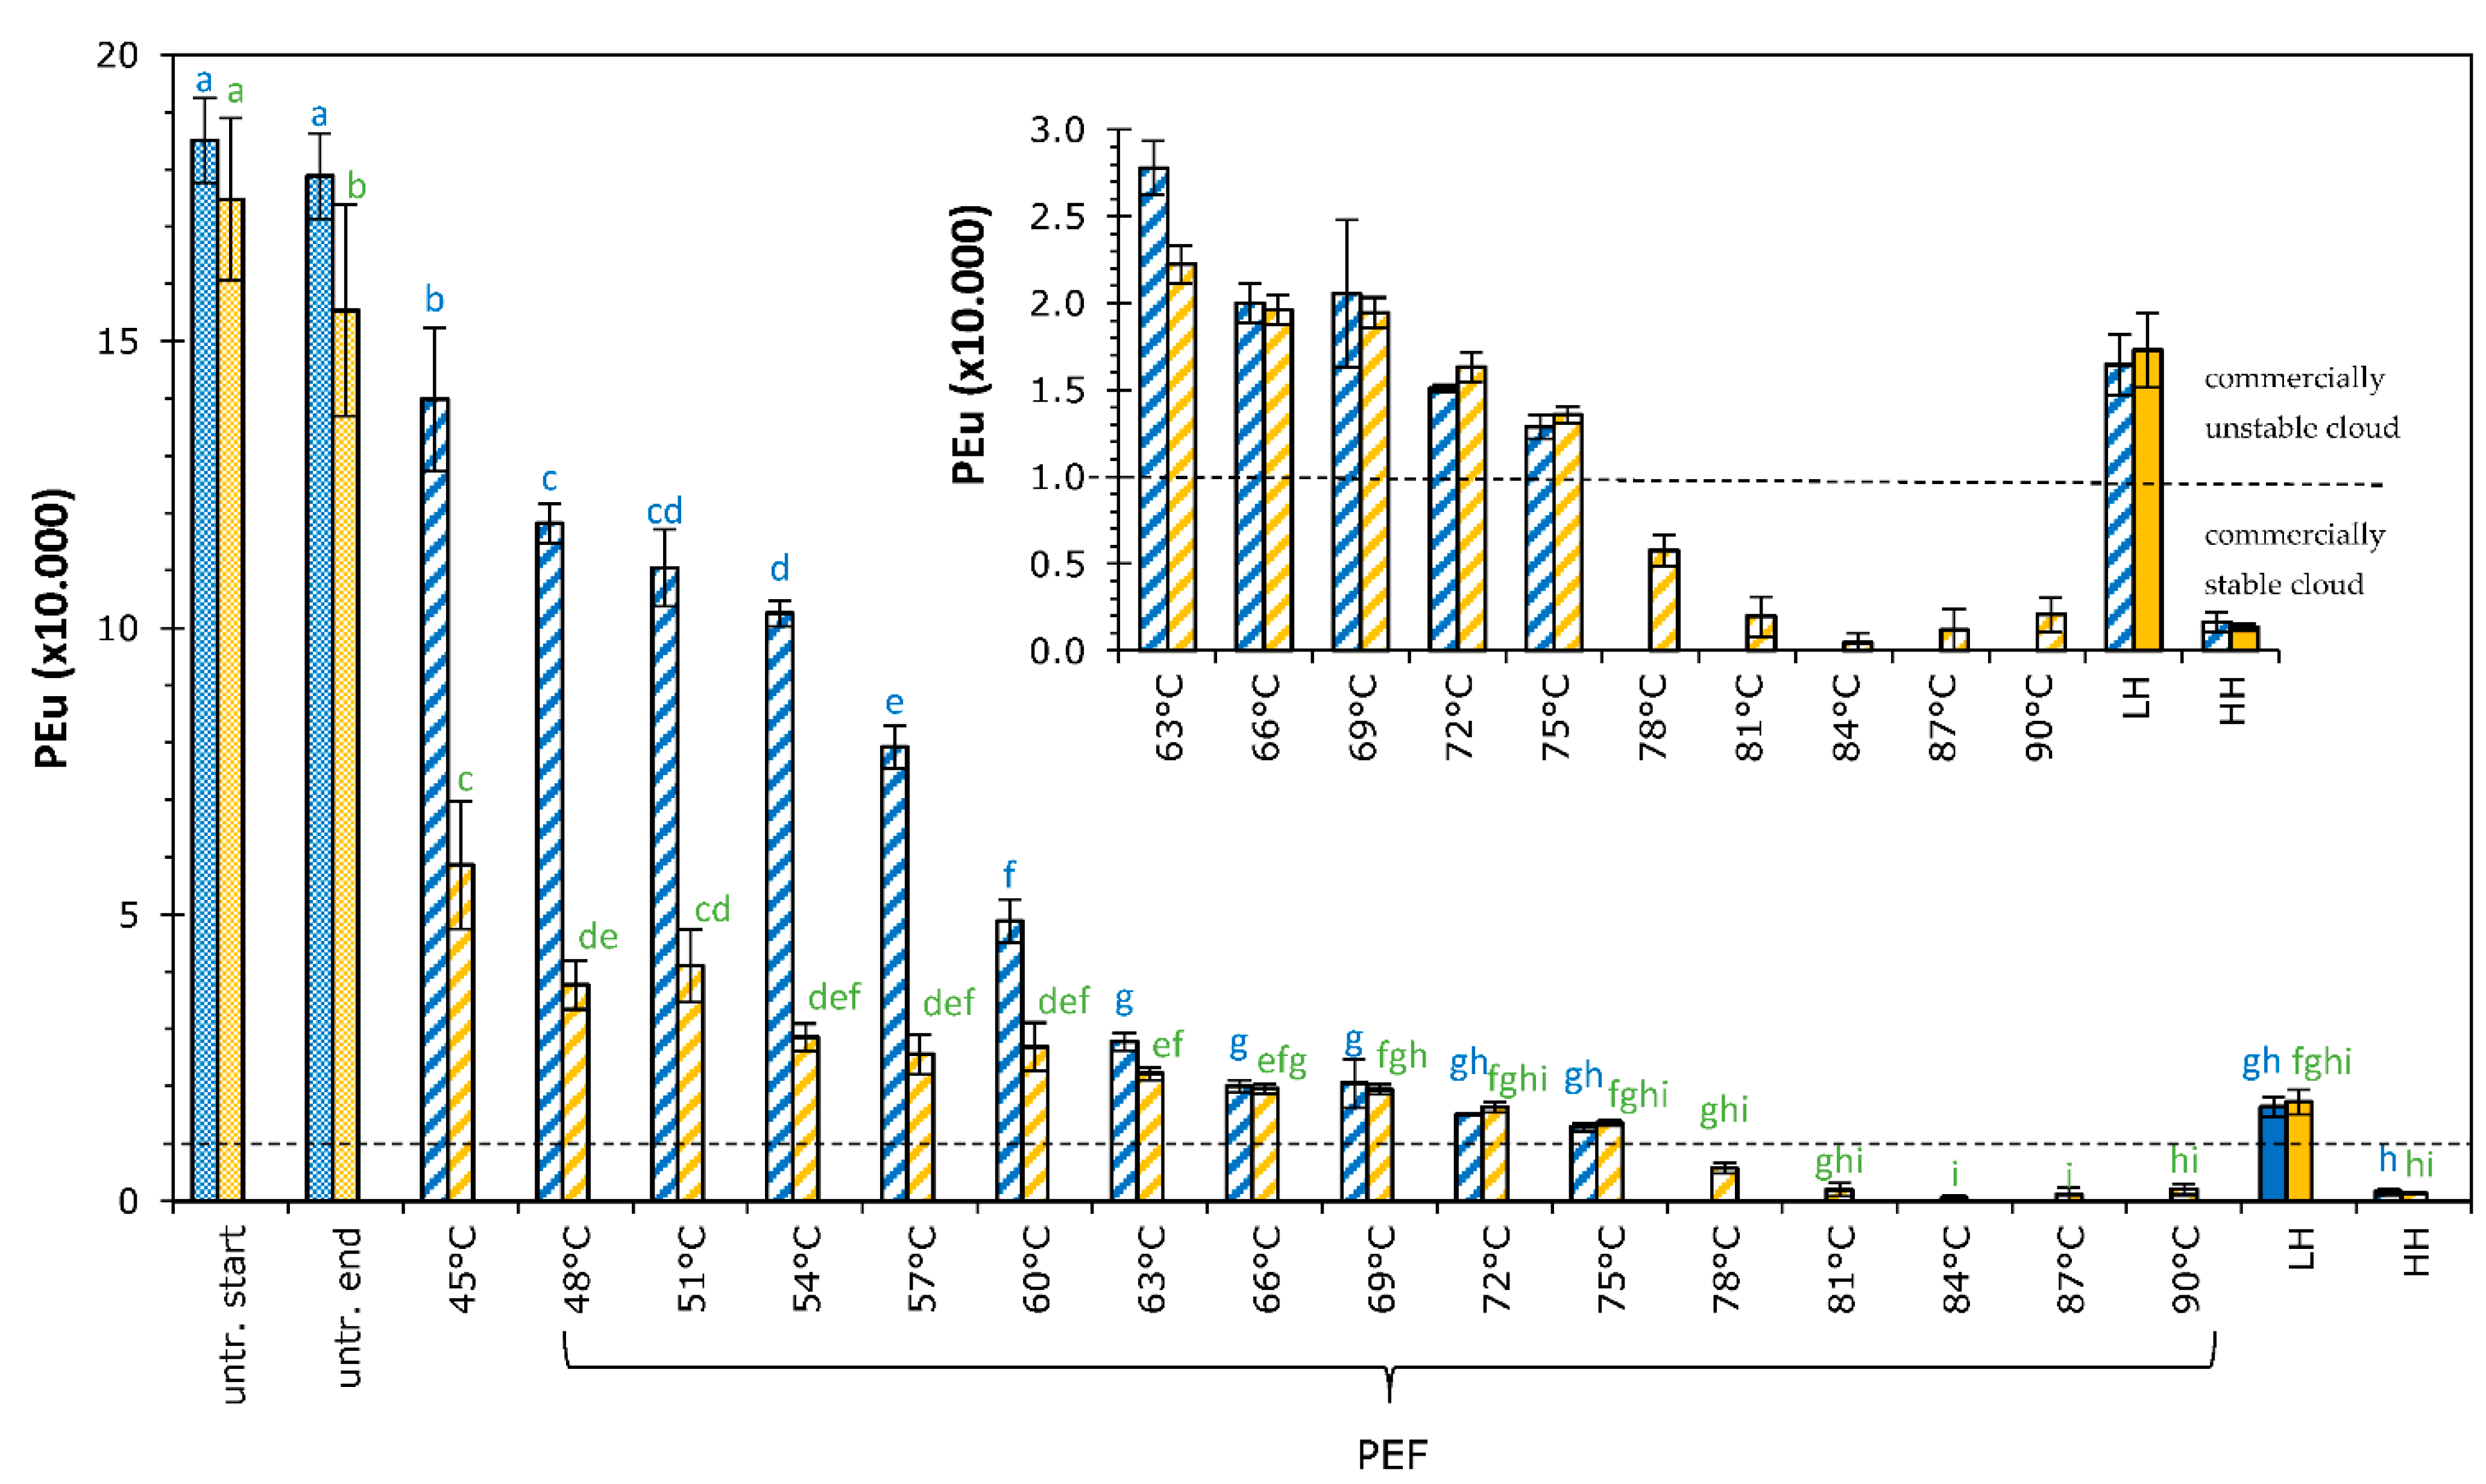
3.5. PME
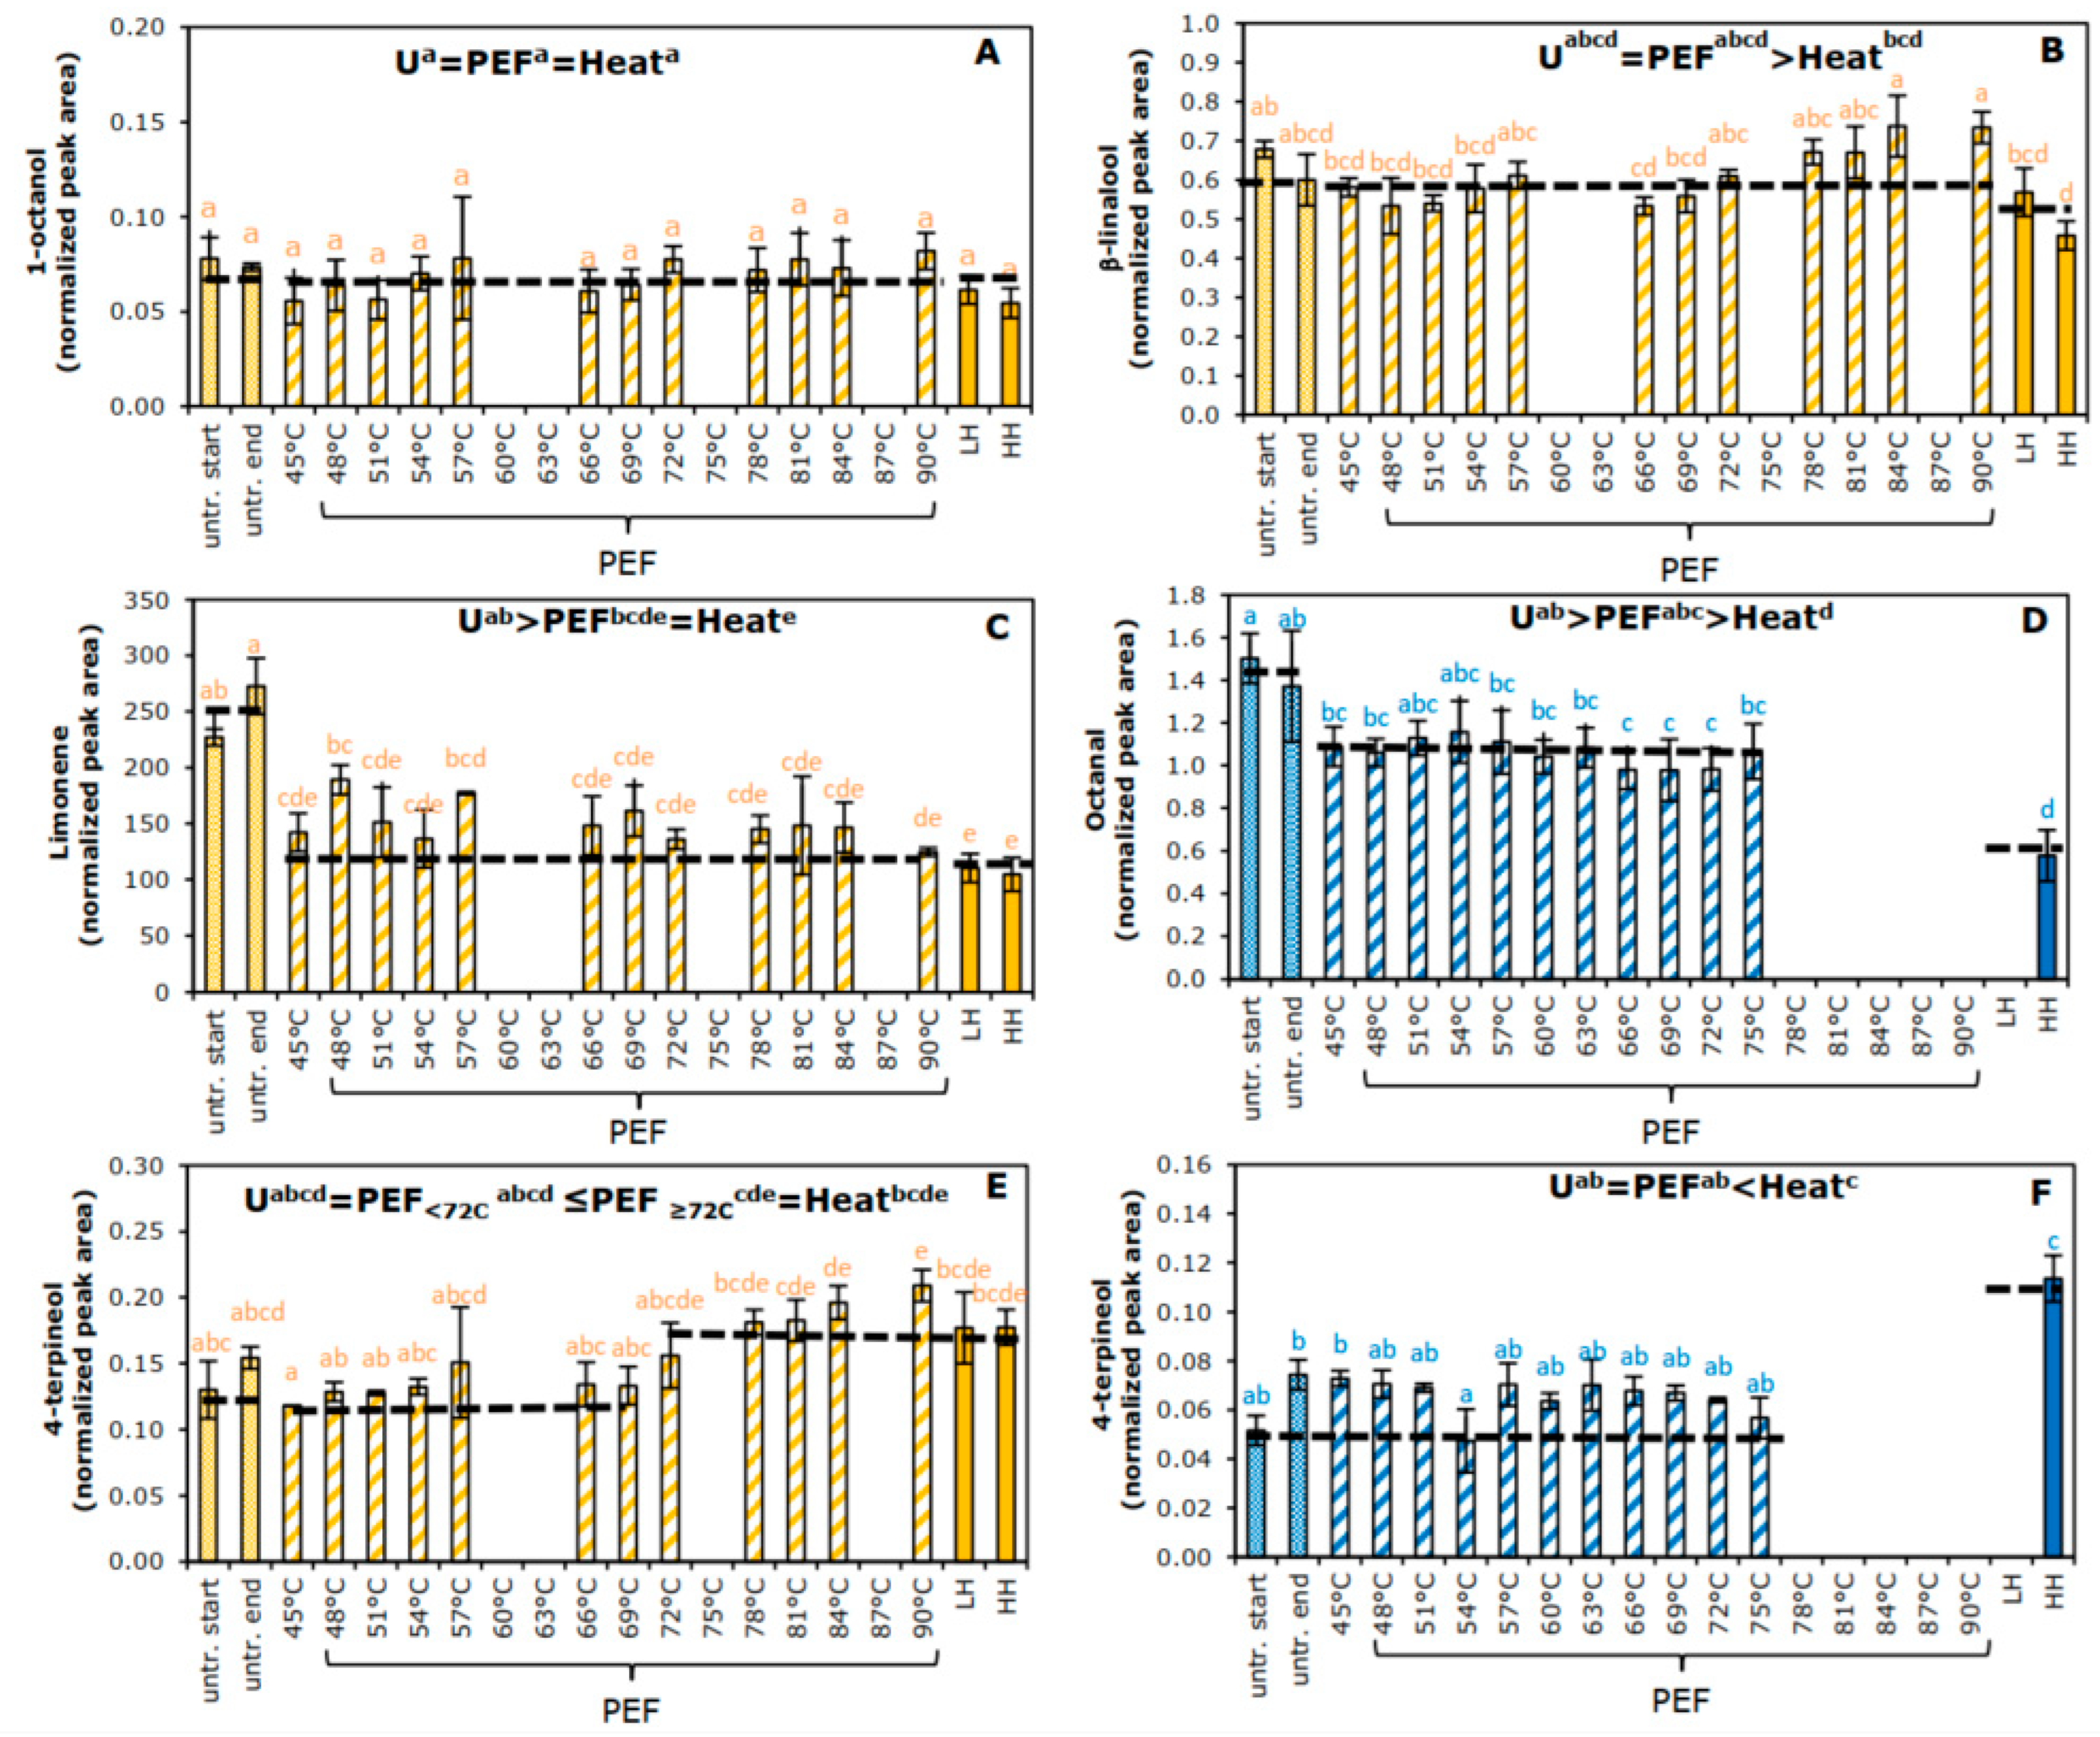
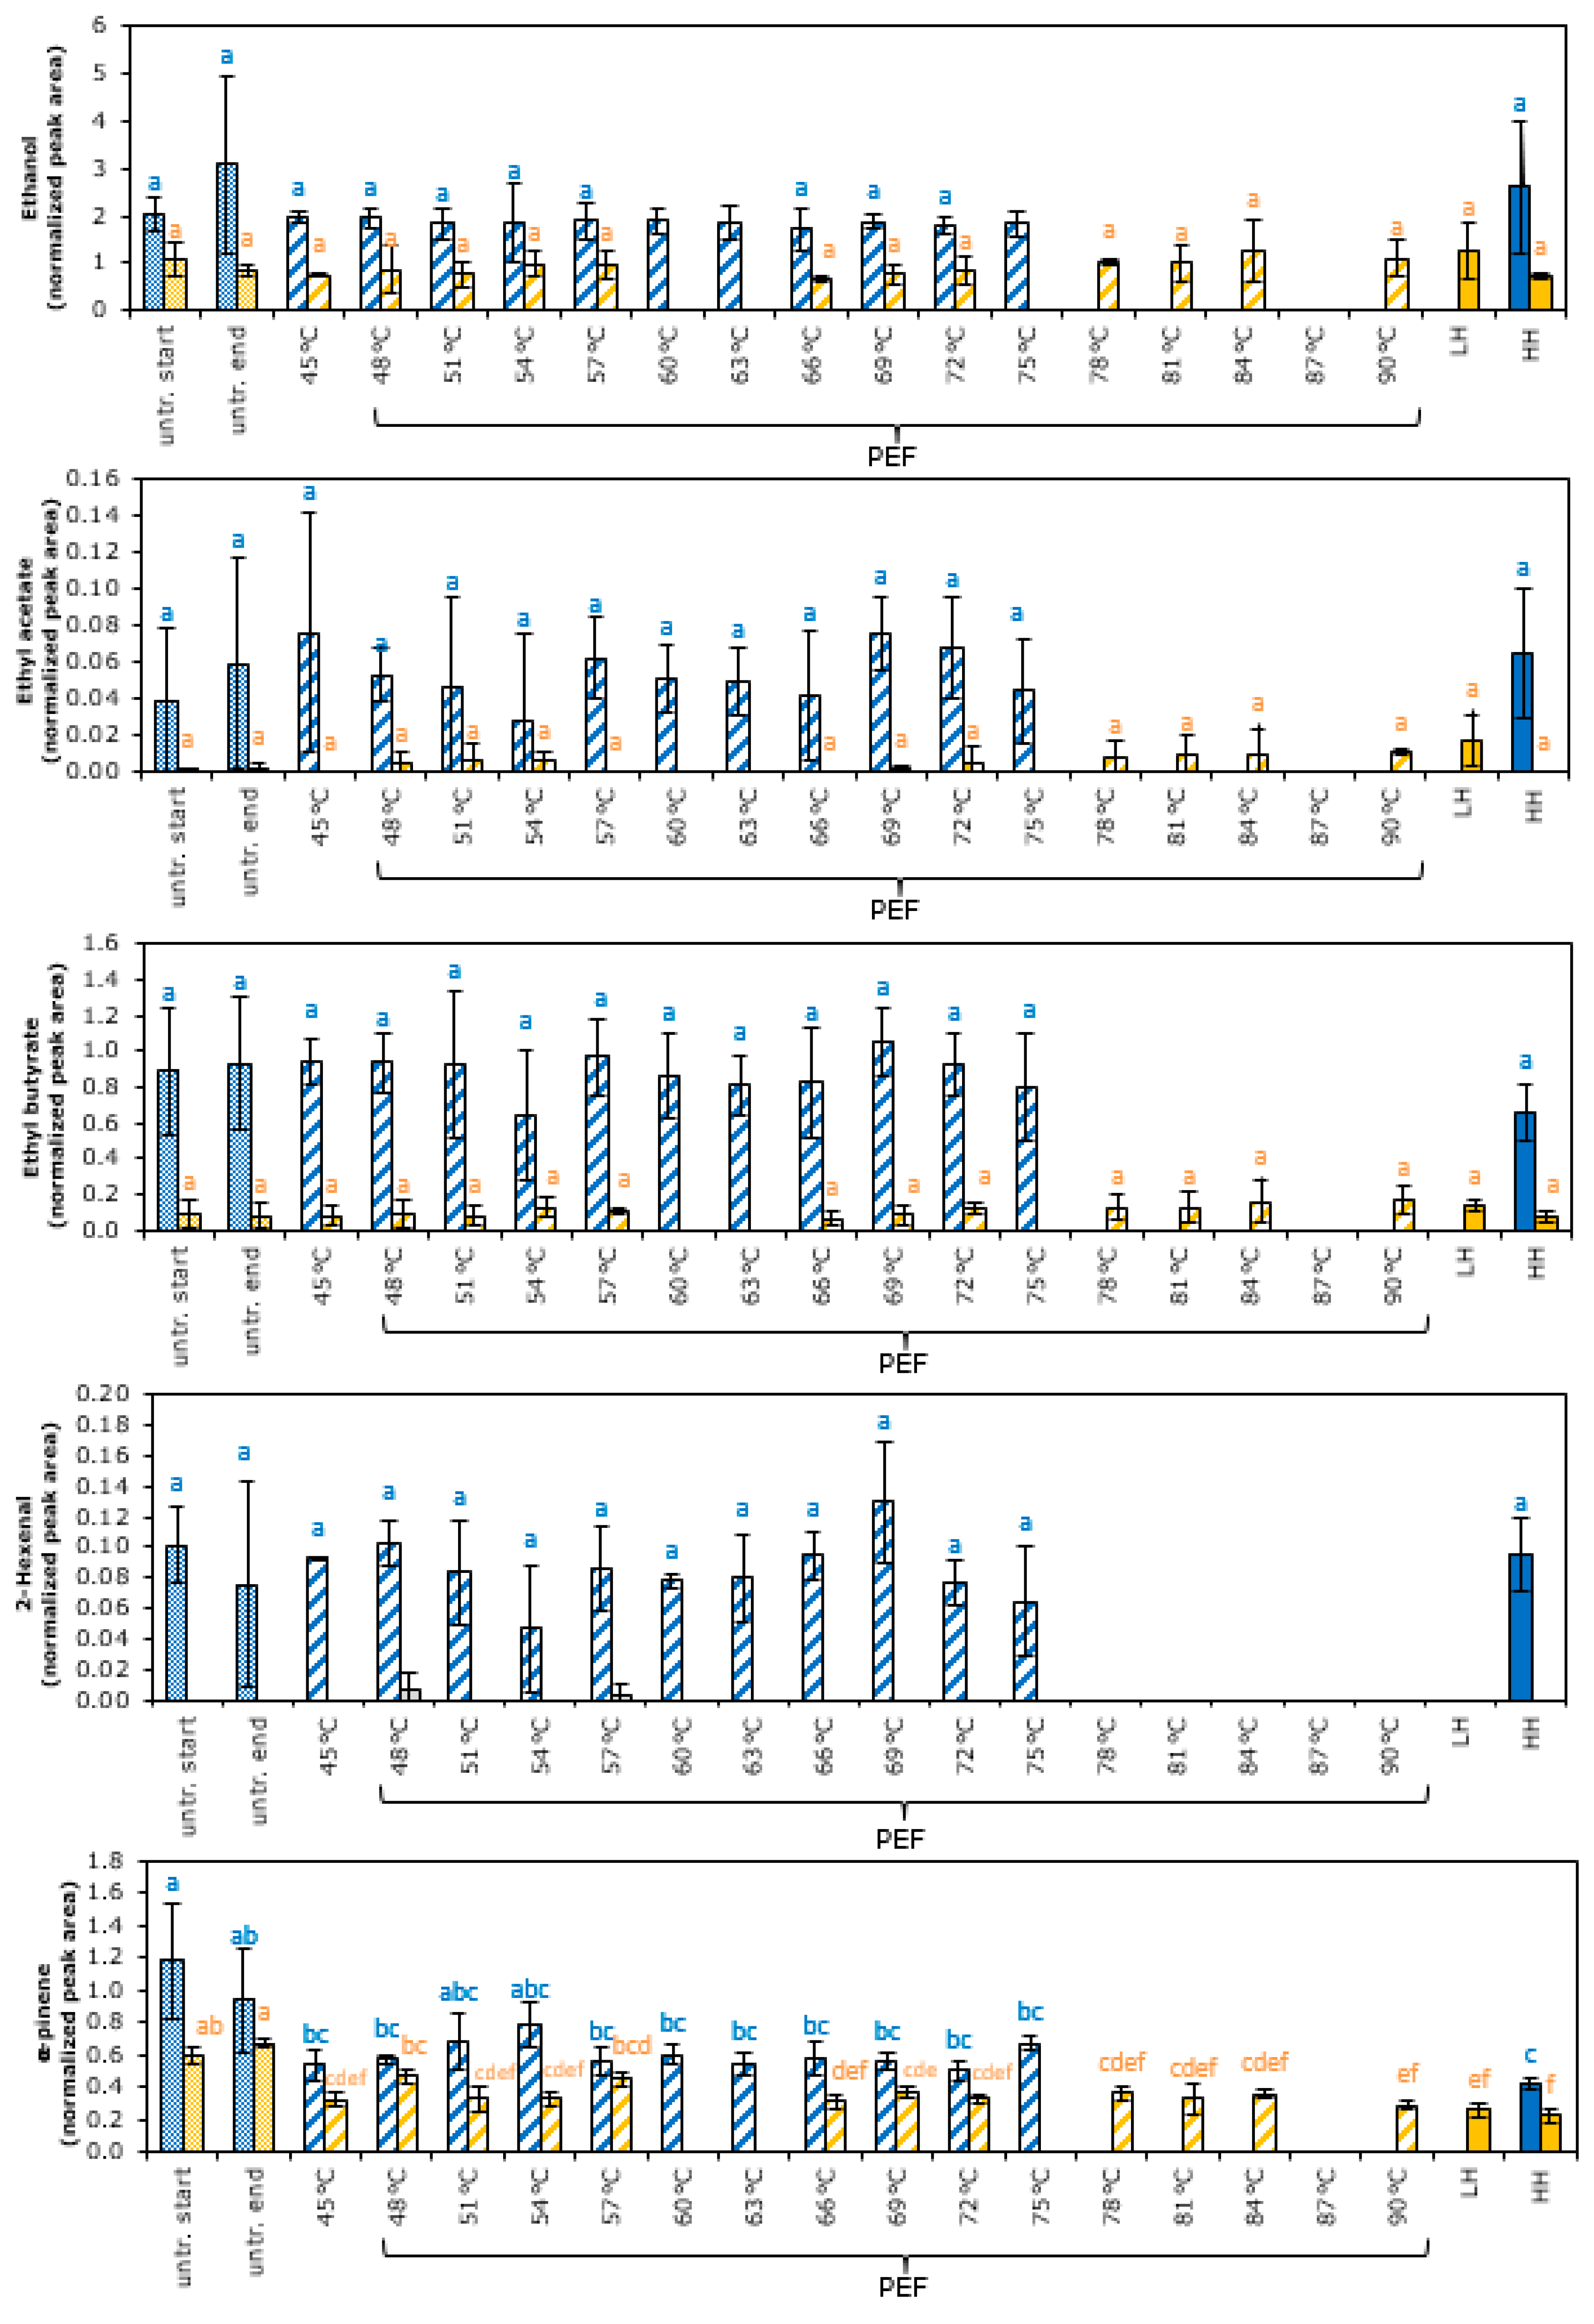
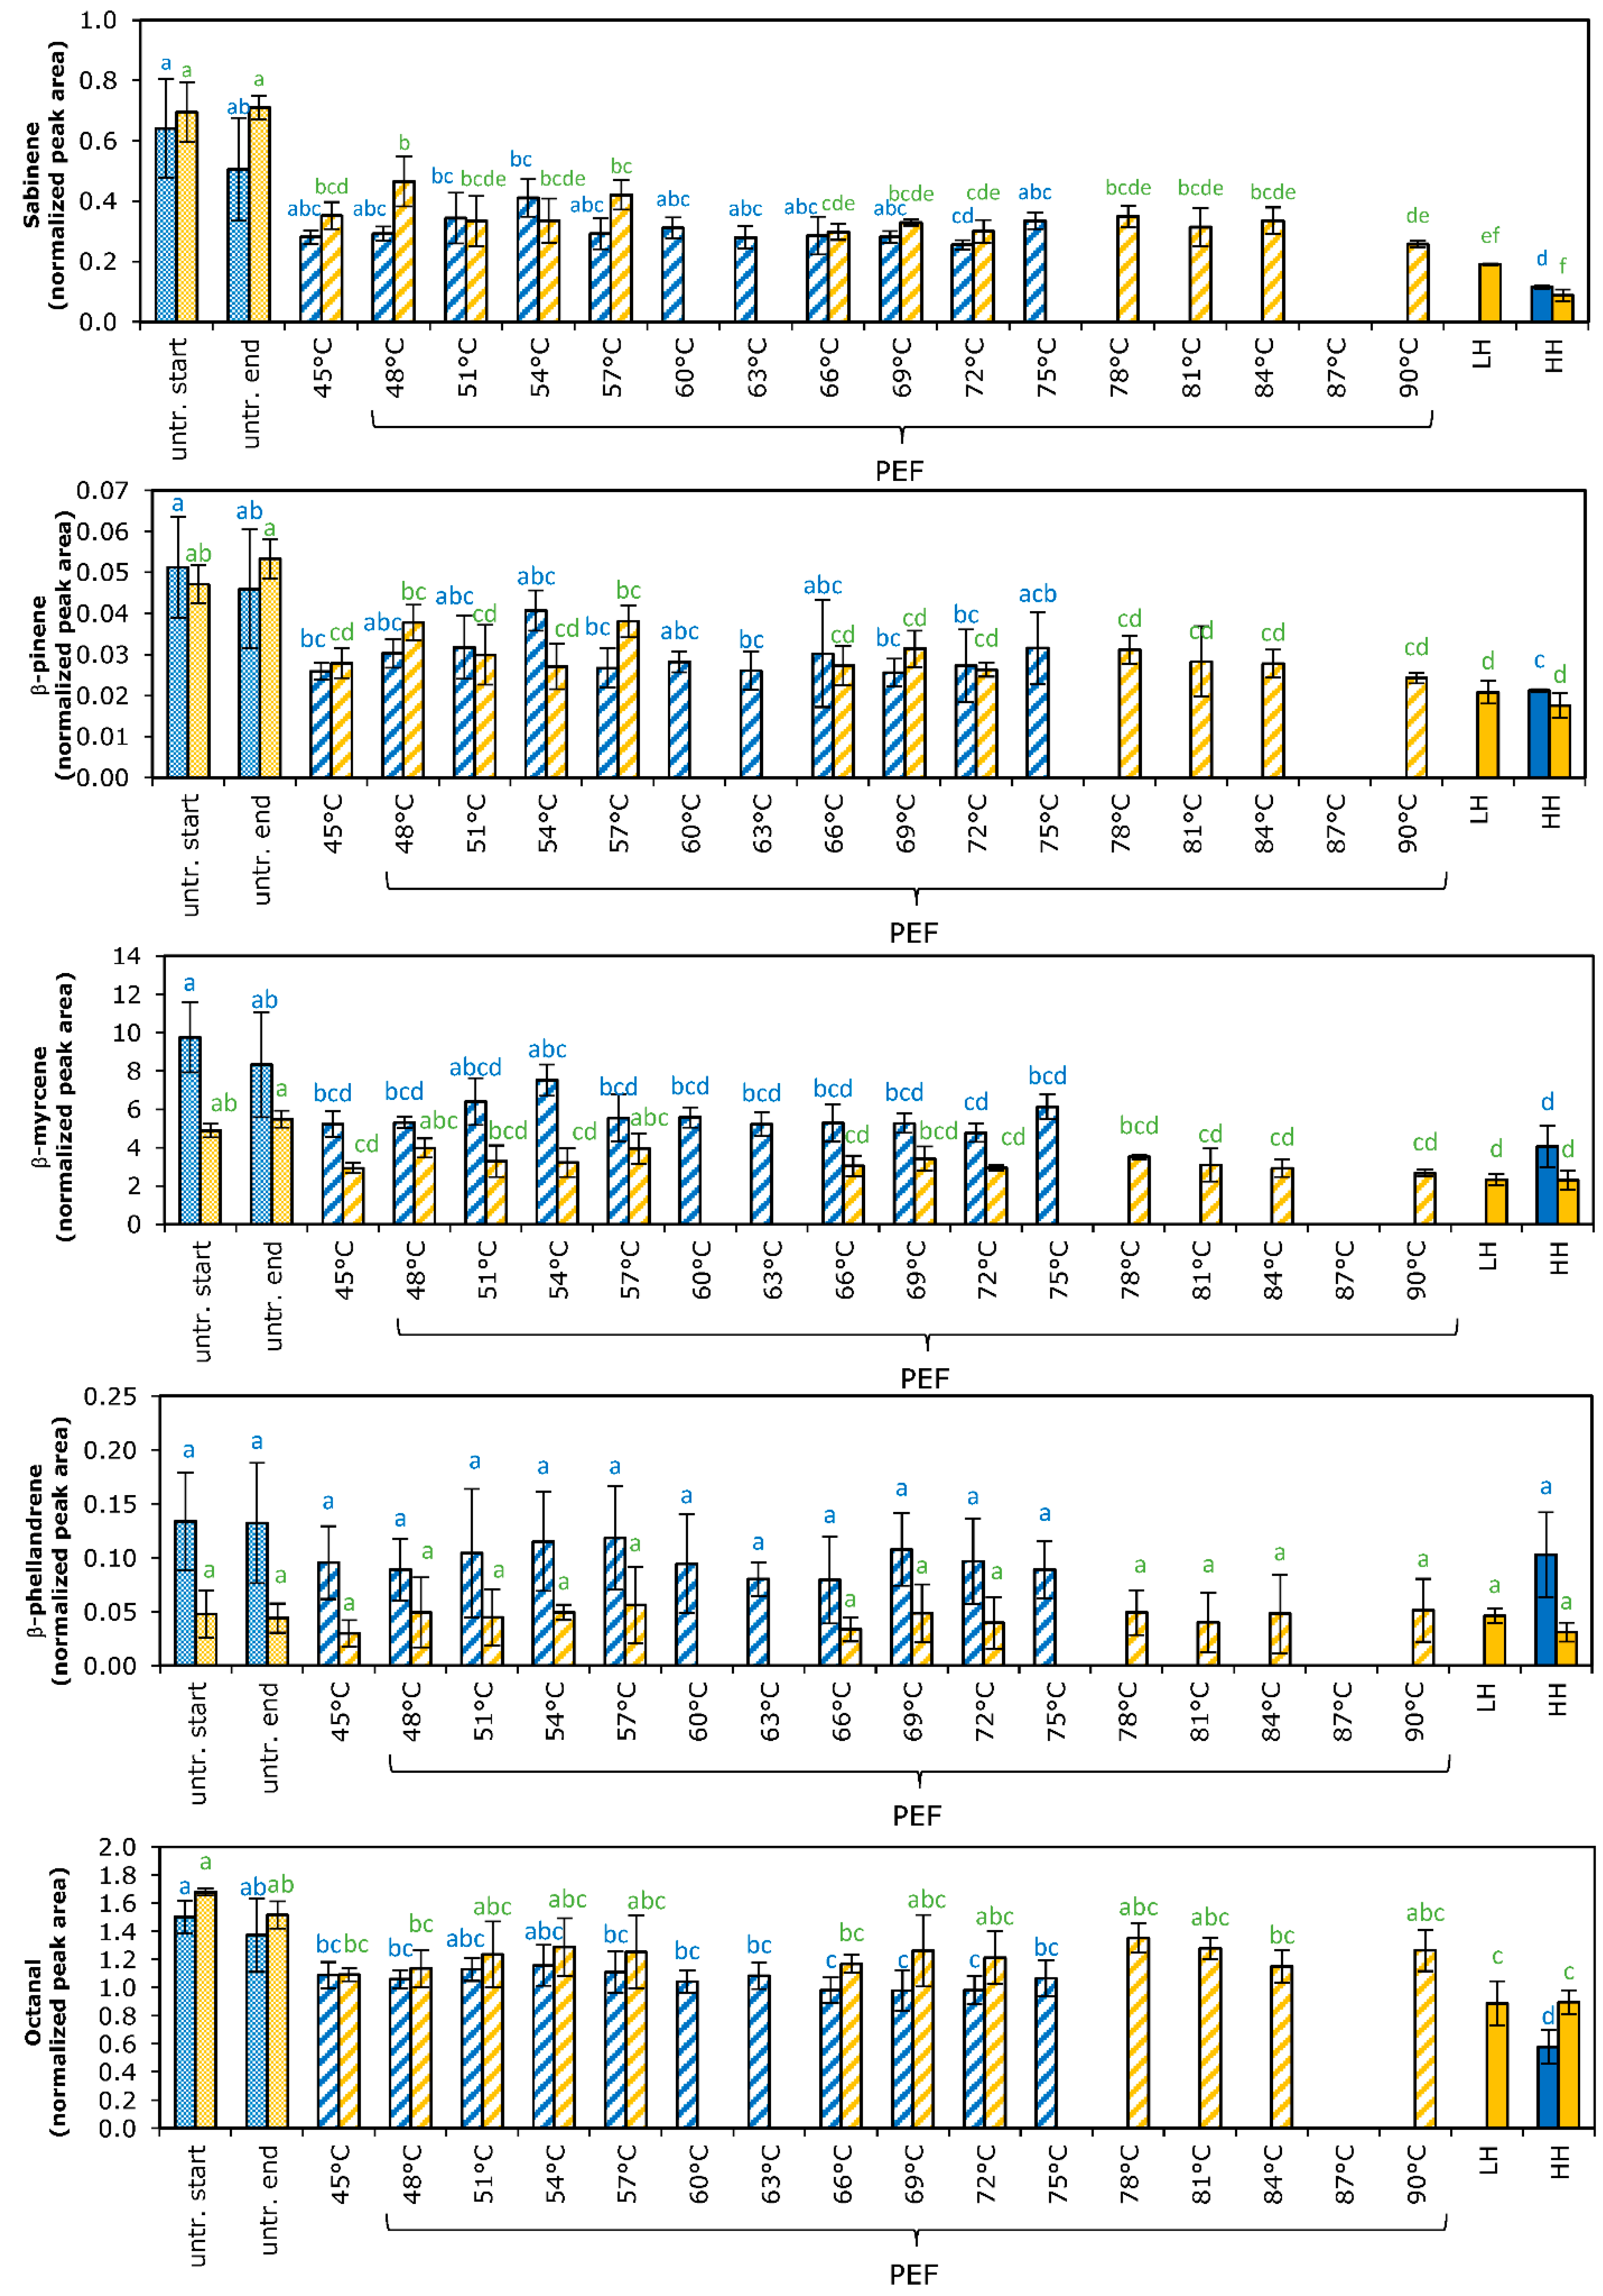
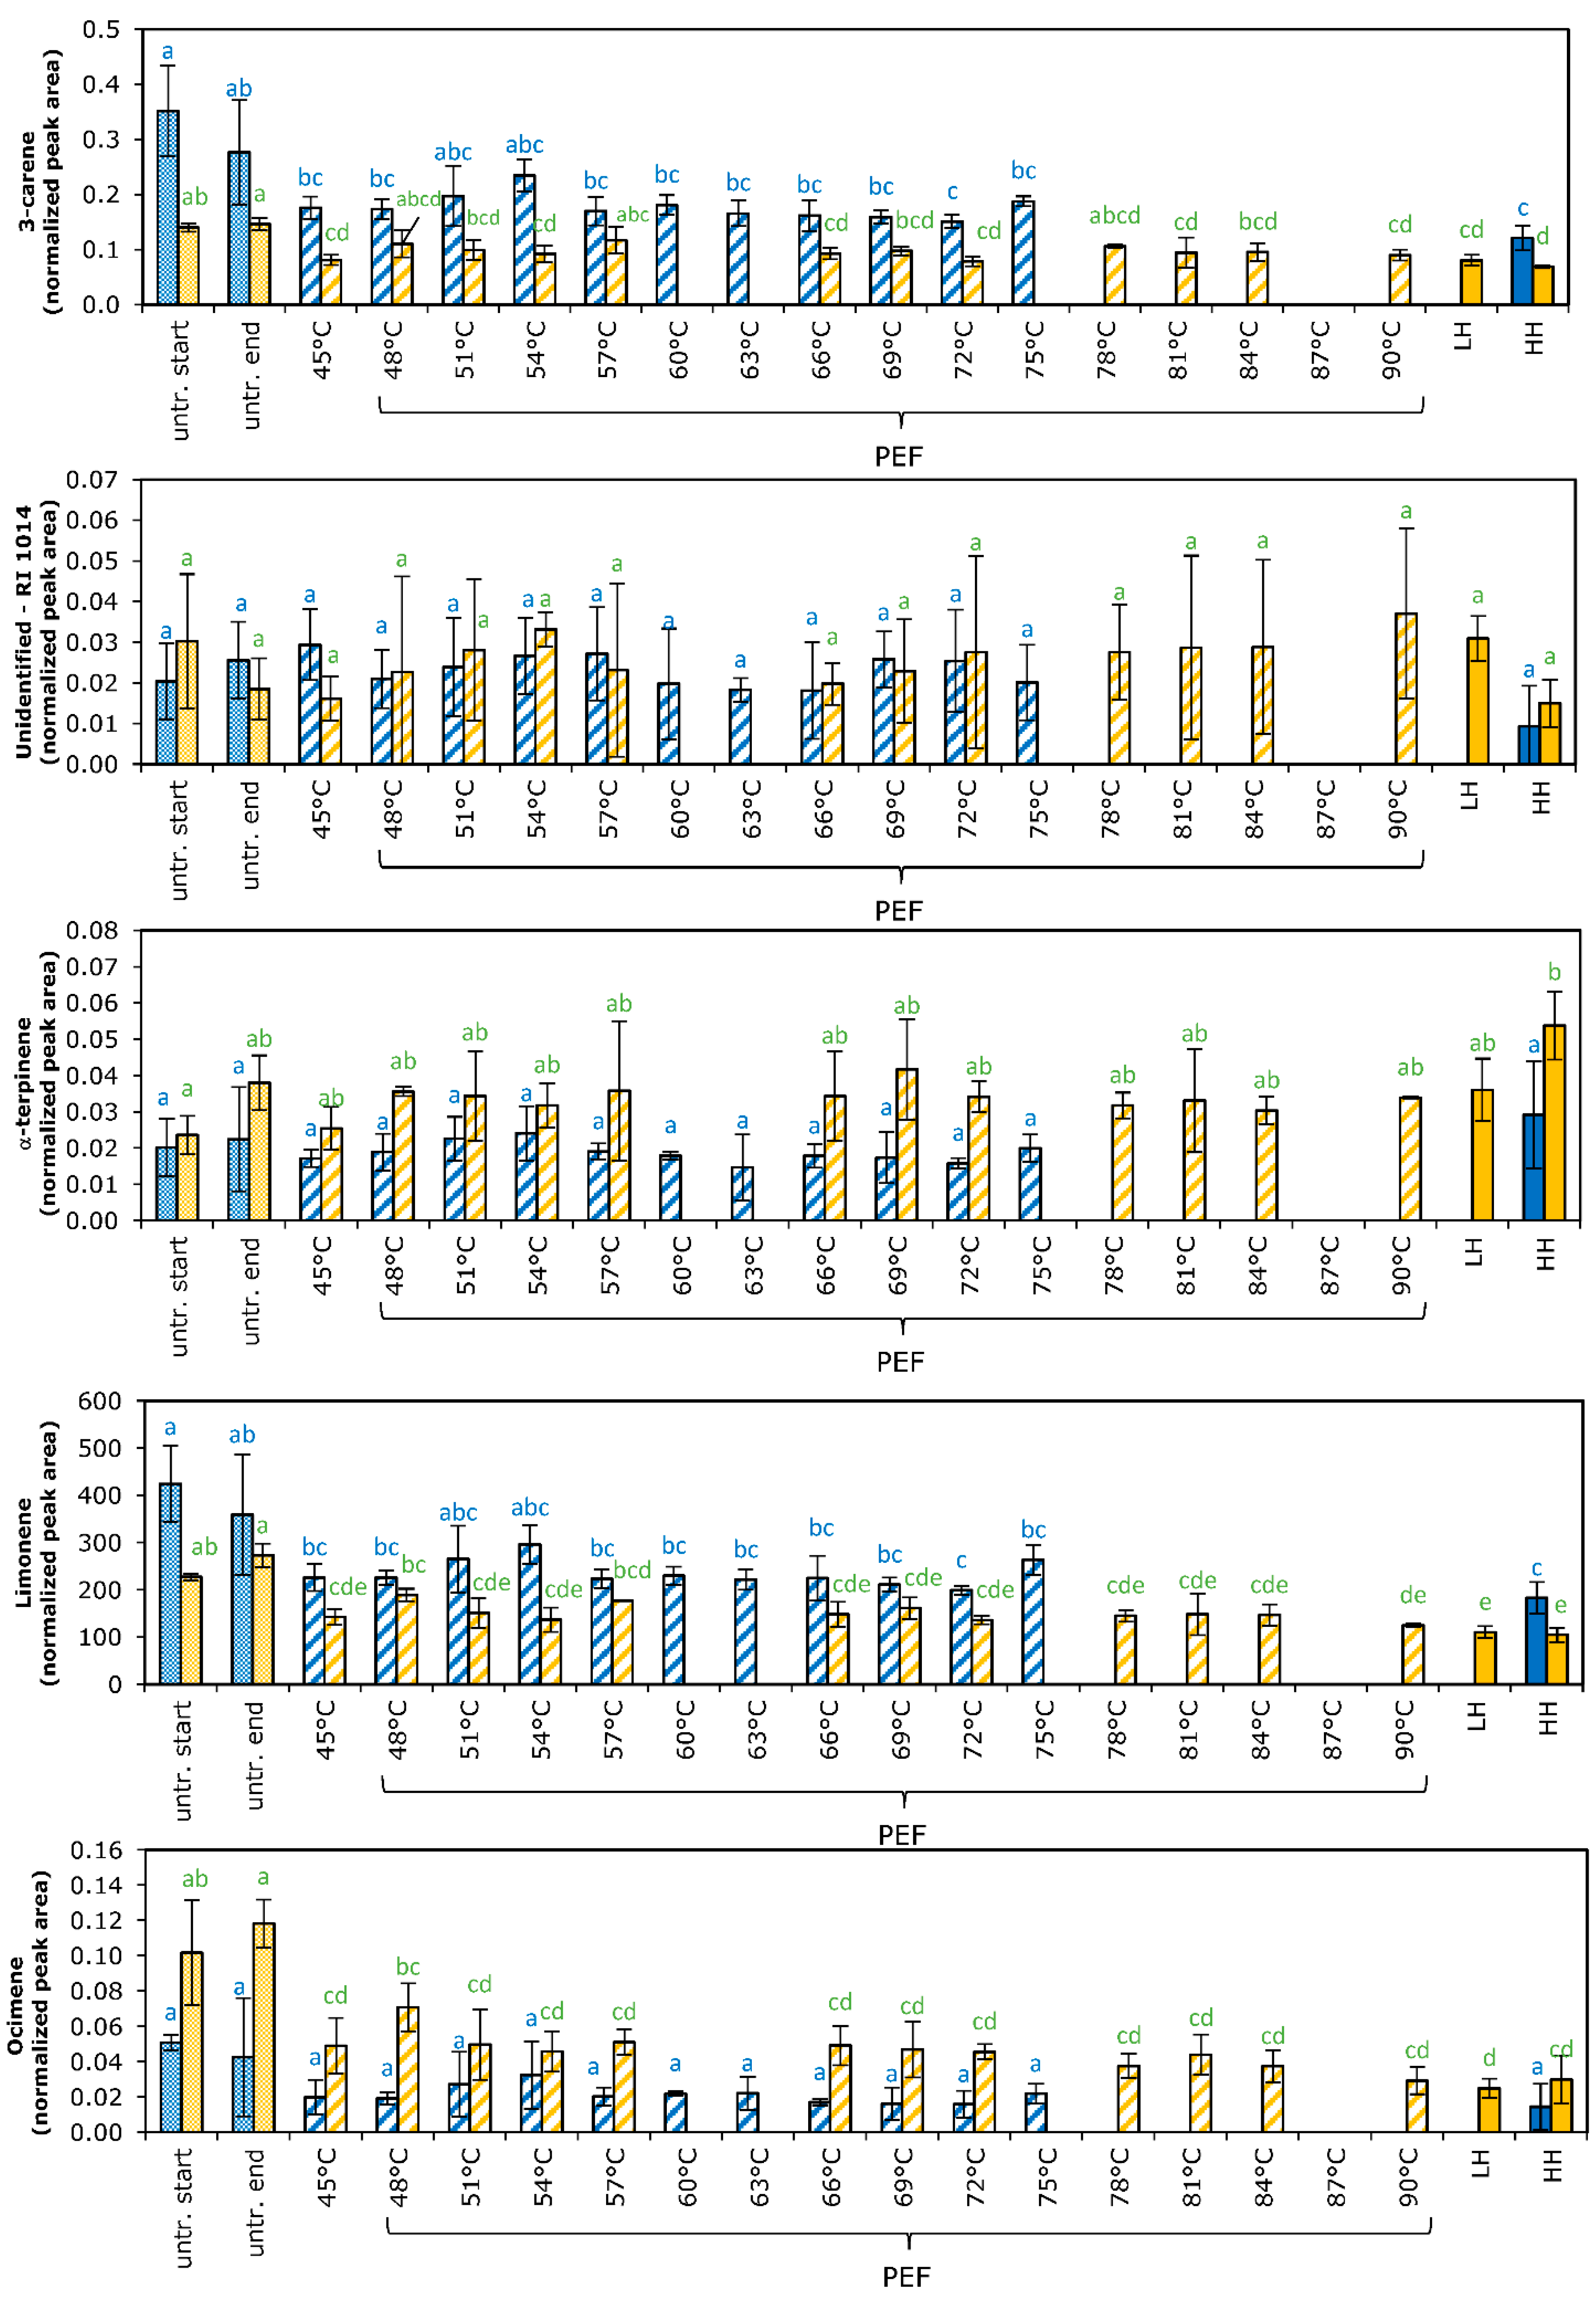
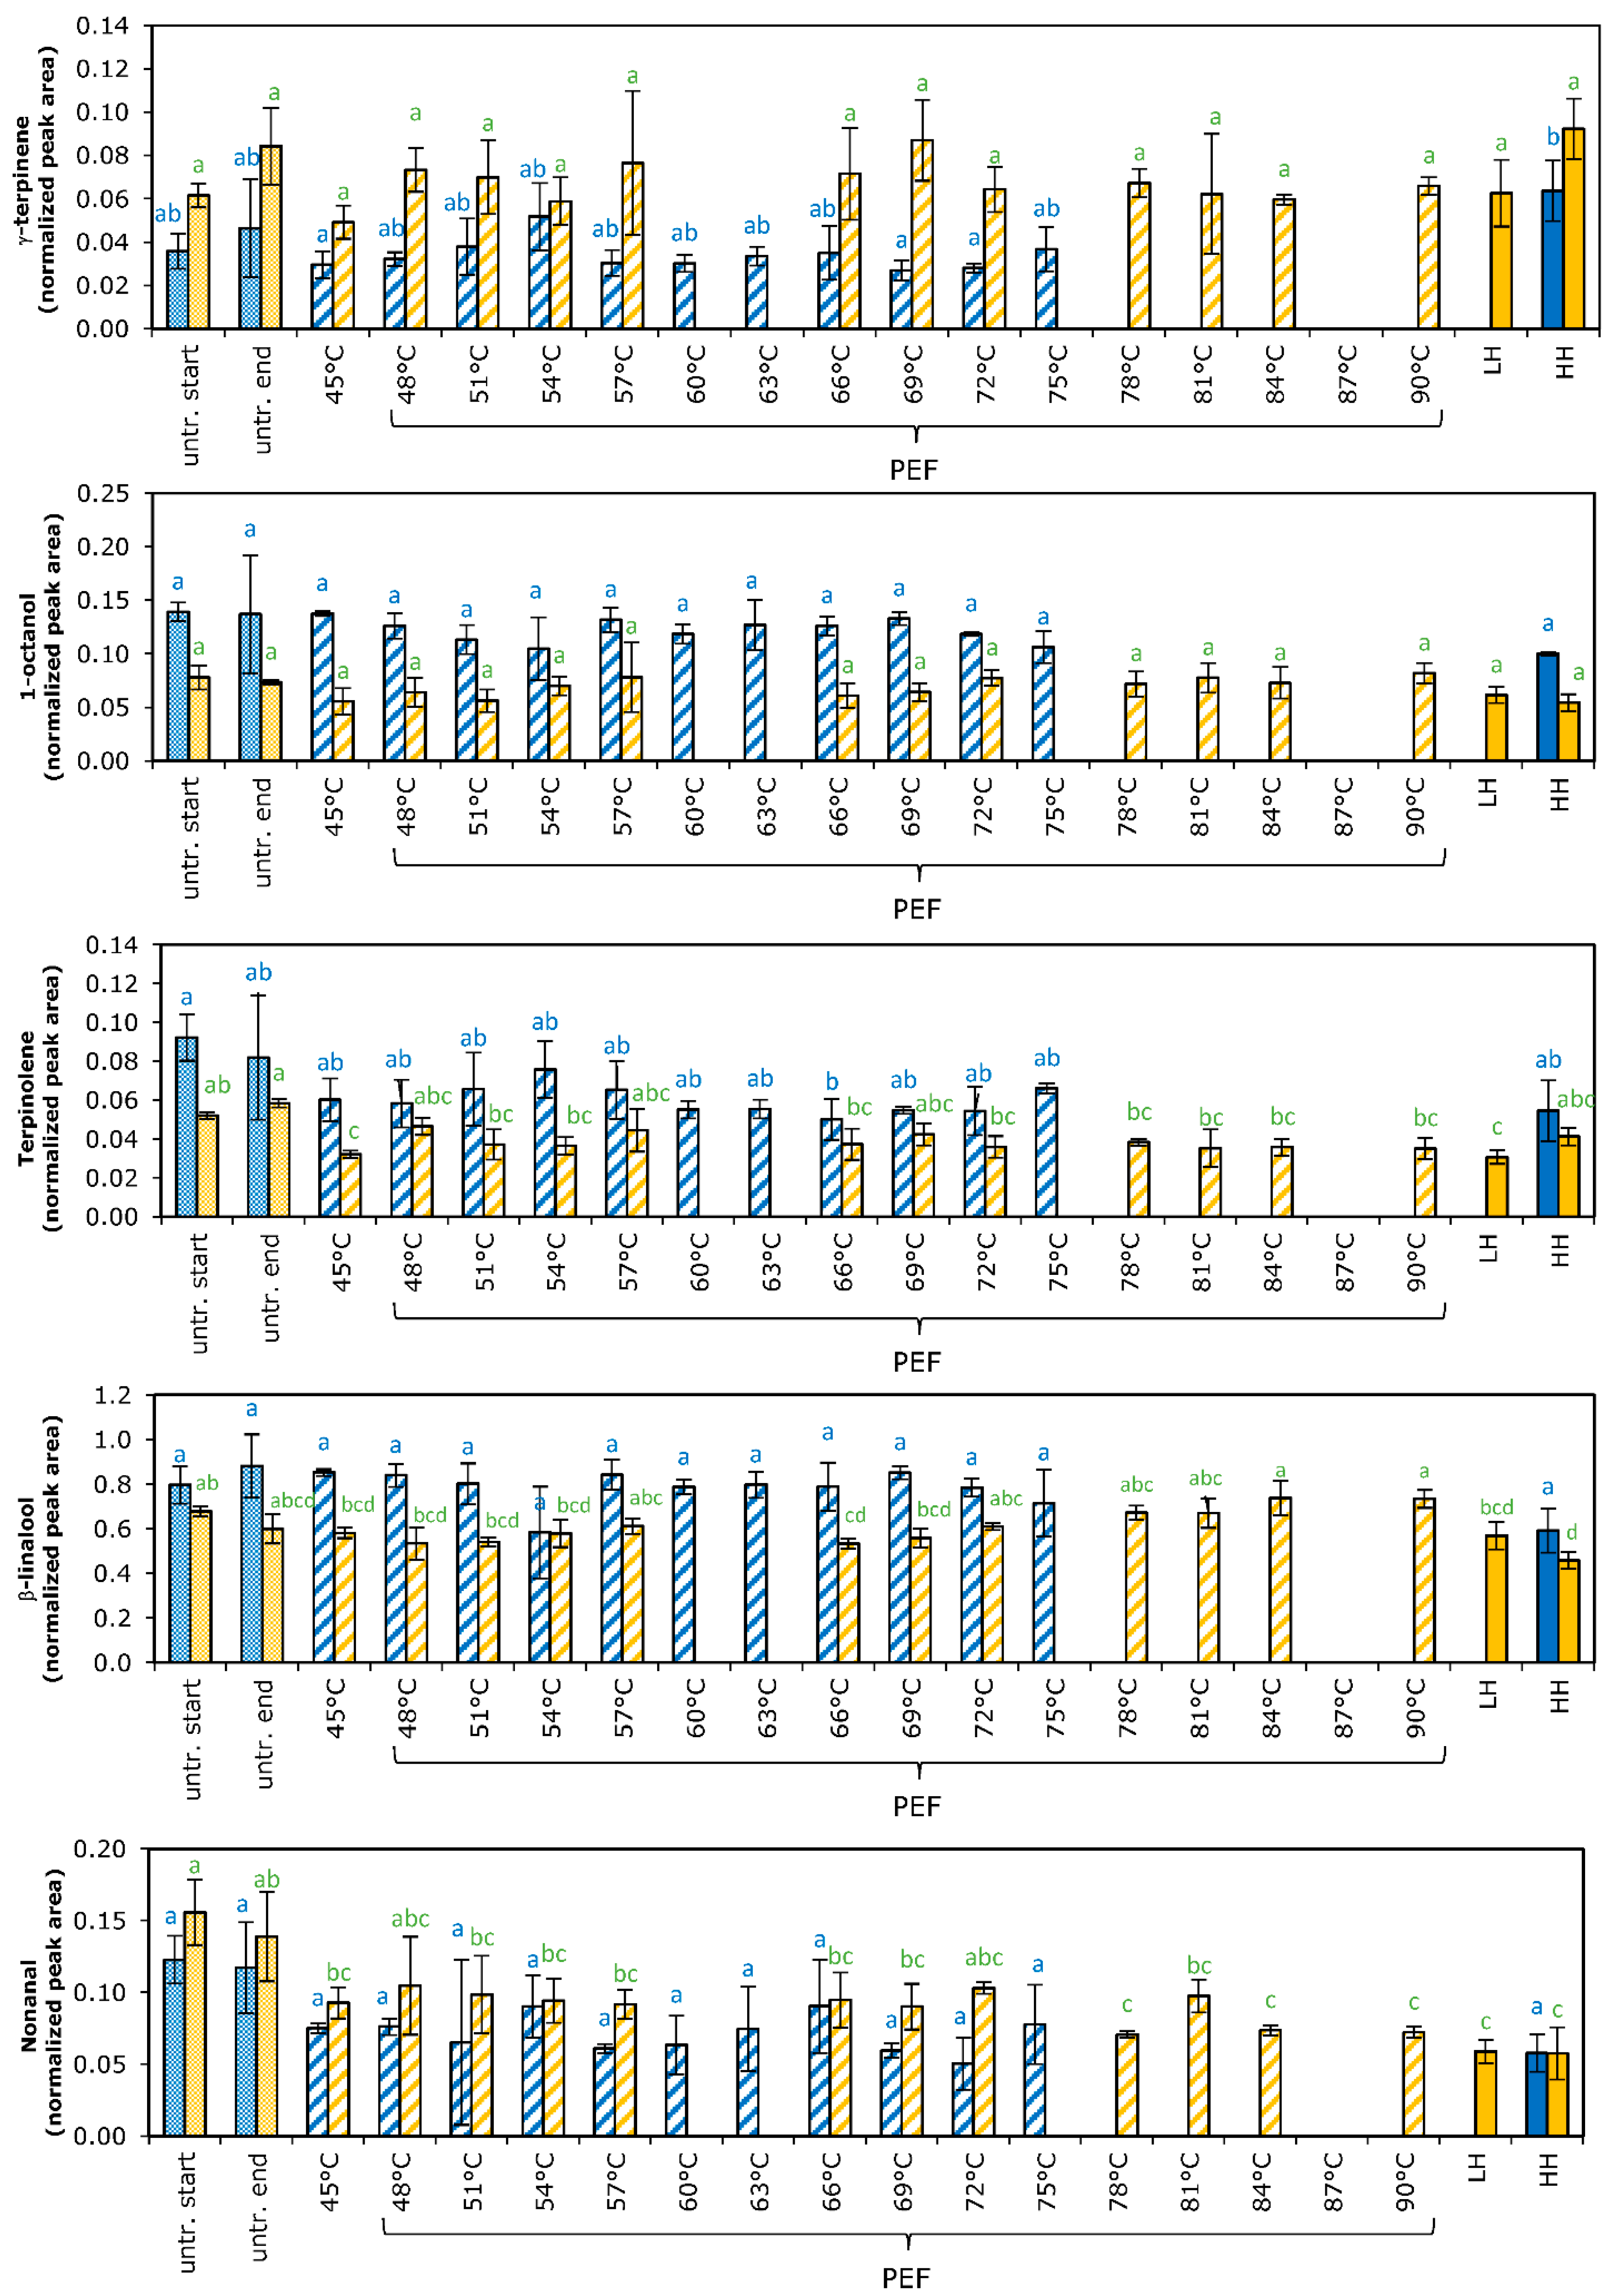
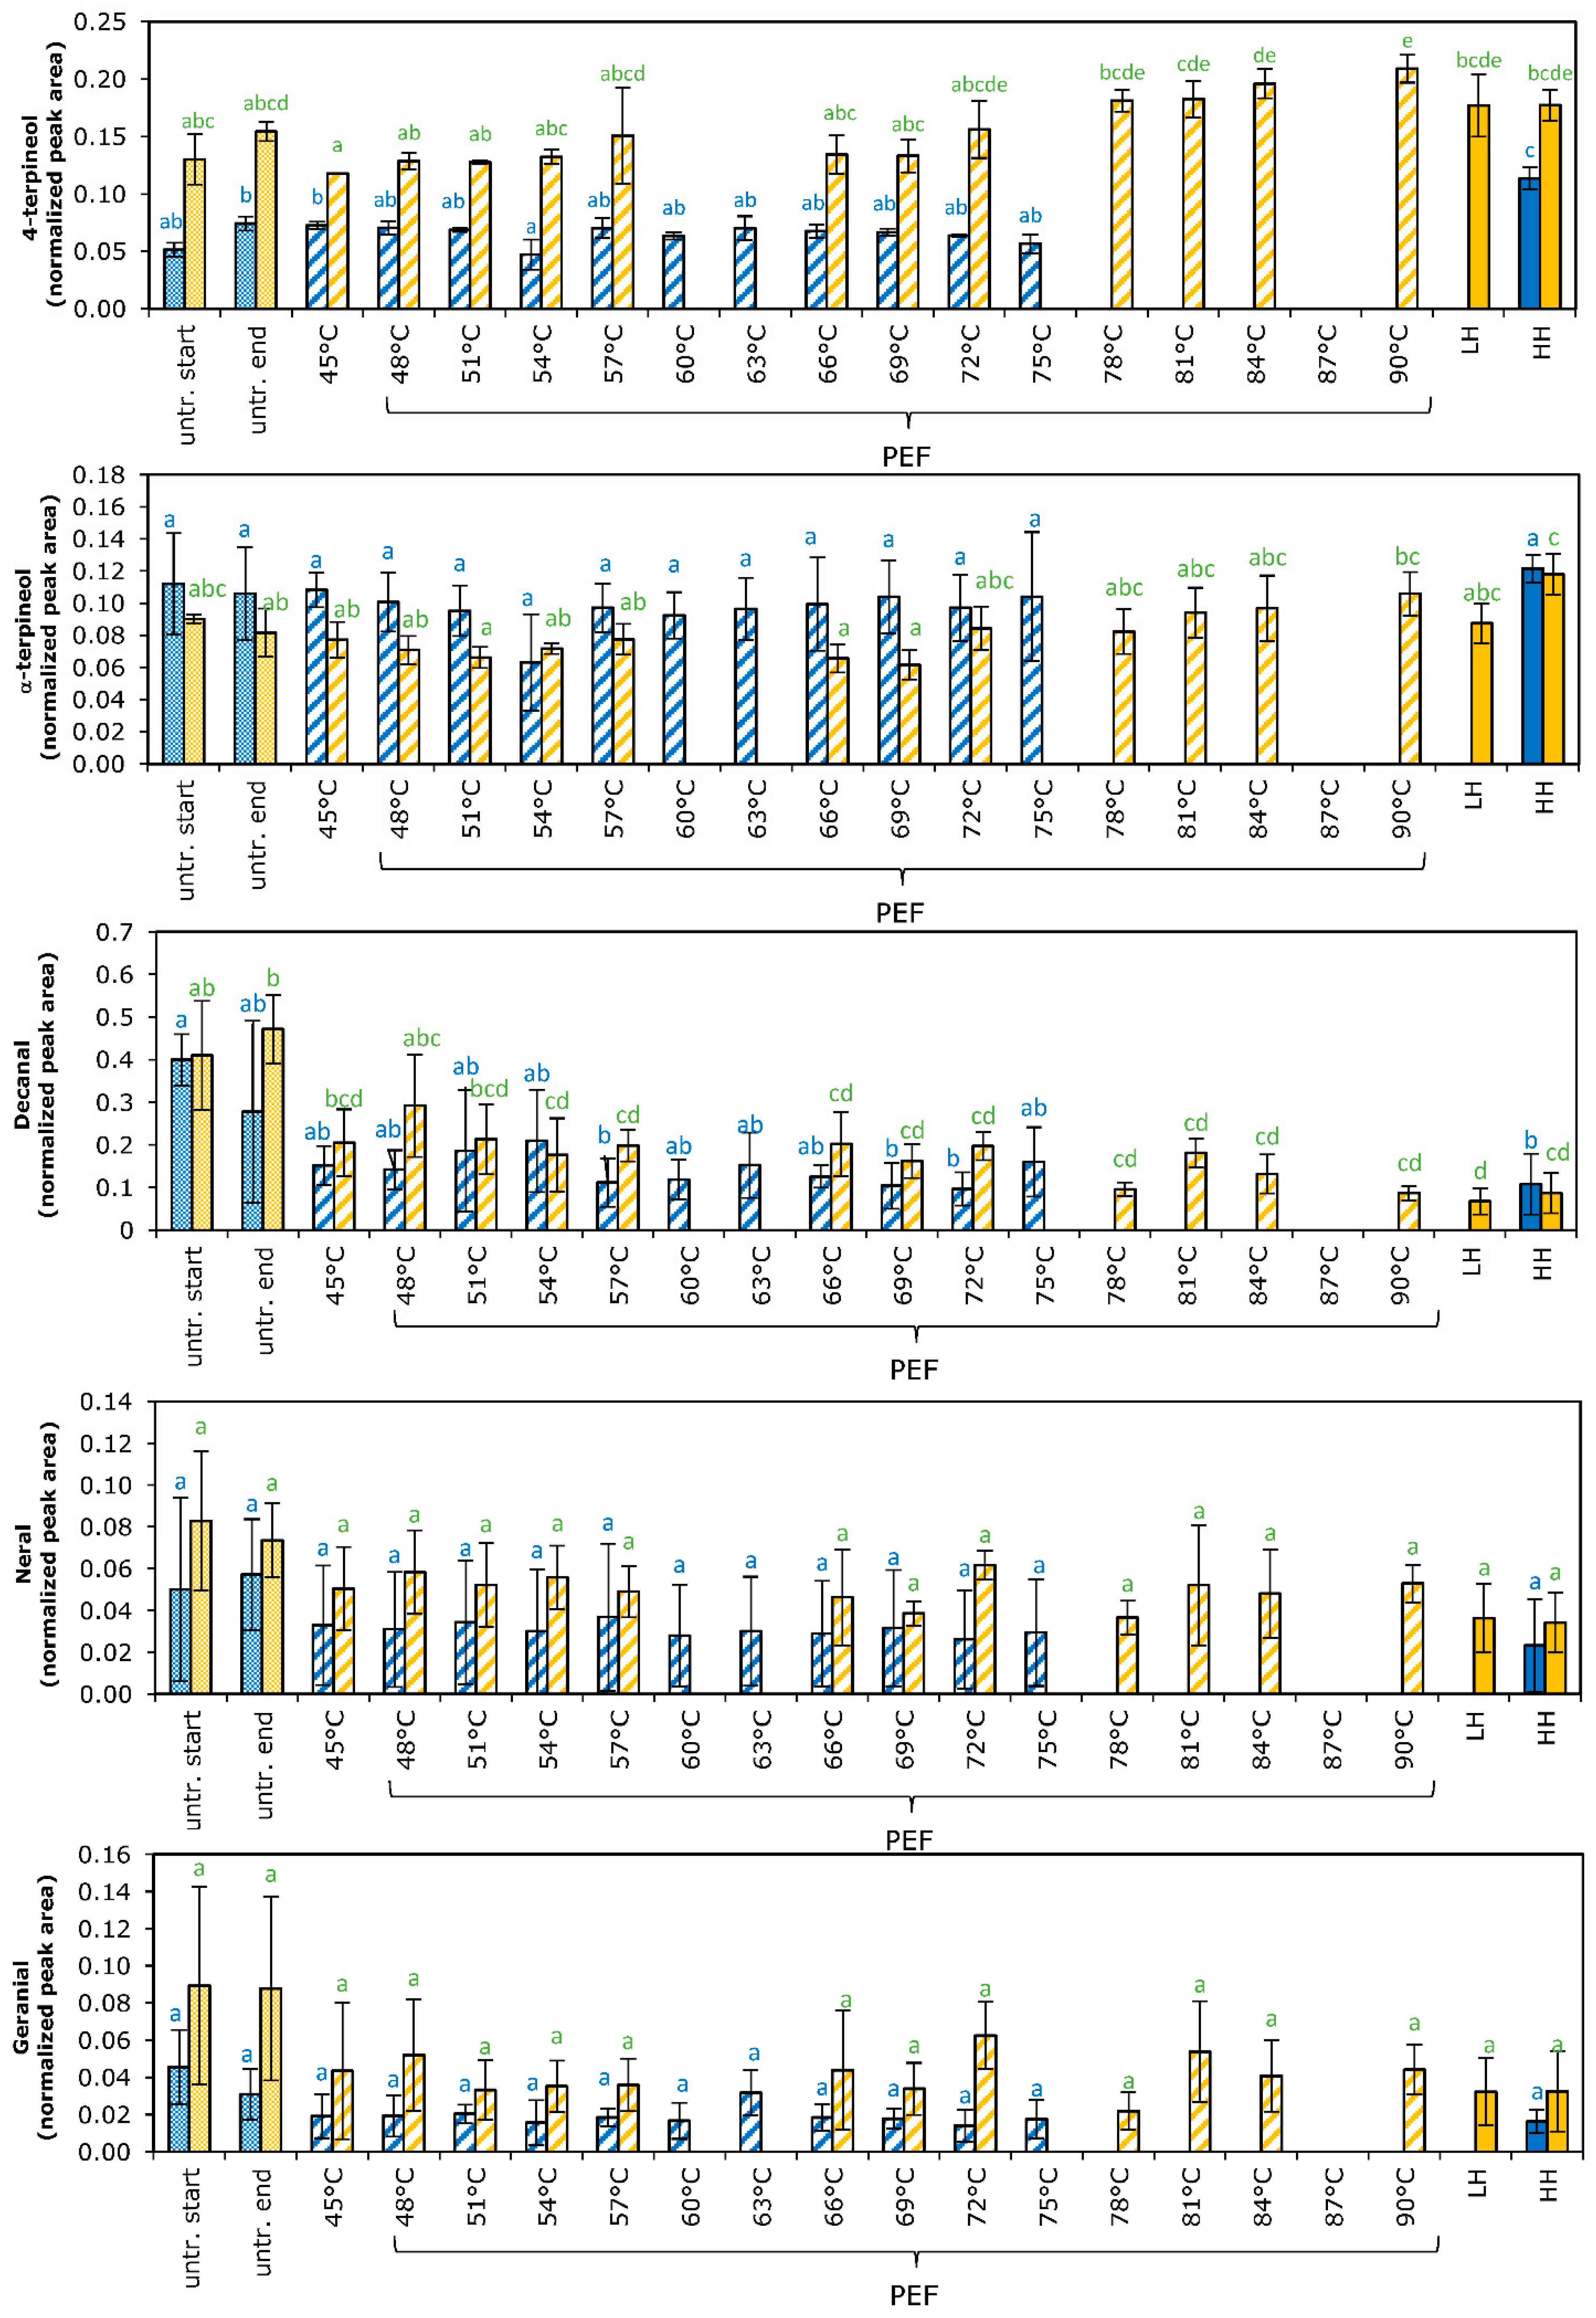
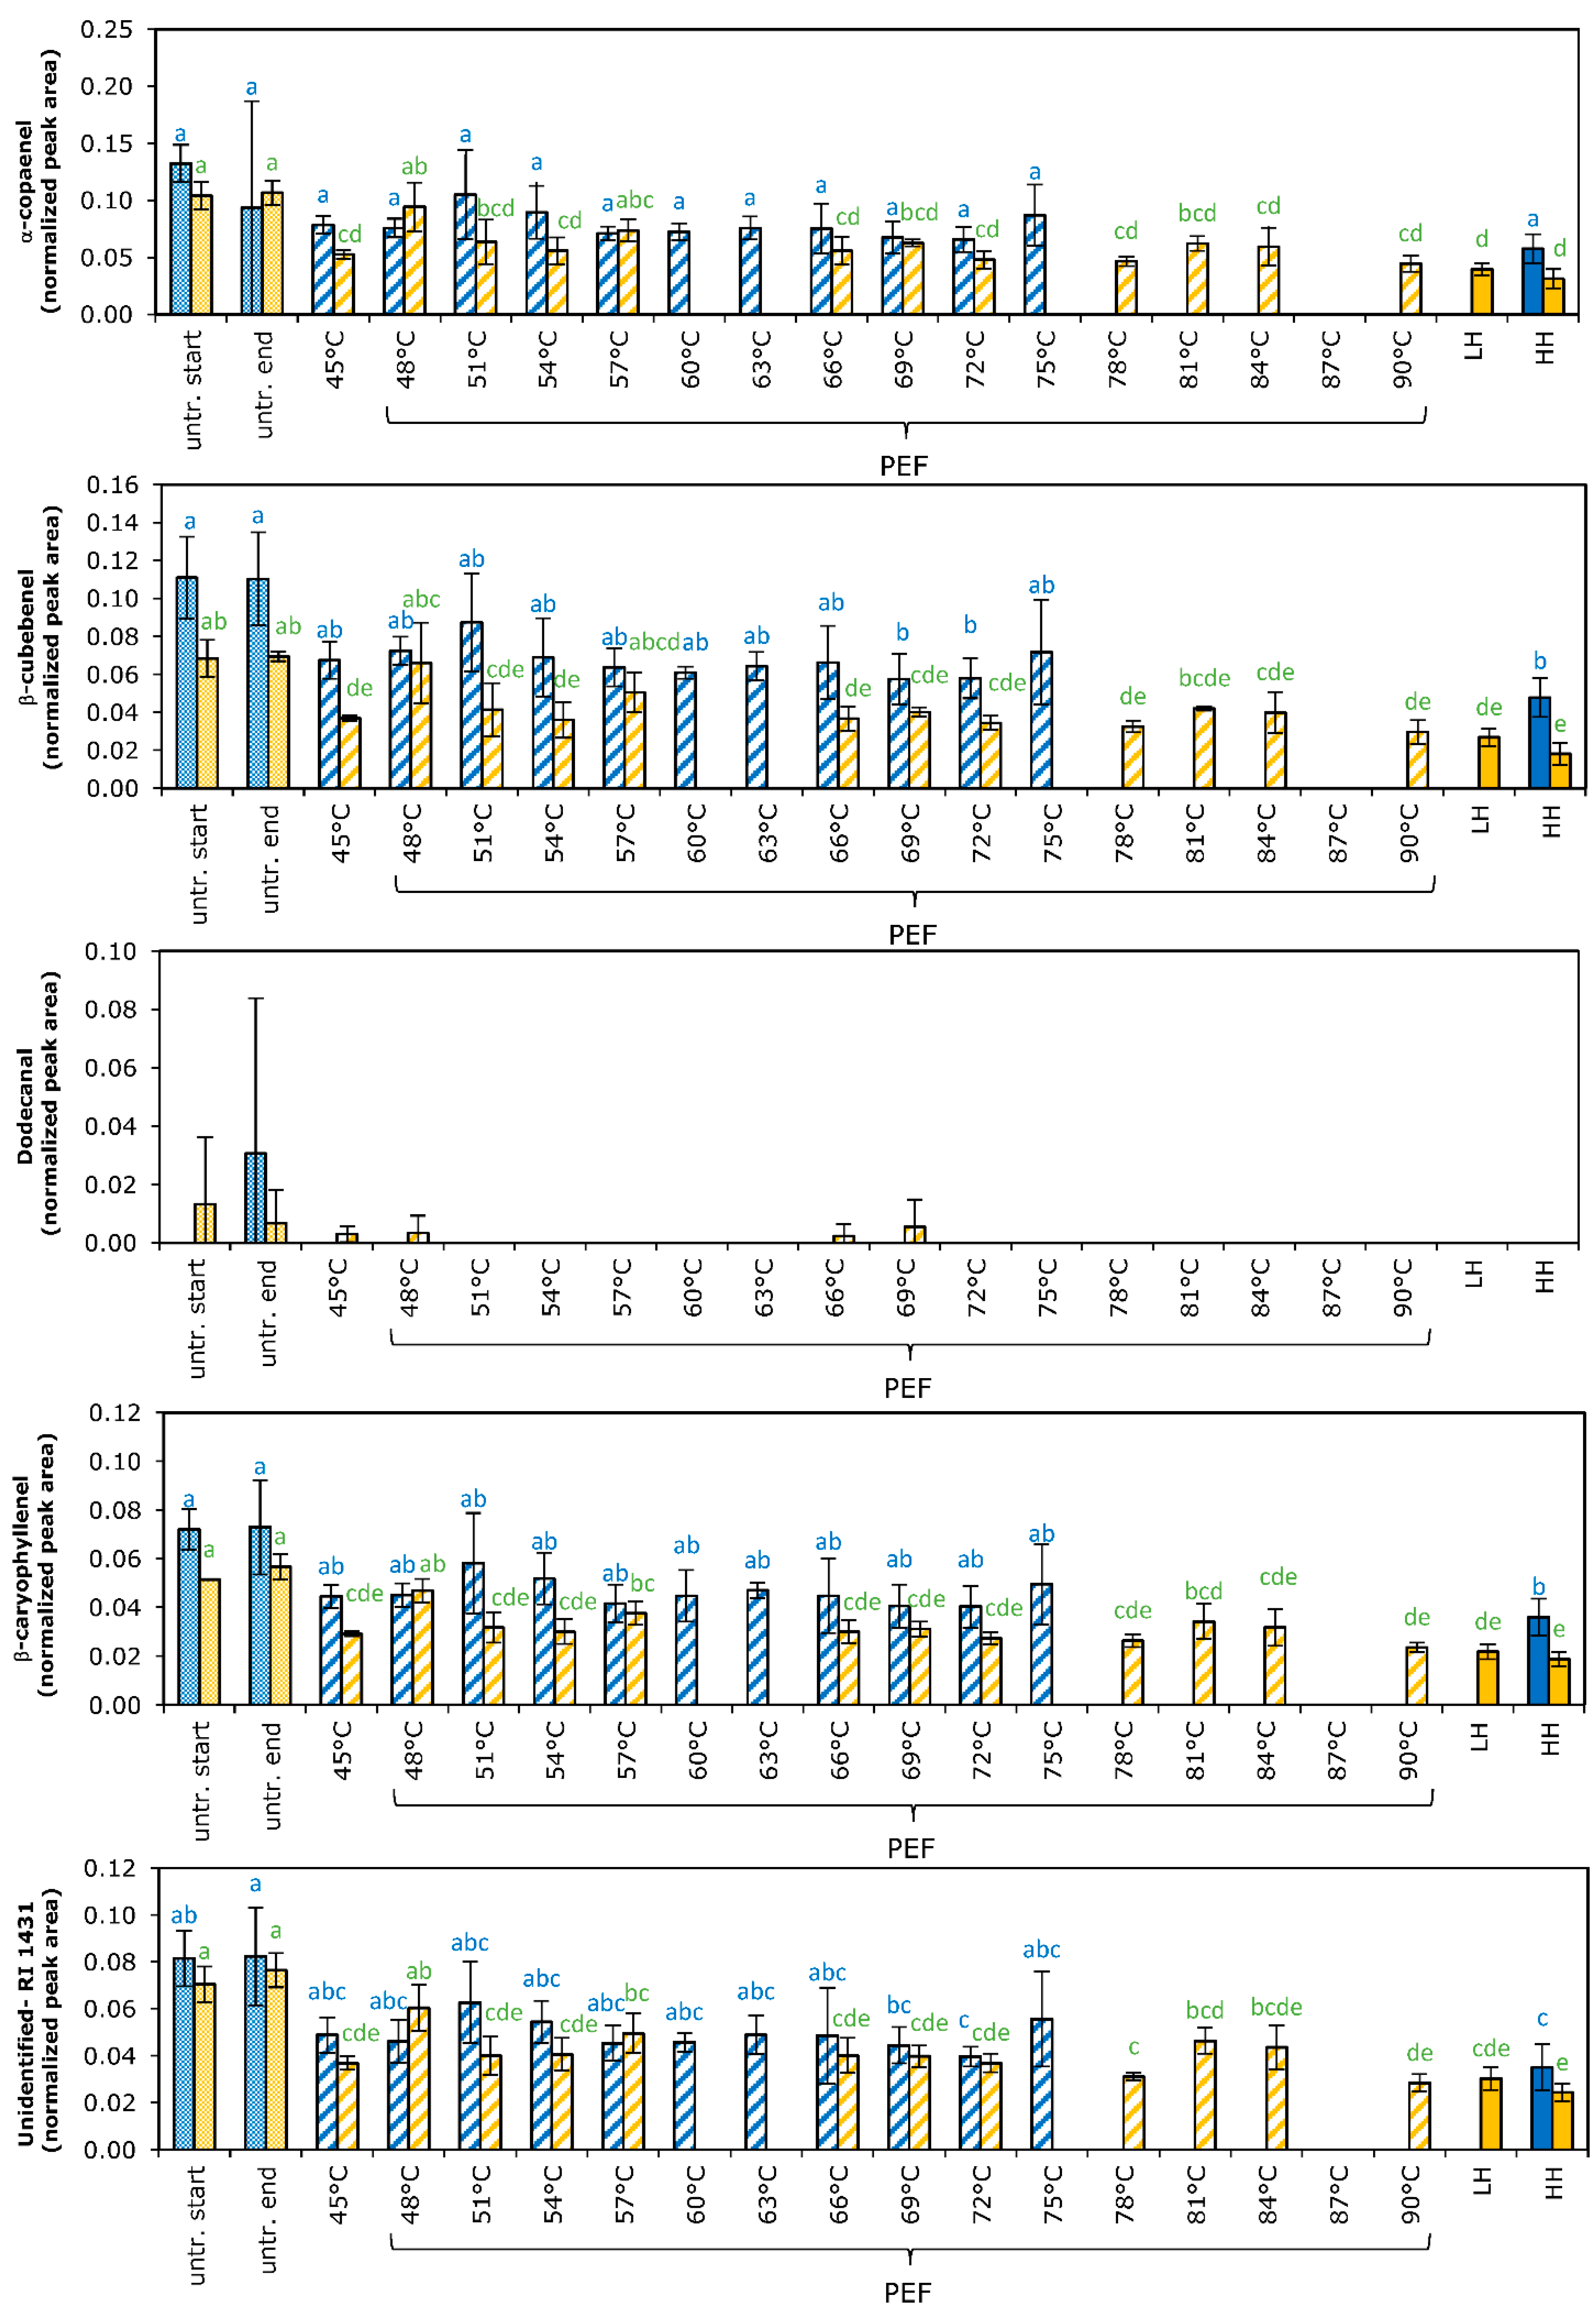
3.6. Volatiles
4. Conclusions
Author Contributions
Funding
Data Availability Statement
Acknowledgments
Conflicts of Interest
Appendix A. Volatile Compounds in Treated and Untreated Orange Juice


References
- Ramaswamy, H.S. Thermal Processing of fruits. In Processing Fruits: Science and Technology; Barrett, D.M., Somogyi, L., Ramaswamy, H.S., Eds.; CRC Press: Boca Raton, Fl, USA, 2004. [Google Scholar]
- Ağçam, E.; Akyildiz, A.; Dündar, B. Thermal Pasteurization and Microbial Inactivation of Fruit Juices. In Fruit Juices, Extraction, Composition, Quality and Analysis; Rajauria, G., Tiwari, B.K., Eds.; Academic Press: Cambridge, MA, USA, 2018; pp. 309–339. [Google Scholar] [CrossRef]
- Versteeg, C. Pectinesterase from the Orange Fruit—Their Purification, General Characteristics and Juice Cloud Destabilizing Properties. Ph.D. Thesis, Agricultural University Wageningen, Wageningen, The Netherlands, 1979. [Google Scholar]
- Valero, M.; Micol, V.; Saura, D.; Muñoz, N.; Lorente, J.; Marti, N. Comparison of antimicrobial treatments for citrus juices. In Plant Science Reviews; Hemming, D., Ed.; S R Nova Pvt Ltd.: Bangalore, India, 2010; pp. 63–74. [Google Scholar]
- Chen, C.S.; Wu, M.C. Kinetic models for thermal inactivation of multiple pectinesterases in citrus juice. J. Food Sci. 1998, 63, 747–750. [Google Scholar] [CrossRef]
- Cautela, D.; Castaldo, D.; Servillo, L.; Giovane, A. Enzymes in citrus processing. In Enzymes in Fruit and Vegetable Processing. Chemistry and Engineering Applications; Bayindirli, A., Ed.; CRC Press Taylor & Francis Group: Boca Raton, FL, USA, 2010. [Google Scholar]
- Chen, C.S.; Shaw, P.E.; Parish, M.E. Orange and tangerine juices. In Fruit Juice Processing Technology; Nagy, S., Chen, C.S., Eds.; AG Science Inc.: Auburndale, FL, USA, 1992. [Google Scholar]
- Eagerman, B.A.; Rouse, A.H. Heat inactivation temperature-time relationships for pectinesterase inactivation in citrus juice. J. Food Sci. 1976, 41, 1396–1397. [Google Scholar] [CrossRef]
- Braddock, R.J. Single strength orange juice and concentrate. In Handbook of Citrus by-Products and Processing Technology; Braddock, R.J., Ed.; Wiley: New York, NY, USA, 1999; pp. 53–64. [Google Scholar]
- Nagy, S.; Rouseff, R.L.; Lee, H.S. Thermally degraded flavors in citrus juice products. In Thermal Degradation of Aromas; Parliment, T.H., McGorrin, R.J., Ho, C.-T., Eds.; American Chemical Society: Washington, DC, USA, 1989. [Google Scholar]
- Perez-Cacho, P.R.; Rouseff, R. Processing and storage effects on orange juice aroma: A review. J. Agric. Food Chem. 2008, 56, 9785–9796. [Google Scholar] [CrossRef] [PubMed]
- Lee, H.S.; Coates, G.A. Effect of thermal pasteurization on Valencia orange juice color and pigments. LWT Food Sci. Technol. 2003, 36, 153–156. [Google Scholar] [CrossRef]
- Knorr, D.; Froehling, A.; Jaeger, H.; Reineke, K.; Schlueter, O.; Schoessler, K. Emerging Technologies in Food Processing. Annu. Rev. Food Sci. Technol. 2011, 2, 203–235. [Google Scholar] [CrossRef] [Green Version]
- Atuonwu, J.C.; Leadley, C.; Bosman, A.; Tassou, S.A. High-pressure processing, microwave, ohmic, and conventional thermal pasteurization: Quality aspects and energy economics. J. Food Process Eng. 2019, 43, e13328. [Google Scholar] [CrossRef]
- Roobab, U.; Abida, A.; Chacha, J.S.; Athar, A.; Madni, G.M.; Ranjha, M.; Modassar, A.N.; Rusu, A.V.; Zeng, X.; Aadil, R.M.; et al. Applications of Innovative Non-Thermal Pulsed Electric Field Technology in Developing Safer and Healthier Fruit Juices. Molecules 2022, 27, 4031. [Google Scholar] [CrossRef]
- Timmermans, R.A.H.; Mastwijk, H.C.; Berendsen, L.B.J.M.; Nederhoff, A.L.; Matser, A.M.; Van Boekel, M.A.J.S.; Nierop Groot, M.N. Moderate intensity Pulsed Electric Fields (PEF) as alternative mild preservation technology for fruit juice. IJFM 2019, 298, 63–73. [Google Scholar] [CrossRef]
- Timmermans, R.A.H.; Mastwijk, H.C.; Knol, J.J.; Quataert, M.C.J.; Vervoort, L.; Van der Plancken, I.; Hendrickx, M.E.; Matser, A.M. Comparing equivalent thermal, high pressure and pulsed electric field processes for mild pasteurisation of orange juice. Part I: Impact on overall quality attributes. IFSET 2011, 12, 235–243. [Google Scholar] [CrossRef]
- Vervoort, L.; Van der Plancken, I.; Grauwet, T.; Timmermans, R.A.H.; Mastwijk, H.C.; Matser, A.M.; Hendrickx, M.E.; Van Loey, A. Comparing equivalent thermal, high pressure and pulsed electric field processes for mild pasteurization of orange juice. Part II: Impact on specific chemical and biochemical quality parameters. IFSET 2011, 12, 466–477. [Google Scholar] [CrossRef]
- Vervoort, L.; Grauwet, T.; Kebede, B.T.; Van der Plancken, I.; Timmermans, R.; Hendrickx, M.; Van Loey, A. Headspace fingerprinting as an untargeted approach to compare novel and traditional processing technologies: A case-study on orange juice pasteurisation. Food Chem. 2012, 134, 2303–2312. [Google Scholar] [CrossRef] [PubMed]
- Buckow, R.; Ng, S.; Toepfl, S. Pulsed Electric Field Processing of orange juice: A review on microbial, enzymatic, nutritional, and sensory quality and stability. Compr. Rev. Food Sci. Food Saf. 2013, 12, 455–467. [Google Scholar] [CrossRef] [PubMed]
- Tetra, P. The Orange Book; Tetra Pak Processing Systems AB: Lund, Sweden, 2004. [Google Scholar]
- Bognár, A.; Daood, H.G. Simple in-line postcolumn oxidation and derivatization for the simultaneous analysis of ascorbic and dehydroascorbic acids in foods. J. Chromatogr. Sci. 2000, 38, 162–168. [Google Scholar] [CrossRef] [PubMed] [Green Version]
- Redd, B.J.; Hendrix, C.M.; Hendrix, D.L. Pectinesterase enzyme activity. In Quality Control Manual for Citrus Processing Plants. Book 1: Regulations, Citrus Methodology, Microbiology, Conversion Charts, Tables, Other; Redd, B.J., Hendrix, C.M., Hendrix, D.L., Eds.; Intercit: FL, USA, 1986. [Google Scholar]
- Acree, T.; Arn, H. Flavornet and Human Odor Space. 2004. Available online: http://www.flavornet.org (accessed on 29 August 2022).
- Bylaite, E.; Meyer, A.S. Characterisation of volatile aroma compounds of orange juices by three dynamic and static headspace gas chromatography techniques. Eur. Food Res. Technol. 2006, 222, 176–184. [Google Scholar] [CrossRef]
- Dharmawan, J.; Kasapis, S.; Curran, P.; Johnson, J.R. Characterization of volatile compounds in selected citrus fruits from Asia. Part I: Freshly-squeezed juice. Flavour. Fragr. J. 2007, 22, 228–232. [Google Scholar] [CrossRef]
- Trammel, D.J.; Dalsis, D.E.; Malone, C.T. Effect of oxygen on taste, ascorbic acid loss and browning for HTST-pasteurized, single-strength orange juice. J. Food Sci. 1986, 51, 1021–1023. [Google Scholar] [CrossRef]
- Jordán, M.J.; Goodner, K.L.; Laencina, J. Deaeration and pasteurization effects on the orange juice aromatic fraction. LWT Food Sci. Technol. 2003, 36, 391–396. [Google Scholar] [CrossRef]
- Braddock, R.J. Composition, properties and evaluation of fruit components. In Handbook of Citrus by-Products and Processing Technology; Braddock, R.J., Ed.; Wiley: New York, NY, USA, 1999; pp. 21–33. [Google Scholar]
- Harding, P.L.; Winston, J.R.; Fisher, D.F. Seasonal changes in Florida oranges. In: US Department of Agriculture. Tech. Bull. 1940, 753, 1–97. [Google Scholar]
- Bull, M.K.; Zerdin, K.; Howe, E.; Goicoechea, D.; Paramanandhan, P.; Stockman, R.; Sellahewa, J.; Szabo, A.E.; Johnson, R.L.; Stewart, C.M. The effect of high pressure processing on the microbial, physical and chemical properties of Valencia and Navel orange juice. IFSET 2004, 5, 135–149. [Google Scholar] [CrossRef]
- Nagy, S.; Smoot, J.M. Temperature and storage effect on percent retention and percent U.S. recommended dietary allowance of vitamin C in canned single-strength orange juice. J. Agric. Food Chem. 1977, 25, 135–138. [Google Scholar] [CrossRef]
- Meléndez-Martínez, A.J.; Vicario, I.M.; Heredia, F.J. Rapid assessment of vitamin A activity through objective color measurements for the quality control of orange juices with diverse carotenoid profiles. J. Agric. Food Chem. 2007, 55, 2808–2815. [Google Scholar] [CrossRef]
- Genovese, D.B.; Elustondo, M.P.; Lozano, J.E. Color and cloud stabilization in cloudy apple juice by steam heating during crushing. J. Food Sci. 1997, 62, 1171–1175. [Google Scholar] [CrossRef]
- Ting, S.V. Nutrients and Nutrition of Citrus Fruits. In Citrus Nutrition and Quality; Nagy, S., Attaway, J.A., Eds.; American Chemical Society: Washington, DC, USA, 1980. [Google Scholar]
- Combs, G.F.; McClung, J.P. Vitamin C. In The Vitamins, 5th ed.; Combs, G.F., McClung, J.P., Eds.; Academic Press: Cambridge, MA, USA, 2017; chapter 10. [Google Scholar]
- Rotschild, G.; Van Vliet, C.; Karsenty, A. Pasteurization conditions for juices and comminuted products of Israeli citrus fruits. J. Food Technol. 1975, 10, 29–38. [Google Scholar] [CrossRef]
- Rouse, A.H.; Atkins, C.D. Further results from a study on heat inactivation of pectinesterase in citrus juices. Food Technol. 1953, 7, 221–223. [Google Scholar]
- Amaro, K.C.; Tadini, C.C. The optimal time-temperature conditions for orange juice microwave−assisted pasteurization. LWT 2021, 150, 111907. [Google Scholar] [CrossRef]
- Holland, R.R.; Reeder, S.K.; Pritchett, D.E. Cloud stability test for pasteurised citrus juices. J. Food Sci. 1976, 41, 812–815. [Google Scholar] [CrossRef]
- Jaeger, H.; Meneses, N.; Moritz, J.; Knorr, D. Model for the differentiation of temperature and electric field effects during thermal assisted PEF processing. J. Food Eng. 2010, 100, 109–118. [Google Scholar] [CrossRef]
- Van Loey, A.; Verachtert, B.; Hendrickx, M. Effects of high electric field pulses on enzymes. Trends Food Sci. Technol. 2002, 12, 94–102. [Google Scholar] [CrossRef]
- Perez-Cacho, P.R.; Rouseff, R. Fresh squeezed orange juice odor: A review. Crit. Rev. Food Sci. Nutr. 2008, 48, 681–695. [Google Scholar] [CrossRef]
- Bazemore, R.; Goodner, K.; Rouseff, R. Volatiles from unpasteurized and excessively heated orange juice analysed with solid phase microextraction and GC-Olfactometry. Food Chem. Toxicol. 1999, 64, 800–803. [Google Scholar] [CrossRef]
- Mastello, R.B.; Capobiango, M.; Chin, S.-T.; Monteiro, M.; Marriott, P.J. Identification of odour-active compounds of pasteurized orange juice using multidimensional gas chromatography techniques. Food Res. Int. 2015, 75, 281–288. [Google Scholar] [CrossRef] [PubMed]
- Kopuncová, M.; Sádecká, J.; Kolek, E.; Dimitrov, F.; Tobolková, B.; Durec, J.; Blaško, J. Aroma stability and sensory aspects of commercially produced orange juice: Gas chromatography–olfactometry study. Chem. Pap. 2022, 76, 4941–4953. [Google Scholar] [CrossRef]
- Leizerson, S.; Shimoni, E. Effect of ultrahigh-temperature continuous ohmic heating treatment on fresh orange juice. J. Agric. Food Chem. 2005, 53, 3519–3524. [Google Scholar] [CrossRef]
- Min, S.; Jin, Z.T.; Min, S.K.; Yeom, H.; Zhang, Q.H. Commercial-scale pulsed electric field processing of orange juice. JFS Food Chem. Toxicol. 2003, 68, 1265–1271. [Google Scholar] [CrossRef]
- Lee, H.; Choi, S.; Kim, E.; Kim, Y.-N.; Lee, J.; Lee, D.-U. Effects of Pulsed Electric Field and Thermal Treatments on Microbial Reduction, Volatile Composition, and Sensory Properties of Orange Juice, and Their Characterization by a Principal Component Analysis. Appl. Sci. 2021, 11, 186. [Google Scholar] [CrossRef]
- Walsh, M.; Rouseff, R.; Naim, M. Determination of furaneol and p-vinylguaiacol in orange juice employing differential UV wavelight and fluorescence detection with a unified solid phase extraction. J. Agric. Food Chem. 1997, 45, 1320–1324. [Google Scholar] [CrossRef]


| Juice | E (kV/cm) | τ (µs) | Treatment Chamber (Diameter × length) (mm) | Residence Time (ms) | Pulse Repetition Frequency (Hz) | Number of Pulses Applied | Specific Electric Energy (kJ/kg) | Tmax (°C) |
|---|---|---|---|---|---|---|---|---|
| A | 2.7 | 1000 | 1.0 × 2.0 | 14 | 0–112 | 0–3.2 | 0–114 | 45–75 |
| B | 0.9 | 1000 | 4.0 × 6.0 | 696 | 0–48 | 0–67 | 0–171 | 45–90 |
| No. | RI | Compound Name | Class | Identification § | Trends in Juice A * | Trends in Juice B * | Impact on Orange Juice Flavor |
|---|---|---|---|---|---|---|---|
| 1 | <800 | Ethanol | Alcohol | MS | U a = PEF a = Heat a | U a = PEF a = Heat a | |
| 2 | <800 | Ethyl acetate | Ester | MS | U a = PEF a = Heat a | U a = PEF a = Heat a | Background aroma, contributing to naturalness † |
| 3 | 802 | Ethyl butyrate | Ester | MS, RI | U a = PEF a = Heat a | U a = PEF a = Heat a | Key odorant in fresh orange juice† |
| 4 | 863 | 2-Hexenal | Aldehyde | MS, RI, St. | U a = PEF a = Heat a | n.d. | |
| 5 | 932 | α-Pinene | Monoterpene | MS, RI, St. | U ab > PEF abc = Heat c | U ab > PEF bcdef = Heat ef | Background aroma, contributing to naturalness † |
| 6 | 972 | Sabinene | Monoterpene | MS, RI, St. | U ab > PEF abcd > Heat d | U a > PEFbcde > Heat ef | |
| 7 | 977 | β-Pinene | Monoterpene | MS, RI, St. | U ab > PEF abc = Heat c | U ab > PEFbcd = Heat d | Background aroma, contributing to naturalness † |
| 8 | 990 | β-Myrcene | Monoterpene | MS, RI, St. | U ab > PEF abcd > Heat d | U ab > PEF abcd ≥ Heat d | Background aroma, contributing to naturalness † |
| 9 | 1002 | β-Phellandrene | Monoterpene | tentative | U a = PEF a = Heat a | U a = PEF a = Heat a | |
| 10 | 1005 | Octanal | Aldehyde | MS, RI, St. | U ab > PEF abc > Heat d | U ab ≥ PEF abc ≥ Heat c | Key odorant in fresh orange juice † |
| 11 | 1008 | 3-carene | Monoterpene | MS, RI, St. | U ab > PEF abc = Heat c | U ab > PEF abcd = Heat cd | |
| 12 | 1014 | Unidentified | - | U a = PEF a = Heat a | U a = PEF a = Heat a | ||
| 13 | 1017 | α-Terpinene | Monoterpene | MS, RI | U a = PEF a = Heat a | U ab = PEF ab < Heat ab | Background aroma, contributing to naturalness † |
| 14 | 1036 | Limonene | Monoterpene | MS, RI | U ab > PEF abc = Heat c | U ab > PEF bcde = Heat e | Necessary for aroma, function uncertain † |
| 15 | 1048 | Ocimene | Monoterpene | MS, RI, St. | U a = PEF a = Heat a | U ab > PEF bcd = Heat cd | |
| 16 | 1059 | γ-Terpinene | Monoterpene | MS, RI | U ab = PEF ab ≤ Heat b | U a = PEF a = Heat a | |
| 17 | 1073 | 1-Octanol | Alcohol | MS, RI | U a = PEF a = Heat a | U a = PEF a = Heat a | Background aroma, contributing to naturalness † |
| 18 | 1086 | Terpinolene | Monoterpene | MS, RI | U ab > PEF ab = Heat ab | U ab > PEF abc = Heat abc | |
| 19 | 1099 | β-Linalool | Monoterpene alcohol | MS, RI | U a = PEF a = Heat a | U abcd = PEF abcd > Heat bcd | Key odorant in fresh orange juice † |
| 20 | 1105 | Nonanal | Aldehyde | MS, RI | U a = PEF a = Heat a | U ab ≥ PEF<78C abc ≥ PEF≥78C bc = Heat c | Key odorant in fresh orange juice † |
| 21 | 1182 | 4-Terpineol | Monoterpene alcohol | MS, RI | U ab = PEF ab < Heat c | U abcd = PEF<72C abcd ≤ PEF≥72C abcde = Heat bcde | Background aroma, contributing to naturalness †, |
| marker for heat-abuse, off-flavor at high conc. ‡ | |||||||
| 22 | 1196 | α-Terpineol | Monoterpene alcohol | MS, RI | U a = PEF a = Heat a | U abc = PEF<72C ab ≤ PEF≥72C abc = Heat abc | Marker for heat-abuse, off-flavor at high conc. # |
| 23 | 1207 | Decanal | Aldehyde | MS, RI | U ab > PEF ab = Heat b | U ab > PEF abcd ≥ Heat cd | Key odorant in fresh orange juice † |
| 24 | 1239 | Neral | Monoterpene aldehyde | MS, RI | U a = PEF a = Heat a | U a = PEF a = Heat a | Key odorant in fresh orange juice † |
| 25 | 1267 | Geranial | Monoterpene aldehyde | MS, RI | U a = PEF a = Heat a | U a = PEF a = Heat a | Key odorant in fresh orange juice † |
| 26 | 1377 | α-Copaene | Sesquiterpene | MS, RI | U a = PEF a = Heat a | U a > PEF abcd > Heat d | |
| 27 | 1389 | β-Cubebene | Sesquiterpene | MS, RI | U a > PEF ab > Heat b | U ab > PEF abcde ≥ Heat de | |
| 28 | 1408 | Dodecanal | Aldehyde | MS, RI | n.d. | n.d. | Background aroma, contributing to naturalness † |
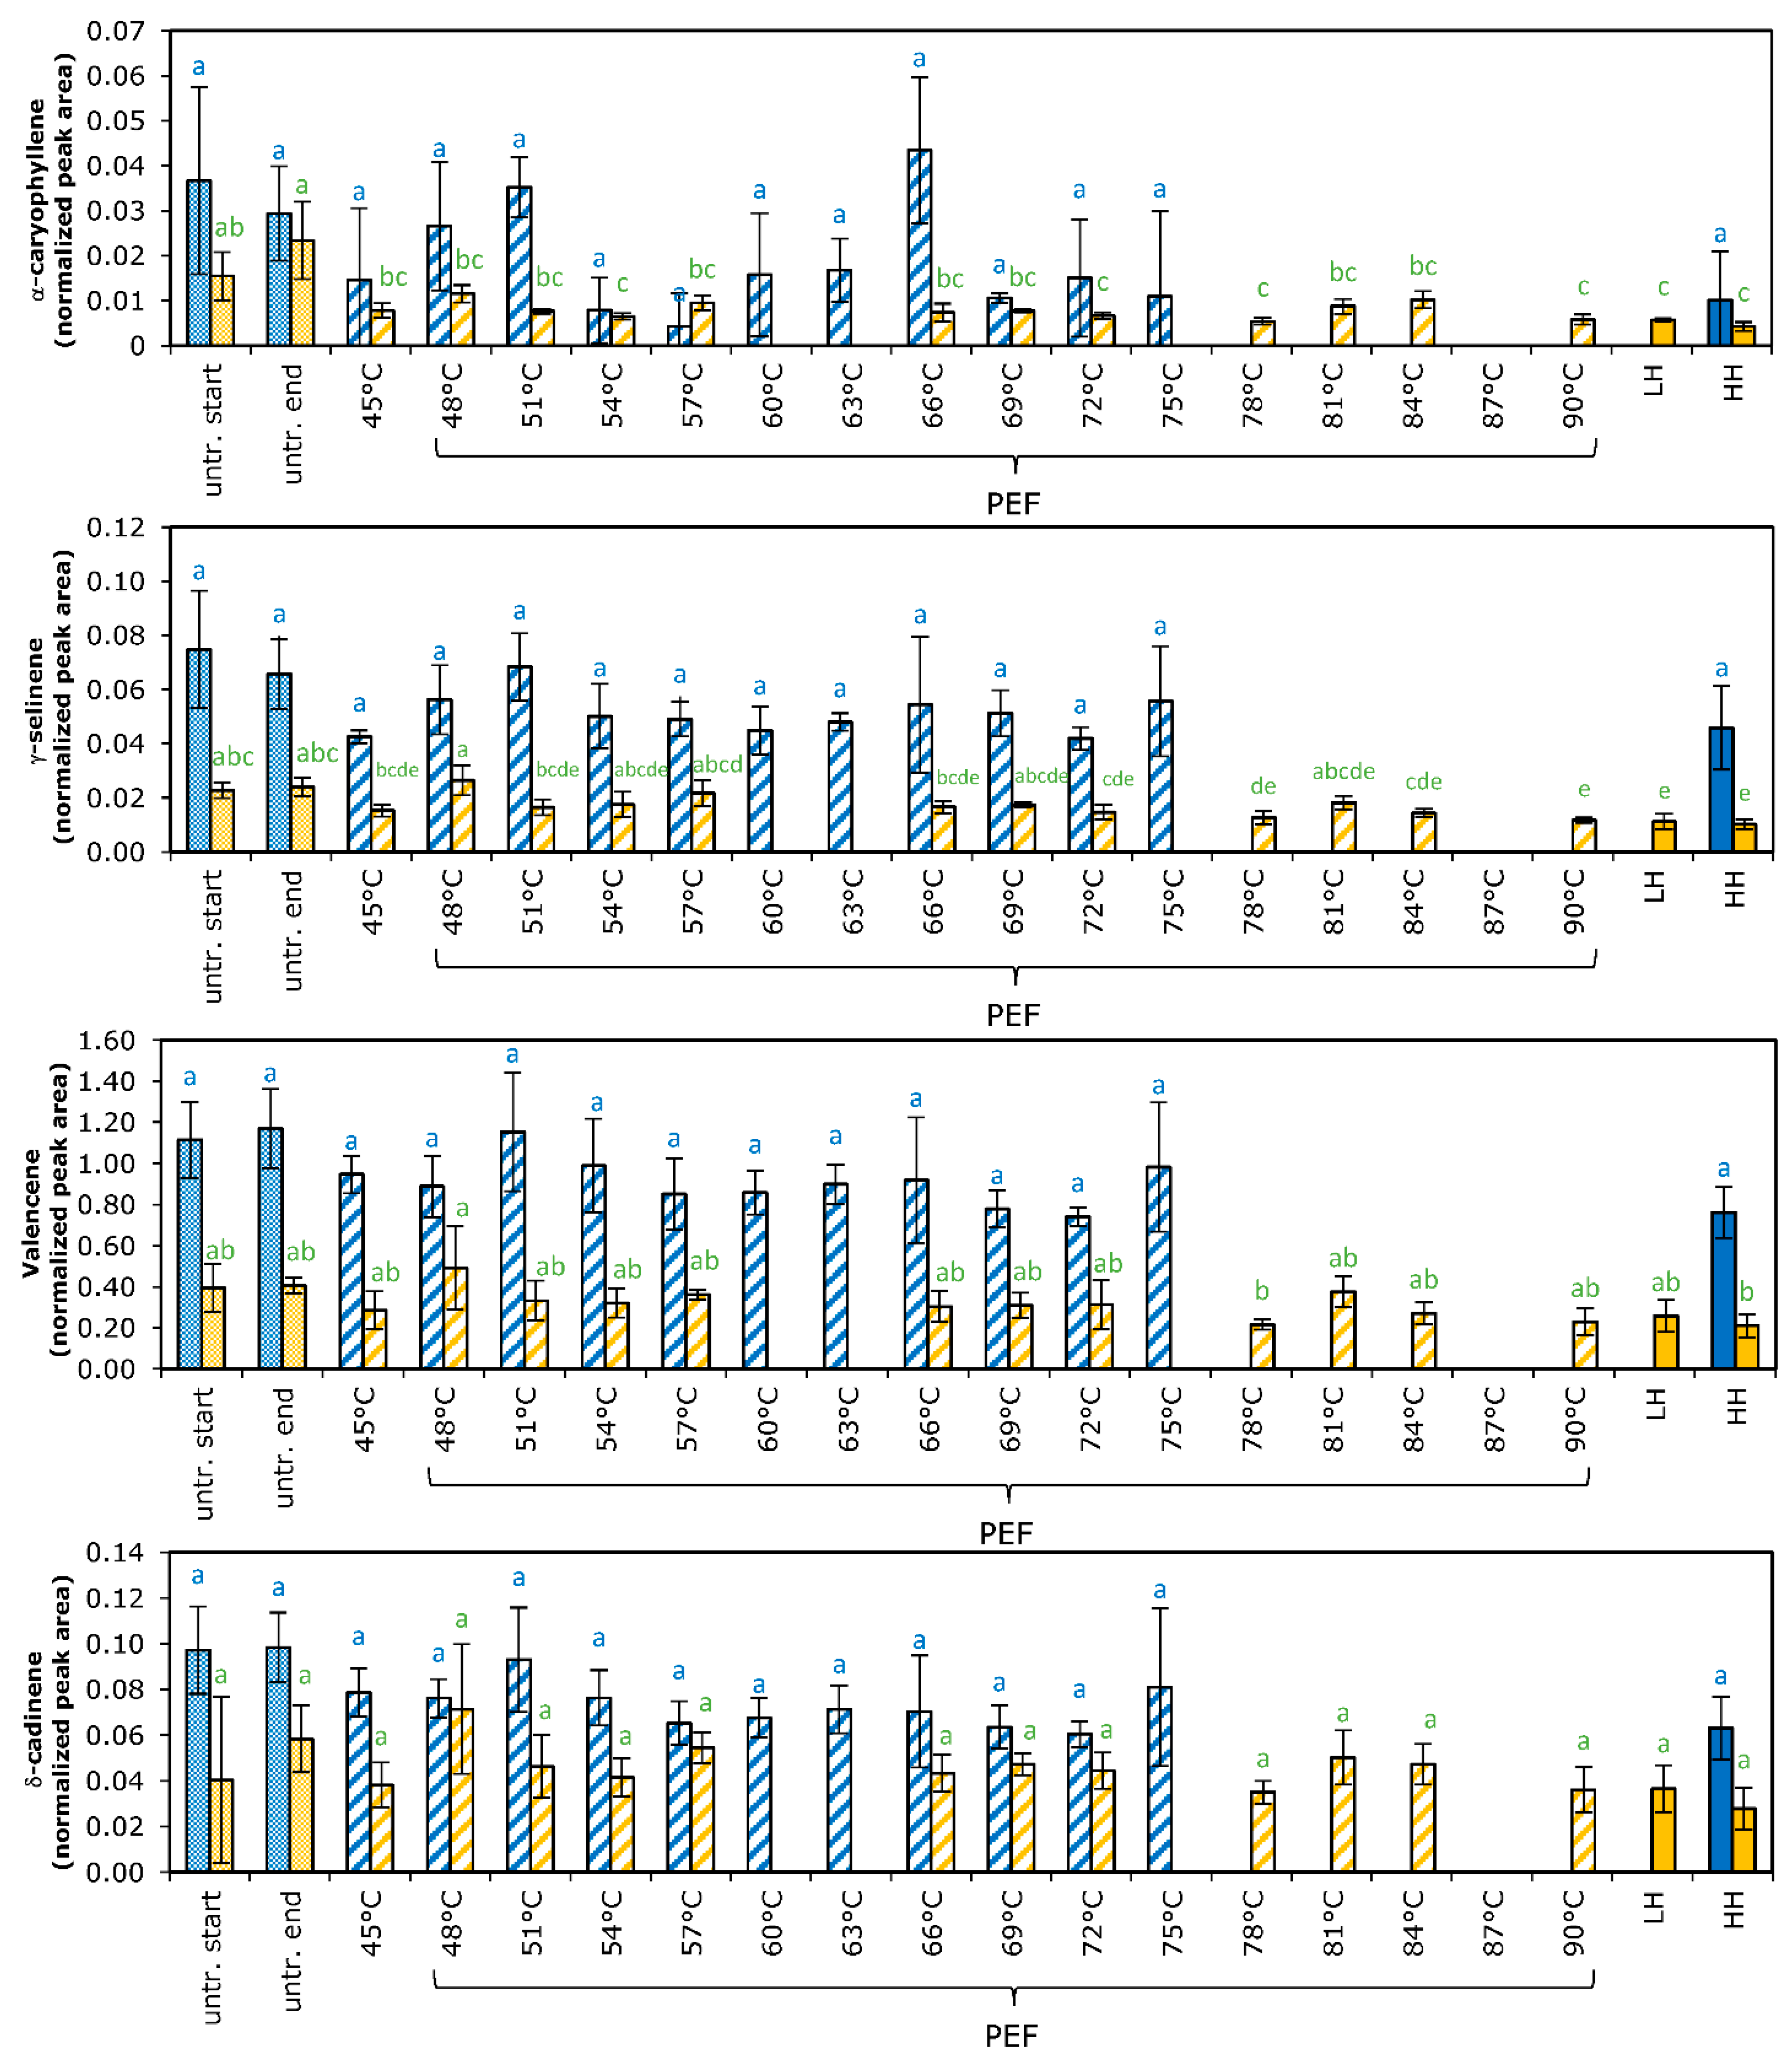
| 29 | 1420 | β-Caryophyllene | Sesquiterpene | MS, RI | U a > PEF ab > Heat b | U a > PEF abcde ≥ Heat de | |
| 30 | 1431 | Unidentified | Sesquiterpene | - | U ab > PEF abc > Heat c | U a > PEF abcde ≥ Heat cde | |
| 31 | 1456 | α-Caryophyllene | Sesquiterpene | MS, RI | U a = PEF a = Heat a | U ab > PEF bc = Heat c | |
| 32 | 1484 | γ-Selinene | Sesquiterpene | MS, RI | U a = PEF a = Heat a | U abc = PEF abcde ≥ Heat e | |
| 33 | 1493 | Valencene | Sesquiterpene | MS, RI | U a = PEF a = Heat a | U ab = PEF ab = Heat ab | |
| 34 | 1522 | δ-Cadinene | Sesquiterpene | MS, RI | U a = PEF a = Heat a | U a = PEF a = Heat a |
Publisher’s Note: MDPI stays neutral with regard to jurisdictional claims in published maps and institutional affiliations. |
© 2022 by the authors. Licensee MDPI, Basel, Switzerland. This article is an open access article distributed under the terms and conditions of the Creative Commons Attribution (CC BY) license (https://creativecommons.org/licenses/by/4.0/).
Share and Cite
Timmermans, R.A.H.; Roland, W.S.U.; van Kekem, K.; Matser, A.M.; van Boekel, M.A.J.S. Effect of Pasteurization by Moderate Intensity Pulsed Electric Fields (PEF) Treatment Compared to Thermal Treatment on Quality Attributes of Fresh Orange Juice. Foods 2022, 11, 3360. https://doi.org/10.3390/foods11213360
Timmermans RAH, Roland WSU, van Kekem K, Matser AM, van Boekel MAJS. Effect of Pasteurization by Moderate Intensity Pulsed Electric Fields (PEF) Treatment Compared to Thermal Treatment on Quality Attributes of Fresh Orange Juice. Foods. 2022; 11(21):3360. https://doi.org/10.3390/foods11213360
Chicago/Turabian StyleTimmermans, Rian A. H., Wibke S. U. Roland, Kees van Kekem, Ariette M. Matser, and Martinus A. J. S. van Boekel. 2022. "Effect of Pasteurization by Moderate Intensity Pulsed Electric Fields (PEF) Treatment Compared to Thermal Treatment on Quality Attributes of Fresh Orange Juice" Foods 11, no. 21: 3360. https://doi.org/10.3390/foods11213360