
The Riddle of How Fisheries Influence Genetic Diversity


Department of Biological and Environmental Science, University of Jyväskylä, 40500 Jyväskylä, Finland
*
Author to whom correspondence should be addressed.
Fishes 2023, 8(10), 510; https://doi.org/10.3390/fishes8100510
Submission received: 31 August 2023
/
Revised: 5 October 2023
/
Accepted: 12 October 2023
/
Published: 13 October 2023
(This article belongs to the Section Biology and Ecology)
Abstract
:Overfishing drives population decline, which in turn drives loss of genetic diversity. Many studies provide evidence of declines in genetic diversity; however, controversy exists within the literature, as some studies show evidence of no change in genetic diversity despite decades of overharvesting. The apparent discrepancy in the literature should therefore be examined to understand what biological and ecological processes are driving the differences in results. Here, we assess how different factors contribute to fisheries-induced susceptibility to declines in genetic diversity by first focusing on the different roles of genetic markers. Second, we assess how habitat type and conditions contribute to loss of genetic diversity. Third, we assess how life history and physiology affects catchability and loss of genetic diversity. Finally, we discuss how coinciding abiotic and biotic factors influence the intensity of genetic loss. We find a multitude of these factors could be interacting to influence how results are perceived and how intense the loss of genetic diversity can be. Future studies should carefully consider the methodology of genetic analysis used, as well as considerations of life history and ecology of the target species.
Key Contribution: This review assesses the importance of considering multiple factors that could affect the vulnerability of an overfished population to loss of genetic diversity.
1. Introduction
Fish stocks are a crucial source of livelihood and nutrition, providing 156 million tonnes of food per annum, representing some 17% of global animal protein consumed [1]. However, because of a 122% increase in fish consumption along with historic overharvesting, the percentage of fish stocks that are harvested sustainably has reduced from 90% to 65.8% from 1990 to 2017 [1]. Overfishing not only causes concerns for global food security, but also remains at the forefront of the anthropogenic problems the aquatic environment faces, causing severe population declines and habitat destruction [2,3,4]. Indeed, the modern consensus is that despite the high fecundity of many fish species (e.g., with individuals of certain species capable of producing tens to hundreds of thousands of eggs in a spawning event), this is not enough to maintain a sustainable stock under intensive harvesting [5]. Current predictions suggest fish stocks may become exhausted by 2050 [6,7], which not only results in population losses, but a potential loss of standing genetic diversity [8], leading to localised ecosystem collapse, as already experienced in places such as the Black Sea [9].
Because fishing mortality can be extremely high and fisheries are often also selectively removing certain phenotypes from the population (i.e., exposing fish populations to directional selection), fisheries can be expected to reduce genetic diversity in an exploited population. Indeed, directional selection, often occurring through size-selection favouring the smallest individuals in a population, will not only act on phenotypic traits (e.g., body size, age at maturation, and reproductive output [10]), but also on the associated genetic structure. As such, directional selection can act in tandem with demographic loss to enhance the loss of genetic diversity. Decline in genetic diversity can lead to reduced adaptive potential [11,12]. However, there is some debate whether neutral diversity can be truly representative of adaptive potential, as the genes detected do not have any direct effect on population fitness [13]. Reductions in adaptive potential can lead to increased vulnerability to future anthropogenic stressors. The reduction in genetic diversity can cause reduced phenotypic variability, which in turn may affect population viability and stability [14]. Indeed, evidence for reduced genetic diversity in exploited fish stocks has been reported by various studies, for example, as an increase in inbreeding coefficient or a reduction in effective population size [8,15,16].
Many studies have tried to assess the effect of fishing stress on the genetic diversity of fish populations with mixed results, with some studies showing clear declines in genetic diversity. For example, Hauser et al. [15] showed that the overexploitation of the New Zealand snapper (Pagrus auratus) resulted in a large reduction in both genetic diversity (heterozygosity and number of alleles) and effective population size (Ne). However, Jones et al. [17] found higher Ne values than expected in the original study by incorporating a larger sample size and simulation-based methods, though, despite this, Ne was still found to be lower in exploited populations than in non-exploited populations. In contrast, other studies have found no significant reductions in genetic diversity in overexploited stocks, such as in Atlantic cod (Gadus morhua) stocks [5,18,19,20]. However, stocks experiencing relatively low catch rates, such as mango tilapia (Sarotherodon galilaeus) in the sea of Galilee, show a significant loss in genetic diversity [21]. Pinsky and Palumbi [8] completed a comprehensive meta-analysis utilising 140 species, demonstrating an overall trend that overharvest resulted in a decline in genetic diversity across marine fish species, while some studies show no apparent genetic loss when exposed to fishing stress [16,22,23]. It is therefore important to understand why some studies apparently demonstrate clear evidence for loss of genetic diversity when exposed to fishing stress, whilst others do not. The possible reasons why some stocks do not exhibit a notable loss of genetic diversity appear complex, and the literature remains divided.
The magnitude of mortality rates and the intensity of directional selection determine how much fisheries can erode genetic diversity in a population, alongside initial population size, refugia from fisheries, and migration rate [8]. However, the variance in results from the literature suggests that many other factors that influence genetic diversity must be considered. This discrepancy may be a result of changes in genetic technologies resulting in differing resolutions between genetic markers such as single-nucleotide polymorphisms (SNPs) and microsatellites (e.g., [24]). Furthermore, habitat diversity may have an influence, for example, due to factors such as habitat complexity that may affect vulnerability of being caught by fishing gear (i.e., catchability; [25,26]), species metapopulation structure (which determines patterns of dispersal among populations), and/or whether a species’ range encompasses protected areas. Moreover, life history and behavioural traits can affect catchability and consequently loss of genetic diversity [27]. It is also important to note the evolutionary history of a population, and how different species differ in their vulnerability to fisheries stress based on their evolved set of life history traits [28]. Finally, overfishing is not the only stressor evident in the aquatic environment, with further anthropogenic effects such as climate change and habitat loss likely contributing to exacerbating the loss of genetic diversity [25].
In this literature review, we will assess how different factors contribute to fisheries-induced susceptibility to reductions in genetic diversity and aim to unravel why discrepancy in population responses in the literature exists. First, we focus on the role of different genetic markers and metrics used to measure variability in genetic diversity produced by the different studies. Second, we consider how habitat type and conditions can contribute to the fisheries-induced loss of genetic diversity. Third, we assess the effect of life history traits on catchability and loss of genetic diversity, and finally discuss how coinciding factors influence the intensity of genetic loss.
2. Genetic Markers and Metrics
Studies focusing on detecting potential fisheries-induced changes in genetic diversity have used different genetic markers. One reason why the interpretations of fisheries’ effects on genetic diversity vary could be related to the markers together with the metrics utilised in these studies [24,29]. Here, we review the most common markers used in the studies and discuss how and why they might produce different results.
2.1. AFLPs
Pioneering studies on genetic diversity utilised DNA fingerprinting in the form of amplified fragment length polymorphisms (AFLPs). This technique utilises restriction enzymes to digest DNA, creating restriction fragments which are then amplified, allowing the detection of DNA polymorphisms [30]. AFLPs were popular as they were an easy and cheap way to obtain high-quality genomic data [31,32], and they have been used in genetic diversity studies in fisheries research. For example, Wan et al. [33], used DNA fingerprinting to assess changes in the genetic diversity of Dabry’s sturgeon (Acipenser dabryanus) from 1958 to 1999 after large-scale declines, partly due to overfishing, and showed a significant reduction in genetic diversity. AFLPs are robust, highly reproduceable, and can be informative in large numbers [31]. However, AFLPs are often difficult to analyse, requiring high-quality, highly pure DNA, and as a dominant marker they do not detect heterozygotes. Hence, the technique has been mostly replaced by other techniques [31,34].
2.2. Mitochondrial DNA
Mitochondrial DNA (mtDNA) is being used more often to assess changes in genetic diversity compared to AFLPs [21,35,36,37,38]. This technique utilises cytochrome c oxidase subunit I (COI) and the D-loop section of mtDNA. Interestingly, studies using mtDNA ubiquitously show a decline in genetic diversity caused by fisheries [37,38,39]. For example, Johnson et al. [37] (2018) showed that diversity significantly decreased after historical harvesting of Chinook salmon (Oncorhynchus tshawytscha). Moreover, in a study on swordfish (Xiphias gladius) in the Mediterranean, a loss of haplotype diversity and Ne was detected in females, which are larger and potentially more heavily targeted by fisheries [38]. mtDNA may be more sensitive to genetic loss than genomic DNA; however, mtDNA exhibits a much slower rate of evolution than genomic DNA due to its highly conservative nature [40,41,42]. Therefore, mtDNA is considered less useful for examining recent changes in genetic diversity. However, when assessing historical DNA alongside genomic DNA, mtDNA is a suitable choice of marker. For example, Brovoski et al. [21] used a combination of microsatellites and mtDNA to show that mango tilapia experienced a bottleneck event decreasing genetic diversity, possibly due to a combination of overfishing and decline in environmental conditions.
2.3. Microsatellites
Microsatellites remain the genetic marker of choice in the majority of studies analysing genetic diversity in exploited populations [43,44,45]. This is due to their inherent high polymorphism, rapid mutation rate, and relatively low cost [43,46]. Early studies on genetic diversity typically used a small number of microsatellites, e.g., [47,48]. This may have masked discrete changes in diversity, as it has been demonstrated that studies conducted with fewer than 10 microsatellite loci have low statistical power to detect changes in genetic diversity [8,49,50,51]. Only a minority of studies have used more than 10 loci to detect changes after an overharvesting event; these include a lake trout (Salvelinus namaycush) study with 18 loci [52], a study on dusky kob (Argyrosomus japanicus) with 18 loci [53], and a study on European eel (Anguilla anguilla) utilizing 22 loci [54].
Despite being a popular choice of genetic marker, microsatellites have one major disadvantage. They are neutral markers, meaning they occur in non-coding regions in the genome as opposed to other techniques like SNPs that occur in coding regions. Therefore, whilst they can be used to estimate changes in, for example, effective population size (Ne), they cannot detect loss of adaptive genetic diversity as functional markers can [55]. Instead of using microsatellites alone, a more optimal solution could be a combination of microsatellites, SNPs, and reduced representation library (RRL) sequencing [24,29].
2.4. SNPs
SNPs are currently the emerging genetic marker for studies on fisheries’ effects on genetic diversity [56,57,58]. SNPs are a potential replacement for microsatellites as they offer greater power of detection of genetic change than small numbers of microsatellite markers [59]. SNPs can be utilised in a variety of ways from using a SNP array across the genome (e.g., [10]) to sequencing methods using a large number of SNPs such as in Restriction Site Associated sequencing (RADseq; e.g., [60]), RNA sequencing [61], and whole-genome sequencing [58]. Furthermore, SNPs can be used as diagnostic markers, which can explain a large amount of variation in one trait. Barson et al. [62] used 200,000 SNPs and found a large effect locus (VGLL3) responsible for age at maturation in Atlantic salmon (Salmo salar). They focused on this particular locus and showed that it was responsible for 39% of the phenotypic variation observed in the population; changes in the allele frequency of this loci can help detect evolutionary changes in age and size at maturation in exploited salmon populations, informing management strategies.
D’Aloia et al. [24] compared three genetic markers, namely microsatellites, non-repetitive nuclear loci, and SNPs, to determine how each marker type could alter the genetic metrics produced in a population genetics study. They sequenced the DNA of a reef fish (Elacantinus lori) using 2418 SNPs, 89 microsatellites, and 57 non-repetitive nuclear loci. The SNPs showed higher FST values (the amount of genetic variance within a subpopulation compared to genetic variance within the entire population; [63]) than the other markers and showed greater resolution of genetic structure, allowing for more fine-scaled analysis. However, when comparing other diversity metrics, such as expected heterozygosity, observed heterozygosity, and allele richness, values were highest in the microsatellite data. It is also important to note that microsatellite and non-repetitive nuclear loci are cheaper options, and a larger number of them may be more cost-effective than SNPs [29,60]. Despite this, modern sequencing methods utilizing a high number of SNPs may solve some of the prior mentioned problems, as shown by more recent studies [23,56,57,58,64]. Yet, mixed results still preside within those studies utilising SNPs, which may be explained by the low number of SNPs used. Therkildsen et al. [58] utilised over two million SNPs and showed a significant reduction in genetic diversity (nucleotide diversity and polymorphism %) in an experimentally harvested fish population. In contrast, Pinsky et al. [65] used approximately 350,000 SNPs and demonstrated no change in genetic diversity (genome-wide diversity) despite large-scale harvesting of cod. Sadler et al. (Unpublished), on the other hand, utilized almost 3.5 million SNPs and showed a decrease in genetic diversity (heterozygosity, nucleotide diversity, and Ne) in size-selectively harvested experimental zebrafish (Danio rerio) populations.
When different genetic markers are utilised, different metrics are reported, and these are not always comparable. For example, allele richness and diversity are more prone to reductions in population size than heterozygosity [14,66]. Therefore, if a study only utilises heterozygosity as a metric (e.g., [48]), other aspects of genetic diversity change could be overlooked. Crucially, studies should consider carefully the implications of methodology used, aiming for the most efficient, low-cost method that targets adaptive loci.
3. Habitat Type
3.1. Freshwater vs. Saltwater
Habitat type has a significant effect on the vulnerability of aquatic species to exploitation, the most obvious divide being the difference between freshwater and saltwater habitats, together with the intermediate brackish environment. Despite the large difference in habitat size of global aquatic environments (0.5% accessible freshwater and 96.5% saltwater; [67]) the diversity of fish is very similar, with approximately 15,000 actinopterygian fish species prevalent in both ecosystems [68,69]. The high species diversity observed in the freshwater realm likely originates from large degrees of habitat fragmentation through differentiated rivers and isolated lake and pond systems, allowing for greater opportunity for adaptive divergence to take place compared to the comparatively ubiquitous habitat of the oceans [68].
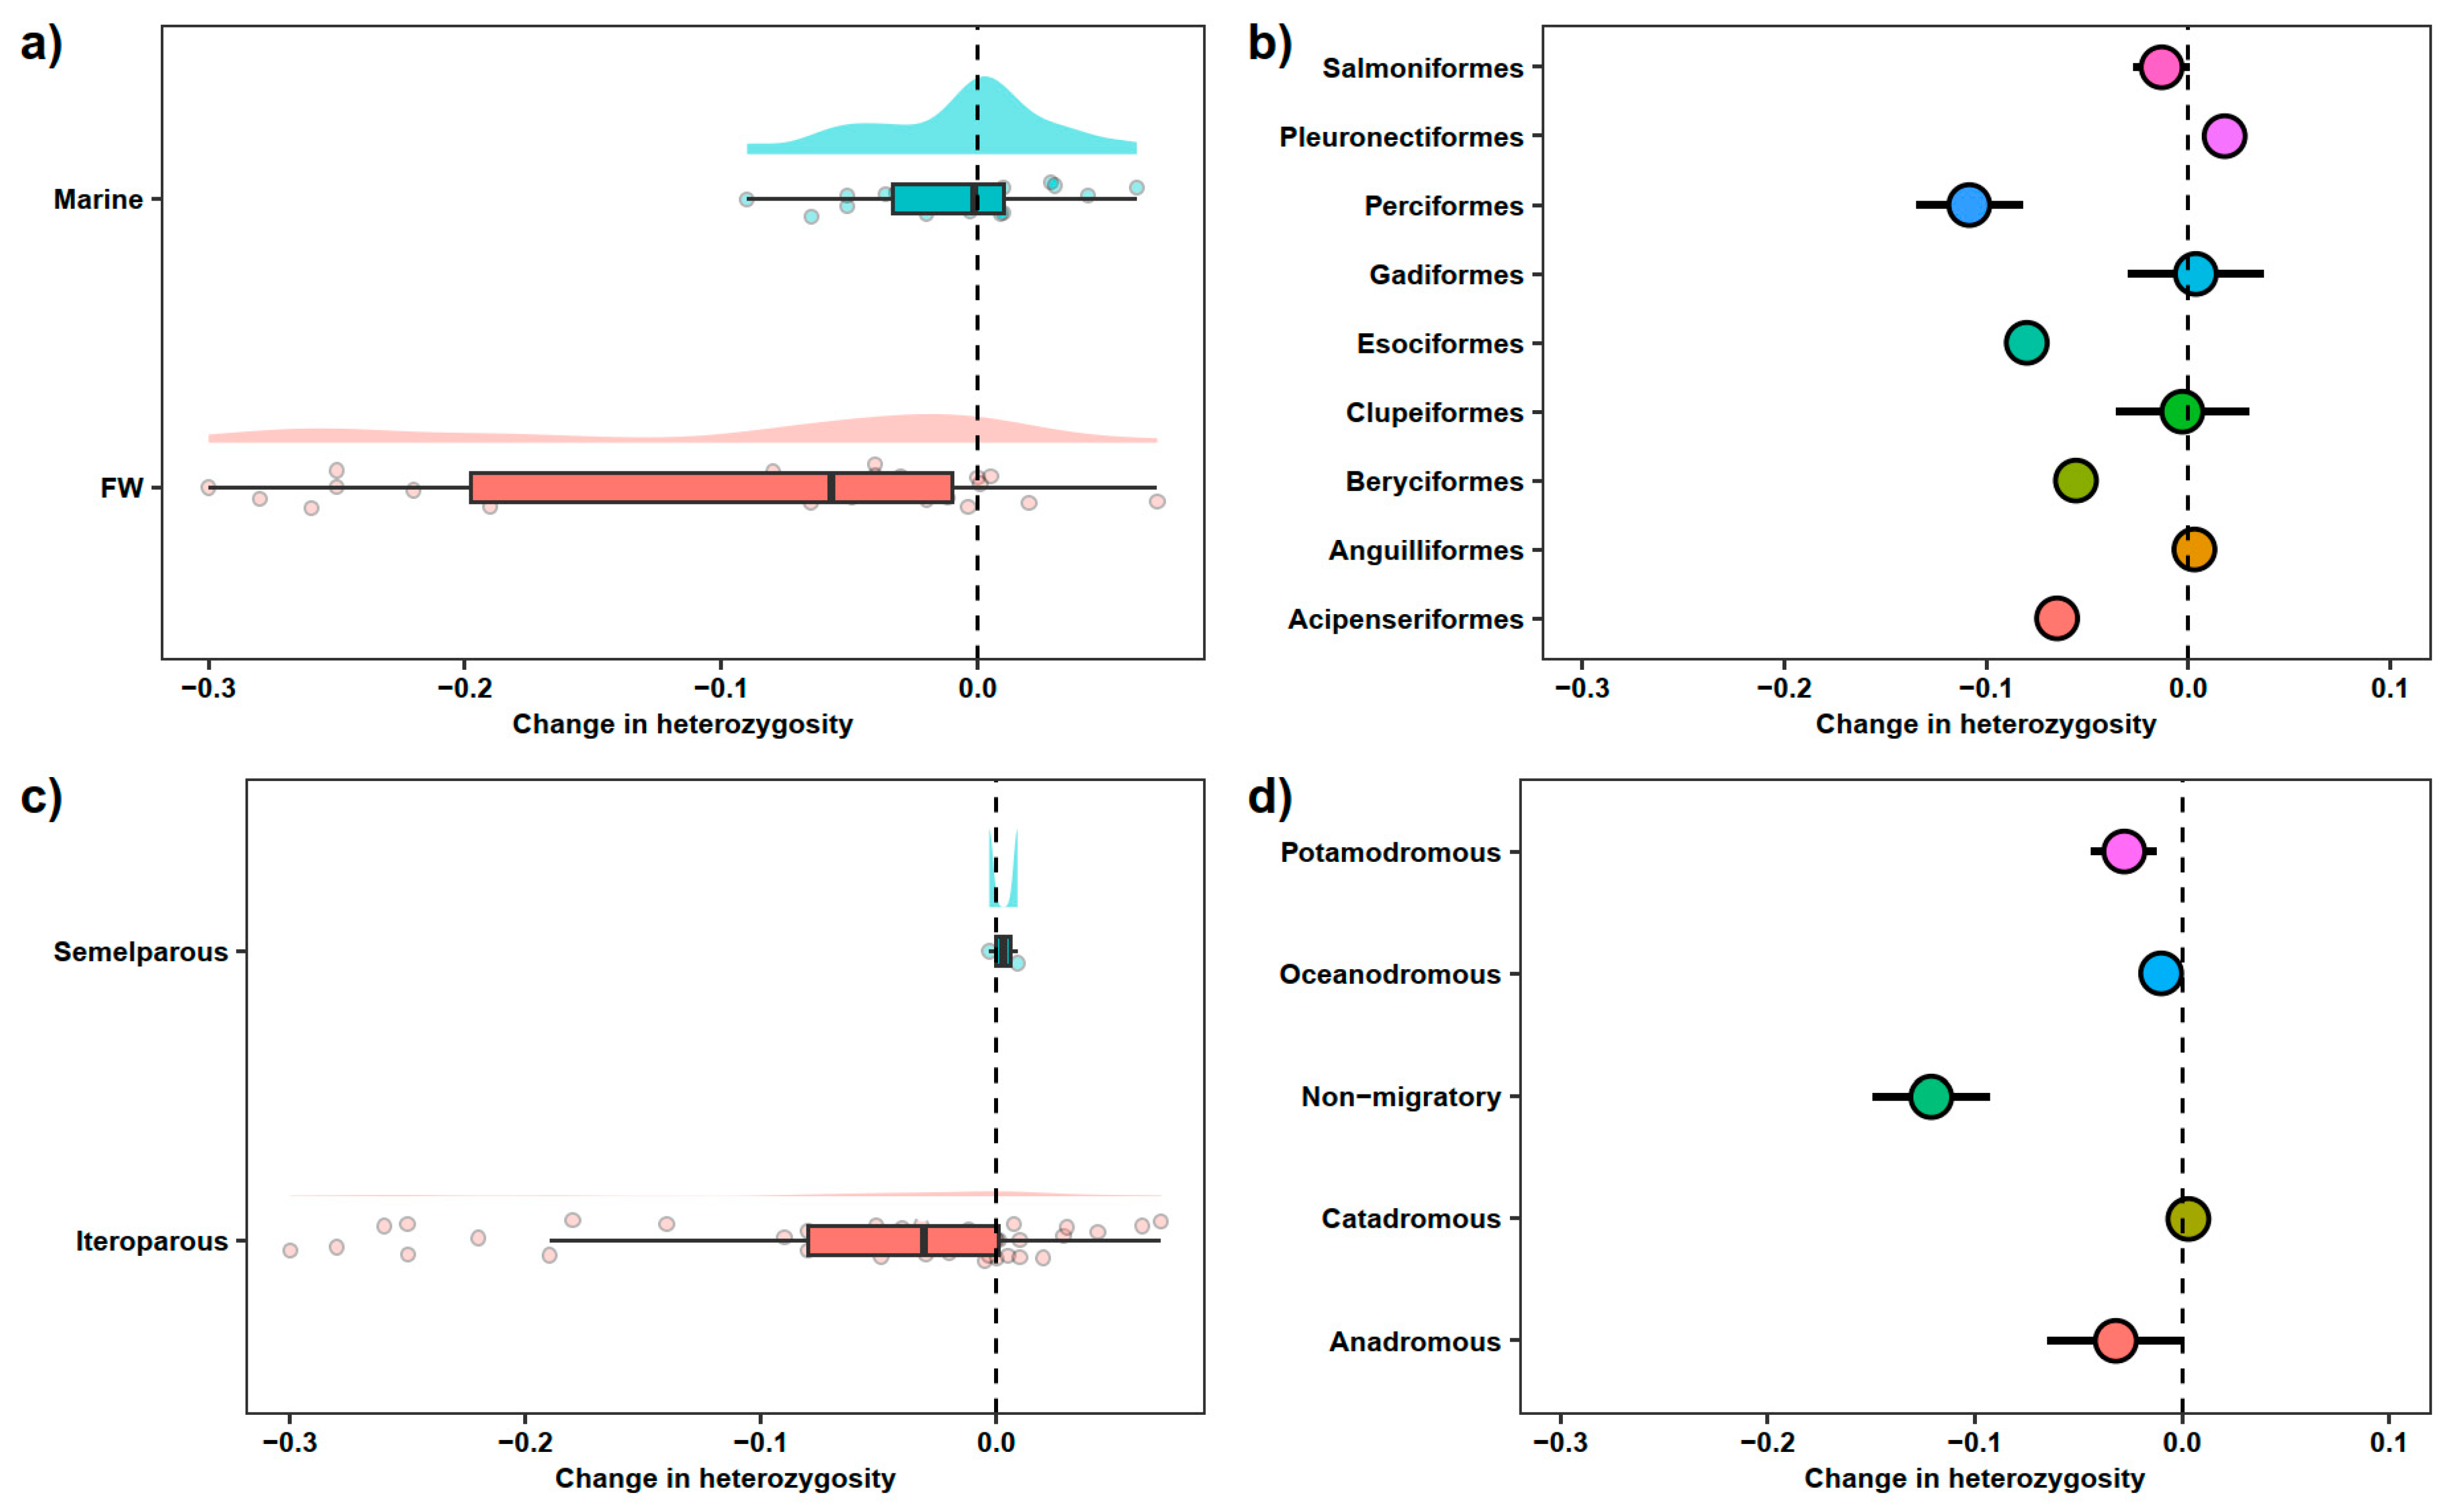
Structurally, marine and freshwater systems are very different, with greater habitat connectivity in the marine environment due to the huge expanse of available habitat space. Indeed, genetically, marine fish exhibit less genetic structure than freshwater species [20,70]. It may be presumed that freshwater habitats are more prone to genetic loss due to there being fewer refugia from fisheries and lower connectivity restricting migration. Despite this, most studies focus on marine species due to their inherent commercial importance, with a capture of 84 million tonnes compared to 12 million tonnes in freshwater fisheries in 2018 [1]. However, freshwater environments experience high fishing pressure [71], yet less is known about how fisheries affect their genetic diversity. Studies that focus on freshwater systems, show a greater decline in genetic diversity compared with studies focusing on marine habitats (Figure 1a; Table S1). Freshwater systems may therefore be more prone to loss of genetic diversity when exposed to fisheries stress.
Furthermore, in marine systems, the differing occurrence of fish populations can influence their catchability, dependent on the fishing method used, subsequently influencing vulnerability to genetic loss. For example, a trawler fishery will likely have a greater impact on benthic fish, whilst long lines will target pelagic fish. Interestingly, more studies show that benthopelagic fish are most vulnerable to declines in genetic diversity following fisheries stress (Table S1), potentially because they live close to the bottom of the ocean where fishing methods such as trawling can cause significant damage to their habitat and cause direct mortality [72].
3.2. Latitude
Species diversity, functional diversity and genetic diversity decrease with latitude because of postglacial colonization [73,74]. This creates a gradient in species number, such that species diversity is greatest at the equator [75,76]. As a result, fishing pressure could be expected to be more intense at the equator due to a high number of fishing communities and species. However, this is not the case, as fishing hotspots in Europe, North America, and China skew this pattern. Because northern (and polar) populations demonstrate lower levels of genetic diversity than southern ones, high fishing pressure in these areas might have greater impact on genetic diversity than anticipated [77]. Shifting baseline refers to the phenomenon of how people’s perceptions, for example, of genetic diversity (or biodiversity), change over time based on their own experience, memory, or knowledge (e.g., [78]). For example, people may not realise how much genetic diversity has been lost in certain species or populations because they have no reference point to compare with the past [79]. This means we should carefully consider the timescale of fisheries, and at what points loss or indeed no loss of genetic diversity is observed. This can result in a lack of awareness or concern for conservation and fisheries management [80].
3.3. Habitat Complexity
Habitat range and complexity are important factors influencing a fish population’s vulnerability to fishery stress. Isolated, small fish populations are more prone to the loss of genetic diversity than large, well- connected populations [81]. Connectivity of a habitat is crucial in maintaining genetic diversity, as it allows for genetic recovery through migration [8]. Furthermore, far ranging, panmictic species are more likely to have sites of refugia from fisheries, allowing for areas of high genetic diversity that can then contribute to the overall population through migration. Moreover, physical barriers can inhibit connectivity of populations, particularly in freshwater environments where lakes and rivers can become cut off. Intolerance to certain environmental conditions such as salinity, oxygen, and temperature can also create barriers to connectivity. For example, Vitorino et al. [82] state that Arapaima gigas lives in lentic waters, and are intolerant to lotic environments that act as barriers to dispersal, which may increase this species’ susceptibility to loss of genetic diversity due to lack of refugia and migration opportunity.
When predicting the potential loss of genetic diversity induced by fishing, various factors other than fishing intensity, selectivity, and type of genetic tools used, contribute. Underwater habitat type, condition, and complexity can be difficult to always determine accurately. However, studies suggest that these can possibly magnify the rate at which fisheries can degrade genetic diversity and, therefore, they should be considered.
4. Population Demography
4.1. Population Size and Range
Large populations are usually less vulnerable to random genetic drift and therefore genetic diversity is less likely to be degraded under intense fishing stress. Indeed, some have even suggested fish stocks are so large that even collapsed populations are completely resistant to loss of genetic variation through random genetic drift [83]. However, effective population size (Ne; i.e., the number of individuals that determines genetic characteristics, such as allele frequency) is often significantly smaller than the actual number of fish in a population (census population size, N; [84]). It was therefore often assumed that genetic bottlenecks were rare in large fish populations when considering census population size; however, genetic drift is determined by the effective population size that is many factors lower [15]. Some authors have even suggested that reduction in allele diversity as a result of overfishing may be more intense in large populations than small ones [85]. When a population is harvested down to low numbers, its inbreeding coefficient increases (i.e., genetic diversity decreases), inbreeding depression occurs, fitness is reduced together with the population’s evolutionary potential, and the population can eventually be destined to extinction [86].
In addition to population size, its range can further determine vulnerability to fisheries exploitation. A widely distributed species such as tuna (Thunnus thynnus) is more likely to be resistant to genetic loss caused by fisheries due to potential refugia in the environment and greater habitat connectivity [23]. Conversely, a narrowly distributed species may be more prone to genetic loss because genetic diversity cannot be maintained by refugia utilization and rebuilt through migration [8]. For example, Maugean skate (Zearaja maugeana) is endemic to Tasmania, has a narrow range, is endangered, and has suffered from the loss of genetic diversity, likely due to a combination of fishing and environmental change [87].
4.2. Sex Ratio
Fishing regimes often target the larger fish in a population, which not only influences body size and reproduction directly, but also leads to sex ratio alteration in sexually dimorphic species [38,88]. In fact, “sex-selective” fisheries can exacerbate the loss of genetic diversity by hampering reproduction directly by making the other sex rare, hence lowering the Ne [89]. For example, in the Gulf of Mexico, populations of amberjack (Seriola dumerili) have a female-skewed sex ratio, which is likely due to catch preferences in the region: females are a more valued catch because they are significantly larger than males, making for a more profitable catch [90]. Furthermore, Righi et al. [38] showed that under fishing stress, male swordfish (Xiphias gladius) became more prevalent in the population as a result of fishermen targeting the larger females, leading to losses in genetic diversity. A skewed sex ratio is a problem in all sexually dimorphic fish species that are being exploited, as the larger sex is more likely to be captured. This can lead to genetic loss and even to extinction events if the catch rate is extreme. To prevent fisheries to lead to skewed sex ratio, a maximum size limit could be helpful in protecting the potentially larger sex (typically female). However, even more stringent management measures, such as permanent fisheries closure can be effective only when implemented in the long term. A demographic recovery of a marine reef fish took 30 years of seasonal fisheries closure [91]. A genetic recovery likely takes much longer.
Furthermore, estimating population sizes (census or effective) or original standing genetic diversity can be challenging. Yet, these two population-level characteristics are imperative if we aim to reliably predict the rate and magnitude at which fisheries can induce loss of genetic diversity.
5. Life History and Behaviour
Studies based on the overharvesting of populations are unsurprisingly based on the most commercially important species, such as cod (Gadus morhua) and herring (Clupea harengus). This leads to an inherent bias on the life histories and demography of these studies. Cod, for example, have massive, interconnected populations, with extremely high lifetime fecundity and taking a relatively long time to mature. Anchovy and sardine, on the other hand, reach maturity rapidly (1–2 years) but have fewer spawning events. Further contrasting are species such as sharks and rays that are often very long lived, but with low fecundity. Fish life history, physiology, and behaviour are extremely variable amongst species and, intuitively, the effect of fisheries on loss of genetic diversity will vastly differ. Studies on species which reach a large body size and have long life spans have demonstrated a fisheries-induced loss of genetic diversity, e.g., [33,38,48]. However, the same is evident for small fast-living species (e.g., [92,93]). Variation exists in the literature between taxonomic groups (Figure 1b), so deeper exploration into life history traits is required to understand patterns of genetic loss.
5.1. Life History
Intensity of fishery stress may affect fish differently depending on their reproductive strategy, as a pelagic batch spawner with larvae that disperse over vast distances, such as herring, may have a greater chance of maintaining genetic diversity than species that lay eggs onto a substrate [94]. The latter may be particularly vulnerable to trawling and other destructive fishery methods [95], as fisheries will already cause high mortalities at the egg stage. Furthermore, fish that are broadcast spawners (i.e., spawning continues for several subsequent months and travels a greater distance), such as tuna and sardines, will likely have lower egg mortality rate caused by fisheries, whilst in contrast, benthic spawners that lay in close proximity, attaching eggs to the benthos, will be prone to the same targeted fishing (e.g., cod and plaice), especially destructive methods such as trawling, resulting in higher egg mortality and hence an indirectly greater loss of genetic diversity.
Reproduction in fish can be broadly classified into two categories: semelparous (a single reproductive event during lifetime) and iteroparous (multiple reproductive events). Semelparous fish are thought to be more prone to loss of genetic diversity as they rely on a singular reproductive event, so reproductive output is dependent on the available partner at the time of reproduction, as well as offspring survival being dependent on the temporality of reproduction [96]. For example, reproduction may coincide with an environmental stressor or indeed an intense fishery event. In contrast, iteroparous fish spread their reproductive output out, and are less likely to be affected by a singular environmental or fishing event. Species, such as many salmonids, that spawn once a year at a specific location could be extremely vulnerable to fisheries if it targets spawning populations. Fisheries have targeted the spawning stocks of barred sand bass (Paralabrax nebulifer) and kelp bass (Paralabrax clathratus), resulting in large-scale population loss [97]. Clearly, fisheries operating on spawning grounds, particularly in those of semelparous fishes, can very effectively reduce population sizes and therefore genetic diversity. However, evidence in the literature suggests iteroparous fish are more prone to loss of genetic diversity (Figure 1c), though this could be due to lack of studies on semelparous fish, and indeed it is a rarer life history strategy. Furthermore, fishery closures during spawning season are nowadays relatively common and have been suggested to contribute to sustainable fishing [98].
Body size has been shown to display a negative relationship with genetic diversity [8,99]. As a result, larger individuals and larger species are more likely to have lower diversity, due to body size and catch being related to population abundance [99]. This may result in overfished populations of smaller individuals showing no apparent loss in genetic diversity, but which have lost crucial rare alleles related to growth and fitness. Furthermore, larger fish are usually more reproductively successful in many species, producing more and larger eggs [100]. Moreover, larger females often disproportionally contribute to recruitment; therefore, loss of the largest individuals may result in a reduction in the growth and fecundity of the population [15]. However, conversely, the removal of larger fish that disproportionately contribute to the population may enhance genetic diversity due to the increased reproductive success of more, smaller individuals. As such, life history strategy as a predictor of the magnitude of fisheries-driven loss in genetic diversity is not straightforward and likely interacts with other traits and factors.
When examining life history strategies most vulnerable to fishing, an important concept is r/K-selection [101]. K-selected species are large, mature late, and produce relatively few offspring; as such, their population size, and hence genetic diversity, may be more affected by fishing, as for example demonstrated in the orange roughy (Hoplostethus atlanticus; [48]). In contrast, r-selected species characterized by small body size, early maturity, and high fecundity may be more durable to fisheries stress, as they have higher population growth rates and may be less likely to experience genetic loss. However, fish are difficult to categorise into r/K-species, as many of them do not strictly follow the definitions. For example, cod can be described as a K-species because it has a large body size and matures late, at the age of five to eight years. However, it is highly fecund and can spawn more than 10 million eggs during a spawning season [102]. Here, we cannot directly link the life history strategy with vulnerability to fisheries in terms of loss of genetic diversity, as studies show that at least certain cod populations do not seem to experience fisheries-induced decline in genetic diversity [5,18,19,20].
5.2. Migration
Fish can be broadly classified as non-migratory (such as reef dwellers like anemone fish; Amphiprion ocellaris), anadromous (living in saltwater and reproducing in freshwater, such as salmon), catadromous (living in freshwater and reproducing in saltwater, such as European eels), potamodromous (migrates within freshwater, such as brown trout; Salmo trutta), and oceanodromous (migrates within saltwater, such as bluefin tuna; Thunnus thynnus). Vulnerability to fisheries can be greatly dependent on migration strategies, whilst simultaneously relying on the temporality of the fishing seasons. Anadromous fish such as many salmonids are fished both in the open ocean and in riverine environments, exposing them to fisheries at both migratory stages, and if the fisheries are incorrectly managed, this can lead to severe reductions in genetic diversity [103]. Indeed, migratory anadromous fish could be particularly prone to fishing before maturation is reached in the oceanic habitats, as fishing the immature fish prevents any chance of reproduction [104].
Migration also makes populations more exposed to capture due to migration aggravations that can in turn be targeted [105]. Furthermore, fishery management could exacerbate the problem by biasing fisheries’ selection towards early and late spawners, which can remove alleles associated with these phenotypes [106]. Migration also offers respite from fisheries, assuming fishing fleets do not follow migratory fish (as they often do), potentially allowing fish to seek refugia through migration. This could be particularly evident in Arctic migrating species where there is less fishing effort. Indeed, evidence in the literature suggests non-migratory fish are more prone to loss of genetic diversity (Figure 1d). Furthermore, migration can enhance genetic diversity by increasing gene flow and reducing inbreeding [107], potentially mitigating the fisheries-induced loss of genetic diversity.
5.3. Behaviour
Many behavioural traits collate with other life history and morphological traits; for example, in zebrafish, large-selected individuals (small individuals removed from the initial population, simulating fisheries) were more explorative and bolder [10]. This could be problematic, as bold and aggressive fish are more likely to get caught by fishing gear, making them more prone to fishery stress [108,109,110]. Although not all individuals can be, for example, equally aggressive, a certain species can be more aggressive than another species, or fish can exhibit temporal aggression due to territorial behaviour. Large-mouth bass (Micropterus salmoides) males are very aggressive when they guard their nests and offspring, and it has been shown that during parental care, they are increasingly vulnerable to being caught by anglers [109]. Behaviour could therefore explain why fisheries have a more pronounced effect on the genetic diversity in some species compared to others. Even if boldness and aggression were normally distributed in the population, directional selection could target the most aggressive and bold fish and reduce functional genetic diversity by selecting out behaviour-associated alleles.
Social structures are important to consider, as aggregations are likely to increase vulnerability to fishing stress; for example, the Pleuronectes spp. reproductive strategy includes aggregations of males that court females, potentially making them more vulnerable to capture [111], leading to greater depletion and a more skewed sex ratio. Moreover, fishing fleets are more likely to directly target social aggregations, due to the greater ease of capture enhancing the problem. Indeed, shoaling fish such as anchovy, sardine and herring are easier to catch, increasing susceptibility to genetic loss. However, as these species are r-species, this could buffer any effect of sociality on loss of genetic diversity.
Genetic diversity loss could therefore be correlated with a variety of life history, physiological, and behavioural traits. This inevitably leads to differing vulnerability rates to fishing and by-products of fishing both within fish populations and between species.
6. Coinciding Effects
One explanation for the divergent results in genetic diversity in response to fishery stress is that fishing stress is rarely the only variable that affects populations. Population declines, and therefore genetic loss, may be caused by many anthropogenic selection pressures operating in synergy, including climate-change-induced warming [112,113], hypoxia [114,115], ocean acidification [116], and habitat destruction [117,118]. Furthermore, changes in biotic interactions, such as a change in abundance of co-occurring competitors or predatory species (e.g., [119]) or an introduction of an invasive species, can further alter the effects of a fishery on a harvested population. Wan et al. [33] showed evidence of a decline in genetic diversity in Dabry’s sturgeon after exposure to fishing stress; however, decline also coincided with multiple damming projects on the Yangtze River, as well as an increase in industrialisation, and hence pollution. Therefore, loss of genetic diversity due to fisheries is likely to be enhanced by other anthropogenic activities occurring simultaneously, which makes predicting the fate of exploited populations complicated.
7. Conclusions
A multitude of factors contribute to the mixed results in the literature for fisheries-induced loss of genetic diversity. The main contributing factors are differences in habitats, such as connectivity among populations and the availability of refugia, and differences in life history traits affecting vulnerability to harvesting. A further reason for discrepancies among studies is the differences in methodologies used to estimate the effect of fishing on genetic diversity. In particular, there are differences in resolution and structure between markers used and the resulting metrics presented [24,29]. Alongside these effects is the underlying influence of anthropogenic disturbances, such as climate change, which further amplify the loss of genetic diversity, particularly in areas of high industrialisation such as Europe, China, and North America, coincidentally the same areas in which fishing efforts are highest. Loss of genetic diversity as a result of fisheries can be mitigated from gene flow through immigration, availability of refugia from fisheries, or from mutation [8], assuming fisheries are closed for a long enough period. Fisheries management should consider loss of genetic diversity an important aspect when managing recovering populations. An apparent lack of reductions in genetic diversity should be heavily scrutinised using a wide array of techniques before accepting that the population is not at risk of further loss of genetic diversity and therefore reduction in adaptive potential. Currently, studies are lacking sufficient data, and more studies should be conducted considering a multifaceted approach, carefully considering what is causing changes in genetic diversity, and what potentially amplifies the effect of overfishing.
Supplementary Materials
The following supporting information can be downloaded at: https://www.mdpi.com/article/10.3390/fishes8100510/s1, Table S1: Summary of traits related to fish vulnerability to loss in genetic diversity.
Author Contributions
S.U.-H. acquired the funding. S.U.-H., P.C.W., and D.E.S. conceived the ideas; D.E.S. collected the data; D.E.S. led the writing of the manuscript. All authors have read and agreed to the published version of the manuscript.
Funding
This work was supported by funding from the Academy of Finland grant no. 325107 (SUH).
Conflicts of Interest
The authors declare no conflict of interest.
References
- FAO. The State of World Fisheries and Aquaculture 2020; Sustainability in Action; FAO: Rome, Italy, 2020. [Google Scholar]
- Halpern, B.S.; Silliman, B.R.; Olden, J.D.; Bruno, J.P.; Bertness, M.D. Incorporating positive interactions in aquatic restoration and conservation. Front. Ecol. Environ. 2007, 5, 153–160. [Google Scholar] [CrossRef]
- Jackson, J.B.C.; Kirby, M.X.; Berger, W.H.; Bjorndal, K.A.; Botsford, L.W.; Bourque, B.J.; Bradbury, R.H.; Cooke, R.; Erlandson, J.; Estes, J.A.; et al. Historical overfishing and the recent collapse of coastal ecosystems. Science 2001, 293, 629–637. [Google Scholar] [CrossRef] [PubMed]
- Malmqvist, B.; Rundle, S. Threats to the running water ecosystems of the world. Environ. Conserv. 2002, 29, 134–153. [Google Scholar] [CrossRef]
- Therkildsen, N.O.; Nielsen, E.E.; Swain, D.P.; Pedersen, J.S. Large effective population size and temporal genetic stability in Atlantic cod (Gadus morhua) in the southern Gulf of St. Lawrence. Can. J. Fish. Aquat. Sci. 2010, 67, 1585–1595. [Google Scholar] [CrossRef]
- Worm, B. Averting a global fisheries disaster. Proc. Natl. Acad. Sci. USA 2016, 113, 4895–4897. [Google Scholar] [CrossRef]
- Worm, B.; Barbier, E.B.; Beaumont, N.; Duffy, J.E.; Folke, C.; Halpern, B.S.; Jackson, J.B.C.; Lotze, H.K.; Micheli, F.; Palumbi, S.R.; et al. Impacts of biodiversity loss on ocean ecosystem services. Science 2006, 314, 787–790. [Google Scholar] [CrossRef]
- Pinsky, M.L.; Palumbi, S.R. Meta-analysis reveals lower genetic diversity in overfished populations. Mol. Ecol. 2014, 23, 29–39. [Google Scholar] [CrossRef]
- Daskalov, G.M. Overfishing drives a trophic cascade in the Black Sea. Mar. Ecol. Prog. Ser. 2002, 225, 53–63. [Google Scholar] [CrossRef]
- Uusi-Heikkilä, S.; Whiteley, A.R.; Kuparinen, A.; Matsumura, S.; Venturelli, P.A.; Wolter, C.; Slate, J.; Primmer, C.R.; Meinelt, T.; Killen, S.S.; et al. The evolutionary legacy of size-selective harvesting extends from genes to populations. Evol. Appl. 2015, 8, 597–620. [Google Scholar] [CrossRef]
- Allendorf, F.W.; England, P.R.; Luikart, G.; Ritchie, P.A.; Ryman, N. Genetic effects of harvest on wild animal populations. Trends Ecol. Evol. 2008, 23, 327–337. [Google Scholar] [CrossRef]
- Fisher, R.A.; Bennett, H.; Fisher, R.A.; Bennett, H. (Eds.) The Genetical Theory of Natural Selection: A Complete Variorum Edition; Oxford University Press: Oxford, NY, USA, 1999. [Google Scholar]
- Holderegger, R.; Kamm, U.; Gugerli, F. Adaptive vs. neutral genetic diversity: Implications for landscape genetics. Landsc. Ecol. 2006, 21, 797–807. [Google Scholar] [CrossRef]
- Allendorf, F.W.; Berry, O.; Ryman, N. So long to genetic diversity, and thanks for all the fish. Mol. Ecol. 2014, 23, 23–25. [Google Scholar] [CrossRef] [PubMed]
- Hauser, L.; Adcock, G.J.; Smith, P.J.; Bernal Ramírez, J.H.; Carvalho, G.R. Loss of microsatellite diversity and low effective population size in an overexploited population of New Zealand snapper (Pagrus auratus). Proc. Natl. Acad. Sci. USA 2002, 99, 11742–11747. [Google Scholar] [CrossRef] [PubMed]
- Hoarau, G.; Boon, E.; Jongma, D.N.; Ferber, S.; Palsson, J.; Van der Veer, H.W.; Rijnsdorp, A.D.; Stam, W.T.; Olsen, J.L. Low effective population size and evidence for inbreeding in an overexploited flatfish, plaice (Pleuronectes platessa L.). Proc. R. Soc. B Biol. Sci. 2005, 272, 497–503. [Google Scholar] [CrossRef]
- Jones, A.T.; Lavery, S.D.; Le Port, A.; Wang, Y.-G.; Blower, D.; Ovenden, J. Sweepstakes reproductive success is absent in a New Zealand snapper (Chrysophrus auratus) population protected from fishing despite “tiny” Ne/N ratios elsewhere. Mol. Ecol. 2019, 28, 2986–2995. [Google Scholar] [CrossRef]
- Hutchinson, W.F.; van Oosterhout, C.; Rogers, S.I.; Carvalho, G.R. Temporal analysis of archived samples indicates marked genetic changes in declining North Sea cod (Gadus morhua). Proc. R. Soc. B Biol. Sci. 2003, 270, 2125–2132. [Google Scholar] [CrossRef]
- Poulsen, N.A.; Nielsen, E.E.; Schierup, M.H.; Loeschcke, V.; Grønkjær, P. Long-term stability and effective population size in North Sea and Baltic Sea cod (Gadus morhua). Mol. Ecol. 2006, 15, 321–331. [Google Scholar] [CrossRef]
- Ruzzante, D.E.; Taggart, C.T.; Doyle, R.W.; Cook, D. Stability in the historical pattern of genetic structure of Newfoundland cod (Gadus morhua) despite the catastrophic decline in population size from 1964 to 1994. Conserv. Genet. 2001, 2, 257–269. [Google Scholar] [CrossRef]
- Borovski, T.; Tadmor-Levi, R.; Shapiro, J.; Rubinstein, G.; Agyakwah, S.K.; Hulata, G.; David, L. Historical and recent reductions in genetic variation of the Sarotherodon galilaeus population in the Sea of Galilee. Conserv. Genet. 2018, 19, 1323–1333. [Google Scholar] [CrossRef]
- Euclide, P.T.; Kilpatrick, C.W.; Marsden, J.E. Genetic diversity and structure of lake whitefish (Coregonus clupeaformis) 100 years after closure of the commercial fishery. J. Great Lakes Res. 2019, 45, 1310–1319. [Google Scholar] [CrossRef]
- Laconcha, U.; Iriondo, M.; Arrizabalaga, H.; Manzano, C.; Markaide, P.; Montes, I.; Zarraonaindia, I.; Velado, I.; Bilbao, E.; Goñi, N.; et al. New nuclear SNP markers unravel the genetic structure and effective population size of Albacore tuna (Thunnus alalunga). PLoS ONE 2015, 10, e0128247. [Google Scholar] [CrossRef] [PubMed]
- D’Aloia, C.C.; Andrés, J.A.; Bogdanowicz, S.M.; McCune, A.R.; Harrison, R.G.; Buston, P.M. Unraveling hierarchical genetic structure in a marine metapopulation: A comparison of three high-throughput genotyping approaches. Mol. Ecol. 2020, 29, 2189–2203. [Google Scholar] [CrossRef] [PubMed]
- Johnson, J.E.; Welch, D.J. Marine fisheries management in a changing climate: A review of vulnerability and future options. Rev. Fish. Sci. 2009, 18, 106–124. [Google Scholar] [CrossRef]
- Rogers, A.; Blanchard, J.L.; Mumby, P.J. Vulnerability of coral reef fisheries to a loss of structural complexity. Curr. Biol. 2014, 24, 1000–1005. [Google Scholar] [CrossRef]
- Johnston, F.D.; Arlinghaus, R.; Dieckmann, U. Fish life history, angler behaviour and optimal management of recreational fisheries. Fish Fish. 2013, 14, 554–579. [Google Scholar] [CrossRef]
- Patrick, W.S.; Spencer, P.; Link, J.; Cope, J.; Field, J.; Kobayashi, D.; Lawson, P.; Gedamke, T.; Cortés, E.; Ormseth, O.; et al. Using productivity and susceptibility indices to assess the vulnerability of United States fish stocks to overfishing. Fish. Bull. 2010, 108, 305–322. [Google Scholar]
- Timm, L.E. A fair fight between molecular marker types in a seascape genetics setting. Mol. Ecol. 2020, 29, 2133–2136. [Google Scholar] [CrossRef] [PubMed]
- Vos, P.; Hogers, R.; Bleeker, M.; Reijans, M.; van de Lee, T.; Hornes, M.; Frijters, A.; Pot, J.; Peleman, J.; Kuiper, M. AFLP: A new technique for DNA fingerprinting. Nucleic Acids Res. 1995, 23, 4407–4414. [Google Scholar] [CrossRef]
- Meudt, H.M.; Clarke, A.C. Almost forgotten or latest practice? AFLP applications, analyses and advances. Trends Plant Sci. 2007, 12, 106–117. [Google Scholar] [CrossRef]
- Mueller, U.G.; Wolfenbarger, L.L. AFLP genotyping and fingerprinting. Trends Ecol. Evol. 1999, 14, 389–394. [Google Scholar] [CrossRef]
- Wan, Q.-H.; Fang, S.-G.; Li, Y.-N. The loss of genetic diversity in Dabry’s sturgeon (Acipenser dabryanus, Dumeril) as revealed by DNA fingerprinting. Aquat. Conserv. Mar. Freshw. Ecosyst. 2003, 13, 225–231. [Google Scholar] [CrossRef]
- Schlötterer, C. The evolution of molecular markers—Just a matter of fashion? Nat. Rev. Genet. 2004, 5, 63–69. [Google Scholar] [CrossRef] [PubMed]
- Ali, F.S.; Mamoon, A. Population genetic studies of genus Dicentrarchus reveal loss of genetic diversity in Egyptian waters. Reg. Stud. Mar. Sci. 2019, 31, 100783. [Google Scholar] [CrossRef]
- Diedericks, G.; Henriques, R.; von der Heyden, S.; Weyl, O.L.F.; Hui, C. The ghost of introduction past: Spatial and temporal variability in the genetic diversity of invasive smallmouth bass. Evol. Appl. 2018, 11, 1609–1629. [Google Scholar] [CrossRef] [PubMed]
- Johnson, B.M.; Kemp, B.M.; Thorgaard, G.H. Increased mitochondrial DNA diversity in ancient Columbia River basin Chinook salmon Oncorhynchus tshawytscha. PLoS ONE 2018, 13, e0190059. [Google Scholar] [CrossRef]
- Righi, T.; Splendiani, A.; Fioravanti, T.; Casoni, E.; Gioacchini, G.; Carnevali, O.; Caputo Barucchi, V. Loss of mitochondrial genetic diversity in overexploited Mediterranean swordfish (Xiphias gladius, 1759) population. Diversity 2020, 12, 170. [Google Scholar] [CrossRef]
- Zhai, D.-D.; Li, W.-J.; Liu, H.-Z.; Cao, W.-X.; Gao, X. Genetic diversity and temporal changes of an endemic cyprinid fish species, Ancherythroculter nigrocauda, from the upper reaches of Yangtze River. Zool. Res. 2019, 40, 427–438. [Google Scholar] [CrossRef]
- Liu, D.; Li, X.; Song, Z. No decline of genetic diversity in elongate loach (Leptobotia elongata) with a tendency to form population structure in the upper Yangtze River. Glob. Ecol. Conserv. 2020, 23, e01072. [Google Scholar] [CrossRef]
- Ruelas-Inzunza, J.; Rojas-Ruiz, E.; Spanopoulos-Hernández, M.; Barba-Quintero, G. Mercury in the blue tilapia Oreochromis aureus from a dam located in a mining region of NW Mexico: Seasonal variation and percentage weekly intake (PWI). Environ. Monit. Assess. 2015, 187, 233. [Google Scholar] [CrossRef]
- Wang, I.J. Choosing appropriate genetic markers and analytical methods for testing landscape genetic hypotheses. Mol. Ecol. 2011, 20, 2480–2482. [Google Scholar] [CrossRef]
- DeFaveri, J.; Viitaniemi, H.; Leder, E.; Merilä, J. Characterizing genic and nongenic molecular markers: Comparison of microsatellites and SNPs. Mol. Ecol. Res. 2013, 13, 377–392. [Google Scholar] [CrossRef]
- Hauser, S.S.; Athrey, G.; Leberg, P.L. Waste not, want not: Microsatellites remain an economical and informative technology for conservation genetics. Ecol. Evol. 2021, 11, 15800–15814. [Google Scholar] [CrossRef] [PubMed]
- Morin, P.A.; Luikart, G.; Wayne, R.K. The SNP Workshop Group. SNPs in ecology, evolution and conservation. Trends Ecol. Evol. 2004, 19, 208–216. [Google Scholar] [CrossRef]
- Payseur, B.A.; Cutter, A.D. Integrating patterns of polymorphism at SNPs and STRs. Trends Genet. 2006, 22, 424–429. [Google Scholar] [CrossRef]
- Miller, L.M.; Kapuscinski, A.R. Historical analysis of genetic variation reveals low effective population size in a Northern pike (Esox lucius) population. Genetics 1997, 147, 1249–1258. [Google Scholar] [CrossRef] [PubMed]
- Smith, P.J.; Francis, R.I.C.C.; McVeagh, M. Loss of genetic diversity due to fishing pressure. Fish. Res. 1991, 10, 309–316. [Google Scholar] [CrossRef]
- Antao, T.; Pérez-Figueroa, A.; Luikart, G. Early detection of population declines: High power of genetic monitoring using effective population size estimators. Evol. Appl. 2011, 4, 144–154. [Google Scholar] [CrossRef]
- Cornuet, J.M.; Luikart, G. Description and power analysis of two tests for detecting recent population bottlenecks from allele frequency data. Genetics 1996, 144, 2001–2014. [Google Scholar] [CrossRef]
- Peery, M.Z.; Kirby, R.; Reid, B.N.; Stoelting, R.; Doucet-Bëer, E.; Robinson, S.; Vásquez-Carrillo, C.; Pauli, J.N.; Palsbøll, P.J. Reliability of genetic bottleneck tests for detecting recent population declines. Mol. Ecol. 2012, 21, 3403–3418. [Google Scholar] [CrossRef]
- Baillie, S.M.; Muir, A.M.; Scribner, K.; Bentzen, P.; Krueger, C.C. Loss of genetic diversity and reduction of genetic distance among lake trout Salvelinus namaycush ecomorphs, Lake Superior 1959 to 2013. J. Great Lakes Res. 2016, 42, 204–216. [Google Scholar] [CrossRef]
- Mirimin, L.; Macey, B.; Kerwath, S.; Lamberth, S.; der Merwe, A.B.-v.; Cowley, P.; Bloomer, P.; Roodt-Wilding, R. Genetic analyses reveal declining trends and low effective population size in an overfished South African sciaenid species, the dusky kob (Argyrosomus japonicus). Mar. Freshw. Res. 2015, 67, 266–276. [Google Scholar] [CrossRef]
- Pujolar, J.M.; Bevacqua, D.; Capoccioni, F.; Ciccotti, E.; De Leo, G.A.; Zane, L. No apparent genetic bottleneck in the demographically declining European eel using molecular genetics and forward-time simulations. Conserv. Genet. 2011, 12, 813–825. [Google Scholar] [CrossRef]
- Allendorf, F.W. Genetics and the conservation of natural populations: Allozymes to genomes. Mol. Ecol. 2017, 26, 420–430. [Google Scholar] [CrossRef]
- Allen, B.E.; Bowles, E.; Morris, M.R.J.; Rogers, S.M. Loss of SNP genetic diversity following population collapse in a recreational walleye (Sander vitreus) fishery. Can. J. Fish. Aquat. Sci. 2018, 75, 1644–1651. [Google Scholar] [CrossRef]
- Bowles, E.; Marin, K.; Mogensen, S.; MacLeod, P.; Fraser, D.J. Size reductions and genomic changes within two generations in wild walleye populations: Associated with harvest? Evol. Appl. 2020, 13, 1128–1144. [Google Scholar] [CrossRef]
- Therkildsen, N.O.; Wilder, A.P.; Conover, D.O.; Munch, S.B.; Baumann, H.; Palumbi, S.R. Contrasting genomic shifts underlie parallel phenotypic evolution in response to fishing. Science 2019, 365, 487–490. [Google Scholar] [CrossRef]
- Putman, A.I.; Carbone, I. Challenges in analysis and interpretation of microsatellite data for population genetic studies. Ecol. Evol. 2014, 4, 4399–4428. [Google Scholar] [CrossRef]
- Lemopoulos, A.; Prokkola, J.M.; Uusi-Heikkilä, S.; Vasemägi, A.; Huusko, A.; Hyvärinen, P.; Koljonen, M.-L.; Koskiniemi, J.; Vainikka, A. Comparing RADseq and microsatellites for estimating genetic diversity and relatedness—Implications for brown trout conservation. Ecol. Evol. 2019, 9, 2106–2120. [Google Scholar] [CrossRef]
- Uusi-Heikkilä, S.; Sävilammi, T.; Leder, E.; Arlinghaus, R.; Primmer, C.R. Rapid, broad-scale gene expression evolution in experimentally harvested fish populations. Mol. Ecol. 2017, 26, 3954–3967. [Google Scholar] [CrossRef]
- Barson, N.J.; Aykanat, T.; Hindar, K.; Baranski, M.; Bolstad, G.H.; Fiske, P.; Jacq, C.; Jensen, A.J.; Johnston, S.E.; Karlsson, S.; et al. Sex-dependent dominance at a single locus maintains variation in age at maturity in salmon. Nature 2015, 528, 405–408. [Google Scholar] [CrossRef]
- Weir, B.S.; Basten, C.J. Sampling strategies for distances between DNA sequences. Biometrics 1990, 46, 551–582. [Google Scholar] [CrossRef] [PubMed]
- Bowersox, B.J.; Corsi, M.P.; McCormick, J.L.; Copeland, T.; Campbell, M.R. Examining life history shifts and genetic composition in a hatchery steelhead population, with implications for fishery and ocean selection. Trans. Am. Fish. Soc. 2019, 148, 1056–1068. [Google Scholar] [CrossRef]
- Pinsky, M.L.; Eikeset, A.M.; Helmerson, C.; Star, B. Genomic stability through time despite decades of exploitation in cod on both sides of the Atlantic. Proc. Natl. Acad. Sci. USA 2021, 118, e2025453118. [Google Scholar] [CrossRef] [PubMed]
- Allendorf, F.W. Genetic drift and the loss of alleles versus heterozygosity. Zoo Biol. 1986, 5, 181–190. [Google Scholar] [CrossRef]
- Dawson, M.N. Species richness, habitable volume, and species densities in freshwater, the sea, and on land. Front. Biogeogr. 2012, 4, 105–116. [Google Scholar] [CrossRef]
- Arthington, A.H.; Dulvy, N.K.; Gladstone, W.; Winfield, I.J. Fish conservation in freshwater and marine realms: Status, threats and management. Aquat. Conserv. Mar. Freshw. Ecosyst. 2016, 26, 838–857. [Google Scholar] [CrossRef]
- Carrete Vega, G.; Wiens, J.J. Why are there so few fish in the sea? Proc. R. Soc. B Biol. Sci. 2012, 279, 2323–2329. [Google Scholar] [CrossRef]
- DeWoody, J.A.; Avise, J.C. Microsatellite variation in marine, freshwater and anadromous fishes compared with other animals. J. Fish Biol. 2000, 56, 461–473. [Google Scholar] [CrossRef]
- Lewin, W.-C.; Arlinghaus, R.; Mehner, T. Documented and potential biological impacts of recreational fishing: Insights for management and conservation. Rev. Fish. Sci. 2006, 14, 305–367. [Google Scholar] [CrossRef]
- Kaiser, M.J.; Spence, F.E.; Hart, P.J.B. Fishing-gear restrictions and conservation of benthic habitat complexity. Conserv. Biol. 2000, 14, 1512–1525. [Google Scholar] [CrossRef]
- Hasselman, D.J.; Ricard, D.; Bentzen, P. Genetic diversity and differentiation in a wide ranging anadromous fish, American shad (Alosa sapidissima), is correlated with latitude. Mol. Ecol. 2013, 22, 1558–1573. [Google Scholar] [CrossRef] [PubMed]
- Hewitt, G. The genetic legacy of the Quaternary ice ages. Nature 2000, 405, 907–913. [Google Scholar] [CrossRef] [PubMed]
- Hillebrand, H. On the generality of the latitudinal diversity gradient. Am. Nat. 2004, 163, 192–211. [Google Scholar] [CrossRef] [PubMed]
- Stuart-Smith, R.D.; Bates, A.E.; Lefcheck, J.S.; Duffy, J.E.; Baker, S.C.; Thomson, R.J.; Stuart-Smith, J.F.; Hill, N.A.; Kininmonth, S.J.; Airoldi, L.; et al. Integrating abundance and functional traits reveals new global hotspots of fish diversity. Nature 2013, 501, 539–542. [Google Scholar] [CrossRef] [PubMed]
- Watson, R.; Kitchingman, A.; Gelchu, A.; Pauly, D. Mapping global fisheries: Sharpening our focus. Fish Fish. 2004, 5, 168–177. [Google Scholar] [CrossRef]
- Papworth, S.K.; Rist, J.; Coad, L.; Milner-Gulland, E.J. Evidence for shifting baseline syndrome in conservation. Conserv. Lett. 2009, 2, 93–100. [Google Scholar] [CrossRef]
- Pinnegar, J.K.; Engelhard, G.H. The ‘shifting baseline’ phenomenon: A global perspective. Rev. Fish Biol. Fish. 2008, 18, 1–16. [Google Scholar] [CrossRef]
- Hanazaki, N.; Herbst, D.F.; Marques, M.S.; Vandebroek, I. Evidence of the shifting baseline syndrome in ethnobotanical research. J. Ethnobiol. Ethnomed. 2013, 9, 75. [Google Scholar] [CrossRef]
- Frankham, R. Stress and adaptation in conservation genetics. J. Evol. Biol. 2005, 18, 750–755. [Google Scholar] [CrossRef]
- Vitorino, C.A.; Nogueira, F.; Souza, I.L.; Araripe, J.; Venere, P.C. Low genetic diversity and structuring of the Arapaima (Osteoglossiformes, Arapaimidae) population of the Araguaia-Tocantins Basin. Front. Genet. 2017, 8, 159. [Google Scholar] [CrossRef]
- Beverton, R.J.H. Small marine pelagic fish and the threat of fishing; are they endangered? J. Fish Biol. 1990, 37, 5–16. [Google Scholar] [CrossRef]
- Frankham, R. Conservation genetics. Ann. Rev. Genet. 1995, 29, 305–327. [Google Scholar] [CrossRef] [PubMed]
- Ryman, N.; Utter, F.; Laikre, L. Protection of intraspecific biodiversity of exploited fishes. Rev. Fish Biol. Fish. 1995, 5, 417–446. [Google Scholar] [CrossRef]
- Bouzat, J.L. Conservation genetics of population bottlenecks: The role of chance, selection, and history. Conserv. Genet. 2010, 11, 463–478. [Google Scholar] [CrossRef]
- Weltz, K.; Lyle, J.M.; Semmens, J.M.; Ovenden, J.R. Population genetics of the endangered Maugean skate (Zearaja maugeana) in Macquarie Harbour, Tasmania. Conserv. Genet. 2018, 19, 1505–1512. [Google Scholar] [CrossRef]
- Otieno, O.N.; Kitaka, N.; Njiru, J.M. Length-weight relationship, condition factor, length at first maturity and sex ratio of Nile tilapia, Oreochromis niloticus in Lake Naivasha, Kenya. Int. J. Fish. Aquat. Stud. 2014, 2, 67–72. [Google Scholar]
- Uusi-Heikkilä, S. Implications of size-selective fisheries on sexual selection. Evol. Appl. 2020, 12, 487–1500. [Google Scholar] [CrossRef]
- Smith, G.H.; Murie, D.J.; Parkyn, D.C. Effects of sex-specific fishing mortality on sex ratio and population dynamics of Gulf of Mexico greater amberjack. Fish. Res. 2018, 208, 219–228. [Google Scholar] [CrossRef]
- Rosemond, R.C.; Nemeth, R.S.; Heppell, S.A. Demographic recovery of a reef fish population over 30 years of spawning aggregation site protection. Front. Mar. Sci. 2022, 9, 931409. [Google Scholar] [CrossRef]
- Madduppa, H.H.; Timm, J.; Kochzius, M. Reduced genetic diversity in the clown anemonefish Amphiprion ocellaris in exploited reefs of Spermonde Archipelago, Indonesia. Front. Mar. Sci. 2018, 5, 80. [Google Scholar] [CrossRef]
- Ruggeri, P.; Splendiani, A.; Bonanomi, S.; Arneri, E.; Cingolani, N.; Santojanni, A.; Belardinelli, A.; Giovannotti, M.; Caputo, V. Temporal genetic variation as revealed by a microsatellite analysis of European sardine (Sardina pilchardus) archived samples. Can. J. Fish. Aquat. Sci. 2012, 69, 1698–1709. [Google Scholar] [CrossRef]
- Hempel, G. Egg Production and Egg Mortality in Herring; Rapports et Procès-Verbaux des Réunions; Conseil Permanent International pour L’Exploration de la mer: Kolkata, India, 1971; Volume 160, pp. 8–11. Available online: https://www.digishelf.de/piresolver?id=404306500 (accessed on 30 August 2023).
- Collie, J.; Hiddink, J.G.; van Kooten, T.; Rijnsdorp, A.D.; Kaiser, M.J.; Jennings, S.; Hilborn, R. Indirect effects of bottom fishing on the productivity of marine fish. Fish Fish. 2017, 18, 619–637. [Google Scholar] [CrossRef]
- Tillotson, M.D.; Quinn, T.P. Selection on the timing of migration and breeding: A neglected aspect of fishing-induced evolution and trait change. Fish Fish. 2018, 19, 170–181. [Google Scholar] [CrossRef]
- Erisman, B.E.; Allen, L.G.; Claisse, J.T.; Pondella, D.J.; Miller, E.F.; Murray, J.H. The illusion of plenty: Hyperstability masks collapses in two recreational fisheries that target fish spawning aggregations. Can. J. Fish. Aquat. Sci. 2011, 68, 1705–1716. [Google Scholar] [CrossRef]
- Van Overzee, H.M.J.; Rijnsdorp, A.D. Effects of fishing during the spawning period: Implications for sustainable management. Rev. Fish Biol. Fish. 2015, 25, 65–83. [Google Scholar] [CrossRef]
- McCusker, M.R.; Bentzen, P. Positive relationships between genetic diversity and abundance in fishes. Mol. Ecol. 2010, 19, 4852–4862. [Google Scholar] [CrossRef]
- Chambers, R.C.; Leggett, W.C. Maternal influences on variation in egg sizes in temperate marine fishes. Am. Zool. 1996, 36, 180–196. [Google Scholar] [CrossRef]
- Pianka, E.R. On r- and K-Selection. Am. Nat. 1970, 104, 592–597. [Google Scholar] [CrossRef]
- Oosthuizen, E.; Daan, N. Egg fecundity and maturity of North Sea cod, Gadus morhua. Neth. J. Sea Res. 1974, 8, 378–397. [Google Scholar] [CrossRef]
- Hard, J.J.; Gross, M.R.; Heino, M.; Hilborn, R.; Kope, R.G.; Law, R.; Reynolds, J.D. Evolutionary consequences of fishing and their implications for salmon. Evol. Appl. 2008, 1, 388–408. [Google Scholar] [CrossRef]
- Smith, V.E. The Taking of Immature Salmon in the Waters of the State of Washington; State of Washington, Department of Fisheries: Olympia, WA, USA, 1920.
- Allan, J.D.; Abell, R.; Hogan, Z.; Revenga, C.; Taylor, B.W.; Welcomme, R.L.; Winemiller, K. Overfishing of inland waters. BioScience 2005, 55, 1041–1051. [Google Scholar] [CrossRef]
- Morita, K. Earlier migration timing of salmonids: An adaptation to climate change or maladaptation to the fishery? Can. J. Fish. Aquat. Sci. 2019, 76, 475–479. [Google Scholar] [CrossRef]
- Petit-Marty, N.; Liu, M.; Tan, I.Z.; Chung, A.; Terrasa, B.; Guijarro, B.; Ordines, F.; Ramírez-Amaro, S.; Massutí, E.; Schunter, C. Declining population sizes and loss of genetic diversity in commercial fishes: A simple method for a first diagnostic. Front. Mar. Sci. 2022, 9, 872537. [Google Scholar] [CrossRef]
- Biro, P.A.; Post, J.R. Rapid depletion of genotypes with fast growth and bold personality traits from harvested fish populations. Proc. Natl. Acad. Sci. USA 2008, 105, 2919–2922. [Google Scholar] [CrossRef] [PubMed]
- Sutter, D.A.H.; Suski, C.D.; Philipp, D.P.; Klefoth, T.; Wahl, D.H.; Kersten, P.; Cooke, S.J.; Arlinghaus, R. Recreational fishing selectively captures individuals with the highest fitness potential. Proc. Natl. Acad. Sci. USA 2012, 109, 20960–20965. [Google Scholar] [CrossRef] [PubMed]
- Monk, C.T.; Bekkevold, D.; Klefoth, T.; Pagel, T.; Palmer, M.; Arlinghaus, R. The battle between harvest and natural selection creates small and shy fish. Proc. Natl. Acad. Sci. USA 2021, 118, e2009451118. [Google Scholar] [CrossRef]
- Solmundsson, J.; Karlsson, H.; Palsson, J. Sexual differences in spawning behaviour and catchability of plaice (Pleuronectes platessa) west of Iceland. Fish. Res. 2003, 61, 57–71. [Google Scholar] [CrossRef]
- Free, C.M.; Thorson, J.T.; Pinsky, M.L.; Oken, K.L.; Wiedenmann, J.; Jensen, O.P. Impacts of historical warming on marine fisheries production. Science 2019, 363, 979–983. [Google Scholar] [CrossRef]
- Little, A.G.; Loughland, I.; Seebacher, F. What do warming waters mean for fish physiology and fisheries? J. Fish Biol. 2020, 97, 328–340. [Google Scholar] [CrossRef]
- Breitburg, D. Effects of hypoxia, and the balance between hypoxia and enrichment, on coastal fishes and fisheries. Estuaries 2002, 25, 767–781. [Google Scholar] [CrossRef]
- Diaz, R.J. Overview of hypoxia around the world. J. Environ. Qual. 2001, 30, 275–281. [Google Scholar] [CrossRef] [PubMed]
- Le Quesne, W.J.F.; Pinnegar, J.K. The potential impacts of ocean acidification: Scaling from physiology to fisheries. Fish Fish. 2012, 13, 333–344. [Google Scholar] [CrossRef]
- Deegan, L.A.; Buchsbaum, R. The Decline of Fisheries Resources in New England: Evaluating the Impact of Overfishing, Contamination, and Habitat Degradation; MIT Sea Grant College Program: Cambridge, MA, USA, 2005. [Google Scholar]
- Pavlova, A.; Beheregaray, L.B.; Coleman, R.; Gilligan, D.; Harrisson, K.A.; Ingram, B.A.; Kearns, J.; Lamb, A.M.; Lintermans, M.; Lyon, J.; et al. Severe consequences of habitat fragmentation on genetic diversity of an endangered Australian freshwater fish: A call for assisted gene flow. Evol. Appl. 2017, 10, 531–550. [Google Scholar] [CrossRef] [PubMed]
- Kininmonth, S.; Blenckner, T.; Niiranen, S.; Watson, J.; Orio, A.; Casini, M.; Neuenfeldt, S.; Bartolino, V.; Hansson, M. Is diversity the missing link in coastal fisheries management? Diversity 2022, 14, 90. [Google Scholar] [CrossRef]
Figure 1.
Change in heterozygosity associated with harvesting (a) fish inhabiting marine and freshwater (FW) habitats, (b) organized by orders, and life history traits, such as (c) parity and (d) migration strategy (see Table S1 for data sources). A negative value indicates loss of heterozygosity after a harvesting event. Dashed line indicates no change in heterozygosity. In panels (a,c), shaded areas represent the distribution of the data as density, and in panels (b,d), data are represented as means and standard errors.

Disclaimer/Publisher’s Note: The statements, opinions and data contained in all publications are solely those of the individual author(s) and contributor(s) and not of MDPI and/or the editor(s). MDPI and/or the editor(s) disclaim responsibility for any injury to people or property resulting from any ideas, methods, instructions or products referred to in the content. |
© 2023 by the authors. Licensee MDPI, Basel, Switzerland. This article is an open access article distributed under the terms and conditions of the Creative Commons Attribution (CC BY) license (https://creativecommons.org/licenses/by/4.0/).
Share and Cite
MDPI and ACS Style
Sadler, D.E.; Watts, P.C.; Uusi-Heikkilä, S. The Riddle of How Fisheries Influence Genetic Diversity. Fishes 2023, 8, 510. https://doi.org/10.3390/fishes8100510
AMA Style
Sadler DE, Watts PC, Uusi-Heikkilä S. The Riddle of How Fisheries Influence Genetic Diversity. Fishes. 2023; 8(10):510. https://doi.org/10.3390/fishes8100510
Chicago/Turabian StyleSadler, Daniel E., Phillip C. Watts, and Silva Uusi-Heikkilä. 2023. "The Riddle of How Fisheries Influence Genetic Diversity" Fishes 8, no. 10: 510. https://doi.org/10.3390/fishes8100510