Article

Inclusion of Mannan-Oligosaccharides in Diets for Tropical Gar Atractosteus tropicus Larvae: Effects on Growth, Digestive Enzymes, and Expression of Intestinal Barrier Genes

by
Claudia I. Maytorena-Verdugo
1,2,*,
Emyr S. Peña-Marín
1,3,
Carina S. Alvarez-Villagómez
1,
Graciela M. Pérez-Jiménez
1,
César A. Sepúlveda-Quiroz
1 and
Carlos A. Alvarez-González
1,*
1
Laboratorio de Fisiología en Recursos Acuáticos-DACBIOL, Universidad Juárez Autónoma de Tabasco, Carretera Villahermosa Cárdenas Km 0.5, Villahermosa 86139, Tabasco, Mexico
2
División Académica Multidisciplinaria de Jalpa de Méndez, Universidad Juárez Autónoma de Tabasco, Carretera estatal libre Villahermosa-Comalcalco Km 27 S/N, Ranchería, Jalpa de Méndez 86205, Tabasco, Mexico
3
Consejo Nacional de Ciencia y Tecnología, Av. Insurgentes Sur 1582, Col. Crédito Constructor, Del. Benito Juárez C.P., Ciudad de Mexico 03940, Mexico
*
Authors to whom correspondence should be addressed.
Fishes 2022, 7(3), 127; https://doi.org/10.3390/fishes7030127
Submission received: 12 April 2022 / Revised: 27 May 2022 / Accepted: 30 May 2022 / Published: 31 May 2022
(This article belongs to the Special Issue Advances in Nutrition and Feeding of Fish)

Abstract

:
Mannan-oligosaccharides (MOS) are non-digestible carbohydrates, and their use in aquaculture as prebiotics is well documented. The objective of this work was to test whether MOS supplemented in the diet of A. tropicus larvae (2, 4, and 6 g kg−1) influence growth parameters, the activity of digestive enzymes, and the expression of genes related to the intestinal barrier. The highest total length was observed in larvae fed 6 g kg−1 MOS compared to control larvae. Trypsin activity increased with the addition of MOS to the diets, but leucine aminopeptidase activity only increased with 6 g kg−1 MOS. Lipase and α-amylase activities increased in larvae fed with 2 and 4 g kg−1 MOS. The expression of zo-2 was higher with the 6 g kg−1 MOS treatment. The cl-3 transcripts were lower with 2 g kg−1 MOS but higher with 6 g kg−1 MOS. All tested concentrations of MOS increased the expression of muc-2. In this study, incorporating mannan-oligosaccharides into the diet of A. tropicus larvae had a positive effect, and the concentration of 6 g kg−1 produced the best results. Therefore, including this prebiotic in the diets for the culture of A. tropicus larvae is suitable.

1. Introduction

Improving fish nutrition is one of the most critical issues to solve in the aquaculture industry. Fish nutrition research involves the study of the materials required to maintain life; the formation and repair of body tissues and energy production translated to feed intake and the physiological mechanisms involved in its regulation, nutrient requirements, and interactions; metabolic pathways and nutrient utilization; and fish growth, reproduction, and early development [1]. However, the focus has been commonly put on the animals without considering microbiota until recently since their intestinal microbiota plays an essential role in the life sustenance of any living thing, so when designing a diet for any species, it is important to consider their role.
The gut is the natural interface between the intestinal microbiota and the host, where the gut microbiota is essential for intestinal development, protecting against pathogens through extensive crosstalk in the mucosal surfaces of the gastrointestinal tract [2]. The microbiome is the microbial community occupying a reasonably well-defined habitat that has distinct chemical properties and describes the genome of all microorganisms (symbiotic and pathogenic) living in vertebrates; the gut microbiome comprises the collective genome of the microbes inhabiting the gut, including bacteria, archaea, viruses, and fungi [3].
The microbial structure and diversity and its establishment in the fish gastrointestinal tract are intricate processes that reflect the effects of the rearing water and the diet [4]. Microorganisms in the intestine use large molecules that are indigestible to the host, and the metabolic breakdown by microorganisms in the intestine of these large molecules acts on the profile and functionality of the intestinal microbiota, having a positive effect on the host by improving food efficiency and growth [5]. Examples of these indigestible molecules are prebiotics, which are non-digestible carbohydrates that are selectively utilized by host microorganisms, conferring a health benefit [6].
Mannan oligosaccharides (MOS) are non-digestible short-chain branched carbohydrates that comprise up to ten mannose units linked via α-(1,3) and α-(1,6) bonds and are obtained from the Saccharomyces cerevisiae yeast cell, and their use in aquaculture is well documented [7]. Juvenile Chinese mitten crabs (Eriocheir sinensis) exposed to dietary MOS at concentrations ranging from 1 to 6 g kg−1 MOS increased the activity of antioxidant enzymes and the expression of immunity-related genes [8]. In juvenile hybrid groupers (Epinephelus lanceolatus  × Epinephelus fuscoguttatus ), 6 g kg−1 dietary MOS increased survival rates when challenged with Vibrio harveyi [9], and a concentration of 4 g kg−1 dietary MOS also increased the feed intake in giant sturgeon juveniles [10].
The tropical gar (Atractosteus tropicus) is an ancestral fish distributed in Southern Mexico to Central America and has a high demand among local consumers. The current diet used to cultivate this species is designed for rainbow trout (Oncorhynchus mykiss) [11]. However, specific diets have been proposed with better results in terms of growth parameters and digestive enzyme activity [12], including prebiotics such as β-glucans, fructooligosaccharides (FOS), and MOS in juvenile diets, which also improved growth parameters, digestive enzyme activity, and the expression of genes related to the intestinal barrier [13,14,15]. Nevertheless, the bottleneck in the tropical gar culture is their larval stage, where survival is low. In addition, the digestive system at this stage is developing, making the diet an important parameter to consider, so this work aimed to evaluate whether MOS supplemented in the diet of tropical gar larvae have an influence on growth parameters, the activity of digestive enzymes, and the expression of genes related to the intestinal barrier to strengthen the animals in this critical stage.

2. Materials and Methods

2.1. Ethical Statement

Fish were handled in compliance with the standards for the good welfare practices of laboratory animals from the Mexican Standard NOM-062-ZOO-1999 [16] of the Ministry of Agriculture, Livestock, Rural Development, Fisheries and Food.

2.2. Experimental Diets

In this experiment, a base diet was used [12], and 2, 4, and 6 g kg−1 MOS (Bio-Mos, Alltech, Nicholasville, KY, USA) were added to the treatments. First, powdered ingredients were weighed, and mixed, and then liquid ingredients were added, after which the mixture was blended for 15 min until all ingredients were incorporated. Pellets were prepared using a meat mill (M-22RI, Torrey, Monterrey, Nuevo León, Mexico) with a 5 mm screen. Afterwards, pellets were dried at 60 °C for 12 h in an oven (Coriat, HC-35-D, CDMX, México). The experimental diets and proximal analysis are shown in Table 1. Diets were kept at −20 °C until use. Before starting the bioassay, the diets were ground and sieved to obtain specific particle sizes (20–150 µm) according to larval growth. The experimental diets were analyzed for proximal composition (protein, lipids, ash, and moisture content) according to methods described by AOAC [17].

2.3. Bioassay

A. tropicus larvae were obtained from a stock of an induced spawning broodstock using one female (2.5 kg) and three males (1 kg each) from a breeding batch at the DACBiol-UJAT Tropical Aquaculture Laboratory, Mexico. Spawning was induced by injecting LHRHa (30 µg kg−1 weight) into the female in a 2000 L circular tank. On the first day after hatching (dah), A. tropicus larvae were randomly distributed in twelve 70 L experimental tanks with a recirculation system operated by a 0.5 HP water pump and a biological filter. Water quality was monitored daily using a YSI 85 oximeter (Ysi, Yellow Springs, OH, USA) and a HANNA HI 991001 potentiometer A (HANNA instruments, Woonsocket, RI, USA), maintaining an average temperature of 27.1 ± 0.8 °C, dissolved oxygen of around 5.7 ± 0.2 mg L−1, and pH close to 7.3 ± 0.2. Tanks were inspected daily for mortality, and any excess food and feces were removed from the tanks.
The treatments were conducted in triplicate using 150 larvae per tank, and the experiment lasted 20 days. It is important to note that only the larval period of A. tropicus is considered in this study. This period starts from mouth opening and yolk absorption (3 days after hatching) and ends on day 15 after hatching, when the digestive system and the anatomical structures (mouth, spines, fins, and scales) have been completed; after this day, A. tropicus are considered juveniles [18]. For larval feeding, from day one, larvae were fed with 0.5 g of powder of the corresponding experimental diet (7:00, 11:00, 15:00, and 19:00 h) and Artemia nauplii (approximately 4500 nauplii per tank at each feeding time), 30 min after the powdered diet. This procedure was performed to start adapting them to food consumption; however, this powder is not totally consumed by larvae. Six days after hatching, the larvae were fed with a mixture of their corresponding experimental diets and frozen Artemia biomass. At this age, the larvae increase their consumption of inert food, so the weaning process is carried out for five days. Finally, from day twelve, larvae were fed only the experimental diets until the end of the experiment. At the end of the trial, larvae were handled carefully and taken from the tanks using aquarium fish nets; then, larvae were put in dried cloth to remove the excess water. Next, larvae were weighed and put in a white container with little water to take photos, which were measured using the ImageJ software 1.5 (NIH, Bethesda, MD, USA). This procedure is relatively quick (1 h) and has been used in other works with A. tropicus since the larvae of this species are resistant to handling. Samples of nine larvae per treatment (three per replicate) were taken to quantify the activity of digestive enzymes; nine larvae per treatment (three larvae per replicate) were also collected and kept in a solution to preserve the RNA (RNAlater) and thus be able to analyze gene expression. Collected larvae for molecular analyses were washed with distilled water, and heads and tails were cut off. Samples were frozen at −80 °C until analysis.

2.4. Growth Indices

At the beginning (day 1 after hatching) and end (day 20) of the experiment, larvae samples (30% from each treatment and experimental replicate) were taken to determine the wet weight (g) using an analytical balance (Galaxy HR-250AZ, A&D medical, Tokyo, Japan) and the total length (cm) through scale photography, calculated with the ImageJ 1.5 software (NIH, Bethesda, MD, USA). At the end of the experiment, the following parameters were calculated: absolute weight gain (AWG): final weight (g) − initial weight (g); weight gain percentage (WG): [100 × (Final weight − Initial weight)/Initial weight]; specific growth rate (SGR): [100 × (Ln final weight − Ln initial weight)]/days; feed conversion ratio (FCR): Total feed consumed/Total weight of product produced; condition factor (K): (mean final body weight/mean final body length3) × 100; and survival (S): (number of fish at the end of the experiment/number of fish at the beginning of the experiment) × 100.

2.5. Digestive Enzyme Activities

Three larvae per replicate (nine larvae per treatment) were homogenized in distilled water with pistils in a 1:10 ratio. Then, the homogenates were centrifuged at 10,000× g at 4 °C for 15 min. The supernatant was stored in aliquots at −80 °C until use. Soluble protein was quantified using the Bradford method [19].
The total acid protease activity of the extracts was quantified using 1% hemoglobin as substrate in 100 mM glycine-HCl buffer at pH 2.0. The reaction comprised 5 µL of the sample and 300 µL of the substrate–buffer mixture. After 15 min of incubation at 37 °C, the reaction was stopped with 200 µL of 10% trichloroacetic acid (TCA); then, the samples were centrifuged at 16,000× g for 15 min at 4 °C, and the absorbance of the tyrosine released in the supernatants was measured at 280 nm [20]. Total alkaline protease activity was determined using the technique described by Walter [21] using 1% casein in 100 mM Tris-HCl buffer + 10 mM CaCl2 at pH 9.0. The reaction comprised 10 µL of the sample and 300 µL of the substrate–buffer mixture. After 30 min of incubation at 37 °C, the reaction was stopped with 200 µL of 10% TCA; then, the samples were centrifuged at 16,000× g for 15 min at 4 °C, and the absorbance of the tyrosine released was measured at 280 nm. Both enzymes were quantified in a Genesys 10S UV–Vis spectrophotometer (ThermoScientific, Waltham, MA, USA) using a molar extinction coefficient (ε) of 0.005 µM−1 cm−1.
Chymotrypsin activity was quantified using SAApNA as substrate (Cat. No. S7388, Sigma-Aldrich, Saint Louis, MO, USA). A 50 mM stock solution of the substrate was prepared with DMSO, and then the working solution was prepared at a concentration of 1.25 mM with 50 mM Tris-HCl, pH 8.0. A total of 15 µL of each extract from the digestive system was mixed with 135 µL of the buffered substrate to measure the absorbance of the released nitroanilide at 410 nm for 30 min [22]. Trypsin activity was quantified using BAPNA as a substrate (Cat. No. B4875, Sigma-Aldrich). A stock solution of 122.78 mM of the substrate was prepared with DMSO, and the working solution was prepared by diluting the stock solution to a concentration of 2 mM with 50 mM Tris-HCl, pH 8.0. A total of 15 µL of the extract from the digestive system was mixed with 135 µL of the substrate to measure the absorbance of the nitroanilide released at 410 nm for 15 min [22]. Leucine aminopeptidase activity was quantified using L-leucine-p-nitroanilide as substrate (Cat. No. L9125, Sigma-Aldrich). A 250 mM stock solution of the substrate was prepared with DMSO, and the working solution was prepared at a concentration of 4 mM diluted with 50 mM sodium phosphate, pH 7.2. A total of 15 µL of the digestive system extract was mixed with 135 µL of the substrate and buffer mixture to measure the absorbance of the released nitroanilide at 410 nm for 30 min [23]. These enzymes were quantified in an xMark spectrophotometer (Bio-Rad, Hercules, CA, USA) using a molar extinction coefficient (ε) of 0.0088 µM−1 cm−1 at room temperature.
Lipase activity was determined by incubating 5 µL of each sample with 475 µL of 50 mM Tris-HCl, pH 7.5, and 50 µL of 100 mM sodium taurocholate. Samples were incubated for 5 min at 37 °C, and then 5 µL of the substrate (100 mM β-naphthyl acetate, Cat. No. N6875, Sigma-Aldrich) was added. The mixtures were incubated for 30 min, stopping the reaction with 50 µL of 0.72 N TCA. Subsequently, 5 µL of 100 mM Fast Blue B salt (Cat. No. D9805, Sigma-Aldrich) and 677 µL of a mixture of ethanol and ethyl acetate in a 1:1 ratio was added, and the absorbance at 540 nm was measured using an ε of 0.02 μM−1 cm−1 [24]. α-Amylase activity was quantified using 2% starch as substrate in 100 mM sodium citrate + 50 mM NaCl, pH 7.5 buffer. A total of 5 µL of each sample was incubated at 30 °C for 60 min with 250 µL of the substrate–buffer mixture. After the incubation, 300 µL of the Nelson-Somogyi reagent was added to determine reducing sugars. Samples were boiled for 20 min, and 300 µL of a mixture of sulfuric acid and ammonium molybdate was added. Next, samples were vortexed until CO2 was no longer released. The activity was quantified at 600 nm with an ε of 0.0034 µM−1 cm−1 [25]. Both enzymes were quantified in a Genesys 10S UV–Vis spectrophotometer (ThermoScientific, Waltham, MA, USA). The enzyme activity for each enzyme was calculated as follows: U mg−1 = [(Absorbance per min × Total reaction volume)/(ε × Sample volume)]/mg of protein sample. All data obtained are shown as U mg−1.

2.6. RNA Extraction and cDNA Synthesis

Total RNA from each larval sample (three larvae per replicate) was isolated using Trizol (Invitrogen, Waltham, MA, USA) according to the manufacturer’s instructions. The concentration and purity of the RNA samples were evaluated by the absorbance ratio at 260 and 280 nm in a spectrophotometer (Jenway GenovaNano, Cole-Parmer, Staffordshire, UK). One microgram of RNA was reverse transcribed into cDNA in a thermocycler (Mastercycle nexus GSX1, Eppendorf, Hamburg, Germany) using the high-throughput cDNA reverse transcription kit (Maxima First Strand cDNA Synthesis Kit for RT-qPCR, Cat. No. K1641 ThermoScientific) in a final volume of 20 µL following the manufacturer’s recommendations. The standard PCR program used was: 5 min at 65 °C, 10 min at 25 °C, 50 min at 42 °C (cDNA chain extension), 15 min at 70 °C (reverse transcriptase inactivation), and finally, 20 min at 37 °C.

2.7. Gene Expression Analysis

The gene expression of intestinal barrier function markers was selected based on the work of Pérez-Jiménez [26], the work of Nieves-Rodríguez [13], and the transcriptome of the larval development of A. tropicus (NCBI Accession: PRJNA395289) [27], with zo-1, zo-2, cl-3, cl-15, and muc-2 being the genes selected (Table 2). qPCR reactions were performed on a CFX96TM real-time thermal cycler (BioRad, Hercules, CA, USA) using 10 µL of Sso EvaGreen mix (Cat. No. 1725201, BioRad), 9 µL of cDNA (5 ng µL−1), and 0.5 µL (0.15 µM) of each primer in a final volume of 20 µL under the following conditions: one denaturation cycle of 10 min at 95 °C followed by 40 cycles of 15 s at 95 °C and 1 min at 60 °C. A negative control was performed with each run by replacing the cDNA template with sterile water in the qPCR mix. All reactions were performed in duplicate. The β-actin gene was used as a reference for normalization. Relative gene expression was calculated using the −ΔΔCt formula [28].

2.8. Statistical Analysis

Results are reported as mean ± standard deviation (mean ± SD). Data were tested for normality and homogeneity of variances using Shapiro–Wilk and Levene’s tests, respectively, and then one-way ANOVA was performed for the analyses, and if differences were found, Tukey’s multiple comparison tests were used. Data that did not comply with the Shapiro–Wilk tests (feed conversion ratio) were analyzed using the Kruskal–Wallis test. Data were analyzed using GraphPad Prism 9.3.1 software for Windows (GraphPad Software, San Diego, CA, USA) with a significance value of 0.05.

3. Results

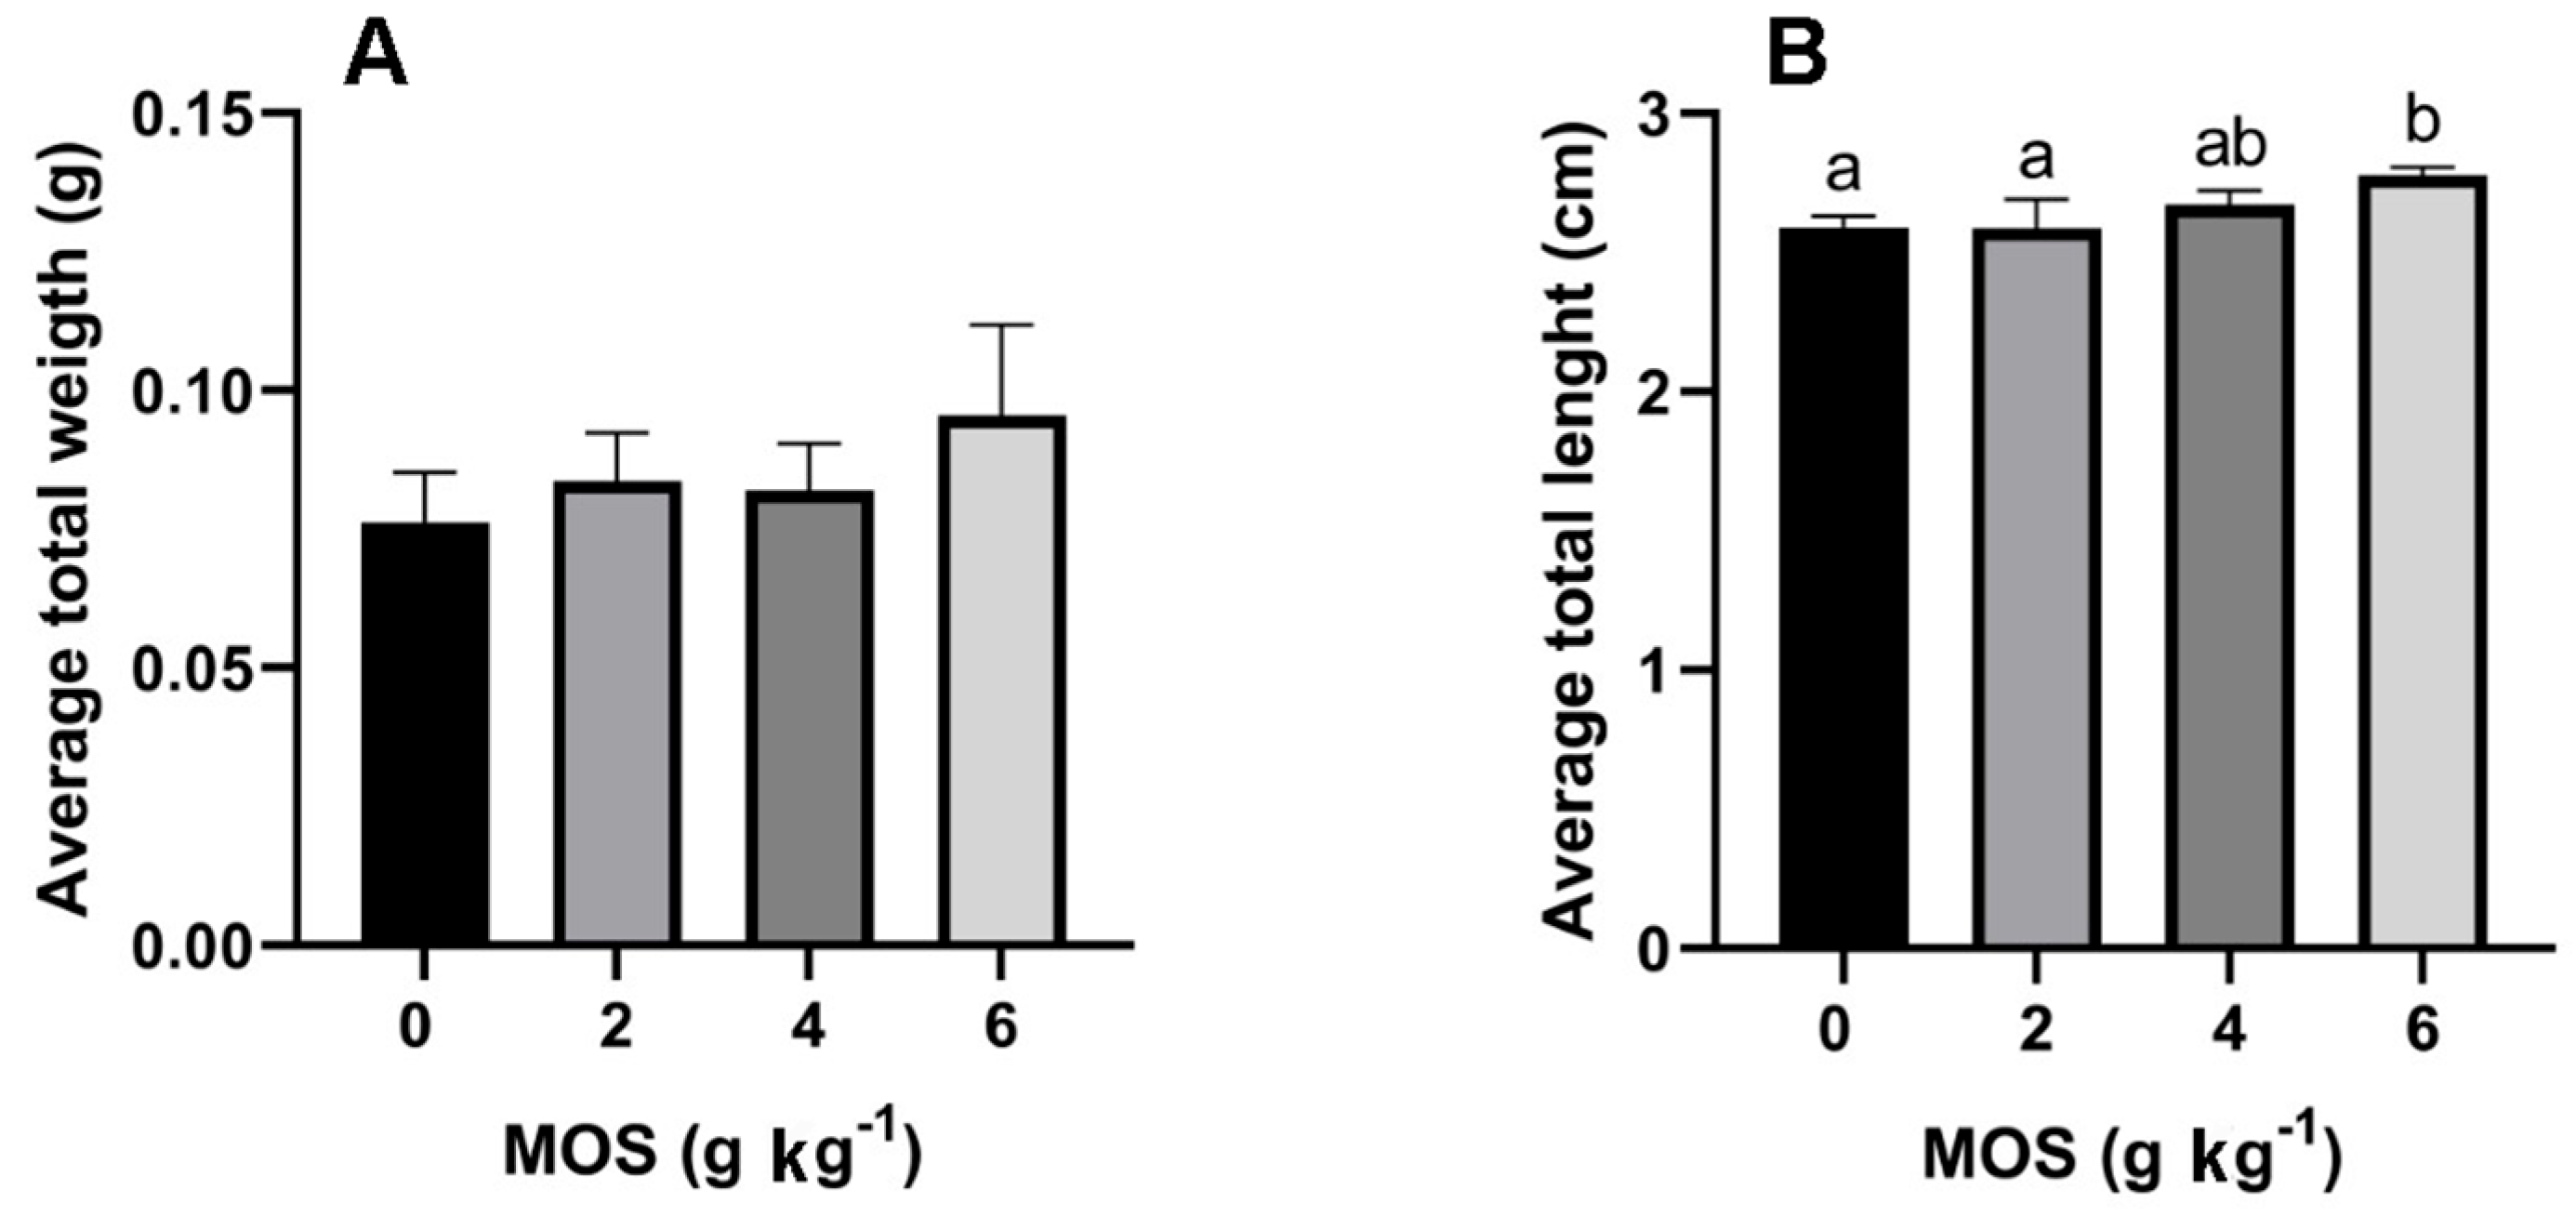
3.1. Growth Parameters Influenced by MOS Supplementation

No weight differences were recorded between the treatments at the end of the bioassay. However, it tended to increase (p > 0.05) (Figure 1A). The highest total length was recorded in larvae fed 6 g kg−1 MOS (2.775 ± 0.031 cm) compared to the control and 2 g kg−1 MOS larvae (2.588 ± 0.043 cm and 2.585 ± 0.010 cm, respectively) (Figure 1B).
Table 3 presents the results of growth parameters. There were no significant differences in absolute weight gain, feed conversion ratio, or condition factor that were related to including MOS in the diets. Increases in the specific growth rate (p > 0.05) and in the weight gain percentage (p > 0.05) were observed with the 6 g kg−1 MOS treatment. In treatments with 2 and 4 kg−1 MOS, the larvae had a lower survival (p > 0.05), and no differences were found between 6 kg−1 MOS and the control.

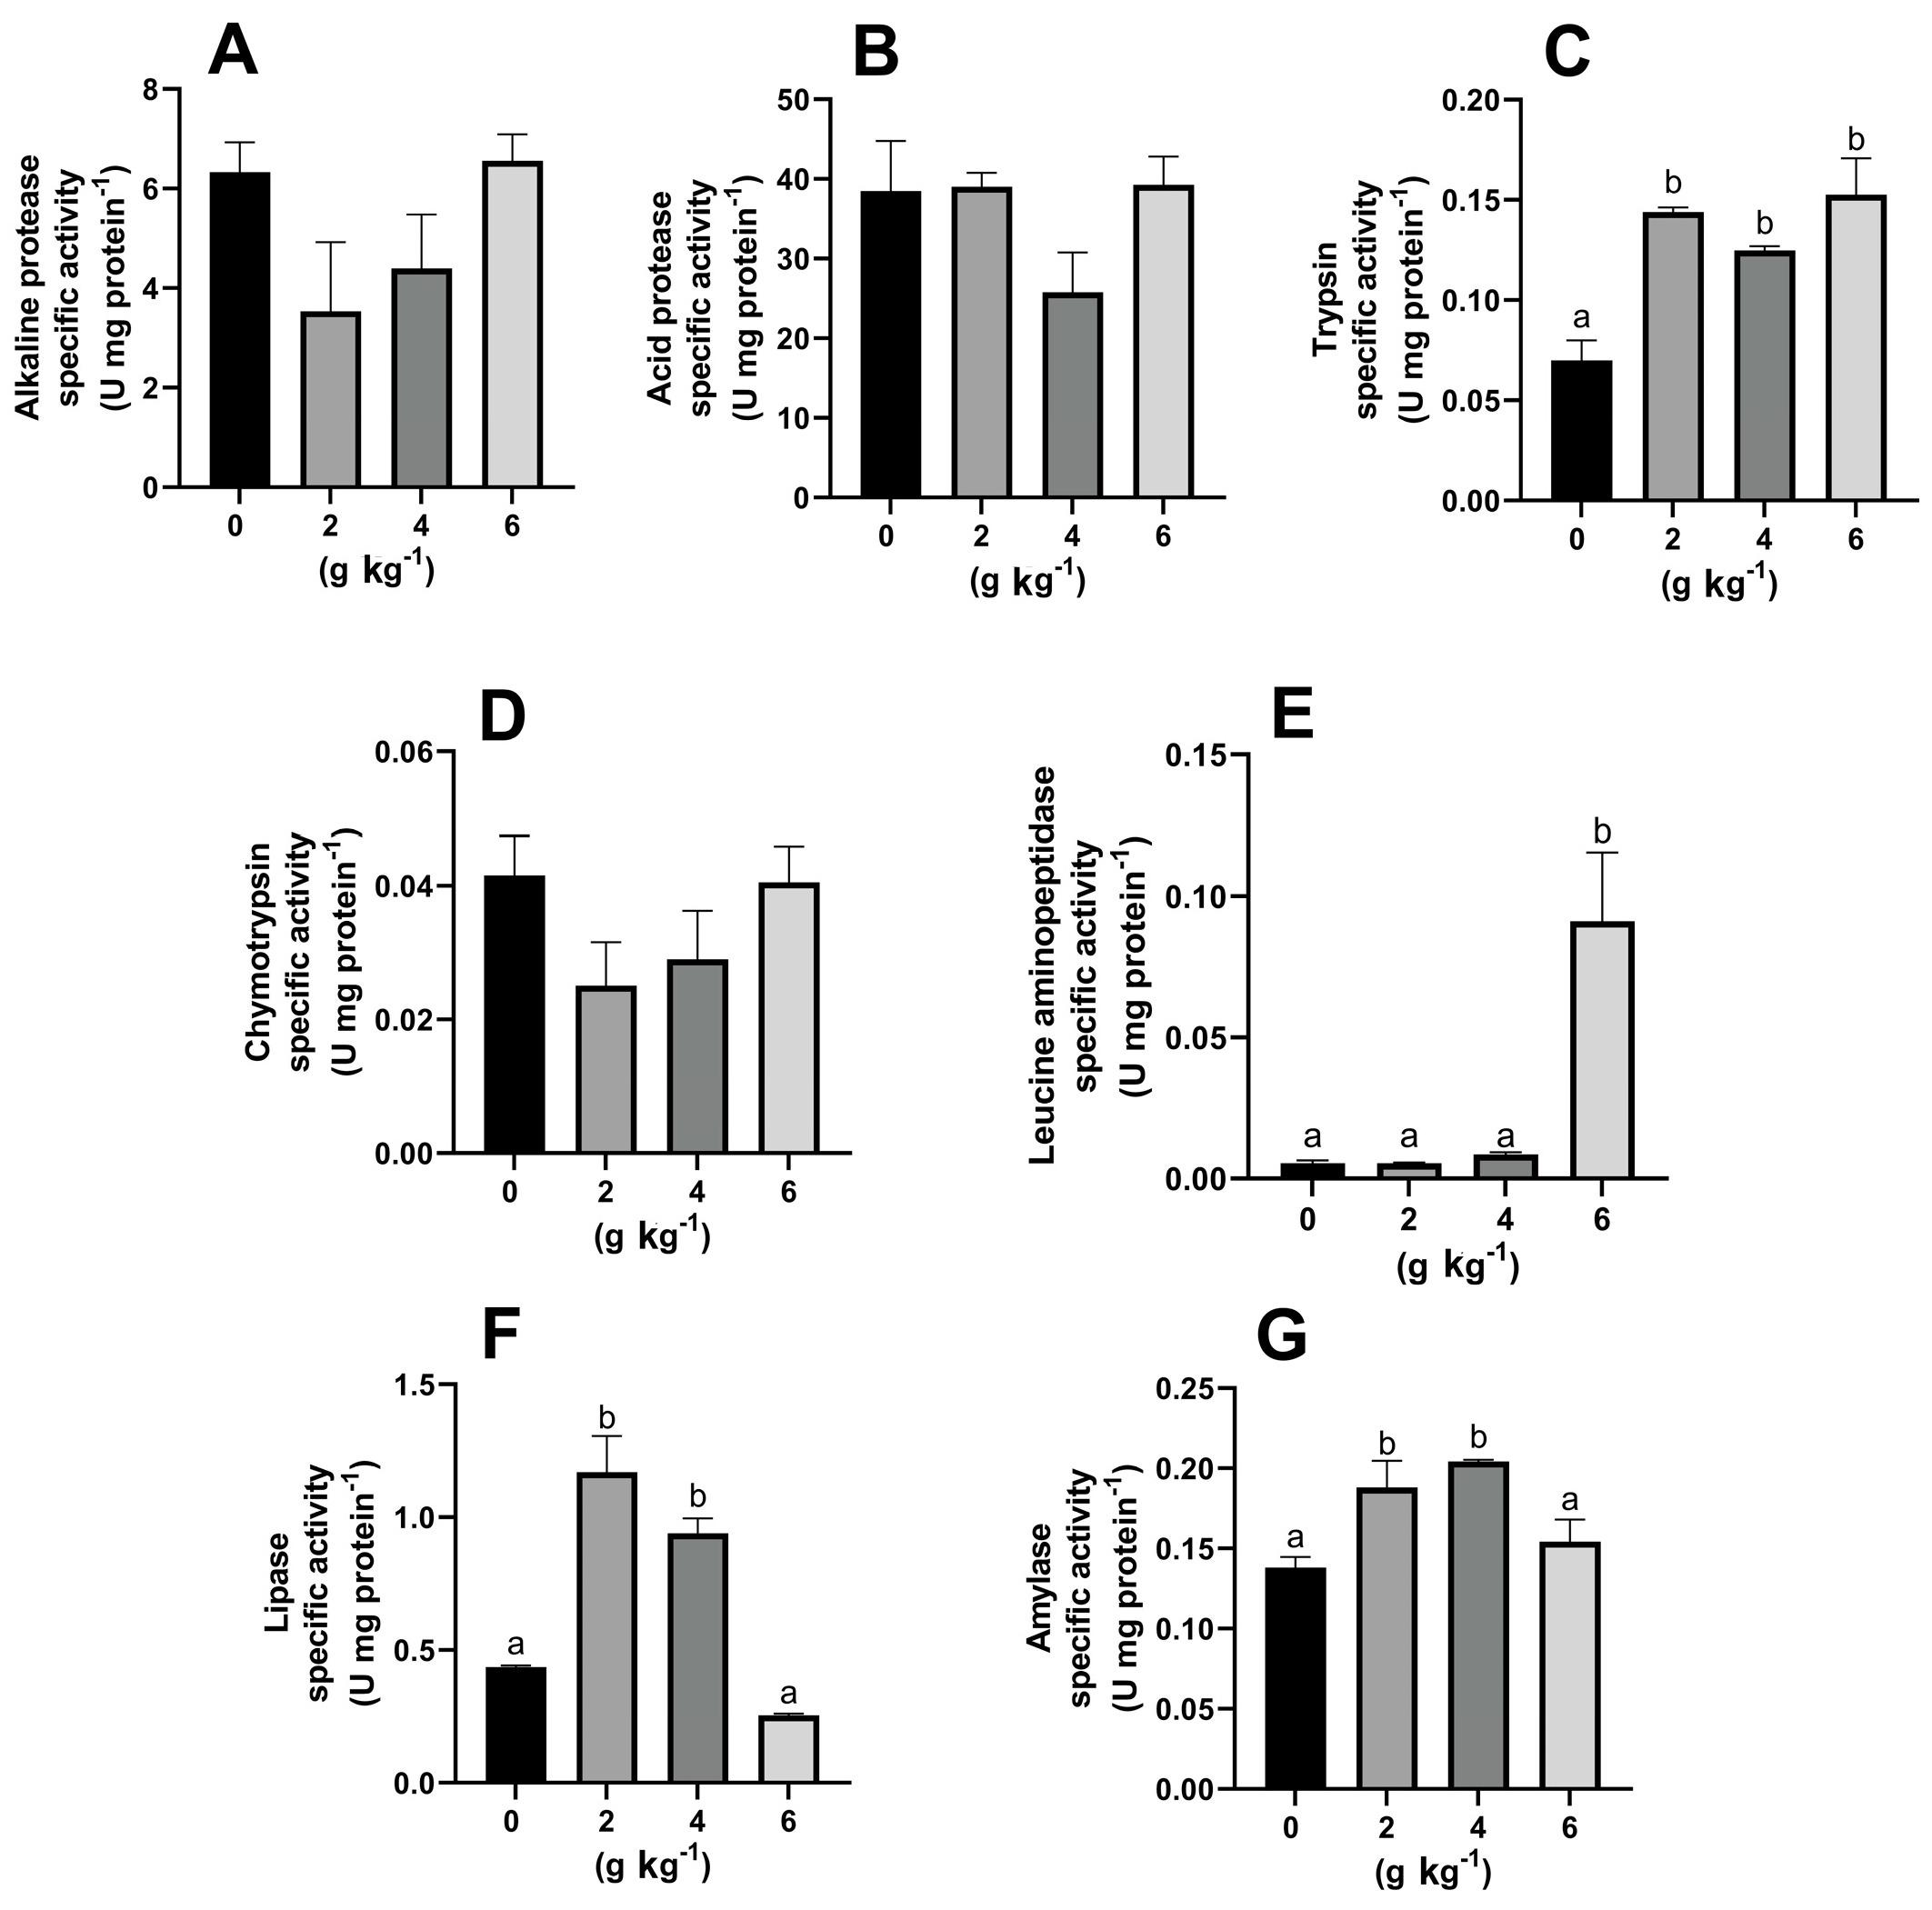
3.2. Effect of MOS on the Activity of Digestive Enzymes

Figure 2 shows the effect of MOS on the activity of digestive enzymes. Alkaline and acid protease activity did not change with MOS supplementation when comparing the treatments with the control (Figure 2A,B), and the same was observed for chymotrypsin activity (Figure 2D). Trypsin activity (Figure 2C) increased when adding MOS to the diets (p > 0.05) compared to the control, but leucine aminopeptidase activity only increased with 6 g kg−1 MOS (p > 0.05; Figure 2E). Lipase and α-amylase activities increased in larvae fed 2 and 4 g kg−1 MOS (p > 0.05). The activity of both enzymes in the 6 g kg−1 MOS group was equal to that of the control group.

3.3. Effect of MOS on Gene Expression of Intestinal Barrier Proteins

Figure 3 shows the relative expression of zo-1, zo-2, cl-3, cl-5, and muc-2 under the effect of MOS supplemented in diets for tropical gar larvae. The abundance of zo-1 and cl-15 transcripts was not affected by including MOS in the diets (Figure 3A,D). For the other genes, zo-2 expression was higher with 6 g kg−1 MOS treatment (p > 0.05), but lower MOS concentrations had no effect. The abundance of cl-3 transcripts was lower with 2 g kg−1 MOS (p > 0.05) but higher with 6 g kg−1 MOS (p > 0.05), and for muc-2, all concentrations of MOS increased the abundance of transcripts, with higher results using 4 g kg−1 MOS (p > 0.05).

4. Discussion

Prebiotics are non-digestible functional ingredients that stimulate the growth and metabolism of bacteria in the intestinal tract [29]. For an ingredient to be considered a prebiotic, it must have the following characteristics: (a) be resistant to gastric acidity and not be hydrolyzed by gastrointestinal enzymes, (b) not be absorbed by the intestinal tract, (c) selectively stimulate a limited number of beneficial strains, and (d) enhance local or systemic immunity against pathogen invasion [30,31]. Mannan oligosaccharides are complex carbohydrates that make up the yeast Saccharomyces cerevisiae cell wall, where mannose monomers are joined by glycosidic bonds and activate receptors and recognition proteins in the innate immune system in response to unknown substances [32].
Using these prebiotics in aquaculture has produced variable results depending on the type of prebiotic, concentration, and the study model. For example, in the Atlantic salmon (Salmo salar), the inclusion of MOS increased growth parameters and improved feed efficiency compared to FOS, GOS (galacto-oligosaccharides), and the control feed [33]. In cobia larvae (Rachycentron canadum), 2 g kg−1 MOS inclusion favored survival, increased intestinal microvilli, and improved stress sensitivity to salinity [34]. The inclusion of 2 g kg−1 MOS in Channa striata diets increased the absolute weight gain [35], while in juvenile hybrid groupers (Epinephelus lanceolatus × Epinephelus fuscoguttatus ), the inclusion of 6 g kg−1 MOS did not influence the weight gain, the specific growth rate, or survival [9]. In tropical gar larvae, absolute weight gain and survival decreased at concentrations of 2 and 4 g kg−1 MOS, but using 6 g kg−1 MOS, the survival was equal to that of the control group. In the grass-carp (Ctenopharyngodon idella), the inclusion of increasing concentrations of dietary MOS, just like in this work, did not produce a dose–response effect with the inclusion of 4 g kg−1 MOS, and the highest weight gain was observed; however, with increasing MOS concentrations, the weight gain was even lower than that of the control [36]. This negative effect could be explained by the interaction between MOS and the intestinal microbiota and its acclimation to the prebiotic inclusion. The gut microbiome of A. tropicus adults comprises Fusobacteria (42.26%), Proteobacteria (31.40%), Firmicutes (12.96%), and Bacteroidetes (11.79%), with nine strains with probiotic potential: Lactococcus lactis CAU929, CAU6600, CAU9951, and Cp6; Cetobacterium H69; Aeromonas hydrophila P5 and WR-5-3-2; Aeromonas sobria CP DC28; and Aeromonas hydrophila [37]. There is a lack of information about the microbial composition of A. tropicus larvae and whether these strains have the necessary enzymes to metabolize MOS.
It is difficult to relate all of the variables that can affect the survival of a larval culture. However, in many works, it has been agreed that feeding is an important factor. The activity of digestive enzymes and their changes regarding prebiotic inclusion in the diet have different results if we consider the species. In the common carp (Cyprinus carpio), a combination of MOS and β-glucans increased the activity of total proteases, trypsin, lipase, and α-amylase [38]. In the Japanese halibut (Paralichthys olivaceus), amylase and protease activity increased with 2.5 and 5 g kg−1 MOS, respectively [39], and in rainbow trout (Oncorhynchus mykiss) intestinal derived cells, 4 g kg−1 MOS did not change the activity of leucine aminopeptidase [40]. However, in A. tropicus larvae, the leucine aminopeptidase activity increased with 6 g kg−1 MOS, while lipase and amylase activities reduced when MOS increased in the diets. Nájera-Arzola et al. [15] also found an increase in the activity of digestive enzymes of A. tropicus juveniles fed with 4 g kg−1 MOS. In this work, trypsin, lipase, and amylase activities coincided with those found in juveniles but not with leucine aminopeptidase activity. Sepúlveda-Quiroz et al. [14] found that including 5 g kg−1 FOS in the diets of A. tropicus juveniles increased the activity of acid protease, chymotrypsin, and leucine aminopeptidase, concluding that the most used prebiotic in aquaculture has different effects on the same species. Leucine aminopeptidase is a cytosolic and membrane-bound enzyme with high physiological importance in the digestion of small peptides in intestinal enterocytes, where peptides are introduced by pinocytosis [41]. Considering the small intestine length in A. tropicus, as well the importance of the intestine during larval development, the increase in intestinal digestive activity could be of high importance in increasing the digestibility of proteins for the species.
The intestinal barrier is the first line of defense against pathogens and food antigens and comprises a mucus layer, the intestinal microbiota, the intestinal epithelial cells, and lamina propria [42]. Some of the beneficial effects of dietary mannan oligosaccharides on fish performance and feed intake and utilization are the improvement and maintenance of the enterocyte membrane functional integrity. In this way, the inclusion of MOS increases the assimilation and digestion of specific nutrients or possibly changes the levels of peptides that regulate the satiety system (satiation and appetite signals), such as NYY, CCK, and ghrelin. Additionally, the long-term system (body energy reserves) provides information for the hypothalamic central feeding system, which controls food intake and thus the release of digestive enzymes. However, the form of supplemented MOS, the dose and duration of supplementation depending on the species and stage of development of the fish, and the appropriate rearing conditions are determining factors in achieving improvements in growth and food conversion [29,43]. For this reason, intestinal barrier gene expression was also measured in our experiment. Notably, these genes have been considered markers to evaluate prebiotics’ effects; however, they have only been slightly studied. The protein mucin-2 is encoded by the gene muc-2, is the main component of intestinal mucus, and protects against inflammatory diseases [44]. Sepúlveda-Quiroz et al. [14] reported that juveniles of A. tropicus fed 10 and 15 g kg−1 FOS increased the expression of muc-2, while Nieves-Rodríguez et al. [13] did not find differences in muc-2 expression with β-glucan supplementation in A. tropicus juveniles. In this work, A. tropicus larvae that were fed 4 g kg−1 had higher muc-2 expression. The central role of claudins is the paracellular selectivity regulation of small ions. Claudins are equivalent to charge-selective pores that promote the permeability of specific ions, although there are also examples of claudins that generally increase rather than restrict paracellular permeability [45]. In the largemouth bass (Micropterus salmoides), the expression of the tight junction protein cl-1 decreased when fed a cottonseed protein concentrate and Chlorella vulgaris meal. On the other hand, cl-4 expression increased when animals were fed cottonseed protein concentrate, Chlorella vulgaris meal, and Clostridium autoethanogenum meal. However, zo-1 expression only increased with Clostridium autoethanogenum meal, making tight junction protein markers a good indicator of intestinal permeability when testing food additives [46]. In the rainbow trout (Oncorhynchus mykiss) intestinal derived cell line RTgutGC, 4 g kg−1 MOS up-regulated the expression of cl-3; however, higher MOS concentrations were not tested [41]. In this work, tropical gar larvae had decreased cl-3 expression with 2 g kg−1 MOS and increased cl-3 expression with 6 g kg−1 MOS. ZO-2 is a peripheral tight junction protein that belongs to the membrane-associated guanylate kinase protein family, allowing interaction with a wide variety of molecules, including cell adhesion proteins, cytoskeletal components, and nuclear factors [47]. In A. tropicus larvae, zo-2 expression increased with 6 g kg−1 MOS treatment. In fish, the works that considered the expression of intestinal barrier proteins are almost non-existent, and it is where this and other works in which A. tropicus has been used as a model provide guidelines to explore the effects of other prebiotics, including probiotics and synbiotics, on these genes.
There is still work to be conducted in this line of research. It has already been found that MOS have a positive effect on the larvae, so it is inferred that the intestinal microbiota has strains that have the enzymatic machinery to use these carbohydrates as a substrate; thus, future work could be performed to identify these strains in the intestinal microbiota.

5. Conclusions

The incorporation of mannan-oligosaccharides in diets for tropical gar larvae has a positive effect. The concentration of 6 g kg−1 produced the best results in terms of growth and the activity of digestive enzymes. Regarding the expression of intestinal barrier genes, treatments with 4 and 6 g kg−1 MOS also generated positive results by increasing the expression of zo-2, cl-3, and muc-2.

Author Contributions

Conceptualization, C.I.M.-V., E.S.P.-M. and C.A.A.-G.; methodology, C.I.M.-V., C.S.A.-V., G.M.P.-J. and C.A.S.-Q.; formal analysis, C.I.M.-V. and E.S.P.-M.; investigation, C.I.M.-V., E.S.P.-M. and C.A.A.-G.; resources, C.A.A.-G.; data curation, C.I.M.-V. and E.S.P.-M.; writing—original draft preparation, C.I.M.-V.; writing—review and editing, E.S.P.-M., C.A.A.-G. and C.S.A.-V.; visualization, C.I.M.-V., E.S.P.-M. and C.A.A.-G.; supervision, E.S.P.-M. and C.A.A.-G.; project administration, E.S.P.-M. and C.A.A.-G.; funding acquisition, C.A.A.-G. All authors have read and agreed to the published version of the manuscript.

Funding

This research was funded by the National Council on Science and Technology (CONACYT) in Mexico, grant number CB-2016-01-282765.

Institutional Review Board Statement

The animal study protocol was approved by the Secretaría de Agricultura, Ganadería, Desarrollo Rural, Pesca y Alimentación (protocol code NOM-062-ZOO-1999, 22 August 2001).

Data Availability Statement

The data that support the findings of this study are available upon request from the authors.

Conflicts of Interest

The authors declare no conflict of interest.

References

  1. Jobling, M. Fish nutrition research: Past, present and future. Aquac. Int. 2016, 24, 767–786. [Google Scholar] [CrossRef]
  2. Montalto, M.; D’Onofrio, F.D.; Gallo, A.; Cazzato, A.; Gasbarrini, G. Intestinal microbiota and its functions. Dig. Liver Dis. 2009, 3, 30–34. [Google Scholar] [CrossRef]
  3. Berg, G.; Rybakova, D.; Fischer, D.; Cernava, T.; Vergès, M.C.C.; Charles, T.; Chen, X.; Cocolin, L.; Eversole, K.; Corral, G.H.; et al. Microbiome definition re-visited: Old concepts and new challenges. Microbiome 2020, 8, 103. [Google Scholar] [CrossRef]
  4. Nayak, S.K. Role of gastrointestinal microbiota in fish. Aquac. Res. 2010, 41, 1553–1573. [Google Scholar] [CrossRef]
  5. Gainza, O.; Romero, J. Effect of mannan oligosaccharides on the microbiota and productivity parameters of Litopenaeus vannamei shrimp under intensive cultivation in Ecuador. Sci. Rep. 2020, 10, 2719. [Google Scholar] [CrossRef]
  6. Gibson, G.R.; Hutkins, R.; Sanders, M.E.; Prescott, S.L.; Reimer, R.A.; Salminen, S.J.; Scott, K.; Stanton, C.; Swanson, K.S.; Cani, P.D.; et al. The International Scientific Association for Probiotics and Prebiotics (ISAPP) consensus statement on the definition and scope of prebiotics. Nat. Rev. Gastroenterol. Hepatol. 2017, 14, 491–502. [Google Scholar] [CrossRef] [Green Version]
  7. Ringø, E.; Olsen, R.E.; Gifstad, T.Ø.; Dalmo, R.A.; Amlund, H.; Hemre, G.-I.; Bakke, A.M. Prebiotics in aquaculture: A review. Aquac. Nutr. 2010, 16, 117–136. [Google Scholar] [CrossRef]
  8. Lu, J.; Qi, C.; Limbu, S.M.; Han, F.; Yang, L.; Wang, X.; Qin, J.G.; Chen, L. Dietary mannan oligosaccharide (MOS) improves growth performance, antioxidant capacity, non-specific immunity and intestinal histology of juvenile Chinese mitten crabs (Eriocheir sinensis). Aquaculture 2019, 510, 337–346. [Google Scholar] [CrossRef]
  9. Ren, Z.; Wang, S.; Cai, Y.; Wu, Y.; Tian, L.; Wang, S.; Jiang, L.; Guo, W.; Sun, Y.; Zhou, Y. Effects of dietary mannan oligosaccharide supplementation on growth performance, antioxidant capacity, non-specific immunity and immune- related gene expression of juvenile hybrid grouper (Epinephelus lanceolatus × Epinephelus fuscoguttatus ). Aquaculture 2020, 523, 735195. [Google Scholar] [CrossRef]
  10. Mansour, M.R.; Akrami, R.; Ghobadi, S.H.; Denji, K.A.; Ezatrahimi, N.; Gharaei, A. Effect of dietary mannan oligosaccharide (MOS) on growth performance, survival, body composition, and some hematological parameters in giant sturgeon juvenile (Huso huso Linnaeus, 1754). Fish Physiol. Biochem. 2012, 38, 829–835. [Google Scholar] [CrossRef]
  11. Márquez-Couturier, G.; Vázquez-Navarrete, C.J. Estado del arte de la biología y cultivo de pejelagarto (Atractosteus tropicus). Agroproductividad 2015, 8, 44–51. [Google Scholar]
  12. Frías-Quintana, C.A.; Domínguez-Lorenzo, J.; Álvarez-González, C.A.; Tovar-Ramírez, D.; Martínez-García, R. Using cornstarch in microparticulate diets for larvicultured tropical gar (Atractosteus tropicus). Fish Physiol. Biochem. 2016, 42, 517–528. [Google Scholar] [CrossRef] [PubMed]
  13. Nieves-Rodríguez, K.; Álvarez-González, C.; Peña-Marín, E.; Vega-Villasante, F.; Martínez-García, R.; Camarillo-Coop, S. Effect of β-Glucans in diets on growth, survival, digestive enzyme activity, and immune system and intestinal barrier gene expression for Tropical Gar (Atractosteus tropicus) juveniles. Fishes 2018, 3, 27. [Google Scholar] [CrossRef] [Green Version]
  14. Sepúlveda-Quiroz, C.A.; Peña-Marín, E.S.; Pérez-Morales, A.; Martínez-García, R.; Alvarez-Villagomez, C.S.; Maytorena-Verdugo, C.I.; Camarillo-Coop, S.; Vissio, P.G.; Pérez Sirkin, D.; Tovar-Ramírez, D.; et al. Fructooligosaccharide supplementation in diets for tropical gar (Atractosteus tropicus) juvenile: Effects on morphophysiology and intestinal barrier function. Aquac. Res. 2020, 52, 37–50. [Google Scholar] [CrossRef]
  15. Nájera-Arzola, I.C.; Álvarez-González, C.A.; Frías-Quintana, C.A.; Peña, E.; Martínez-García, R.; Camarillo-Coop, S.; Méndez-Marín, O.; Gisbert, E. Evaluation of Mannan oligosaccharides (MOS) in balanced diets for tropical gar juveniles (Atractosteus tropicus). Hidrobiológica 2018, 28, 239–246. [Google Scholar] [CrossRef]
  16. Mexican Standard NOM-062-ZOO-1999; Diario Oficial de la Federación. Ministry of Agriculture, Livestock, Rural Development, Fisheries and Food: Ciudad de Mexico, Mexico, 1999. Available online: http://publico.senasica.gob.mx/?doc=743 (accessed on 15 May 2022).
  17. AOAC (Association of Official Analytical Chemists). Official Methods of Analysis, 17th ed.; Association of Official Analytical Chemists: Arlington, VA, USA, 2000. [Google Scholar]
  18. Frías-Quintana, C.A.; Márquez-Couturier, G.; Alvarez-González, C.A.; Nolasco-Soria, H.; Galaviz-Espinosa, M.A.; Martínez-García, R.; Camarillo-Coop, S.; Martínez-Yañez, R.; Gisbert, E. Development of digestive tract and enzyme activities during the early ontogeny of the tropical gar Atractosteus tropicus. Fish Physiol. Biochem. 2015, 41, 1075–1091. [Google Scholar] [CrossRef] [PubMed]
  19. Bradford, M.M. A rapid and sensitive method for the quantization of microgram quantities of protein utilizing the principle of protein-dye binding. Anal. Biochem. 1976, 72, 248–254. [Google Scholar] [CrossRef]
  20. Anson, M.L. The estimation of pepsin, trypsin, papain, and cathepsin with hemoglobin. J. Gen. Physiol. 1938, 22, 79–89. [Google Scholar] [CrossRef]
  21. Walter, H.E. Proteinases: Methods with hemoglobin, casein and azocoll as substrates. In Methods of Enzymatic Analysis; Bergmeyer, H.U., Ed.; Verlag Chemie: Weinheim, Germany, 1984; Volume 5, pp. 270–277. [Google Scholar]
  22. García-Carreño, F.L.; Hernández-Cortés, M.; Haard, N.F. Enzymes with peptidase and proteinase activity from the digestive systems of a freshwater and a marine decapod. J. Agric. Food Chem. 1994, 42, 1456–1461. [Google Scholar] [CrossRef]
  23. Maroux, S.; Louvard, D.; Barath, J. The aminopeptidase from hog intestinal brush border. Biochim. Biophys. Acta (BBA)-Enzymol. 1973, 321, 282–295. [Google Scholar] [CrossRef]
  24. Versaw, W.; Cuppett, S.L.; Winters, D.D.; Williams, L.E. An improved colorimetric assay for bacterial lipase in nonfat dry milk. J. Food Sci. 1989, 54, 232–254. [Google Scholar] [CrossRef]
  25. Robyt, J.F.; Whelan, W. Amylases. In Starch and Its Derivates; Radley, J.A., Ed.; Chapman and Hall: London, UK, 1968. [Google Scholar]
  26. Pérez-Jiménez, G.M. Efecto del Prebiótico Fructooligosacárido (FOS) Sobre la Fisiología Digestiva y Barrera Intestinal en Larvas de Pejelagarto (Atractosteus tropicus). Master’s Thesis, División Académica de Ciencias Biológicas, Universidad Juárez Autónoma de Tabasco, Villahermosa, Mexico, 2020. [Google Scholar]
  27. Martínez-Burguete, T.; Peña-Marín, E.S.; García-Gasca, A.; Álvarez-González, C.A.; Llera-Herrera, R. Nutrigenomic marker discovery by de novo transcriptomic sequencing during early development of the tropical gar (Atractosteus tropicus). Aquac. Res. 2021, 52, 3829–3842. [Google Scholar] [CrossRef]
  28. Livak, K.J.; Schmittgen, T.D. Analysis of relative gene expression data using realtime quantitative PCR and the 2(−delta delta C(T)) method. Methods 2001, 25, 402–408. [Google Scholar] [CrossRef] [PubMed]
  29. Gatlin, D.M., III; Peredo, A.M. Prebiotics and Probiotics: Definitions and Applications; Southern Regional Aquaculture Center: Stoneville, MS, USA, 2012; Volume 4711, pp. 1–8. [Google Scholar]
  30. Roberfroid, M. Prebiotics: The Concept Revisited. J. Nutr. 2007, 137, 830S–837S. [Google Scholar] [CrossRef] [PubMed] [Green Version]
  31. Teng, P.Y.; Kim, W.K. Review: Roles of Prebiotics in Intestinal Ecosystem of Broilers. Front. Vet. Sci. 2018, 5, 245. [Google Scholar] [CrossRef]
  32. Torrecillas, S.; Montero, D.; Izquierdo, M. Improved health and growth of fish fed mannan oligosaccharides: Potential mode of action. Fish Shellfish Immunol. 2014, 36, 525–544. [Google Scholar] [CrossRef]
  33. Grisdale-Helland, B.; Helland, S.J.; Gatlin, D.M., III. The effects of dietary supplementation with mannanoligosaccharide, fructooligosaccharide or galactooligosaccharide on the growth and feed utilization of Atlantic salmon (Salmo salar). Aquaculture 2008, 283, 163–167. [Google Scholar] [CrossRef]
  34. Salze, G.; McLean, E.; Schwarz, M.H.; Craig, S.R. Dietary mannan oligosaccharide enhances salinity tolerance and gut development of larval cobia. Aquaculture 2008, 274, 148–152. [Google Scholar] [CrossRef]
  35. Talpur, A.D.; Munir, M.B.; Mary, A.; Hashim, R. Dietary probiotics and prebiotics improved food acceptability, growth performance, haematology and immunological parameters and disease resistance against Aeromonas hydrophila in snakehead (Channa striata) fingerlings. Aquaculture 2014, 426–427, 14–20. [Google Scholar] [CrossRef]
  36. Lu, Z.Y.; Feng, L.; Jiang, W.D.; Wu, P.; Liu, Y.; Kuang, S.Y.; Tang, L.; Zhou, X.Q. Mannan oligosaccharides improved growth performance and antioxidant capacity in the intestine of on-growing grass carp (Ctenopharyngodon idella). Aquac. Rep. 2020, 17, 100313. [Google Scholar] [CrossRef]
  37. Méndez-Pérez, R.; García-López, R.; Bautista-López, J.S.; Vázquez-Castellanos, J.; Álvarez-Gonzales, C.; Peña-Marín, E.; Baltierra-Trejo, E.; Adams-Schroeder, R.; Domínguez-Rodríguez, V.; Melgar-Valdés, C.; et al. High-throughput sequencing of the 16S rRNA gene to analyze the gut microbiome in juvenile and adult tropical gar (Atractosteus tropicus). Lat. Am. J. Aquat. Res. 2020, 48, 456–479. [Google Scholar] [CrossRef]
  38. Mohammadian, T.; Nasirpour, M.; Tabandeh, M.R.; Mesbah, M. Synbiotic effects of β-glucan, mannan oligosaccharide and Lactobacillus casei on growth performance, intestine enzymes activities, immune-hematological parameters and immune-related gene expression in common carp, Cyprinus carpio: An experimental infection with Aeromonas hydrophila. Aquaculture 2019, 511, 634197. [Google Scholar] [CrossRef]
  39. Ye, J.D.; Wang, K.; Li, F.D.; Sun, Y.Z. Single or combined effects of fructo- and mannan oligosaccharide supplements and Bacillus clausii on the growth, body composition, digestive enzyme activity, innate immune response and lipid metabolism of the Japanese flounder Paralichthys olivaceus. Aquac. Nutr. 2011, 17, e902e11. [Google Scholar] [CrossRef]
  40. Wang, J.; Lei, P.; Gamil, A.A.A.; Lagos, L.; Yue, Y.; Schirmer, K.; Mydland, L.T.; Øverland, M.; Krogdahl, Å.; Kortner, T.M. Rainbow Trout (Oncorhynchus Mykiss) Intestinal Epithelial Cells as a Model for Studying Gut Immune Function and Effects of Functional Feed Ingredients. Front. Immunol. 2019, 10, 152. [Google Scholar] [CrossRef] [Green Version]
  41. David-Ruales, C.A.; Machado-Fracalossi, D.; Vásquez-Torres, W. Early development in fish larvae, key for starting exogenous feeding. Rev. Lasallista Investig. 2018, 15, 180–194. [Google Scholar] [CrossRef]
  42. Kokot, A.M.; Jarocka-Cyrta, E.; Drabińska, N. Overview of the Importance of Biotics in Gut Barrier Integrity. Int. J. Mol. Sci. 2022, 23, 2896. [Google Scholar] [CrossRef]
  43. Sanders, M.E.; Merenstein, D.J.; Reid, G.; Gibson, G.R.; Rastall, R.A. Probiotics and prebiotics in intestinal health and disease: From biology to the clinic. Nat. Rev. Gastroenterol. Hepatol. 2019, 16, 605–616. [Google Scholar] [CrossRef]
  44. Heazlewood, C.; Cook, M.; Eri, R.; Price, G.; Tauro, S.; Taupin, D.; Thornton, D.; Png, C.; Crockford, T.; Cornall, R.; et al. Aberrant mucin assembly in mice causes endoplasmic reticulum stress and spontaneous inflammation resembling ulcerative colitis. PLoS Med. 2008, 5, e54. [Google Scholar] [CrossRef] [Green Version]
  45. Findley, M.K.; Koval, M. Regulation and roles for claudin-family tight junction proteins. IUBMB Life 2010, 61, 431–437. [Google Scholar] [CrossRef] [Green Version]
  46. Li, L.; Liu, X.; Wang, Y.; Huang, Y.; Wang, C. Effects of alternate feeding between fish meal and novel protein diets on the intestinal health of juvenile largemouth bass (Micropterus salmoides). Aquac. Rep. 2022, 23, 101023. [Google Scholar] [CrossRef]
  47. González-Marisal, L.; Miranda, J.; Raya-Sandino, A.; Domínguez-Calderón, A.; Cuellar-Perez, F. ZO-2, a tight junction protein involved in gene expression, proliferation, apoptosis, and cell size regulation. Ann. N. Y. Acad. Sci. 2017, 1397, 35–53. [Google Scholar] [CrossRef] [PubMed]
Figure 1. Effect of mannan-oligosaccharides on (A) average total weight and (B) average total length of A. tropicus larvae. Letters above bars indicate differences between groups (p > 0.05).
Fishes 07 00127 g001
Figure 2. Effect of dietary mannan-oligosaccharides on the specific activity (U mg protein−1) of digestive enzymes of A. tropicus. (A) Alkaline protease; (B) acid protease; (C) trypsin; (D) chymotrypsin; (E) leucine aminopeptidase; (F) lipase; (G) α-amylase. Letters above bars indicate differences between groups (p > 0.05).
Fishes 07 00127 g002
Figure 3. Effect of dietary mannan-oligosaccharides on the relative expression of genes involved in the intestinal barrier of A. tropicus larvae. (A) zo-1; (B) zo-2; (C) cl-3; (D) cl-15; (E) muc-2. Letters above bars indicate differences between groups (p > 0.05).
Fishes 07 00127 g003
Table 1. Composition of the experimental diets.
Ingredients (g kg−1)/MOS (g kg−1)0246
Fish meal a305.4305.4305.4305.4
Poultry meal a150150150150
Pork meal a150150150150
Soybean meal a150150150150
Starch b123.7121.7119.7117.7
Soybean oil c79.979.979.979.9
MOS d0246
Mineral premix e5555
Vitamin premix e10101010
Grenetin f20202020
Vitamin C g5555
Vitamin E g1111
Proximal composition g/100g dry matter
Protein44.2044.0044.1544.05
Lipids14.9015.1015.1015.00
Ash12.4412.4012.4312.38
NFE 128.4628.528.3228.57
a Proteínas marinas y agrícolas S.A. de C.V., Guadalajara, Jalisco; b Pronat Ultra, Yucatán, México; c Industrias Ragasa S.A. de C.V.; d Agaviótica, Monterrey, Nuevo León; e Vitamin premix composition: vitamin A, 10,000,000 UI; vitamin D3, 2,000,000 UI; vitamin E, 100,000 UI; vitamin K3, 4.0 g; thiamine B1, 8.0 g; riboflavin B2, 8.7 g; pyridoxine B6, 7.3 g; vitamin B12, 20.0 mg; niacin, 50.0 g; pantothenic acid, 22.2 g; inositol, 0.15 mg; nicotinic acid, 0.16 mg; folic acid, 4.0 g; biotin, 500 mg; vitamin C, 10.0 g; choline, 0.3 mg; excipient c.s.p., 2 g; manganese, 10 g; magnesium, 4.5 g; zinc, 1.6 g; iron, 0.2 g; copper, 0.2 g; iodine, 0.5 g; selenium, 40 mg; cobalt, 60 mg; f D’gari, Productos alimenticios Relámpago, S.A. de C.V.; g Rovimix Stay-C 35 DSM, Jalisco. 1 NFE = nitrogen-free extract: 100-(% protein + lipids + % ash).
Table 2. Primers used to quantify the expression of genes related to the intestinal barrier of A. tropicus larvae.
Target GenePrimer Sequence (5′-3′)R2Amplicon Size (bp)Reference
zo-1FW: TGTGCCTCAGATCACTCCACRV: AAAGGCAGAGGGTTGGCTTC0.95123[23]
zo-2FW: TACCCATGGAAAATGTGCCTCARV: CGGGGTCTCTTCACGGTAAT0.9888[23]
claudin-3FW: CCTGTATATCGGCTGGGCTGRV: TGCAAGCTAACGACTACGCA0.91285[23]
claudin-15FW: ATCCCGGGACAAAGTACGAGRV:CAGATCGCTAGCAAGGCAGA0.9370[23]
muc-2FW: GGCCTCCTCAAGAGCACGGTGRV:TCTGCACGCTGGAGCACTCAATG-100[13]
β-actinFW: GGACTTTGAGCAGGAGATGGRV:GACGGAGTATTTACGCTCTGG-355[13]
Table 3. Growth parameters in MOS-fed larvae. Superscript letters indicate differences between groups (p > 0.05). For the measurements, 30% of the larvae in each tank were considered.
Parameter/MOS (g kg−1)0246
AWG (g fish−1)0.042 ± 0.0090.056 ± 0.0090.055 ± 0.0090.067 ± 0.016
WG (%)122.83 ± 26.28 a196.97 ± 30.74 a202.29 ± 31.62 a232.69 ± 57.30 b
SGR (% day−1)3.98 ± 0.60 a5.42 ± 0.53 a5.51 ± 0.54 a5.96 ± 0.84 b
FCR3.94 ± 0.922.93 ± 0.492.97 ± 0.512.49 ± 0.58
K0.470.400.330.37
S (%)24.87 ± 1.26 a15.14 ± 2.57 b13.16 ± 0.72 b25.28 ± 1.67 a
AWG = absolute weight gain; WG (%) = weight gain; SGR = specific growth rate; FCR = feed conversion ratio; K = condition factor; S = survival.
Publisher’s Note: MDPI stays neutral with regard to jurisdictional claims in published maps and institutional affiliations.

