Preceding Fall Drought Conditions and Overwinter Precipitation Effects on Spring Wildland Fire Activity in Canada
by
 ,
,
Chelene Hanes
1,2,* ,
,
Mike Wotton
1,2,
Douglas G. Woolford
3,
David L. Martell
1 and
Mike Flannigan
4 1
Graduate Department of Forestry, John H. Daniels Faculty of Architecture, Landscape and Design, University of Toronto, 33 Willcocks Street, Toronto, ON M5S 3B3, Canada
2
Great Lakes Forestry Centre, Canadian Forest Service, Natural Resources Canada, 1219 Queen St. E, Sault Ste. Marie, ON P6A 2E5, Canada
3
Statistical and Actuarial Sciences, University of Western Ontario, 1151 Richmond St., London, ON N6A 3K7, Canada
4
Department of Renewable Resources, University of Alberta, 51 General Services Building, Edmonton, AB T6G 2H1, Canada
*
Author to whom correspondence should be addressed.
Fire 2020, 3(2), 24; https://doi.org/10.3390/fire3020024
Submission received: 29 May 2020
/
Revised: 17 June 2020
/
Accepted: 19 June 2020
/
Published: 23 June 2020
/
Corrected: 24 August 2022
(This article belongs to the Special Issue Boreal Fire-Fuels Interactions)
Abstract
:Spring fire activity has increased in parts of Canada, particularly in the west, prompting fire managers to seek indicators of potential activity before the fire season starts. The overwintering adjustment of the Canadian Fire Weather Index System’s Drought Code (DC) is a method to adjust and carry-over the previous season’s drought conditions into the spring and potentially point to what lies ahead. The occurrence of spring fires is most strongly influenced by moisture in fine fuels. We used a zero-inflated Poisson regression model to examine the impact of the previous end of season Drought Code (DCf) and overwinter precipitation (Pow) while accounting for the day-to-day variation in fine fuel moisture that drives ignition potential. Impacts of DCf and Pow on area burned and fire suppression effectiveness were also explored using linear and logistic regression frameworks. Eight fire management regions across the boreal forests were analyzed using data from 1979 to 2018. For the majority of regions, drier fall conditions resulted in more human-caused spring fires, but not in greater area burned or reduced suppression effectiveness. The influence of Pow was much more variable pointing to the conclusion that Pow alone is not a good indicator of spring drought conditions.
1. Introduction
Human-induced climate change has increased the area burned, number, and severity of wildfires across Canada [1,2,3]. These increases are predicted to continue and worsen over the 21st Century [4,5] and to create an increasingly complex decision-making environment for fire management agencies. Spring fires are of particular concern to fire management due to their potential for devastating outcomes [6]. In 2016, the Horse River wildfire burned through Fort McMurray and part of northeastern Alberta. It became the costliest natural disaster in Canadian history, consuming almost 600,000 hectares of forest, destroying 2400 structures, and resulting in the evacuation of 88,000 people [7]. Two years after the fire, total insured losses were assessed at approximately $3.8 billion [8]. In 2011, the Flat Top Complex wildfire caused more than $700 million in losses in and around Slave Lake, Alberta. More than 10,000 people were evacuated, and hundreds of homes and businesses were destroyed [9]. These are only two examples in recent history of large spring fires that have sparked cause for concern. The fire season is changing; it has been found to be starting earlier in the spring particularly in western parts of the country [3,10]. Questions around both when fire management agencies should expect the fire season to start and how drought from the previous season carries over through the winter and affects the following spring fire season remain unanswered.
In Canada, drought, as it pertains to fire danger and fire behavior, is currently tracked by operational fire managers using the Drought Code (DC), which represents the moisture of deep organic fuels. The DC is one of three fuel moisture codes in the Fire Weather Index (FWI) System of the Canadian Forest Fire Danger Rating System (CFFDRS) [11]. These systems are used daily by all Canadian fire management agencies to guide their decision-making at various spatial and temporal scales. The DC has a time lag of approximately 53 days, enabling it to carry-over drought effects from one season into the next [12]. Within the FWI System, the DC is therefore responsible for representing long-term drought in contrast with the Fine Fuel Moisture Code (FFMC), which has a time lag of 2/3 day and Duff Moisture Code (DMC) with a time lag of 15 days.
The DC overwinter adjustment is the method used to carry-over drought between fire seasons [13]. Assuming sufficient precipitation occurred over the winter (>200 mm) and drought conditions did not exist the previous fall, the default spring DC starting value is 15. If insufficient precipitation occurred (≤200 mm) and drought conditions are detected, a procedure to overwinter the DC is applied. This procedure is a rough approximation of the mechanisms that affect winter and spring moisture transfer due to evaporation, sublimation, discharge, and percolation. The standard procedure takes into account four inputs: (1) The DC value of the last day of FWI System calculation from the previous fall (DCf); (2) the total overwinter precipitation (mm) between that date and the start of FWI System calculations in the spring (Pow); (3) the carry-over fraction of last fall’s moisture deficit ɑ (1.00, 0.75 or 0.50), based on the presence or absence of conditions that may deplete soil moisture i.e., chinook conditions; and (4) the fraction of winter precipitation effective at recharging depleted moisture reserves in spring b (0.50, 0.75, or 0.90) based on site drainage, snow conditions, presence/absence of chinooks, and topography [13]. Fire managers estimate ɑ and b using their local knowledge and assessment of the fall, winter, and spring weather conditions. The carry-over fraction of last fall’s moisture deficit ɑ is only estimated if weather stations were turned off prior to freeze-up or snow accumulation, therefore DCf was not measured. The procedure takes the following form
where Qs is the starting spring moisture equivalent of the DC value and Qf denotes the final fall moisture equivalent, which is calculated using
If an agency incorrectly estimates the spring DC starting value it will correct itself after substantial rain; otherwise it can be carried through for much of the fire season [12]. Alternatively, several days of heavy rain or equivalent snowmelt can saturate organic layers and reduce the DC to zero. Since this overwinter adjustment relies heavily on the estimated coefficients (a and b), the method is highly subjective and there is debate within the fire operations community concerning the need for an overwintering procedure. In Canada, the western provinces regularly overwinter the DC, while those in the east do occasionally or not at all. It is not known if this differentiation is based on objective observational evidence or organizational memory.
There are limited studies in Canada investigating the impacts of drought on fire activity explicitly. A study in British Columbia showed area burned to be primarily related to summer drought conditions in most of the province, with the exception of one grass-dominated landscape where area burned was more strongly related to winter drought [14]. Extensive studies of drought and fire have been conducted in the western US, primarily concentrated on area burned [15,16,17,18,19]. Most studies have shown strong correlations between drought and area burned, but results differ depending on regional climatology, topography, and fuel type (i.e., forest versus non-forest), and few focus on the spring fire season exclusively. Differences in study results have also been attributed to the drought index used, including the Palmer Drought Severity Index (PDSI) [20], Keetch–Byram Drought Index (KBDI) [21], Standardized Precipitation Index (SPI) [22], and the Energy Release Component [23]; each of these indices has different sensitivities to mechanisms that affect wildfire [24]. Urbieta et al. [25] found a significant relationship between moisture deficits in the fall through spring and increased summer fire occurrence in Southern France and Southern California. Other studies have found relationships between the timing of snow melt and fire activity [15,26] where increased fire activity has been associated with earlier snowmelt. Others found a negative correlation between snow water equivalents and area burned [19,27].
Despite having an overwintering procedure for Canada, there has been little work that has explicitly explored the linkage between previous season drought and spring fire in the country despite clear questions posed more than forty years ago [28]. The influence of current season drought conditions on spring fires is better understood. Spring fires are predominately human caused [29], and from an environmental perspective, their ignition is controlled by the moisture of fine forest floor fuels, which in the FWI System are tracked by the FFMC [12]. Although it is assumed that longer-term drought can affect spring fires, the interaction of moisture between the deep organic and surface fine fuels is not as well understood by the fire community [30]. Therefore, a method is needed to separate the different potential drivers of spring fire activity.
The day-to-day variability in the number of human-caused spring fires occurring is largely influenced by the FFMC, which is modelled regionally. Work by Cunningham and Martell [31] showed this could be modelled as a Poisson process with the expected number of fires per day dependent on the FFMC. Adding the DCf and Pow to this model framework would allow us to capture their impact on the strong day-to-day variability in the occurrence of human-caused spring fires.
Suppression effectiveness and area burned are also thought be correlated to spring drought conditions [32], but again, such relationships have not been shown explicitly. High spring DC values may indicate situations where lower layers of deep duff are drier than those above potentially leading to mop-up problems, namely the suppression difficulties associated with persistent smoldering and greater availability of dense and/or larger woody fuels [32].
The objective of this study is to assess the extent to which moisture conditions at the end of the previous fire season and/or overwinter precipitation affect fire activity in forested regions in the spring. We examine several aspects of fire activity, including the number of fires, area burned, and a measure of suppression effectiveness, focusing on human-caused fires as they are the dominant type of spring fire ignitions in our set of study areas in Alberta and Ontario, Canada.
2. Materials and Methods
2.1. Weather and Fire Data
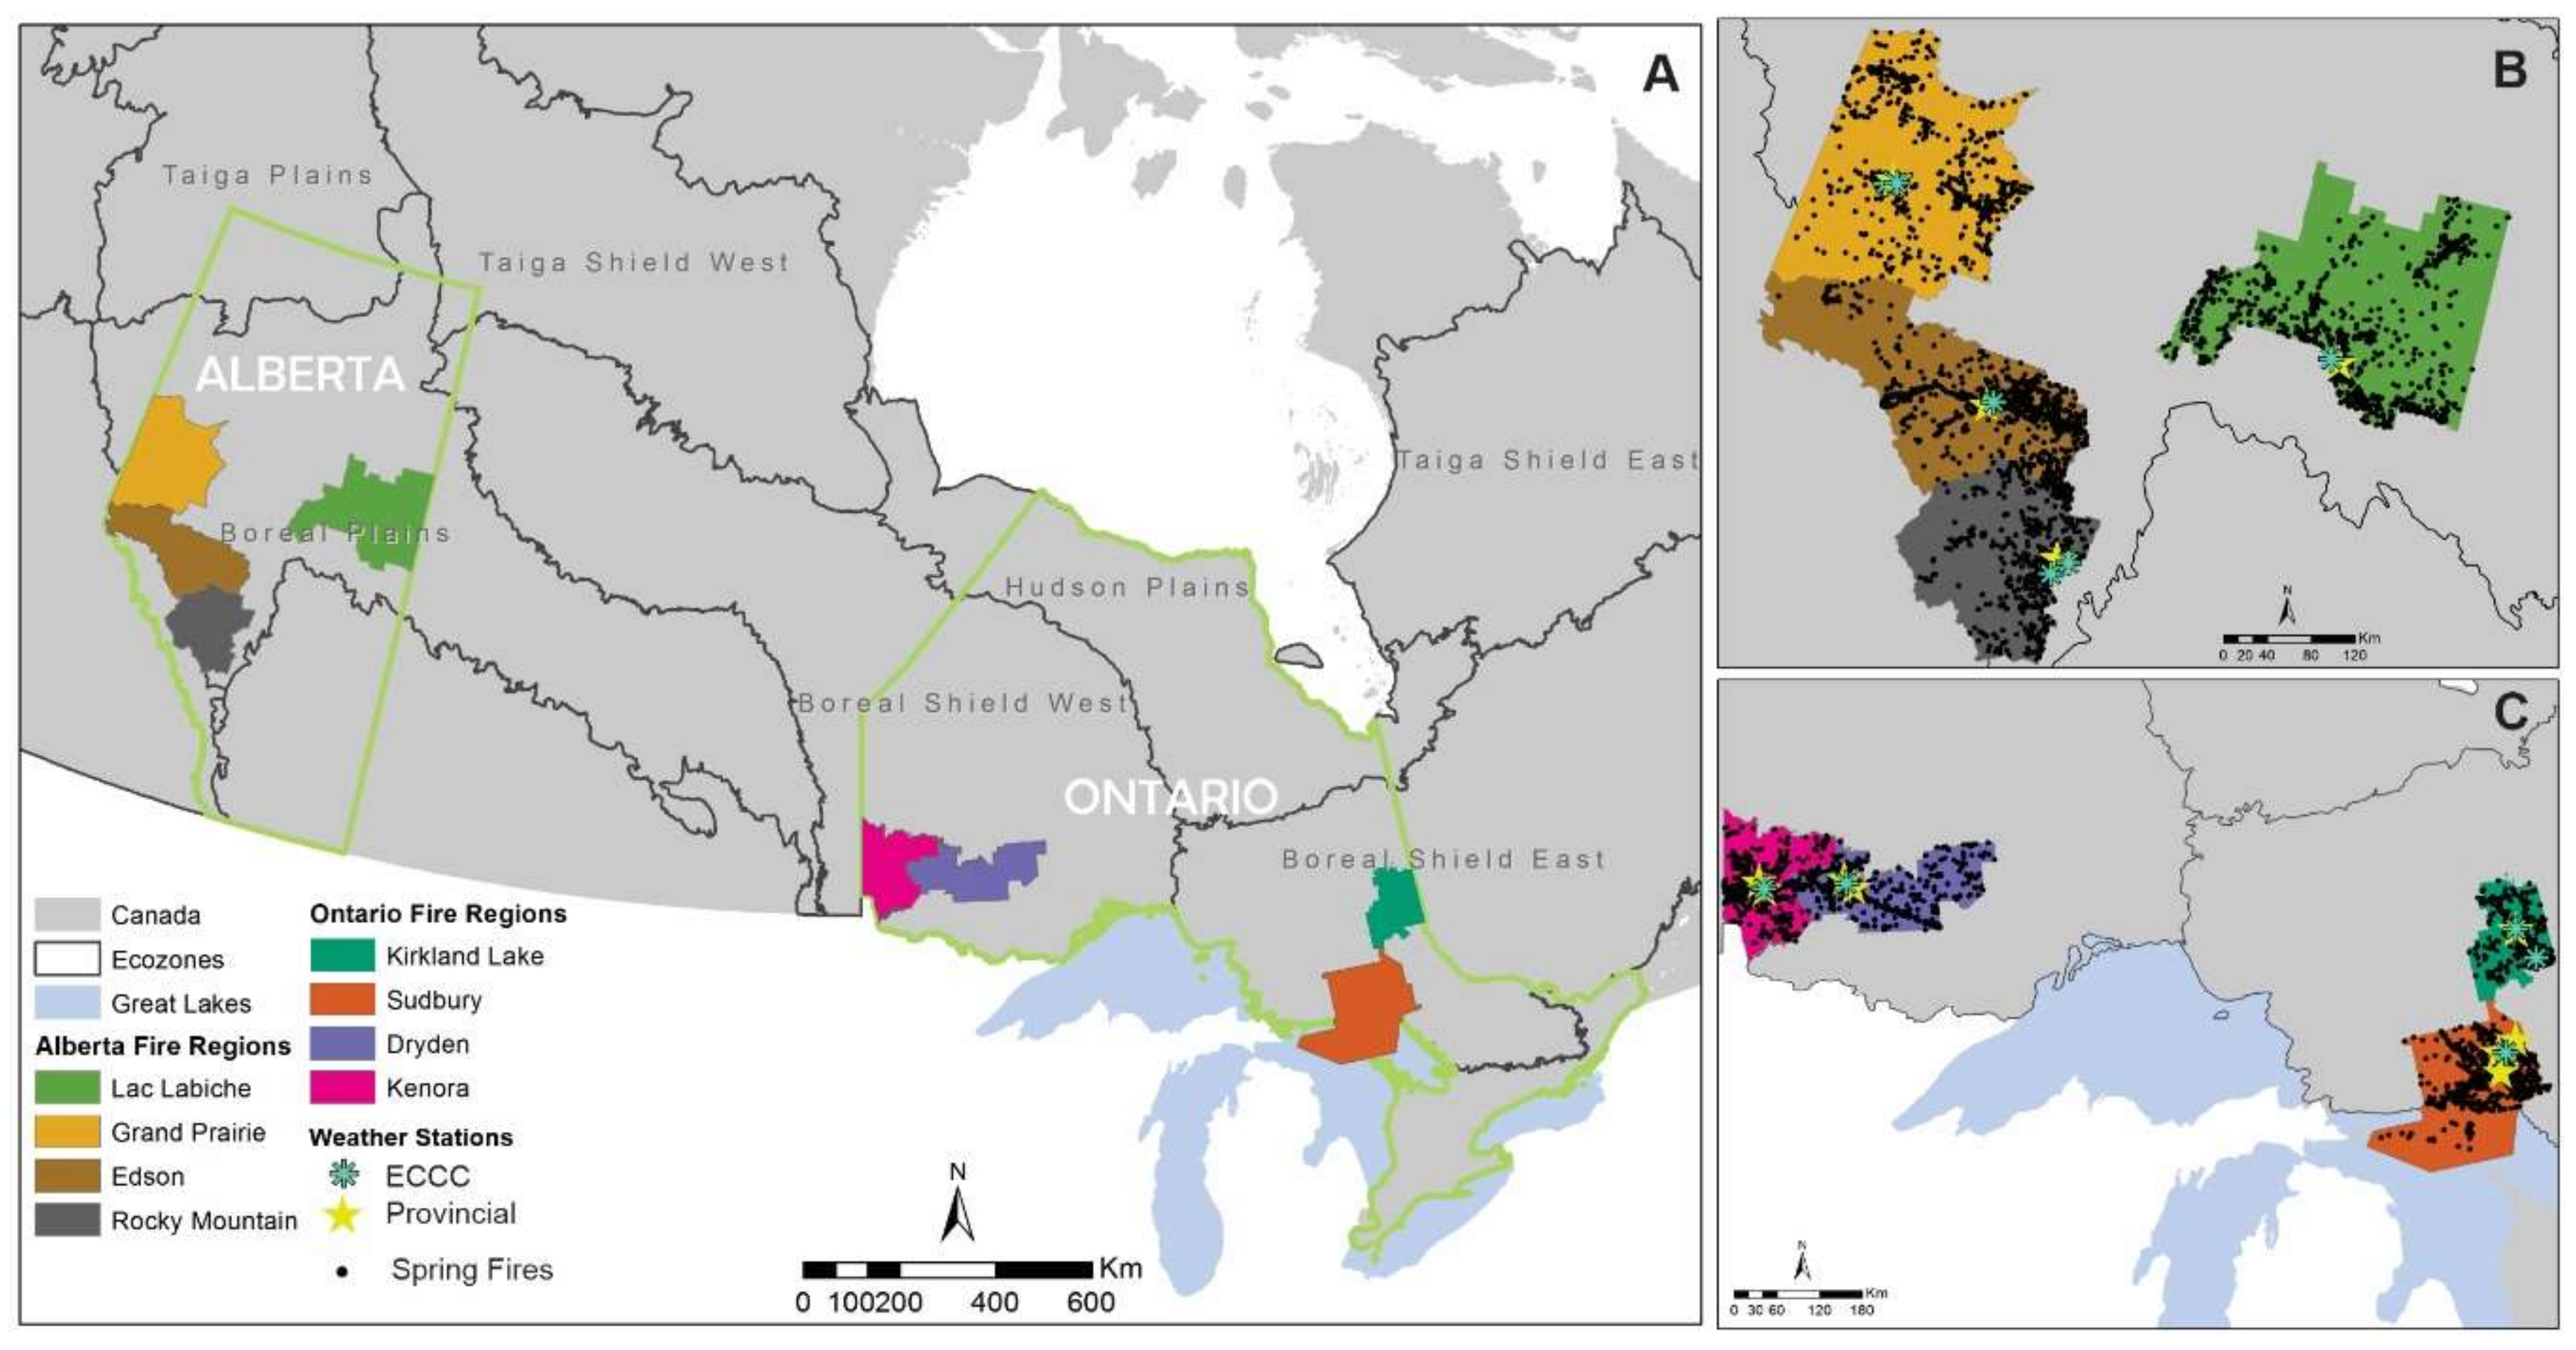
Eight fire management regions were selected for the analysis based on the availability of long-term consistent weather and human-caused fire datasets, four in the eastern province of Ontario and four in the western province of Alberta (Figure 1). The spatial distribution of these regions across the ecozones of Canada included four within the Boreal Plains, two in the Boreal Shield West, and two in the Boreal Shield East. The fire management regions ranged in size from 20,892 km2 (Rocky Mountain House) to 39,157 km2 (Lac La Biche) in Alberta and 13,879 km2 (Kirkland Lake) to 22,801 km2 (Sudbury) in Ontario.
Weather data from the fire management agencies in Ontario and Alberta were used to create a single continuous daily weather stream within each fire management region. These stations were used to calculate daily values for the FWI System codes and indices for each region. The FWI System indices are calculated from 12:00 local standard time observations of temperature, relative humidity, wind speed, and 24-hour accumulated precipitation [12].
The primary stations for each weather stream were selected based on multiple criteria: (1) Availability of long-term daily records (2) co-location with nearby Environment and Climate Change Canada (ECCC) weather stations for the same period of record, and (3) high incidence of human-caused spring fires in the surrounding area (Table S1 and Figure 1B,C). Weather stations for fire operations typically start in early May and end in late September, sometimes extending into October. Although fire weather stations are shorter in annual duration, compared to ECCC stations, they are specifically designed to collect all data required by the FWI System based on local noon observations. Since fire weather station data may not cover the full fire season, data from ECCC were needed to cover missing periods in both the spring and fall, as well as missing data throughout the fire season. Historic ECCC data were obtained online (http://climate.weather.gc.ca/historical_data/search_historic_data_e.html) using the weathercan [33] package in R [34]. Nearby fire weather stations were used to fill in any missing values (Table S1).
Historical wildland fire records were also obtained from both Alberta and Ontario’s provincial fire management agencies. These records included all human-caused spring fires 0.1 ha and greater, thus removing smaller fires that have been a known issue in Alberta [35]. Fires that occurred within the same fire management region as the primary weather station were selected (Figure 1B,C). A 40-year period was selected (1979–2018) for the analysis to reduce non-stationarity in the records due to population fluctuations and potential fuel type changes. Over 80% of all fires were within 100 km of the primary weather station for all but one study region, Lac La Biche, where this coverage did not occur until 150 km. Lac La Biche is the largest region included in the analysis and is also relatively flat compared to the other regions.
2.2. Fire Season Definition
The starting and ending dates of the fire season in each fire management region we studied are not stationary; they vary due to local weather conditions. The end of the fall fire season was defined as the third consecutive day of maximum temperature less than 5˚C [36]. We note that snow on the ground is also a signal of the end of the fall fire season [13]; however, consistent information about the presence/absence of snow was not available in the records. The DC for this day was calculated and used to represent the drought conditions at the end of the previous fall fire season (DCf). The beginning of the spring fire season in each region was defined as either the day of the first fire occurrence, the first day after three consecutive days of 12 °C maximum daily temperature [36], or local weather station start up by the fire management agency, whichever occurred first. Pow was calculated as the total precipitation from the day after the fall fire season ended to the day prior to the fire season starting the following spring. Since fire weather stations are not operated during the winter, these totals were collected from nearby ECCC stations. The end of the spring fire season was set as May 31st for all regions in a conservative effort to capture the spring season prior to green-up.
2.3. Number of Fires
As previously mentioned, the successful ignition of human-caused fires is controlled by the litter moisture, which can vary substantially from day-to-day depending on the weather. Changes in litter moisture are tracked by the FFMC across Canada [12]. Early research using a Poisson process established a relationship between the FFMC and the number of human-caused fires that have become the basis of fire occurrence prediction models [31]. The intent here was not to build a daily fire occurrence prediction model per se, but rather to investigate the impact of DCf and Pow after controlling for the day-to-day differences in litter moisture that drives human-caused fire occurrence. Therefore, the FFMC values capture the current spring moisture anomalies, while the DCf and Pow capture previous season drought.
For our analysis, daily sequences of FFMC values and daily counts of fire occurrences were calculated for each spring fire season within each region over the study period. Count data can often exhibit over-dispersion, which is commonly caused by an excess number of zeros [37]. Tests for over-dispersion were conducted using the AER package [38] in R [34]. Over-dispersion was observed in the fitted Poisson Generalized Linear Models (GLM) in all regions. Such over-dispersion could be attributed to both the non-linear form of the FFMC human-caused fire occurrence relationship and a zero-heaviness in the datasets.
In terms of non-linear relationships between counts of fires and FFMC, we note that a Poisson GLM takes the form of a log-linear model for counts, which corresponds to an exponential relationship between increasing fire occurrence and decreasing fuel moisture in fine fuels. However, previous research [39,40] has found that fire occurrence and FFMC can have a non-linear relationship with moisture content that is more complex than a simple log-linear form used by others [41]. To allow for a non-linear form, both quadratic and polynomial terms (for FFMC) were tested within all models.
In terms of zero-heaviness, we note that fires may not occur for more than one reason. First, wet fuels do not typically support the ignition of fires regardless of the number of potential ignition brands. Consequently, there may be no fires because litter moisture is above the threshold of ignition (as represented by a low FFMC). Secondly, even when fuel moisture is low and is conducive to ignition (as represented by a high FFMC), a fire ignition will not necessarily occur because ignitions also depend on human land-use patterns in a given area. To compensate for these two potential sources of zeros, a Zero-Inflated Poisson (ZIP) was employed to model the counts as opposed to using a strictly Poisson regression modelling framework. In a ZIP, the zero-inflated component of the model accounts for excess zeros and counts are assumed to follow a Poisson process.
An example of the ZIP model form with second order polynomial terms is:
where Y represents the number of fires on a given day in the spring; π represents the probability of a given observation being in the zero-heavy component, which is modelled using the following logistic regression framework
and µ represents the mean estimated from a log-linear Poisson regression model, which is modelled as
The regression coefficients in (4) and (5) are represented by and , respectively. Notice in (3), zeros can arise from the zero-heavy component as well as the Poisson component. Model estimation requires the use of a mixture model framework, maximizing a likelihood function and estimating all parameters jointly [42].
ZIP modelling was done using the pscl package [43] in R. Model selection was based on Akaike’s Information Criterion (AIC) and assessment of model fit graphically to ensure the known physical processes the model is meant to represent are being upheld (i.e., no fires expected at very low FFMC values). DCf and Pow, from the previous fall and winter, were added to the models along with FFMC to determine if there was evidence any impact of overwintering of drought conditions and/or winter precipitation on spring fire occurrences while accounting for the FFMC-driven spring fire relationship.
2.4. Suppression Effectiveness
Although the number of human-caused spring fires was the primary focus of the study, we wanted to also look at two other specific aspects of the fire regime of importance operationally, namely suppression effectiveness and total area burned. Fire managers have thought these to be associated to previous season drought conditions. However, they do not appear to have been clearly linked. The intent here again was not to build a complex model of area burned or suppression effectiveness as done by other researchers (e.g., [44,45]). Instead, our objective was to determine if there was quantitative evidence of DCf and Pow significantly impacting the potential for fires to escape initial attack and the total area burned in the spring.
We studied suppression effectiveness by modelling the probability of a fire escaping initial attack suppression efforts. Fires that escaped initial attack were defined as fires that exceeded 4 ha in final size. This cut off was used as a conservative effort to capture the provincial variability in suppression objectives between Ontario and Alberta [46]. A binary outcome to represent initial attack success was derived for each fire using these criteria. Logistic regression (see e.g., [47]) using this outcome as the response was used to determine the influence of the Initial Spread Index (ISI) along with DCf and Pow on the probability of escape. The ISI is an indication of potential rate of spread largely driven by wind that has been related to the potential for fires to escape [44] in addition to other complicating factors [45].
2.5. Area Burned
We use multiple linear regression modelling to explore the relationship between DCf and Pow and the logarithm of total spring area burned. This log transformation was required to normalize the raw annual aggregate spring area burned values.
3. Results
Overall, the management regions in Alberta are drier in the fall and winter with higher DCf values and less Pow annually compared to Ontario (Table 1). Alberta also experiences more human-caused spring fires, over a longer spring fire season, compared to the Ontario fire regions. Within Ontario there is a clear climatological difference between the east and west with Sudbury and Kirkland Lake (northeast) receiving more precipitation overwinter and lower DCf values compared to Dryden and Kenora (northwest) (Table 1). Although, these climatological differences did not result in similar distinctions in number of fires or area burned between northeastern and northwestern Ontario.
The fitted ZIP model results demonstrate that the DCf has an impact on the occurrence of human-caused spring fires in all regions: There is high agreement across the regionally estimated count model coefficients in terms of their estimated effects; and, the corresponding p-values suggest very high confidence in the results for Alberta (p-values < 0.01) and medium-to-high confidence in the results for Ontario (0.00 < p-values < 0.10) (Table 2). This relationship was positive for all but one region, indicating evidence that drier fall conditions are associated with more spring fires. There was one exception to this, Sudbury, which resulted in a negative relationship (Table 2 and Figure 2).
When predicted model counts were compared between low and high DCf values, the overall percent change in human-caused spring fires resulted in increases between 20% and 259% for Lac La Biche and Rocky Mountain House in Alberta, and 27% to 65% for Kenora and Kirkland Lake in Ontario (Figure 2A) on average over the spring season. The range of DCf used for Alberta was 100 to 500 and Ontario 25 to 350. Differences in the predicted model outputs, between low and high DCf ranges on a daily basis, are shown for Grande Prairie and Kirkland Lake (Figure 3). These clearly show an increase in the expected number of spring fires on a given day, especially at higher FFMC values when the DCf is high.
The results for Pow are not as consistent. Pow showed high confidence in most regions of Alberta, except Grand Prairie, and only in Kirkland Lake for Ontario (Table 2), but low agreement between all regions. Strong evidence (p-values < 0.05) of a positive relationship between Pow and number of spring human-caused fires was found for Kirkland Lake, Edson, and Rocky Mountain House, which is opposite to expected. The expected relationship, less Pow resulting in more spring fires, was only observed for Lac La Biche (Table 2). When comparing the difference between predicted number of spring fires between a low and high Pow the model predicted 19% fewer human-caused spring fires with lower Pow in Lac La Biche (Figure 2B). Similar comparisons for Kirkland Lake, Edson, and Rocky Mountain house resulted in increases of 146%, 41%, and 44% respectively, based on the range of high to low Pow observed in those regions (Figure 2B).
The DCf had a strong positive impact on the probability of a spring fire escaping initial attack for Rocky Mountain House only (Table 3). Strong evidence (p-value < 0.05) of a positive relationship between Pow and the probability of a spring fire escaping was shown for Edson. Very little confidence was found in the remaining relationships for either variable. Strong evidence that ISI was found in most regions where a consistent positive relationship with the probability of escape was observed (Table 3).
Area burned in the spring was moderately influenced by the DCf in three regions; Rocky Mountain House, Kenora, and Dryden (Table 4). Although the resulting models did not have much explanatory power, with R2 values of less than 30 percent and displayed only moderate evidence (p-values < 0.1), it is important to note that the intent was not to create the best model of area burned in the spring. The intent was to determine if previous fall drought conditions affected area burned in the spring. Pow did have a moderate effect on area burned in Sudbury but the overall model had no confidence (Table 4). No other regions displayed evidence in a relationship to Pow.
4. Discussion
The current operational practice of using an overwinter adjustment of the DC is based on an assumption that if drought conditions existed during the previous fall they should be carried over to the following spring leading to drier deeper organic layers that translate to some enhanced level of wildfire activity. For springtime fire occurrence, this assumption is supported by our results in all but one region, Sudbury. Elevated DCf values resulted in significant increases in the number of spring human-caused fires. This result seemed particularly strong in Alberta, although it is important to note that the higher confidence in this province may be an artifact of the data; the Alberta regions have a greater number of spring fires so a larger number of counts within the 40 year study period, which may have led to the lower p values. No studies of fire occurrence have accounted for the primary relationship to litter moisture (i.e., FFMC) that is of importance to explaining day-to-day variability within the spring season, while also exploring the impact of the previous season’s potential drivers on top (DCf and Pow). This unique method of compensating for these day-to-day variations has shown us that previous season drought conditions do impact the number of human-caused spring fires.
The negative relationship between DCf and number of spring fires found in Sudbury were further investigated and determined not to be an anomaly, based on replication of this result in an adjacent region, North Bay. Although initially it seems counterintuitive this result is supported by other studies that have shown variability in the relationship between drought and fire activity, where in some forest types increased moisture in the fall can lead to increased accumulation of fuels, resulting in more fuel available to burn the following spring [48]. Antecedent wet conditions have also been shown to regulate fuel amounts and structure in Mediterranean Europe [49]. Therefore, differences in fuel may be the reason for the positive relationship between DCf and number of spring fires in the Sudbury region. These regions are dominated by different forest types, which could influence fuel–moisture relationships. All regions in this study are within Boreal ecozones [50], but Sudbury and North Bay are dominated by the more temperate Great Lakes St. Lawrence forest types [51] compared to the others being predominately Boreal forest types. Differences in climatology have also been shown to cause variability in drought–fire relationships across large spatial areas [24]. Sudbury is the wettest of all regions and the distribution of precipitation throughout the year is also different. Peak precipitation occurs later in the year, in late summer/fall, compared to the other regions where the wet period is late spring(June)/summer (based on ECCC climate normal 1981–2010 (https://climate.weather.gc.ca/climate_normals/). Further investigation is required to determine which of these potential drivers plays a bigger role as well as how widespread this result may exist across the Canadian landscape. For the other seven out of eight regions, and potentially most of the boreal regions in Canada, drought carry-over has a positive relationship to the number of human-caused spring fires.
The results for suppression effectiveness and area burned were not as definitive as the fire occurrence analysis. Increased fall drought resulted in a greater probability of fires escaping initial attack the following spring in only one region in Alberta. Suppression effectiveness, as we have characterized by escaped fire probability, is driven by a complex variety of factors that vary regionally that include but are not limited to forest characteristics, operational suppression resource demands and current season weather conditions [44,45,52]. Therefore, it is not surprising, based on our fairly simple weather-based analysis, that only one significant relationship was found. In particular, in Ontario, the number of spring human-caused fires occurring are typically low, therefore the already small spring dataset is limited to even fewer fires that grow to >4 ha.
Increased area burned in the spring associated with drier previous fall conditions was observed in just one region in Alberta, and both regions in western Ontario. Regression models explained 15% to 26% of the variability in the log of area burned indicating DCf was not a primary driver, although was not expected to be. Most studies of drought–fire relationships that have focused on area burned found widespread variability between regions [17,19,26]. Area burned is primarily driven by current season weather conditions [53], especially those following ignition [27], but has been shown in some regions to be influenced by previous season drought [25] or decreased overwinter precipitation [26].
The positive correlations found here between Pow and spring fires are counterintuitive to the underlying concepts around the overwintering adjustment [13]. In the DC overwinter adjustment procedure, reduced Pow was hypothesized to reduce moisture recharge and therefore, quite logically, lead to drier spring conditions and greater fire activity. Based on all of our study regions being located at relatively high latitudes it is assumed the majority of precipitation falling during this ‘overwinter’ period (~November to March) is in the form of snow and results in a persistent snowpack. Although the Pow does not represent the total moisture that infiltrates the organic layer in the spring, it should be representative of potential moisture available. The assumption that reduced precipitation during the winter months enhanced the potential for spring fire occurrence was only supported in one region in Alberta, Lac La Biche; however, there was high agreement for the opposite effect in three regions across Alberta and Ontario. Thus, there seems to be no consistent evidence for the impact of overwinter precipitation, at least in terms of its impact on spring fire occurrence. Lower Pow also did not result in decreased suppression effectiveness, measured by increased probability of a fire escaping initial attack, or increased spring area burned. Studies in the US Pacific Northwest have found a relationship between earlier spring melt and fire activity that have been associated with warmer spring and winter temperatures [15,19]. Analyses that included Canada showed that decreased winter precipitation correlated with increased area burned in some regions of the boreal, but increased winter temperatures causing decreased snow duration had a more moderate and widespread decreasing influence on annual area burned [26]. Although it is important to point out that these studies were focused primarily on area burned and were not specific to spring human-caused fires only. Only weak negative correlations were found to area burned here. A hydrologic study of the Horse River Fire, just North of Lac La Biche, revealed that years of low snow pack did not necessarily mean greater area burned in the spring, but years of high snow matched years of low area burned [54]. We did find a moderately strong negative relationship between Pow and number of spring human-caused fires in the Lac La Biche region.
These results in relation to other findings point to the fact that Pow alone may not be the best indicator of the influence of snow contribution to organic layer recharge potentially affecting spring fire activity. Clearly, the transfer of moisture from snow melt to deep organic layers would be influenced by elements like timing of melt, potential run-off over frozen soil, and/or day-to-day sublimation. Therefore, it is logical that Pow itself might not exhibit a strong influence on springtime fire activity. The overwinter adjustment is not solely based on Pow, it does include an adjustable constant (Equation (1)) meant to account for these mechanisms affecting winter and spring melt and moisture transfer. Although those are not tested explicitly here, the additive model form used in the models is the same as Equation (1), without the constants. As indicated above, changes in overwinter temperatures have been shown to have an effect on fire activity [19,26] and are not included in the current overwinter adjustment. Future work, requiring additional data, should examine the key variables that influence moisture transfer from snow into deep organic layers, not just potential moisture availability. These should include variables that are easily measured by fire managers reducing the need to estimate constants based on one of three potential scenarios.
The findings herein have other important implications to fire managers. If DCf is high, managers could anticipate a more active than normal fire season the following spring, in most regions. Also, the overwinter precipitation threshold (200 mm) may not be the appropriate flag to indicate the need for the overwintering adjustment to be calculated. DCf may be more useful. A shortcoming of current operational policies that may impede more accurate estimation of DCf is that, for most years, weather stations are turned off too early in the fall. Although this was not explored explicitly, it was observed during data processing through the need to consistently include ECCC station data to supplement daily fire weather station records. The current overwintering methods allow for the estimation of a constant ɑ (Equation (1)) to calculate DCf [13], but actual observations running to ground freeze or lasting snow cover may lead to more accurate estimates of this value and are possible with automated weather stations. In addition, fire weather stations often start recording after fires are observed in the spring. These discrepancies in station start and end dates also affect the Pow calculation. Fire weather stations should run for the entire time that organic fuels are actively exchanging moisture with their environment, not just when fires are occurring in order to capture these processes. This influence of previous fall’s drought combined with studies showing the fire season length to be changing [2,3,10] and anticipated to change further [55] should be sufficient to convince agencies to consider new policies around when to start and stop weather stations. Year-round stations, or incorporation of satellite observations, may be alternatives to current practices to better determine overwinter conditions.
Limitations of this analysis include the use of a single weather station to represent fire weather across a larger region. Previous studies have shown this approach can be used to generally capture the variability in day-to-day human-caused fire occurrence in a designated area (e.g., fire district) [41,56,57,58]. Since the goal of this study was not to develop spatially explicit, fine-scale models, for daily fire occurrence, but rather to investigate whether or not previous season’s drought conditions and/or overwinter precipitation may impact the number of fires experienced at a given region, we chose to use a single continuous daily weather stream within each fire management region. Others have interpolated to the center of the region [59] or used gridded data [18,60] as an alternative. These options were considered but the decision was made that the effective averaging of values used by the interpolation and gridded methods may outweigh the benefit. To ensure our choice of representative weather station in this method did not influence the results, tests were run for regions with the greatest topographic variability (Edson and Rocky Mountain House) using a different weather station to generate the primary weather stream. The results were consistent regardless of station choice, thus supporting our choice of methodology and validating our findings.
Lastly, we acknowledge that duff layer moisture and fine fuel moisture are not independent of each other. For example, fine fuel moisture has been shown to be impacted by the moisture content in the upper layer of duff fuels [61]. We did not investigate the impact of daily DC in our analyses, since our focus was to determine whether or not there was an overwintering effect and explore its impact on key characteristics of wildland fire regimes and fire management. Future work could involve investigating the impact of DC on fire occurrence, including exploring how DCf may impact the adjustments of daily FFMC values according to forest type, stand density, seasonality, and duff moisture content as proposed in Wotton and Beverly [61].
5. Conclusions
Although an overwintering procedure has existed alongside the FWI System for decades [13] there has been little research to confirm when it is necessary and under what conditions it should be applied. When the CFFDRS was developed the guiding principles included easy to measure variables combined with an understanding that fire managers had a strong knowledge of their region and the influence of weather conditions in that environment. Although these principles still hold true, the responsibility of fire managers is continuously growing and our ability to assess and measure weather related variables is continuously increasing, allowing for a more rigorous methodology to be developed and applied operationally. Fire management agencies want indicators prior to the fire season commencing to help them determine in advance what may occur that spring [62]. Our results indicate that drought carry-over does occur and primarily impacts the number of spring human-caused fires. Therefore, the overwinter adjustment has merit, but the total overwinter precipitation may not be the key variable to flag drought conditions in the spring. Results are not as definitive for our simplistic analysis of escape probability and area burned, but as a whole this research is sufficient to warrant greater investigation into the overwintering methods used in the FWI System. These findings in addition to results from other studies [54,63] point to the need to re-evaluate the overwintering procedures to ensure they are representative of drought conditions across Canada.
Supplementary Materials
The following are available online at https://www.mdpi.com/2571-6255/3/2/24/s1, Table S1: Fire weather and Environment and Climate Change Canada (ECCC) stations used to create the weather streams for each fire management region.
Author Contributions
Conceptualization: C.H., M.W., M.F. and D.L.M.; methodology: C.H., M.W. and D.G.W.; software: C.H. and D.G.W.; validation: C.H., M.W., D.G.W., D.L.M. and M.F.; formal analysis: C.H. and D.G.W.; investigation: C.H.; resources: M.W., D.L.M., D.G.W. and M.F.; data curation: C.H.; writing—original draft preparation: C.H.; writing—review and editing: M.W., D.G.W., M.F. and D.L.M.; visualization: C.H., D.G.W. and M.W.; supervision: M.W. and M.F.; project administration: C.H.; funding acquisition: C.H., M.W. and M.F. All authors have read and agreed to the published version of the manuscript.
Funding
This research received funding from the Canadian Space Agency, Climate Change Impacts and Ecosystem Resilience program and the Ontario Ministry of Natural Resources and Forests, Aviation Forest Fire and Emergency Services. We acknowledge the support of the Natural Sciences and Engineering Research Council of Canada (NSERC), [RGPIN-2015-04221].
Acknowledgments
The authors would like to thank Brian Stocks for early input into this project, Brett Moore for helping obtain fire and weather data from the Province of Alberta, and Colin McFayden for the same from the Province of Ontario.
Conflicts of Interest
The authors declare no conflict of interest.
References
- Gillett, N.P.; Weaver, A.J.; Zwiers, F.W.; Flannigan, M.D. Detecting the effect of climate change on Canadian forest fires. Geophys. Res. Lett. 2004, 31, L18211.18211–L18211.18214. [Google Scholar] [CrossRef]
- Jain, P.; Wang, X.; Flannigan, M.D. Trend analysis of fire season length and extreme fire weather in North America between 1979 and 2015. Int. J. Wildland Fire 2018, 26. [Google Scholar] [CrossRef]
- Hanes, C.C.; Wang, X.; Jain, P.; Parisien, M.-A.; Little, J.M.; Flannigan, M.D. Fire regime changes in Canada over the last half century. Can. J. For. Res. 2019, 49, 256–269. [Google Scholar] [CrossRef]
- Boulanger, Y.; Gauthier, S.; Burton, P.J. A refinement of models projecting future Canadian fire regimes using homogeneous fire regime zones. Can. J. For. Res. 2014, 44, 365–376. [Google Scholar] [CrossRef]
- Wotton, B.M.; Flannigan, M.D.; Marshall, G.A. Potential climate change impacts on fire intensity and wildfire suppression thresholds in Canada. Environ. Res. Lett. 2017, 12, 095003. [Google Scholar] [CrossRef]
- Tymstra, C.; Woolford, D.G.; Flannigan, M.D. Statistical Surveillance Thresholds for Enhanced Situational Awareness of Spring Wildfire Activity in Alberta, Canada. J. Environ. Stat. 2019, 9, 1–26. [Google Scholar]
- MNP. A Review of the 2016 Horse River Wildfire; Forestry Division, Alberta Agriculture and Forestry: Edmonton, AB, Canada, 2017; p. 88.
- Statistics Canada. Infographic: Fort McMurray 2016 Wildfire—Economic Impact. 2017. Available online: https://www150.statcan.gc.ca/n1/pub/11-627-m/11-627-m2017007-eng.pdf (accessed on 22 June 2020).
- Flat Top Complex Wildfire Review Committee. Flat Top Complex; Environment and Sustainable Resource Development: Slave Lake, AB, Canada, May 2012; p. 95. [Google Scholar]
- Albert-Green, A.; Dean, C.B.; Martell, D.L.; Woolford, D.G. A methodology for investigating trends in changes in the timing of the fire season with applications to lightning-caused forest fires in Alberta and Ontario, Canada. Can. J. For. Res. 2013, 43, 39–45. [Google Scholar] [CrossRef]
- Stocks, B.J.; Lawson, B.D.; Alexander, M.E.; Van Wagner, C.E.; McAlpine, R.S.; Lynham, T.J.; Dubé, D.E. Canadian Forest Fire Danger Rating System: An Overview. For. Chron. 1989, 65, 458–465. [Google Scholar]
- Van Wagner, C.E. Development and Structure of the Canadian Forest Fire Weather Index System; Forestry Technical Report 35; Petawawa National Forestry Institute: Ottawa, ON, Canada, 1987; p. 48.
- Turner, J.; Lawson, B.D. Weather in the Canadian Forest Fire Danger Rating System—A User Guide to National Standards and Practices; BC-X-177; Pacific Forest Research Centre: Victoria, BC, Canada, 1978; p. 40. [Google Scholar]
- Meyn, A.; Taylor, S.W.; Flannigan, M.D.; Thonicke, K.; Cramer, W. Relationship between fire, climate oscillations, and drought in British Columiba, Canada, 1920–2000. Glob. Chang. Biol. 2010, 16. [Google Scholar] [CrossRef]
- Westerling, A.L.; Hidalgo, H.G.; Cayan, D.R.; Swetnam, T.W. Warming and Earlier Spring Increase Western U.S. Forest Wildfire Activity. Sciencexpress 2006, 313. [Google Scholar] [CrossRef] [PubMed]
- Littell, J.S.; McKenzie, D.; Peterson, D.L.; Westerling, A.L. Climate and wildfire area burned in western U.S. ecoprovinces, 1916–2003. Ecol. Appl. 2009, 19, 1003–1021. [Google Scholar] [CrossRef]
- Abatzoglou, J.T.; Kolden, C.A. Relationships between climate and macroscale area burned in the western United States. Int. J. Wildland Fire 2013, 22, 1003–1020. [Google Scholar] [CrossRef]
- Riley, K.L.; Abatzoglou, J.T.; Grenfell, I.C.; Klene, A.E.; Heinsch, F.A. The relationship of large fire occurrence with drought and fire danger indices in the western USA, 1984–2008: The role of temporal scale. Int. J. Wildland Fire 2013, 22, 894–909. [Google Scholar] [CrossRef]
- Westerling, A.L. Increasing western US forest wildfire activity: Sensitivity to changes in the timing of spring. Philos. Trans. R. Soc. B 2016, 371, 1–10, (+12 corrections). [Google Scholar] [CrossRef] [PubMed]
- Palmer, W.C. Meteorological Drought; Weather Bureau: Washington, DC, USA, 1965; p. 58. [Google Scholar]
- Keetch, J.J.; Byram, G.M. A Drought Index for Forest Fire Control; Southeastern Forest Experiment Station: Asheville, NC, USA, 1968; p. 35.
- McKee, T.B.; Doeken, N.J.; Kleist, J. The relationship of drought frequency and duration to time scales. In Proceedings of the American Meteorological Society, Anaheim, CA, USA, 17–22 January 1993; pp. 179–184. [Google Scholar]
- Deeming, J.E.; Burgan, R.E.; Cohen, J.D. The National Fire-Danger Rating System-1978; Gen. Tech. Rep. INT-39; USDA Forest Service, Intermountain Forest range Experiment Station: Ogden, UT, USA, 1977.
- Littell, J.S.; Peterson, D.L.; Riley, K.L.; Liu, Y.; Luce, C.H. A review of the relationships between drought and forest fire in the United States. Glob. Chang. Biol. 2016, 22, 1–17. [Google Scholar] [CrossRef] [PubMed]
- Urbieta, I.R.; Zavala, G.; Bedia, J.; Gutierrez, J.M.; San Miguel-Ayanz, J.; Camia, A.; Keeley, J.E.; Moreno, J.M. Fire activity as a function of fire–weather seasonal severity and antecedent climate across spatial scales in southern Europe and Pacific western USA. Environ. Res. Lett. 2015, 10, 114013. [Google Scholar] [CrossRef]
- Kitzberger, T.; Falk, D.A.; Westerling, A.L.; Swetnam, T.W. Direct and indirect climate controls predict heterogeneous early-mid 21st century wildfire burned area across western and boreal North America. PLoS ONE 2017, 12. [Google Scholar] [CrossRef]
- Abatzoglou, J.T.; Kolden, C.A. Relative importance of weather and climate on wildfire growth in interior Alaska. Int. J. Wildland Fire 2011, 20, 479–486. [Google Scholar] [CrossRef]
- Stocks, B.J. The 1976–1977 drought situation in Ontario. For. Chron. 1979, 55, 91–94. [Google Scholar] [CrossRef]
- Stocks, B.J.; Mason, J.A.; Todd, J.B.; Bosch, E.M.; Wotton, B.M.; Amiro, B.D.; Flannigan, M.D.; Hirsch, K.G.; Logan, K.A.; Martell, D.L.; et al. Large forest fires in Canada, 1959–1997. J. Geophys. Res. 2002, 107, 5-1–5-12. [Google Scholar] [CrossRef]
- Johnson, E.A.; Keith, D.M.; Martin, Y.E. Comparing measured duff moisture with a water budget model and the duff and drought codes of the Canadian Fire Weather Index. For. Sci. 2013, 59, 78–92. [Google Scholar] [CrossRef]
- Cunningham, A.A.; Martell, D.L. A stochastic model for the occurrence of man-caused forest fires. Can. J. For. Res. 1973, 3, 282–287. [Google Scholar] [CrossRef]
- Alexander, M.E. Calculating Spring Drought Code Starting Values in the Prairie Provinces and Northwest Territories; Northern Forestry Centre, Canadian Forestry Service: Edmonton, AB, Canada, 1982; p. 4.
- LaZerte, S.E.; Albers, S. Weathercan: Download and format weather data from Environment and Climate Change Canada. J. Open Source Softw. 2018, 3, 571. [Google Scholar] [CrossRef]
- R Core Team. R: A Language and Environment for Statistical Computing; R Foundation for Statistical Computing: Vienna, Austria, 2020. [Google Scholar]
- Fletcher Quince, A. Performance measures for forest fire management organizations: Evaluating and enhancing initial attack operations in the province of Alberta’s Boreal Natural Region. Compos. Sci. Technol. 2009, 65, 735–740. [Google Scholar]
- Wotton, B.M.; Flannigan, M.D. Length of the fire season in a changing climate. For. Chron. 1993, 69, 187–192. [Google Scholar] [CrossRef]
- Zeileis, A.; Kleiber, C.; Jackman, S. Regression models for count data in R. J. Stat. Softw. 2008, 27, 1–25. [Google Scholar] [CrossRef]
- Kleiber, C.; Zeileis, A. AER: Applied Econometrics with Rpackage Version 1.2-7. 2019. Available online: https://CRAN.R-project.org/package=AER (accessed on 22 June 2020).
- Woolford, D.G.; Bellhouse, D.R.; Braun, W.J.; Dean, C.B.; Martell, D.L.; Sun, J. A spatiotemporal model for people-caused forest fire occurrence in the Romeo Malette Forest. J. Environ. Stat. 2011, 2, 2–16. [Google Scholar]
- Taylor, S.W.; Woolford, D.G.; Dean, C.B.; Martell, D.L. Wildfire prediction to inform management: Statistical science challenges. Stat. Sci. 2013, 28, 586–615. [Google Scholar] [CrossRef]
- Martell, D.L.; Otukol, S.; Stocks, B.J. A logistic model for predicting daily people-caused forest fire occurrence in Ontario. Can. J. For. Res. 1987, 17, 394–401. [Google Scholar] [CrossRef]
- McLachlan, G.J.; Peel, D. Finite Mixture Models; John Wiley & Sons: New York, NY, USA, 2000; p. 426. [Google Scholar]
- Jackman, S. Pscl: Classes and Methods for R Developed in the Political Science Computational Laboratory, Stanford University, R package version 0.95; Department of Political Science, Stanford University: Stanford, CA, USA, 2008. [Google Scholar]
- Beverly, J.L. Time since prior wildfire affects subsequent fire containment in black spruce. Int. J. Wildland Fire 2017, 26, 919–929. [Google Scholar] [CrossRef]
- Cardil, A.; Laurente, M.; Boucher, D.; Boucher, J.; Gauthier, S. Factors influencing fire suppression success in the province of Quebec (Canada). Can. J. For. Res. 2018, 49. [Google Scholar] [CrossRef]
- Arienti, M.S.; Cumming, S.G.; Boutin, S. Empirical models of forest fire initial attack success probabilities: The effects of fuels, anthropogenic linear features, fire weather and management. Can. J. For. Res. 2006, 36, 33155–33166. [Google Scholar] [CrossRef]
- Hosmer, D.W., Jr.; Lemeshow, S.; Sturdivant, R.X. Applied Logistic Regression, 3rd ed.; John Wiley & Sons: Hoboken, NJ, USA, 2013. [Google Scholar]
- Krueger, E.S.; Ochsner, T.E.; Carlson, J.D.; Engle, D.M.; Twidwell, D.; Fuhlendorf, S.D. Concurrent and antecedent soil moisture relate positively or negatively to probability of large wildfires depending on season. Int. J. Wildland Fire 2016, 25, 657–668. [Google Scholar] [CrossRef]
- Turco, M.; von Hardenberg, J.; AghaKouchak, A.; Llasat, M.C.; Provenzale, A.; Trigo, R.M. On the key role of droughts in the dynamics of summer fires in Mediterranean Europe. Sci. Rep. 2017, 7, 81. [Google Scholar] [CrossRef]
- Ecological Stratification Working Group. A National Ecological Framework for Canada; Agriculture and Agri-Food Canada, Research Branch, Centre for Land and Biological Resources: Ottawa, ON, Canada, 1995. [Google Scholar]
- Rowe, J.S. Forest Regions of Canada; Information Canada: Ottawa, ON, Canada, 1972; p. 172. [Google Scholar]
- Podur, J.J.; Martell, D.L. The influence of weather and fuel type on the fuel composition of the area burned by forest fires in Ontario, 1996–2006. Ecol. Appl. 2009, 19, 1246–1252. [Google Scholar] [CrossRef]
- Flannigan, M.D.; Harrington, J.B. A Study of the Relation of Meteorological Variables to Monthly Provincial Area Burned by Wildfire in Canada 1953–1980. J. Appl. Meteorol. 1988, 27, 441–452. [Google Scholar] [CrossRef]
- Elmes, M.C.; Thompson, D.K.; Sherwood, J.H.; Price, J.S. Hydrometeorological conditions preceding wildfire, and the subsequent burning of a fen watershed in Fort McMurray, Alberta, Canada. Nat. Hazards Earth Syst. Sci. 2018, 18, 157–170. [Google Scholar] [CrossRef]
- Wotton, B.M.; Nock, C.A.; Flannigan, M.D. Forest fire occurrence and climate change in Canada. Int. J. Wildland Fire 2010, 19, 253–271. [Google Scholar] [CrossRef]
- Martell, D.L.; Bevilacqua, E.; Stocks, B.J. Modelling seasonal variation in daily people-caused forest fire occurrence. Can. J. For. Res. 1989, 19, 1555–1563. [Google Scholar] [CrossRef]
- Vega-Garcia, C.; Woodard, P.M.; Titus, S.J.; Adamowicz, W.L.; Lee, B.S. A Logit Model for Predicting the Daily Occurrence of Human Caused Forest Fires. Int. J. Wildland Fire 1995, 5, 101–111. [Google Scholar] [CrossRef]
- Wotton, B.M.; Martell, D.L.; Logan, K.A. Climate Change and People-Caused Forest Fire Occurrence in Ontario. Clim. Chang. 2003, 60, 275–295. [Google Scholar] [CrossRef]
- Wotton, B.M.; Martell, D.L. A lightning fire occurrence model for Ontario. Can. J. For. Res. 2005, 35, 1389–1401. [Google Scholar] [CrossRef]
- Woolford, D.G.; Dean, C.B.; Martell, D.L.; Cao, J.; Wotton, B.M. Lightning-caused forest fire risk in Northwestern Ontario, Canada, is increasing and associated with anomalies in fire weather. Environmetrics 2014, 25, 406–416. [Google Scholar] [CrossRef]
- Wotton, B.M.; Beverly, J.L. Stand-specific litter moisture content calibrations for the Canadian Fine Fuel Moisture Code. Int. J. Wildland Fire 2007, 16, 463–472. [Google Scholar] [CrossRef]
- McEvoy, D.J.; Hobbins, M.; Brown, T.J.; VanderMolen, K.; Wall, T.; Huntington, J.L.; Svoboda, M. Establishing relationships between drought indices and wildfire danger outputs: A test case for the California-Nevad drought early warning system. Climate 2019, 7, 52. [Google Scholar] [CrossRef]
- Chavardes, R.D.; Daniels, L.D.; Eskelson, B.N.I.; Pickell, P.D. Monthly adaptations of the Drought Code reveal nuanced fire-drought associations in montane forests with a mixed-severity fire regime. Int. J. Wildland Fire 2019, 28, 445–455. [Google Scholar] [CrossRef]
Figure 1.
(A) Forest ecozone map for Canada showing the eight operational fire regions selected for the study. Four are located in the province of Alberta and four in Ontario. Close up of Alberta (B) and Ontario (C) regions showing all spring fires and location of weather stations used in the analysis.

Figure 2.
Percent change in total number of spring human-caused Number of Fires (NOF) based on model predicted changes from a low to high DCf (A) and Pow (B). The range of DCf used for Alberta was 100 to 500 and Ontario 25 to 350. For Pow the range for Alberta was 25 mm to 200 mm and Ontario 150 mm to 450 mm.

Figure 3.
Examples of the resultant zero-inflated Poisson models for daily number of human-caused spring fires and FFMC (Fine Fuel Moisture Content) under low and high DCf values for (A) Grande Prairie and (B) Kirkland Lake. Values for low and high DCf are the same as those shown in Figure 2.
Figure 3.
Examples of the resultant zero-inflated Poisson models for daily number of human-caused spring fires and FFMC (Fine Fuel Moisture Content) under low and high DCf values for (A) Grande Prairie and (B) Kirkland Lake. Values for low and high DCf are the same as those shown in Figure 2.


Table 1.
Comparison of the fire management regions used in the analysis, including area of each region, average annual previous fall DC (DCf), overwinter precipitation (Pow), number of spring human-caused fires (NOF), annual proportion of spring fires escaping initial attack (Escape), annual spring area burned (SAB), and spring fire season length (Length). Standard deviations are indicated in brackets. Regions shaded in grey are within the province of Alberta; the remainder are in Ontario.
| Average | |||||||
|---|---|---|---|---|---|---|---|
| Region | Area (km2) | DCf | Pow (mm) | NOF | Escape (%) | Area (ha) | Length (days) |
| Grande Prairie (GP) | 35,860 | 355.5 (115.8) | 125.6 (49.0) | 38 (27) | 13 (11) | 808 (2621) | 59 (18) |
| Lac La Biche (LLB) | 39,157 | 386.2 (127.7) | 96.2 (30.2) | 120 (73) | 25 (14) | 47,269 (13,845) | 64 (14) |
| Edson (EDS) | 28,609 | 282.0 (93.8) | 108.8 (47.2) | 63 (38) | 44 (39) | 1975 (8919) | 69 (19) |
| Rocky Mountain House (RMH) | 20,892 | 197.2 83.3) | 94.8 (36.8) | 42 (31) | 13 (11) | 706 (2067) | 63 (17) |
| Kenora (KEN) | 19,725 | 155.0 (113.9) | 172.3 (58.8) | 24 (10) | 9 (7) | 792 (3634) | 49 (15) |
| Dryden (DRY) | 22,696 | 172.8 (98.7) | 159.8 (59.6) | 11 (6) | 8 (11) | 33 (78) | 50 (14) |
| Kirkland Lake (KLK) | 13,879 | 92.5 (64.2) | 314.0 (86.4) | 10 (8) | 1 (6) | 184 (586) | 39 (12) |
| Sudbury (SUD) | 22,801 | 94.8 (68.5) | 347.4 (81.0) | 25 (15) | 14 (8) | 138 (334) | 52 (13) |
Table 2.
Model coefficients (Coef) along corresponding with standard errors (s.e.) and p-values (p) for the Zero-Inflated (ZI) Poisson models for all regions. Final models included either quadratic or polynomial terms for the Fine Fuel Moisture Code (FFMC), depending on Akaike’s Information Criterion (AIC) scores and model fit. Results for coefficients with very high to moderate confidence (p < 0.1) are bolded.
| Region | Variables | Count Coef | s.e. | p | ZI Coef | s.e. | p |
|---|---|---|---|---|---|---|---|
| GP | Intercept | −2.40700 | 0.4044 | 0.000 | 0.936 | 0.077 | 0.000 |
| Poly (FFMC, 3)1 | 0.03267 | 0.0043 | 0.000 | −17.233 | 6.564 | 0.009 | |
| Poly (FFMC, 3)2 | −7.533 | 5.731 | 0.189 | ||||
| Poly (FFMC, 3)3 | −17.411 | 4.619 | 0.000 | ||||
| DCf | 0.00126 | 0.0003 | 0.000 | ||||
| Pow | −0.00007 | 0.0006 | 0.915 | ||||
| EDS | Intercept | −1.78722 | 0.2846 | 0.000 | 0.810 | 0.058 | 0.000 |
| Poly (FFMC, 3)1 | 0.02783 | 0.0030 | 0.000 | −20.025 | 4.692 | 0.000 | |
| Poly (FFMC, 3)2 | −22.760 | 3.386 | 0.000 | ||||
| Poly (FFMC, 3)3 | −18.103 | 3.344 | 0.000 | ||||
| DCf | 0.00090 | 0.0002 | 0.000 | ||||
| Pow | 0.00200 | 0.0005 | 0.000 | ||||
| RMH | Intercept | −1.73976 | 0.2711 | 0.000 | 0.960 | 0.065 | 0.000 |
| Poly (FFMC, 3)1 | 0.02067 | 0.0029 | 0.000 | −24.342 | 4.320 | 0.000 | |
| Poly (FFMC, 3)2 | −18.558 | 3.854 | 0.000 | ||||
| Poly (FFMC, 3)3 | −9.558 | 3.343 | 0.005 | ||||
| DCf | 0.00319 | 0.0003 | 0.000 | ||||
| Pow | 0.00213 | 0.0007 | 0.003 | ||||
| LLB | Intercept | −2.56769 | 0.2258 | 0.000 | −0.035 | 0.074 | 0.637 |
| Poly (FFMC, 3)1 | 0.04534 | 0.0024 | 0.000 | 1.002 | 7.685 | 0.896 | |
| Poly (FFMC, 3)2 | −34.040 | 5.019 | 0.000 | ||||
| Poly (FFMC, 3)3 | −27.362 | 3.949 | 0.000 | ||||
| DCf | 0.00040 | 0.0001 | 0.001 | ||||
| Pow | −0.00099 | 0.0005 | 0.059 | ||||
| KEN | Intercept | −4.17200 | 0.0010 | 0.000 | −0.017 | 0.359 | 0.963 |
| Poly (FFMC, 3)1 | 0.04781 | 0.0111 | 0.000 | −2.364 | 24.072 | 0.922 | |
| Poly (FFMC, 3)2 | −18.460 | 8.892 | 0.038 | ||||
| Poly (FFMC, 3)3 | −26.822 | 11.317 | 0.018 | ||||
| DCf | 0.00085 | 0.0003 | 0.009 | ||||
| Pow | 0.00000 | 0.0008 | 0.999 | ||||
| DRY | Intercept | −6.42641 | 0.0948 | 0.000 | 1.969 | 1.201 | 0.101 |
| Poly (FFMC, 2)1 | 0.06904 | 0.0010 | 0.000 | −258.325 | 130.187 | 0.047 | |
| Poly (FFMC, 2)2 | 202.358 | 98.550 | 0.040 | ||||
| Poly (FFMC, 2)3 | −124.790 | 47.899 | 0.009 | ||||
| DCf | 0.00094 | 0.0005 | 0.058 | ||||
| Pow | 0.00007 | 0.0009 | 0.937 | ||||
| KLK | Intercept | −5.92882 | 0.8925 | 0.000 | −0.132 | 0.6800 | 0.846 |
| Poly (FFMC, 2)1 | 0.05213 | 0.0096 | 0.000 | 39.130 | 49.396 | 0.428 | |
| Poly (FFMC, 2)2 | −45.571 | 22.724 | 0.045 | ||||
| DCf | 0.00180 | 0.0010 | 0.061 | ||||
| Pow | 0.00315 | 0.0008 | 0.000 | ||||
| SUD | Intercept | −4.74759 | 0.6273 | 0.000 | −0.281 | 0.363 | 0.438 |
| Poly (FFMC, 2)1 | 0.05706 | 0.0068 | 0.000 | 21.796 | 31.095 | 0.483 | |
| Poly (FFMC, 2)2 | −47.314 | 15.277 | 0.002 | ||||
| DCf | −0.00121 | 0.0005 | 0.039 | ||||
| Pow | 0.00022 | 0.0004 | 0.629 |
Table 3.
Logistic regression coefficients along with corresponding standard errors (s.e.) and p-values (p), for the probability of a spring fire escaping initial attack and growing to over 4 ha. Explanatory variables tested include the DC value at the end of the previous season fall (DCf), overwinter precipitation (Pow), and Initial Spread Index (ISI). Results for coefficients with very high to moderate evidence (0 < p < 0.10) appear in bold.
| Region | Intercept | s.e. | p | DCf | s.e. | p | Pow | s.e. | p | ISI | s.e. | p |
|---|---|---|---|---|---|---|---|---|---|---|---|---|
| GP | −0.515 | 0.431 | 0.232 | −0.0003 | 0.0009 | 0.735 | −0.002 | 0.002 | 0.275 | 0.020 | 0.026 | 0.435 |
| EDS | −2.223 | 0.357 | 0.000 | 0.0009 | 0.0009 | 0.312 | 0.003 | 0.001 | 0.001 | 0.047 | 0.014 | 0.001 |
| RMH | −2.639 | 0.417 | 0.000 | 0.0059 | 0.0013 | 0.000 | −0.001 | 0.003 | 0.748 | 0.034 | 0.014 | 0.167 |
| LLB | −0.279 | 0.027 | 0.338 | −0.00001 | 0.0005 | 0.980 | −0.002 | 0.002 | 0.385 | 0.030 | 0.008 | 0.000 |
| KEN | −2.020 | 0.478 | 0.000 | 0.0005 | 0.0010 | 0.637 | −0.003 | 0.002 | 0.193 | 0.095 | 0.022 | 0.000 |
| DRY | −2.326 | 0.541 | 0.000 | 0.0019 | 0.0016 | 0.225 | −0.001 | 0.003 | 0.808 | 0.023 | 0.031 | 0.459 |
| SUD | 1.385 | 0.451 | 0.002 | −0.0013 | 0.0016 | 0.402 | −0.001 | 0.001 | 0.691 | 0.072 | 0.018 | 0.000 |
| KLK | −1.266 | 0.665 | 0.057 | 0.0004 | 0.0022 | 0.853 | −0.001 | 0.002 | 0.781 | 0.083 | 0.028 | 0.003 |
Table 4.
Linear regression model coefficients along with corresponding standard errors (s.e.) and p-values (p) for the logarithm of area burned in the spring. Explanatory variables tested include the DC value at the end of the previous season fall (DCf) and overwinter precipitation (Pow). Coefficients and final models with very high to moderate confidence (p < 0.1) appear in bold.
| Region | Intercept | s.e. | p | DCf | s.e. | p | Pow | s.e. | p | R2 | s.e. | p |
|---|---|---|---|---|---|---|---|---|---|---|---|---|
| GP | 1.757 | 0.538 | 0.002 | 0.0013 | 0.003 | 0.615 | 0.0007 | 0.001 | 0.552 | 0.02 | 0.805 | 0.742 |
| EDS | 2.066 | 0.498 | 0.000 | 0.0017 | 0.001 | 0.190 | −0.0013 | 0.001 | 0.325 | 0.07 | 0.759 | 0.273 |
| RMH | 1.333 | 0.412 | 0.003 | 0.0049 | 0.001 | 0.001 | −0.0037 | 0.003 | 0.248 | 0.26 | 0.729 | 0.004 |
| LLB | 2.404 | 0.847 | 0.007 | 0.0010 | 0.001 | 0.461 | 0.0038 | 0.006 | 0.532 | 0.02 | 1.122 | 0.649 |
| KEN | 1.495 | 0.418 | 0.001 | 0.0025 | 0.001 | 0.023 | −0.0010 | 0.002 | 0.635 | 0.15 | 0.734 | 0.054 |
| DRY | 0.609 | 0.332 | 0.074 | 0.0023 | 0.001 | 0.017 | 0.0003 | 0.001 | 0.844 | 0.15 | 0.561 | 0.055 |
| KLK | 1.500 | 0.5268 | 0.007 | 0.0006 | 0.0021 | 0.777 | −0.0004 | 0.0016 | 0.776 | 0.00 | 0.840 | 0.929 |
| SUD | 2.473 | 0.4179 | 0.000 | -0.0004 | 0.0014 | 0.761 | -0.0021 | 0.0012 | 0.084 | 0.08 | 0.583 | 0.193 |
© 2020 by the authors. Licensee MDPI, Basel, Switzerland. This article is an open access article distributed under the terms and conditions of the Creative Commons Attribution (CC BY) license (http://creativecommons.org/licenses/by/4.0/).
Share and Cite
MDPI and ACS Style
Hanes, C.; Wotton, M.; Woolford, D.G.; Martell, D.L.; Flannigan, M. Preceding Fall Drought Conditions and Overwinter Precipitation Effects on Spring Wildland Fire Activity in Canada. Fire 2020, 3, 24. https://doi.org/10.3390/fire3020024
AMA Style
Hanes C, Wotton M, Woolford DG, Martell DL, Flannigan M. Preceding Fall Drought Conditions and Overwinter Precipitation Effects on Spring Wildland Fire Activity in Canada. Fire. 2020; 3(2):24. https://doi.org/10.3390/fire3020024
Chicago/Turabian StyleHanes, Chelene, Mike Wotton, Douglas G. Woolford, David L. Martell, and Mike Flannigan. 2020. "Preceding Fall Drought Conditions and Overwinter Precipitation Effects on Spring Wildland Fire Activity in Canada" Fire 3, no. 2: 24. https://doi.org/10.3390/fire3020024