Comparison of Machine Learning and Deep Learning Models for Network Intrusion Detection Systems


1
Department of Computational Data Science and Engineering, North Carolina A&T State University, Greensboro, NC 27411, USA
2
Department of Computer Science, North Carolina A&T State University, Greensboro, NC 27411, USA
3
Electrical Engineering and Computer Science Department, Wichita State University, Wichita, KS 67260, USA
*
Author to whom correspondence should be addressed.
Future Internet 2020, 12(10), 167; https://doi.org/10.3390/fi12100167
Submission received: 10 September 2020
/
Revised: 26 September 2020
/
Accepted: 28 September 2020
/
Published: 30 September 2020
(This article belongs to the Collection Computer Vision, Deep Learning and Machine Learning with Applications)
Abstract
:The development of robust anomaly-based network detection systems, which are preferred over static signal-based network intrusion, is vital for cybersecurity. The development of a flexible and dynamic security system is required to tackle the new attacks. Current intrusion detection systems (IDSs) suffer to attain both the high detection rate and low false alarm rate. To address this issue, in this paper, we propose an IDS using different machine learning (ML) and deep learning (DL) models. This paper presents a comparative analysis of different ML models and DL models on Coburg intrusion detection datasets (CIDDSs). First, we compare different ML- and DL-based models on the CIDDS dataset. Second, we propose an ensemble model that combines the best ML and DL models to achieve high-performance metrics. Finally, we benchmarked our best models with the CIC-IDS2017 dataset and compared them with state-of-the-art models. While the popular IDS datasets like KDD99 and NSL-KDD fail to represent the recent attacks and suffer from network biases, CIDDS, used in this research, encompasses labeled flow-based data in a simulated office environment with both updated attacks and normal usage. Furthermore, both accuracy and interpretability must be considered while implementing AI models. Both ML and DL models achieved an accuracy of 99% on the CIDDS dataset with a high detection rate, low false alarm rate, and relatively low training costs. Feature importance was also studied using the Classification and regression tree (CART) model. Our models performed well in 10-fold cross-validation and independent testing. CART and convolutional neural network (CNN) with embedding achieved slightly better performance on the CIC-IDS2017 dataset compared to previous models. Together, these results suggest that both ML and DL methods are robust and complementary techniques as an effective network intrusion detection system.
Keywords:
network intrusion detection; CIDDS; machine learning; deep learning; KNN; CART; XGBoost; CNN; LSTM; ensemble1. Introduction
Cybersecurity plays a crucial role in nearly all aspects of our lives, including social, economic, and political systems. Security researchers have developed various network intrusion detection methods and tools to detect and prevent network intrusions from evolving cyber-attacks [1]. Intrusion detection is a way of monitoring a network for malicious activity or policy violations. It differs from traditional firewall in terms of its dynamic nature where traditional firewall has a static set of rules. With the advent of new technologies and their ever-growing reliance on cyberspace and cloud computing, it is more critical than ever to protect this pseudo aspect of our lives. From our daily routine to minute details in our lives that we entrust in social media and other applications, they need proper defense against the prying eyes.
Signature-based and anomaly-based are some typical detection methods. Signature-based detection is a static method with predefined patterns, whereas anomaly-based detection is a dynamic method with a trustworthy model that compares with malicious activity [1]. A signature-based detection method could be useless against unknown attacks. It is vulnerable to both machine learning-based black-box attacks (no information on training dataset and model constraints) [2] and a white-box attack (access to training dataset) [3]. Anomaly-based detection uses artificial intelligence (AI) models consisting of both machine learning (ML) and deep learning (DL) architectures to train a model based on normal activity to detect any anomalies. They can detect these anomalies from unknown attacks as well.
The predictability of AI models could lean toward accuracy or interpretability. Both traits are important. Accurate or black-box models such as neural networks or complicated ensemble models provide high accuracy, but they do not provide feature importance. On the other hand, white-box models like linear regression or decision trees can provide feature engineering but might lack in accuracy for complex datasets. Hence, both ML and DL models should be taken into consideration. In this paper, we will implement both ML and DL on the Coburg intrusion detection dataset (CIDDS) developed by Ring et al. [4,5] to develop robust intrusion detection systems (IDSs). CIDDS datasets present the labeled flow-based data in a simulated office environment with both updated attacks and normal usage. Although our focus will be on the CIDDS dataset in this paper, we will implement our models on the intrusion detection evaluation dataset (CIC-IDS2017) [6] as well, for benchmarking and developing robust intrusion detection systems. CIC-IDS2017 is also a labeled flow-based dataset with similar traits as that of the CIDDS dataset.
2. Related Work
As network intrusions evolve, it has become imperative to develop dynamically generated flow-based datasets instead of static datasets with both positive and negative examples. The intrusion detection system (IDS) is deployed at a strategic point within the network. It records inbound and outbound traffic from all the devices in the network, creating a flow-based dataset.
KDD cup 99 datasets [7] have been used widely for the past decade for the evaluation of network IDS [8]. The KDD99 dataset was created from DARPA network dataset files [9]. Obeidat et al. [10] applied different ML algorithms on the KDD dataset, such as J48 Decision Tree, Random Forest, Multilayer Perception, Naïve Bayes, and Bayes Network classifiers. In this research work, Random Forest achieved the highest accuracy rate for detecting and classifying all KDD dataset attacks. DL algorithms have also been applied in this dataset. A deep neural network has been implemented and attained high accuracy [11]. Chowdhury et al. [12] implemented few-shot intrusion detection using support vector machines (SVMs) and 1-nearest neighbor on features extracted from the trained deep convolutional neural network (CNN) for intrusion detection. However, the KDD99 dataset suffers from network biasness. In [5], the analysis of the KDD99 dataset showed that about 78% and 75% of the records are duplicated in the train and test set, respectively. This high percentage of redundancy will cause the model to be biased and not reliable.
Tavallaee et al. [8] developed the NSL-KDD dataset from the KDD99 dataset by primarily removing redundancy. Various ML and DL algorithms have been applied to this dataset. Revathi et al. [13] and Ever et al. [14] implemented various ML techniques with high testing accuracy on the NSL-KDD dataset for intrusion detection. Su et al. developed the BAT model [15] that combines Bidirectional Long Short-Term Memory (BLSTM) and attention mechanism. Attention mechanism is used to generate key features of traffic data, deduced from packet vectors generated by the BLSTM model. Furthermore, Zhang et al. [16] implemented a DL model utilizing Autoencoder on the NSL-KDD dataset. However, these datasets almost date back to 20 years. Besides their own shortcomings, they might not contain attack scenarios based on evolving threats.
Sperotto et al. [17] published IP flow-based intrusion detection dataset. It provides a classification of attacks and defense techniques by detection of scans, worms, Botnets and Denial-of-Service (DoS) attacks. However, it does not include normal user behavior. Shiravi et al. [18] included network traffic for normal user behavior as well. However, it lacked communication with the external server. This is vital in terms of attacks mostly done through external servers in real-world scenarios. Thus, an IDS may fail to replicate the attack scenario only through an internal server.
The flow-based intrusion detection dataset should be able to replicate real-world attack scenarios by including an external server as well. Furthermore, it is imperative for the dataset to have both positive and negative examples, anomalous or intrusion behavior, and normal user behavior. Furthermore, data generation should be evolving with time, adding new threats. Data generation should be as close to real-world problems as possible.
Ring et al. [4,5] developed the Coburg intrusion detection dataset (CIDDS), which is a labeled flow-based dataset. It has been implemented in OpenStack by creating a virtual office environment imitating daily network usage. The network traffic is recorded in a unidirectional NetFlow format. NetFlow is a flexible and extensible method to record network performance data, which has become a prevalent method for monitoring traffic in high-speed networks [19], developed by Cisco Systems. Attacks such as denial of service, brute force, and port scans are implemented and labeled for supervised learning. Verma et al. [20] implemented K-nearest neighbor classification and K-means clustering algorithms on the first version of this dataset, CIDDS-001. However, it includes some biased features such as host IP, identified as the attacker. Furthermore, cross-validation has not been implemented, which determines the robustness of the model, and it lacks comparison with deep learning models.
In this study, we will use both the CIDDS-001 and CIDDS-002 datasets independently as well as in combined form. We will implement different ML models and DL models for comparison. We propose and develop an ensemble model that combines the best ML and DL models to improve the overall performance. General performance metrics and time costs will be calculated to determine model effectiveness and efficiency, respectively. Model benchmarking will also be performed on the CIC-IDS2017 dataset, which includes a comparison with state-of-the-art models.
3. Materials and Methods
3.1. Dataset Used
CIDDS-001 and CIDDS-002 (Coburg intrusion detection dataset) [4,5] are used for the evaluation of anomaly-based network intrusion detection in this study. They are labeled as a flow-based dataset and contain unidirectional NetFlow data. The dataset is generated by emulating a small business environment using OpenStack. The dataset contains ten attributes from NetFlow, and manually labeled classes and attack types. Our focus will be on these attributes and classes for both internal and external servers.
Attributes such as source IP address, destination IP address, and date were not used with the assumption that those features may create biases and not be useful to detect the attacks. Table 1 shows an overview of attributes and classes for both CIDDS-001 and CIDDS-002, that were considered for this study. CIDDS-001 dataset includes 92 attacks, 70 within the OpenStack environment, and 22 with external servers. CIDDS-002 dataset includes an additional 43 attacks to the CIDDS-001 dataset within the OpenStack environment.
Furthermore, we balanced the dataset by under-sampling, such that all class labels have the same number. It helps to increase fairness, representation, and reduce biases. We combined CIDDS-001 and CIDDS-002 internal server data as well for analysis. After balancing the dataset, it is divided into 80% train and 20% test dataset. Table 2 shows the number of train and test data.
3.2. ML Models Used in This Study
In this study, we applied different ML and DL models on CIDDS datasets and compared their performances. A spot check is performed on the CIDDS-001 external dataset using different ML models to identify the best performing models. ML models such as K-nearest neighbor (KNN) [21], XGBoost [22], and classification and regression trees (CARTs) [23] performed best for this dataset. In the following subsections, we briefly describe the applied models.
3.2.1. K-Nearest Neighbor (KNN)
KNN [20] is one of the essential supervised learning algorithms in ML. It is non-parametric and does not assume any underlying assumptions about the distribution of data. Initially, K is assigned to choose the number of neighbors, which is usually classified in the classification problem. It predicts the class based on the nearest distance between the predefined number of training samples and the new point. Euclidean, Manhattan, and Minkowski are some predominant distance measure functions. However, for the categorical variables, the Hamming distance is used.
3.2.2. XGBoost
XGBoost [22] is an optimized distributed gradient boosting algorithm that is highly efficient. XGBoost improves upon gradient boosting machines through system optimization and improvement in algorithms. Regular gradient boosting, stochastic gradient boosting, and regularized gradient are three main forms of gradient boosting. For efficiency, the system features include parallelization, distributed computing, out-of-core computing, and cache optimization. These features enable multi-machine training to the optimization of data structures to achieve the best global minimum and run time.
3.2.3. CART
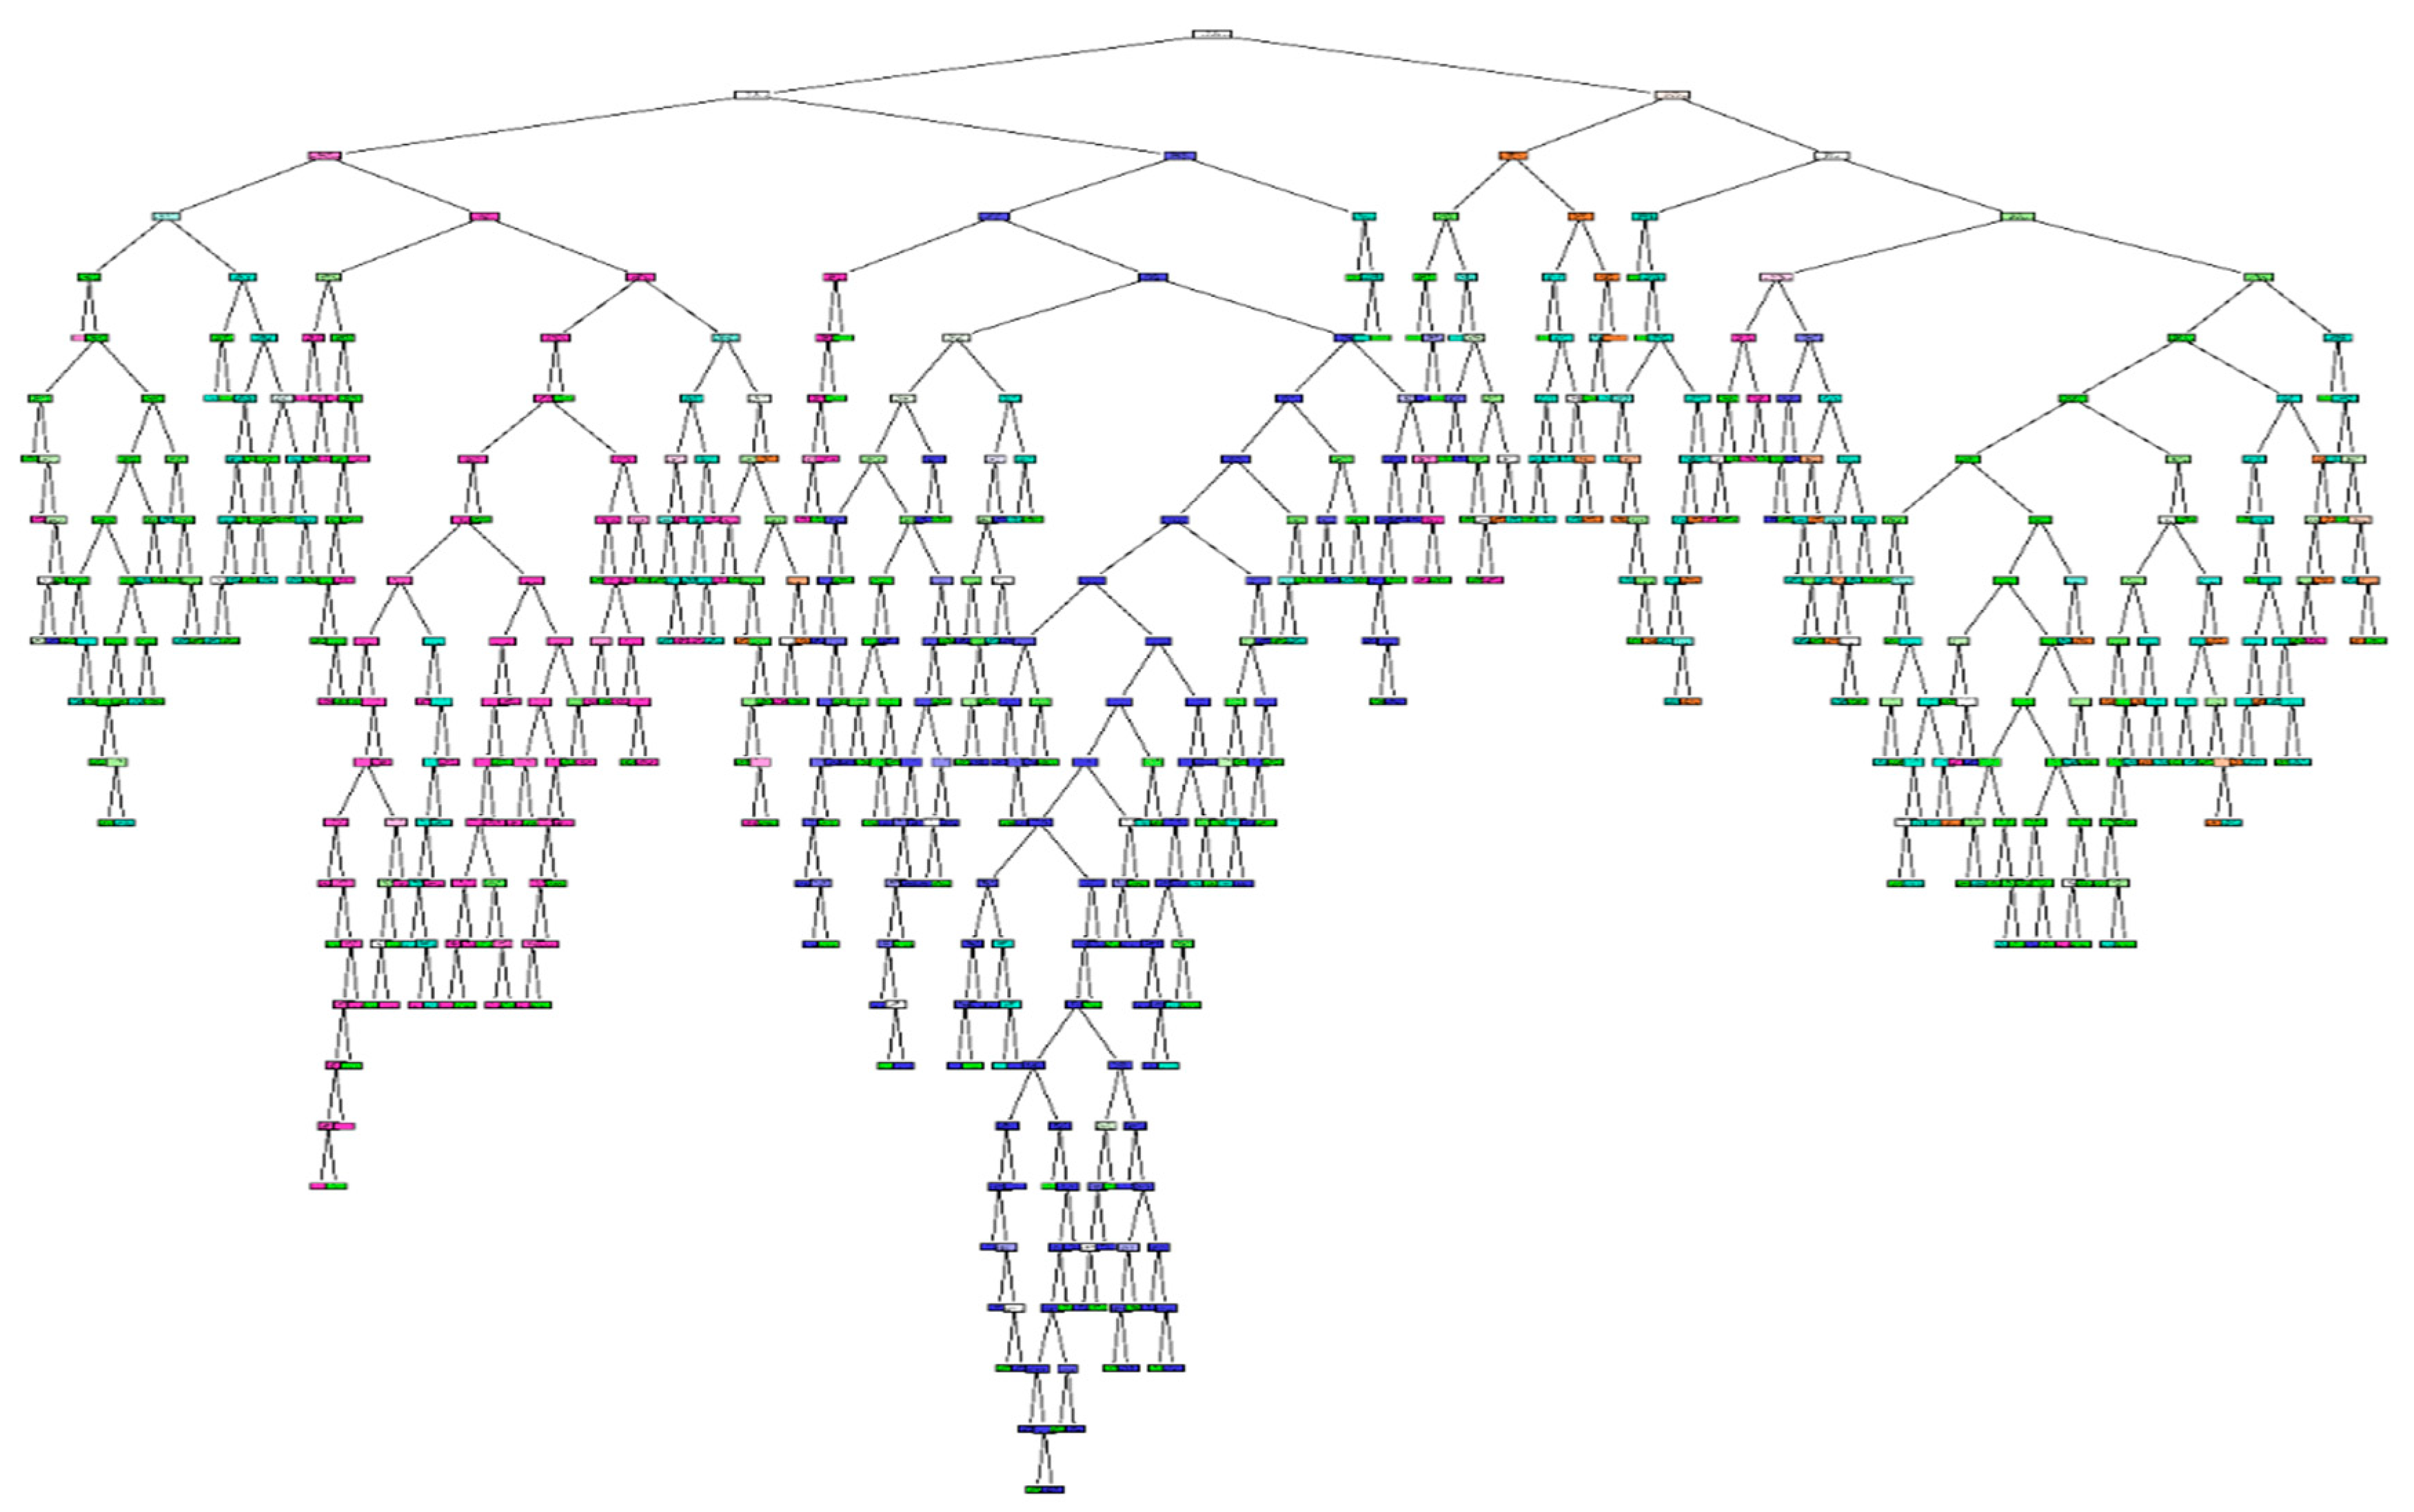
Classification and regression trees (CARTs) [22] can be used for both classification and regression problems. A CART output is a decision tree that is generally visualized as a binary tree for each attribute. It is not significantly impacted by outliers in the input variables and can incorporate the same variables more than once in different parts of the trees. Decision trees are composed of decision nodes, branches, and leaf nodes. The tree grows from the root node and splits at each node, while the leaf node is the output variable. The decision tree stopping criteria, as pointed by Zhang [24] is that all leaf nodes represent a single class by attaining homogeneity within prespecified training counts. Figure 1 shows the overall decision tree for the CIDDS-001 external dataset with a detailed figure included as separate Supplementary Material where each tree description can be seen.
3.3. DL Models Used in This Study
In this paper, we apply convolutional neural networks (CNNs) [25] and long short-term memory (LSTM) [26] as base DL models, optimized with encoding. The embedding layer has been used for the encoding of different features. In the following subsections, we briefly describe the architecture of DL methods and encoding applied in this study.
3.3.1. Embedding Layer
The embedding layer is used for encoding in this study. It has been primarily used in natural language processing with great success [27]. The embedding layer precedes DL models [28]. It is initialized with random weights. With every epoch, the layer also optimizes the encoding. Due to its dynamic nature, embedding performs better than static encodings like one hot encoding [28]. The embedding output dimension is set to 7 with respect to the number of variables in this study.
3.3.2. Convolutional Neural Network (CNN)
Firstly, for CNN, encoded or non-encoded input is fed into a convolutional layer with 64 filters by optimizing dimension using the lambda layer. Filter size is 2 × 2, and the activation function used is a rectification linear unit (ReLU). The output of dimension 7 × 7 × 64 is fed into another 2D convolutional layer with 128 filters with size 2 × 2 after the dropout layer. Dropout layer is used to minimize overfitting. Then the output of dimension 7 × 7 × 128 is fed into another 2D convolutional layer with 256 filters with size 2 × 2. Thereafter, a 2D max-pooling layer is used with size 2 × 2 with output size 3 × 3 × 256, and the last convolutional layer with 128 filters is used. After one more 2D max-pooling layer and flattening, the output is fed into the dense layer with four hidden layers and the final output layer. Adam [29] was used as an optimizer for CNN architecture. It uses adaptive learning rates methodology to calculate individual learning rates for each parameter. Softmax is used as an activation function. It assigns probabilities to each class that sums up to one. The detailed parameter description for the CNN model is shown in Table 3.
3.3.3. Long Short-Term Memory (LSTM)
For LSTM, encoded data are fed into two consecutive LSTM layers with dropouts enabled. Then the output is fed into the dense layers with the final output at the end. ReLU is used as an activation function for LSTM layers and SoftMax for the final output layer. Model Checkpoint function is used for both models to extract the best model out of all the epochs based on the validation dataset. The detailed parameter description for the CNN model is shown in Table 4.
3.4. Ensemble Model
Ensemble learning is the combination of different models to optimize the performance either by different combining algorithms or using different training datasets. The weightage algorithm and stacking algorithm are some of the standard combining algorithms.
In the proposed ensemble model, it merges ML and DL models based on weightage or stacking [30], as shown in Figure 2. The model averaging ensemble combines prediction from different models and generally improves the performance. A grid search weighted average ensemble is used for this purpose. The model weights are values assigned to different models based on their individual performance. Weight values normalized values between 0 and 1, such that the weights across all ensemble members sum to one. Some models can have high sensitivity, whereas some might have high specificity. Combining them with respect to their performance without completely discarding any models will improve the performance.
The next method used for the combination was stacking. Unlike a grid search weighted average ensemble, a stacking ensemble can use the set of predictions as a base to conditionally decide to weight the input predictions differently. Detailed information on the stacking ensemble model is shown in Supplementary Material Figure S1.
3.5. Performance Metrics
In this study, 10-fold cross-validation was used to evaluate the performance of the model and to determine its robustness. In 10-fold cross-validation, the data are partitioned into ten equal parts. Then, one part is left out for validation, and training is performed on the remaining nine parts. This process is repeated until all parts are used for validation.
Confusion Matrix, precision, recall, and F1-score were used as performance metrics. For three classes, the dimension of the confusion matrix is 3 × 3, and for five classes, the dimension is 5 × 5, respectively. Its diagonal matrix is true predicted values. It consists of true-positive (TP), false-positive (FP), true-negative (TN), and false-negative (FN).
Furthermore, the time cost has also been evaluated for different models to determine their efficiency.
4. Results and Analysis
4.1. CIDDS-001 External Dataset
Firstly, different ML models and DL models were applied for the analysis in the CIDDS-001 external dataset with five classes. To determine the robustness of these models, 10-fold cross-validation was applied in the training dataset. The results are shown in Table 5. CART performed better than other ML models with an average mean accuracy of 99.31% with a standard deviation (SD) of 0.15. The SDs for other models were low as well, and this shows the general robustness and generalizability of applied models. Furthermore, CNN, without encoded input, only achieved 68.10% mean accuracy in 10-fold cross-validation. LSTM, without encoded input, achieved 98.97% mean accuracy with an SD of 0.08. With the embedding layer added to the model for dynamic encoding, both CNN and LSTM achieved improved performance. CNN with embedding got a mean accuracy of 99.15% with an SD of 0.08. LSTM with the embedding layer achieved a mean accuracy of 99.18% with an SD of 0.10, performing minutely better than the CNN model. Total execution time was higher for deep learning models in comparison to ML models. CART has the best execution time of 0.65 s in 10-fold cross-validation.
Furthermore, an independent test was performed in 20% of the remaining dataset that was not used for the training. The results are shown in Table 5. Weighted ensemble models and a stacked ensemble model were included for this test. The weighted ensemble model included CART, CNN (with embedding), and LSTM (with embedding), whereas the stacked ensemble model included CNN (with embedding) and LSTM (with embedding). CART achieved an accuracy of 99.38%, with the lowest execution time of 0.067. Detailed performance metrics for CART is given in Table 6. Both deep learning models achieved around 99% accuracy. However, the stacked ensemble that combined CNN and LSTM did not improve the result achieving 98% accuracy. The weighted ensemble gave weightage of 0.105, 0.421, and 0.474 for LSTM (with embedding), CNN (with embedding), and CART, respectively. It did improve the result very slightly with an increase of 0.02% but suffered much in training time. Hence, for other dataset, ensemble models were not applied.
4.2. CIDDS-001 Internal and CIDDS-002 Dataset
With the pre-analysis of different models from the CIDDS-001 external dataset, ensemble models were dropped for this part of the analysis. This study was carried out for the CIDDS-001 internal and CIDDS-002 datasets, both with three classes. An independent test was carried out for 20% of the remaining dataset that was not used for the training, with different ML and DL models for both datasets, respectively. The results are shown in Table 7. Overall, CART performed better than others both in terms of accuracy and training time. It achieved 99.88% accuracy with 15.5 s of training time for the CIDDS-001 internal dataset and 99.64% accuracy with 0.77 s of training time for the CIDDS-002 dataset. KNN and XGBoost accuracy also increased with comparison to the CIDDS 1 external dataset but still lower than CART in overall performance.
Both DL models with embedding encoding performed well with 99.85% and 99.51% accuracy for CIDDS-001 internal and CIDDS-002 datasets, respectively. Training time for CNN (with embedding) was slightly lower than that of LSTM (with embedding) but significantly higher than CART.
Overall, there was not a significant difference between ML models and DL models except for the training time. Since CART is performing better than other ML models consistently both in terms of accuracy and training time, KNN and XGBoost were dropped for the next analysis. Detailed performance metrics for CART is given in Table 8 and Table 9 for both the CIDD-001 and CIDDS-002 dataset, respectively.
4.3. CIDDS-001 Internal and CIDDS-002 Combined Dataset
For the last part of the analysis, an independent test was carried out for the combined dataset of CIDDS-001 internal and CIDDS-002. CART, CNN (with embedding), and LSTM (with embedding) were performing better in the previous analysis, so they were chosen for this final analysis. The results are shown in Table 10. Following the same pattern from previous analysis, CART performed better than other models both in terms of accuracy and training time. It achieved 99.85% accuracy, slightly better than that of CNN’s and LSTM’s 99.77% and 99.79% accuracies, respectively. However, CART’s training time of 23.91 s was significantly better than that of CNN’s and LSTM’s 841.46 and 1172.90 s, respectively. Furthermore, the performance metrics of CART are given in Table 11.
4.4. Model Benchmarking
Verma et al. [20] implemented KNN classification on the first version of this dataset, CIDDS-001. We implemented KNN on a balanced CIDDS-001 external dataset, and the results are shown in Table 5. CART and DL models with embedding outperform KNN, both in the 10-fold cross-validation and independent test.
Furthermore, we implemented our models on the intrusion detection evaluation dataset (CIC-IDS2017) [6] for benchmarking. For this purpose, we used CART and CNN as ML and DL models, respectively. We chose these models based on performance metrics and training time costs. CNN+embedding was preferred over LSTM+embedding, due to negligible loss on overall accuracy with better training time. We compared our results with state-of-the-art models implemented by Pelletier et al. [31]. The results are shown in Table 12.
Pelletier et al. [31] implemented a Neural Network and Random Forest, which achieved consistent high accuracy over 99% in all of the attacks. We used attacks with a high number of instances and balanced them by under-sampling. Our DL and ML models achieved comparable and marginally better accuracies than previous models.
4.5. Feature Importance
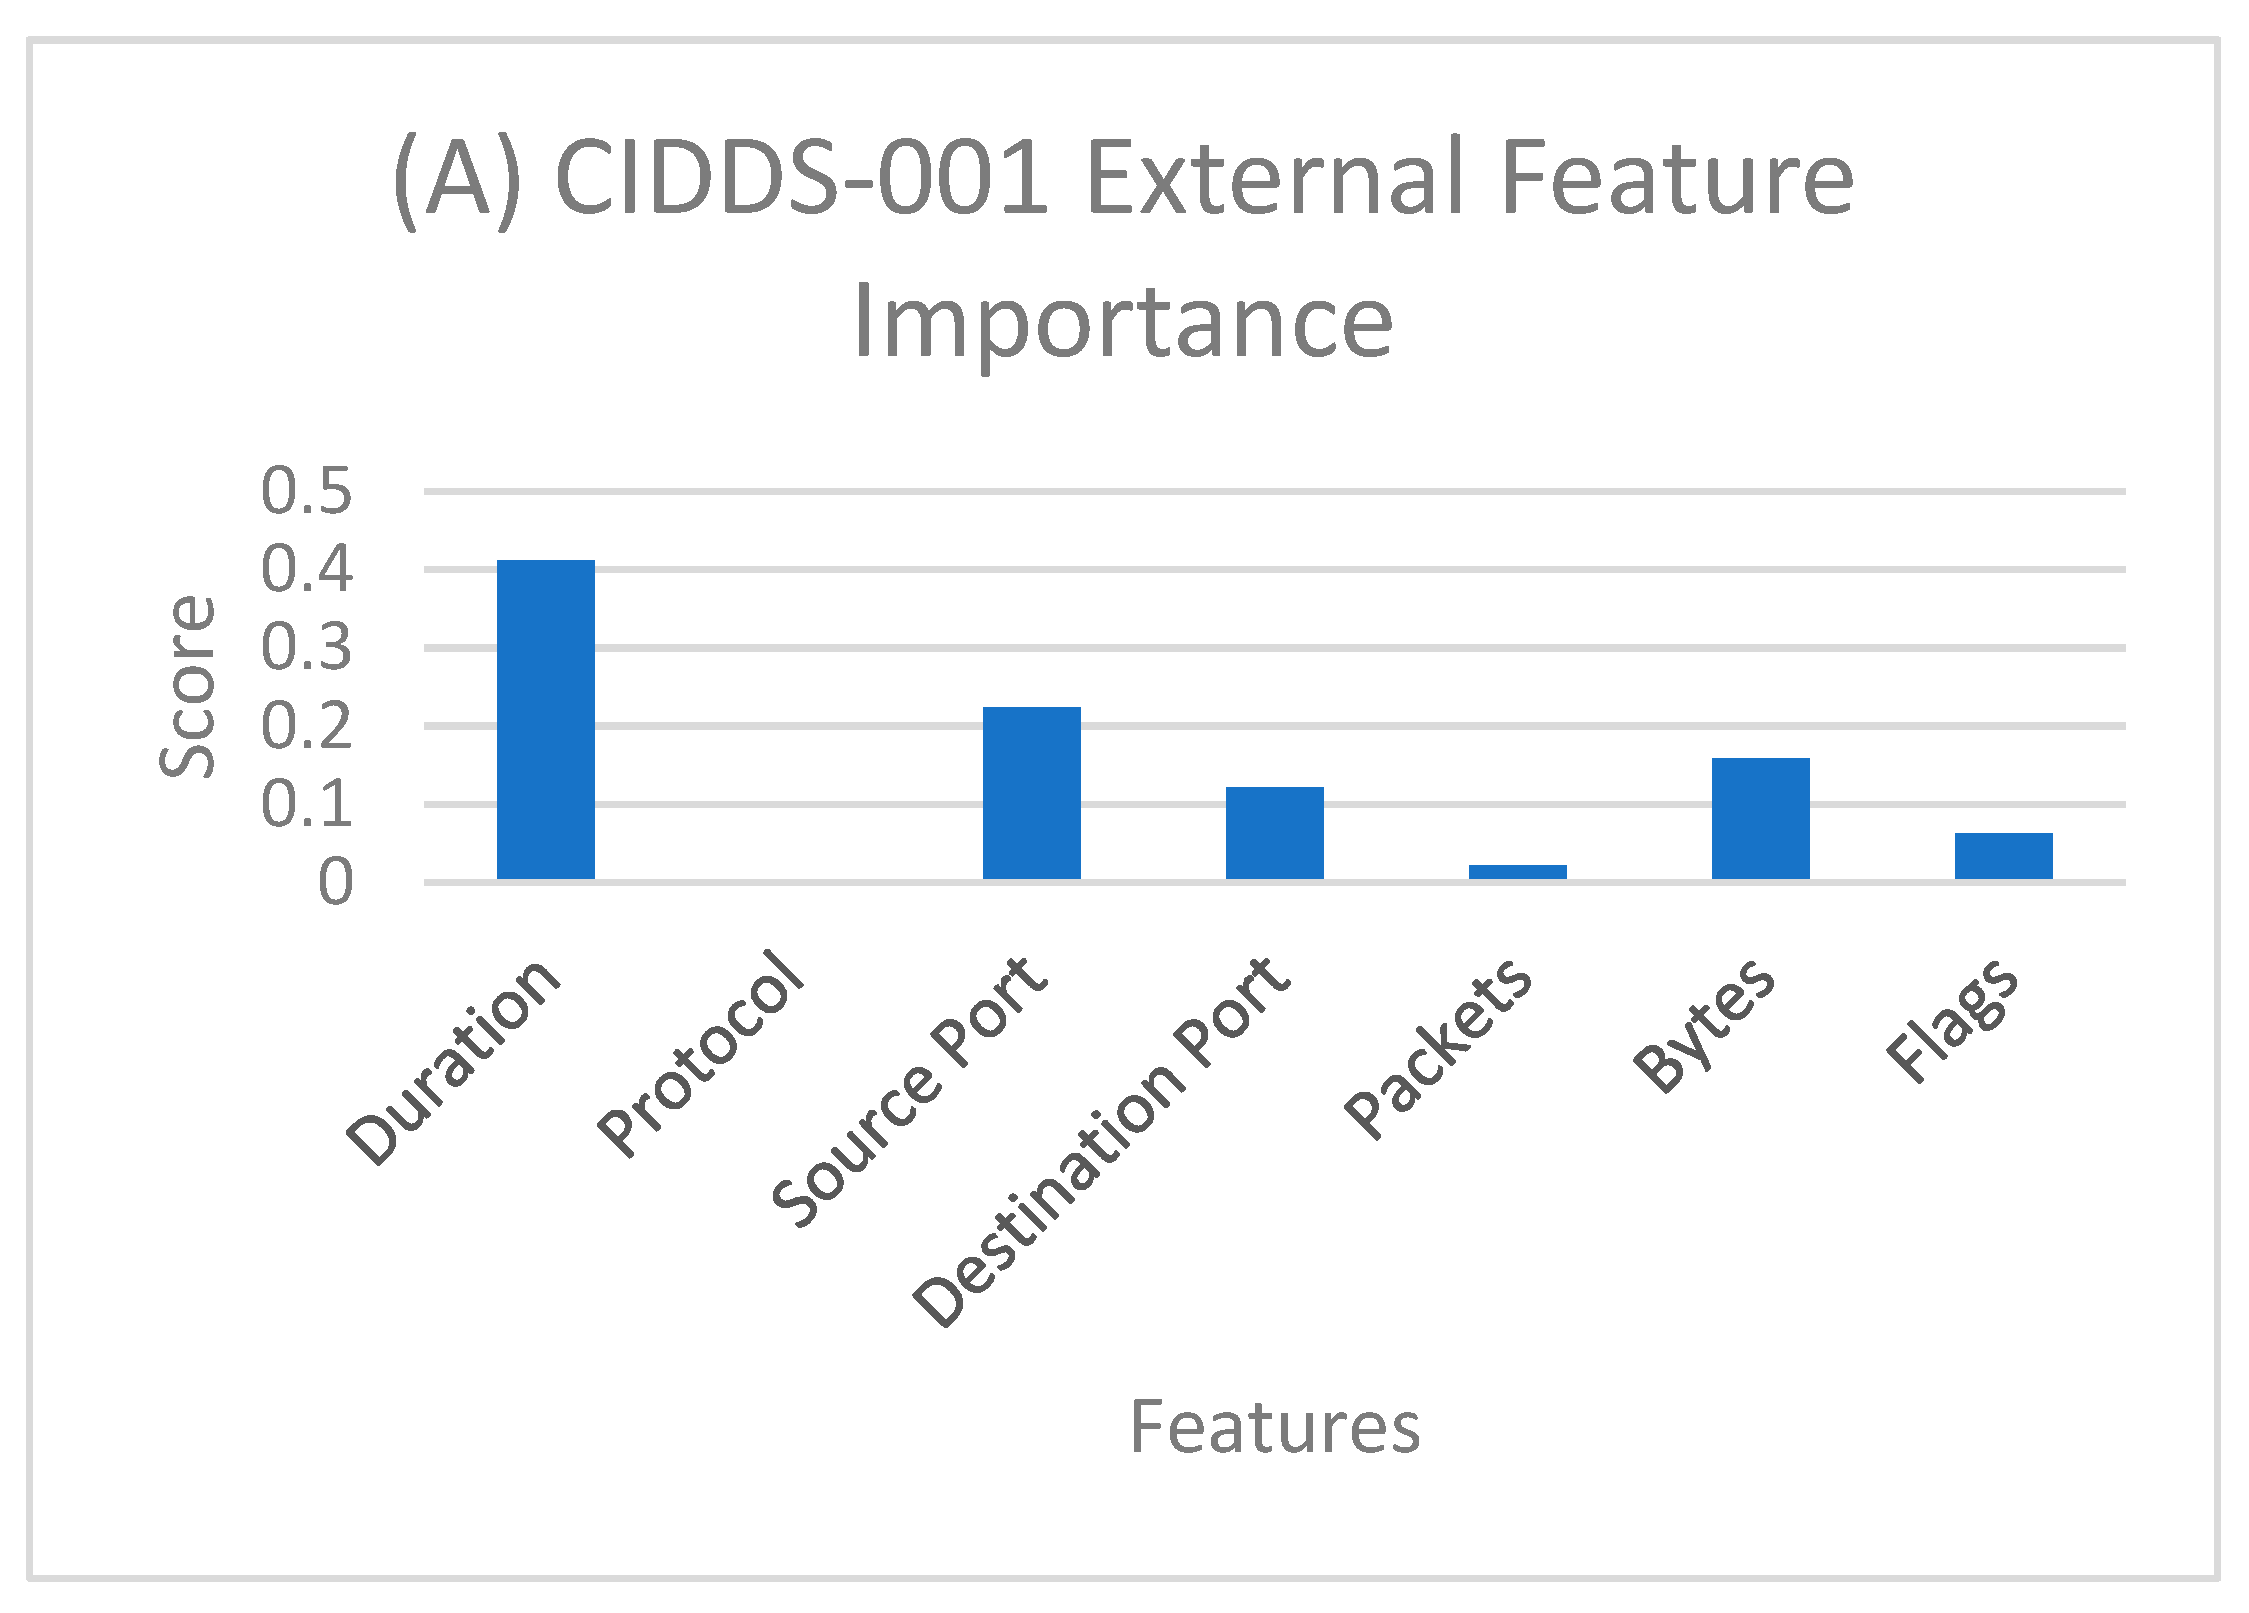
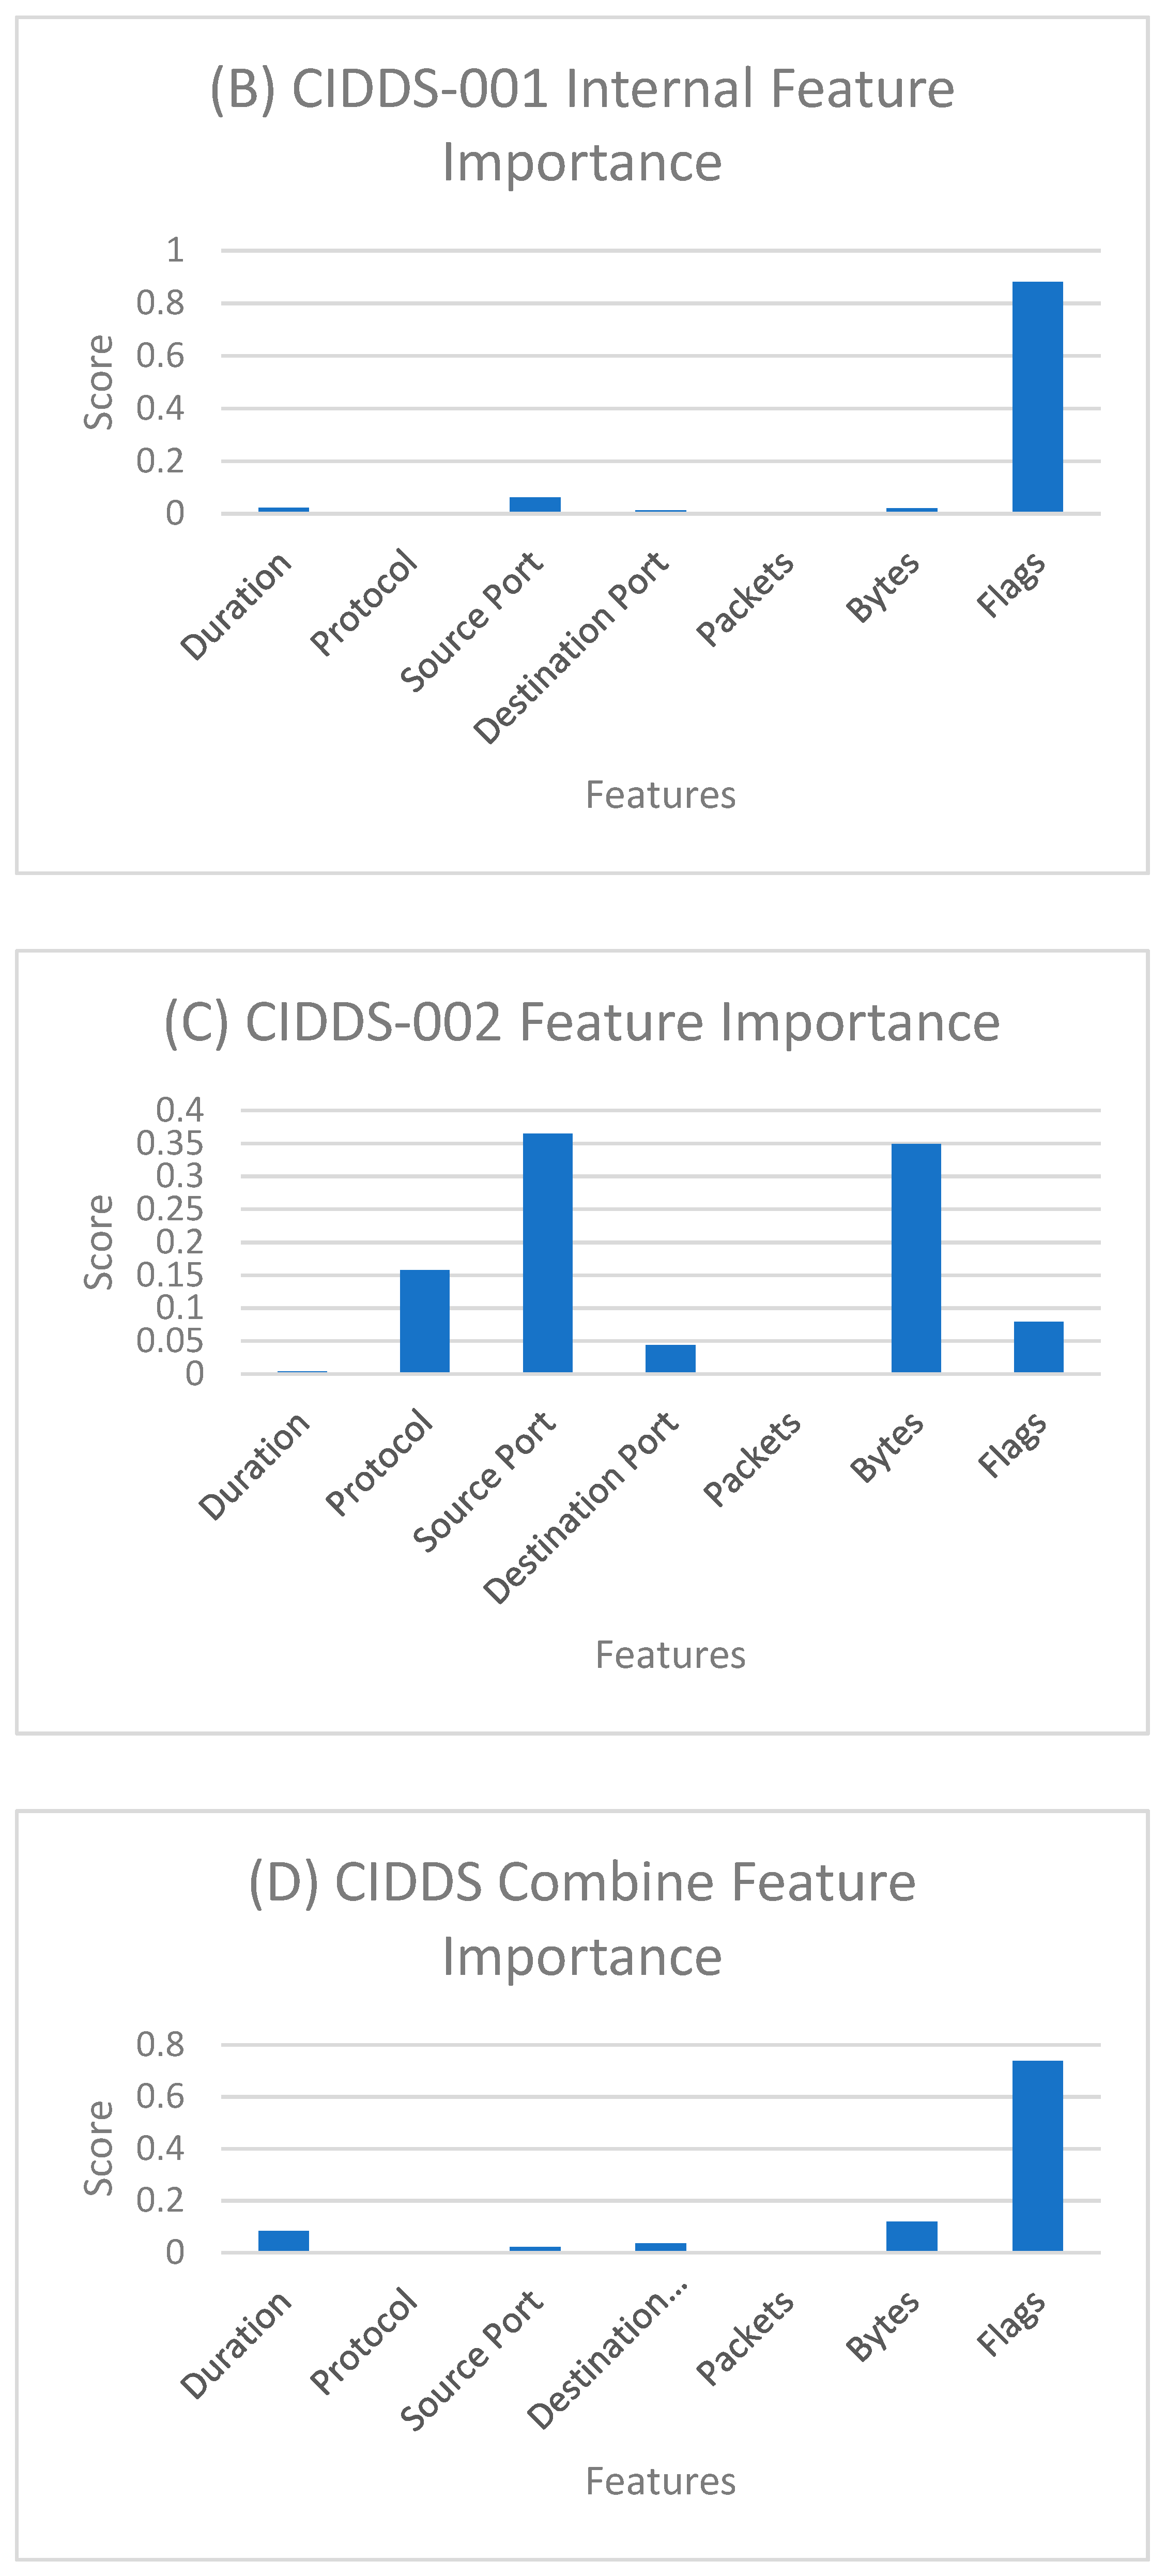
One of the essential benefits of using ML models is feature importance. These models help us determine the variable effects different attributes can have on classification. Feature importance using different ML algorithms assigns a score to different attributes based on how well they are at predicting class. Feature importance gives a general idea about the impact of different features on classification and can be very useful in feature engineering. In our study, we used CART to calculate feature importance among seven features described in Table 1.
Feature importance for different sets of data is shown in Figure 3. For the CIDDS-001 external server, duration has the most impact on the classification. However, for the CIDDS-001 internal server flags scored significantly higher than other attributes. In CIDDS-002, source port and bytes scored relatively higher than other attributes. Finally, in the combined dataset, flags scored higher as well.
The reason flags scored higher in combined dataset similar to that of CIDDS-001 is because CIDDS-001 is nearly eight times larger than CIDDS-002. So, the feature importance score is biased towards the CIDDS-001 dataset. Due to the difference in the number of classes in the internal and external datasets, we can observe the difference in feature importance for different attributes for respective datasets.
5. Conclusions
We have implemented different ML and DL algorithms as an intrusion detection system in this study. As a benchmark dataset, a recently developed CIDDS dataset has been used. The dataset is balanced by under-sampling such that all classes have the same number of data.
Overall, CART performed relatively well in all sets of datasets in terms of performance metrics, including the accuracy of 99.8% and training time. There is no significant difference between the performance of ML models with regard to internal vs. external network criteria. Non-encoded DL models did not perform well. However, after the implementation of embedding, both CNN and LSTM performed on par with CART with an accuracy of 99% on all the datasets considered. Due to the dynamic nature of embedding encoding, which improvises with training, better performance was achieved. The weighted ensemble that combined CART, CNN and LSTM achieved good accuracies but at high time cost because of the overhead of DL training times. Stacked ensemble (CNN+LSTM) did not improve base CNN and LSTM model performance but added more training cost due to its sequential architecture. It is observed from the experiments and literature review that the ensemble models are not profitable for minor ambiguity problems (where K-accuracies are >95%) but could prove useful in complex scenarios where (K accuracies are less than 90%).
For a comparative analysis, a genetic neural network [32] was also implemented but did not show any significant improvement in the accuracies in the CIDDS dataset. The performance results are given in the supplementary document in Table S1 and Figure S2.
In all sets of datasets, the accuracy of 99% and F1 score of 1 was achieved. In terms of training costs, CART has the least training time. DL models have higher training time, with ensemble model and genetic neural network having the highest training time. Even so, training time was relatively low for such large datasets for both ML and base DL models, thus increasing the viability of our models. Due to higher training costs and negligible performance improvement, the ensemble model was not used for internal server datasets and combined datasets, which are larger in size than the external server dataset.
Further benchmarking was done by applying our ML and DL models on the CIC-IDS2017 dataset and compared with state-of-the-art models. The performance metrics for these models were at 99%, so there was not much room for significant improvement. However, our model’s performance was on par or even slightly better than previous models. This helped us to generalize our model as a robust option as an intrusion detection system, at least with a labeled flow-based dataset.
The training and testing of these models were carried out in the system with an Intel i7-9750 processor, 64GB RAM, and Nvidia 2080 graphic card. The training time was reduced by utilizing CUDA cores in the graphic card.
In this study, a high-performance metric with a relatively low training time was achieved for both ML and DL models in network intrusion detection, with CART performing the best. ML models were able to perform well due to less ambiguity of the feature vectors in the dataset. With a more complex dataset, DL models may outperform ML models. However, ML models give the advantage of control over feature engineering, which is lacking in DL methods. Feature importance helps to select the best relevant features of the data with mutual information criterion and reduce the feature set for better accuracy and faster computations in performance.
For future studies, an improved dataset with more types of attacks can be developed in an OpenStack environment for the benchmark dataset. Further studies should include remedies for sophisticated adversarial attacks using a generative adversarial network (GAN) [33]. Both ML and DL models should be implemented for interpretability and accuracy.
Supplementary Materials
The following are available online at https://www.mdpi.com/1999-5903/12/10/167/s1, Figure S1: Stacked ensemble combining CNN and LSTM, Figure S2: Fitness function for 1000 iteration, Table S1: Accuracy and training cost of neural network using genetic algorithm.
Author Contributions
N.T.: methodology, software, resources, formal analysis, writing—original draft. Z.L.: resources, investigation, writing—review and editing. D.B.K.: conceptualization, supervision, writing—review and editing. B.G.: conceptualization, supervision, validation, writing—review and editing. K.R.: project administration, funding acquisition, conceptualization, supervision, validation, writing—review and editing. All authors have read and agreed to the published version of the manuscript.
Funding
This work was supported partially by CISCO Inc., a research grant. Any opinions, findings, and conclusions or recommendations expressed in this material are those of the author(s) and do not necessarily reflect the views of CISCO Inc.
Conflicts of Interest
The authors declare no conflict of interest.
Abbreviations
| AI | Artificial intelligence |
| ML | Machine learning |
| DL | Deep learning |
| CIDDS | Coburg intrusion detection dataset |
| GAN | Generative adversarial network |
| CNN | Convolutional neural network |
| LSTM | Long short-term memory |
| KNN | K-nearest neighbor |
| CART | Classification and regression trees |
| SD | Standard deviation |
| IDS | Intrusion detection systems |
References
- Hussain, A.; Sharma, P. Efficient Working of Signature Based Intrusion Detection Technique in Computer Networks. Int. J. Sci. Res. Comput. Sci. Eng. Inf. Technol. 2019, 60–64. [Google Scholar] [CrossRef]
- Guo, C.; Gardner, J.R.; You, Y.; Wilson, A.G.; Weinberger, K.Q. Simple Black-box Adversarial Attacks. arXiv 2019, arXiv:1905.07121. [Google Scholar]
- Nazemi, A.; Fieguth, P. Potential adversarial samples for white-box attacks. arXiv 2019, arXiv:1912.06409. [Google Scholar]
- Ring, M.; Wunderlich, S.; Grüdl, D.; Landes, D.; Hotho, A. Creation of Flow-Based Data Sets for Intrusion Detection. J. Inf. Warf. 2017, 16, 40–53. [Google Scholar]
- Ring, M.; Wunderlich, S.; Grüdl, D.; Landes, D.; Hotho, A. Flow-based benchmark data sets for intrusion detection. In Proceedings of the 16th European Conference on Cyber Warfare and Security (ECCWS), Dublin, Ireland, 29–30 June 2017; pp. 361–369. [Google Scholar]
- Sharafaldin, I.; Habibi Lashkari, A.; Ghorbani, A. Toward Generating a New Intrusion Detection Dataset and Intrusion Traffic Characterization. In Proceedings of the International Conference on Information Systems Security and Privacy, Madeara, Portugal, 22–24 January 2018; pp. 108–116. [Google Scholar]
- KDD Cup 1999 Data. Available online: http://kdd.ics.uci.edu/databases/kddcup99/kddcup99.html (accessed on 30 September 2020).
- Tavallaee, M.; Bagheri, E.; Lu, W.; Ghorbani, A.A. A detailed analysis of the KDD CUP 99 data set. In Proceedings of the 2009 IEEE Symposium on Computational Intelligence for Security and Defense Applications, Ottawa, ON, Canada, 8–10 July 2009; pp. 1–6. [Google Scholar]
- Cunningham, R.K.; Lippmann, R.P.; Fried, D.J.; Garfinkel, S.L.; Graf, I.; Kendall, K.R.; Webster, S.E.; Wyschogrod, D.; Zissman, M.A. Evaluating Intrusion Detection Systems without Attacking Your Friends: The 1998 Darpa Intrusion Detection Evaluation; Massachusetts Inst Of Tech Lexington Lincoln Lab: Cambridge, MA, USA, 1999. [Google Scholar]
- Obeidat, I.; Hamadneh, N.; Al-kasassbeh, M.; Almseidin, M. Intensive Preprocessing of KDD Cup 99 for Network Intrusion Classification Using Machine Learning Techniques. arXiv 2018, arXiv:1805.10458. [Google Scholar]
- Jia, Y.; Wang, M.; Wang, Y. Network intrusion detection algorithm based on deep neural network. IET Inf. Secur. 2019, 13, 48–53. [Google Scholar] [CrossRef]
- Chowdhury, M.M.U.; Hammond, F.; Konowicz, G.; Xin, C.; Wu, H.; Li, J. A few-shot deep learning approach for improved intrusion detection. In Proceedings of the 2017 IEEE 8th Annual Ubiquitous Computing, Electronics and Mobile Communication Conference (UEMCON), New York, NY, USA, 19–21 October 2017; pp. 456–462. [Google Scholar]
- Revathi, S.; Malathi, A. A Detailed Analysis on NSL-KDD Dataset Using Various Machine Learning Techniques for Intrusion Detection. Int. J. Eng. Res. Technol. 2013, 2, 1848–1853. [Google Scholar]
- Kirsal-Ever, Y.; Sekeroglu, B.; Dimililer, K. Classification Analysis of Intrusion Detection on NSL-KDD Using Machine Learning Algorithms. In Proceedings of the International Conference on Mobile Web and Intelligent Information Systems, Cham, Switzerland, 26–28 August 2019; pp. 111–122. [Google Scholar]
- Su, T.; Sun, H.; Zhu, J.; Wang, S.; Li, Y. BAT: Deep Learning Methods on Network Intrusion Detection Using NSL-KDD Dataset. IEEE Access 2020, 8, 29575–29585. [Google Scholar] [CrossRef]
- Zhang, C.; Ruan, F.; Yin, L.; Chen, X.; Zhai, L.; Liu, F. A Deep Learning Approach for Network Intrusion Detection Based on NSL-KDD Dataset. In Proceedings of the 2019 IEEE 13th International Conference on Anti-counterfeiting, Security, and Identification (ASID), Xiamen, China,, 25–27 October 2019; pp. 41–45. [Google Scholar]
- Sperotto, A.; Schaffrath, G.; Sadre, R.; Morariu, C.; Pras, A.; Stiller, B. An Overview of IP Flow-Based Intrusion Detection. IEEE Commun. Surv. Tutor. 2010, 12, 343–356. [Google Scholar] [CrossRef] [Green Version]
- Shiravi, A.; Shiravi, H.; Tavallaee, M.; Ghorbani, A.A. Toward developing a systematic approach to generate benchmark datasets for intrusion detection. Comput. Secur. 2012, 31, 357–374. [Google Scholar] [CrossRef]
- Hofstede, R.; Čeleda, P.; Trammell, B.; Drago, I.; Sadre, R.; Sperotto, A.; Pras, A. Flow Monitoring Explained: From Packet Capture to Data Analysis With NetFlow and IPFIX. IEEE Commun. Surv. Tutor. 2014, 16, 2037–2064. [Google Scholar] [CrossRef] [Green Version]
- Verma, A.; Ranga, V. Statistical analysis of CIDDS-001 dataset for Network Intrusion Detection Systems using Distance-based Machine Learning. Procedia Comput. Sci. 2018, 125, 709–716. [Google Scholar] [CrossRef]
- Cover, T.; Hart, P. Nearest neighbor pattern classification. IEEE Trans. Inf. Theory 1967, 13, 21–27. [Google Scholar] [CrossRef]
- Chen, T.; Guestrin, C. XGBoost: A Scalable Tree Boosting System. arXiv 2016, arXiv:1603.02754. [Google Scholar]
- Breiman, L.; Friedman, J.H.; Olshen, R.A.; Stone, C.J. Classification and Regression Trees; Wadsworth & Brooks/Cole Advanced Books & Software: Monterey, CA, USA, 1984. [Google Scholar]
- Zhang, Z. Decision tree modeling using R. Ann. Transl. Med. 2016, 4, 2. [Google Scholar] [CrossRef] [Green Version]
- LeCun, Y.; Bengio, Y.; Hinton, G. Deep learning. Nature 2015, 521, 436–444. [Google Scholar] [CrossRef]
- Hochreiter, S.; Schmidhuber, J. Long Short-term Memory. Neural Comput. 1997, 9, 1735–1780. [Google Scholar] [CrossRef]
- Bengio, Y.; Ducharme, R.; Vincent, P.; Janvin, C. A Neural Probabilistic Language Model. J. Mach. Learn. Res. 2003, 3, 1137–1155. [Google Scholar]
- Thapa, N.; Chaudhari, M.; McManus, S.; Roy, K.; Newman, R.; Saigo, H.; Kc, D. DeepSuccinylSite: A deep learning based approach for protein succinylation site prediction. BMC Bioinform. 2020, 21. [Google Scholar] [CrossRef]
- Kingma, D.P.; Ba, J. Adam: A Method for Stochastic Optimization. arXiv 2014, arXiv:1412.6980. [Google Scholar]
- Zhang, C.; Ma, Y. Ensemble Machine Learning: Methods and Applications; Springer Publishing Company; Incorporated: Berlin, Germany, 2012. [Google Scholar]
- Pelletier, Z.; Abualkibash, M. Evaluating the CIC IDS-2017 Dataset Using Machine Learning Methods and Creating Multiple Predictive Models in the Statistical Computing Language R. Science 2020, 5, 187–191. [Google Scholar]
- Palmes, P.P.; Hayasaka, T.; Usui, S. Mutation-based genetic neural network. IEEE Trans. Neural Netw. 2005, 16, 587–600. [Google Scholar] [CrossRef] [PubMed]
- Goodfellow, I.J.; Pouget-Abadie, J.; Mirza, M.; Xu, B.; Warde-Farley, D.; Ozair, S.; Courville, A.; Bengio, Y. Generative Adversarial Networks. arXiv 2014, arXiv:1406.2661. [Google Scholar]
Figure 1.
Classification and regression tree (CART) for CIDDS-001 external dataset.

Figure 2.
Ensemble model with grid search weighted average and stacked ensemble.

Figure 3.
Feature importance for (A) CIDDS-001 external server; (B) CIDDS-001 internal server; (C) CIDDS-002; (D) CIDDS combined dataset.
Figure 3.
Feature importance for (A) CIDDS-001 external server; (B) CIDDS-001 internal server; (C) CIDDS-002; (D) CIDDS combined dataset.


Table 1.
Attributes description of Coburg intrusion detection dataset (CIDDS)-001 and CIDDS-002 dataset for both internal and external servers. Internet control message protocol (ICMP), Transmission control protocol (TCP), User datagram protocol (UDP).
Table 1.
Attributes description of Coburg intrusion detection dataset (CIDDS)-001 and CIDDS-002 dataset for both internal and external servers. Internet control message protocol (ICMP), Transmission control protocol (TCP), User datagram protocol (UDP).
| Attributes | Description |
|---|---|
| Duration | Duration of the flow |
| Protocol | Transport protocol (ICMP, TCP, or UDP) |
| Source Port | Source port |
| Destination Port | Destination port |
| Packets | Number of transmitted packets |
| Bytes | Number of transmitted bytes |
| Flags | OR concatenation of all TCP flags |
| Class | Class label (external: normal, attacker, victim, suspicious or unknown); (internal: normal, attacker or victim) |
Table 2.
Training and test dataset for both CIDDS-001 and CIDDS-002 dataset after under-sampling.
| Dataset | Train | Test |
|---|---|---|
| CIDDS-001 External | 35,630 | 8905 |
| CIDDS-001 Internal | 3,792,405 | 945,861 |
| CIDDS-002 | 505,476 | 127,185 |
| CIDDS-Combined | 4,480,728 | 1,121,748 |
Table 3.
Parameter description of convolutional neural network (CNN) model with the embedding layer.
Table 3.
Parameter description of convolutional neural network (CNN) model with the embedding layer.
| Parameters | Settings |
|---|---|
| Embedding Output Dimension | 7 |
| Learning Rate | 0.001 |
| Batch Size | 512 |
| Epochs | 20 |
| Dropout | 0.4 |
| Conv2d_1 filter (filter size) | 64 (2 × 2) |
| Conv2d_2 filter (filter size) | 128 (2 × 2) |
| Conv2d_3 filter (filter size) | 256 (2 × 2) |
| MaxPooling2d_1 | 2 × 2 |
| Conv2d_4 filter (filter size) | 128 (2 × 2) |
| MaxPooling2d_2 | 2 × 2 |
| Dense_1 | 768 |
| Dense_2 | 256 |
| Dense_3 | 128 |
| Dense_4 | 64 |
| Output layer activation function | SoftMax |
| Checkpointer | Best validation accuracy |
Table 4.
Parameter description of the long short-term memory (LSTM) model with the embedding layer.
| Parameters | Settings |
|---|---|
| Embedding Output Dimension | 7 |
| Learning Rate | 0.001 |
| Batch Size | 512 |
| Epochs | 20 |
| LSTM layer 1 memory units | 128 |
| LSTM layer 2 memory units | 64 |
| LSTM layer 2 dropout | 0.5 |
| Dense layer 1 | 128 |
| Dropout | 0.4 |
| Dense layer 2 | 64 |
| Dropout | 0.4 |
| Output layer activation function | SoftMax |
| Checkpointer | Best validation accuracy |
Table 5.
Performance metrics for CIDDS 1 external dataset for 10-fold cross-validation with variance and independent test. Bold is to highlight the best performance value.
Table 5.
Performance metrics for CIDDS 1 external dataset for 10-fold cross-validation with variance and independent test. Bold is to highlight the best performance value.
| Models | 10-Fold Cross-Validation | Independent Test | ||
|---|---|---|---|---|
| Mean Accuracy (%) | Execution Time (s) | Accuracy (%) | Training Time (s) | |
| KNN | 94.25 ± 0.32 | 1.76 | 94.22 | 0.08 |
| XGBoost | 98.88 ± 0.14 | 40.25 | 98.88 | 4.41 |
| CART | 99.31 ± 0.15 | 0.65 | 99.38 | 0.067 |
| CNN | 68.10 ± 0.16 | 239.33 | 68.00 | 18.54 |
| LSTM | 98.97 ± 0.08 | 545.81 | 98.91 | 76.24 |
| CNN+Embedding | 99.15 ± 0.08 | 376.19 | 99.11 | 31.90 |
| LSTM+Embedding | 99.18 ± 0.10 | 892.31 | 99.14 | 75.67 |
| Weighted Ensemble | - | - | 99.40 | 3500 + models time |
| Stacked Ensemble | - | - | 98.00 | 48.60 + models time |
Table 6.
Independent test performance metrics of CART for CIDDS 1 external dataset.
| Classes | Precision | Recall | F1-Score | Confusion Matrix |
|---|---|---|---|---|
| Normal | 1.00 | 0.99 | ||
| Suspicious | 0.99 | 0.99 | ||
| Unknown | 0.99 | 1.00 | 0.99 | |
| Attacker | 1.00 | 1.00 | 1.00 | |
| Victim | 0.99 | 1.00 | 1.00 |
Table 7.
Independent test for CIDDS 1 internal and CIDDS 2 dataset. Bold is to highlight the best performance value.
Table 7.
Independent test for CIDDS 1 internal and CIDDS 2 dataset. Bold is to highlight the best performance value.
| Models | CIDDS 1 (Internal) | CIDDS 2 | ||
|---|---|---|---|---|
| Accuracy (%) | Training Time (s) | Accuracy (%) | Training Time (s) | |
| KNN | 99.68 | 4527.41 | 99.33 | 99.36 |
| XGBoost | 99.77 | 395.11 | 99.30 | 34.25 |
| CART | 99.88 | 15.50 | 99.64 | 0.77 |
| CNN+Embedding | 99.85 | 1392.78 | 99.51 | 195.08 |
| LSTM+Embedding | 99.85 | 1909.95 | 99.51 | 255.13 |
Table 8.
Independent test performance metrics of CART for CIDDS 1 internal dataset.
| Classes | Precision | Recall | F1-Score | Confusion Matrix |
|---|---|---|---|---|
| Normal | 1.00 | 1.00 | 1.00 | |
| Attacker | 1.00 | 1.00 | 1.00 | |
| Victim | 1.00 | 1.00 | 1.00 |
Table 9.
Independent test performance metrics of CART for CIDDS 2 dataset.
| Classes | Precision | Recall | F1-Score | Confusion Matrix |
|---|---|---|---|---|
| Normal | 0.99 | 1.00 | 0.99 | |
| Attacker | 1.00 | 0.99 | 1.00 | |
| Victim | 1.00 | 1.00 | 1.00 |
Table 10.
Independent test for the combined dataset of CIDDS 1 internal and CIDDS 2. Bold is to highlight the best performance value.
Table 10.
Independent test for the combined dataset of CIDDS 1 internal and CIDDS 2. Bold is to highlight the best performance value.
| Models | Independent Test | |
|---|---|---|
| Accuracy (%) | Training Time (s) | |
| CART | 99.85 | 23.91 |
| CNN+Embedding | 99.77 | 841.46 |
| LSTM+Embedding | 99.79 | 1172.90 |
Table 11.
Independent test performance metrics of CART for the CIDDS combined dataset.
| Classes | Precision | Recall | F1-Score | Confusion Matrix |
|---|---|---|---|---|
| Normal | 1.00 | 1.00 | 1.00 | |
| Attacker | 1.00 | 1.00 | 1.00 | |
| Victim | 1.00 | 1.00 | 1.00 |
Table 12.
Independent test performance metrics of different models on the CIC-IDS2017 dataset. Bold is to highlight the best performance value.
Table 12.
Independent test performance metrics of different models on the CIC-IDS2017 dataset. Bold is to highlight the best performance value.
| Attack | Accuracy (%) | |||
|---|---|---|---|---|
| Neural Network | Random Forest | CNN+Embedding | CART | |
| Normal Traffic | 99.933 | 99.661 | 99.962 | 99.977 |
| Distributed denial-of-service | 99.998 | 99.857 | 99.953 | 100 |
| PortScan | 99.980 | 99.917 | 99.956 | 99.988 |
| Bot | 99.695 | 97.253 | 98.93 | 99.46 |
© 2020 by the authors. Licensee MDPI, Basel, Switzerland. This article is an open access article distributed under the terms and conditions of the Creative Commons Attribution (CC BY) license (http://creativecommons.org/licenses/by/4.0/).
Share and Cite
MDPI and ACS Style
Thapa, N.; Liu, Z.; KC, D.B.; Gokaraju, B.; Roy, K. Comparison of Machine Learning and Deep Learning Models for Network Intrusion Detection Systems. Future Internet 2020, 12, 167. https://doi.org/10.3390/fi12100167
AMA Style
Thapa N, Liu Z, KC DB, Gokaraju B, Roy K. Comparison of Machine Learning and Deep Learning Models for Network Intrusion Detection Systems. Future Internet. 2020; 12(10):167. https://doi.org/10.3390/fi12100167
Chicago/Turabian StyleThapa, Niraj, Zhipeng Liu, Dukka B. KC, Balakrishna Gokaraju, and Kaushik Roy. 2020. "Comparison of Machine Learning and Deep Learning Models for Network Intrusion Detection Systems" Future Internet 12, no. 10: 167. https://doi.org/10.3390/fi12100167
Note that from the first issue of 2016, this journal uses article numbers instead of page numbers. See further details here.