Strategies of Success for Social Networks: Mermaids and Temporal Evolution

1
European Institute for Science, Media and Democracy, 1040 Brussels, Belgium
2
Department of Mathematics, University of Padua, 35121 Padua, Italy
*
Author to whom correspondence should be addressed.
Future Internet 2020, 12(2), 25; https://doi.org/10.3390/fi12020025
Submission received: 20 December 2019
/
Revised: 31 January 2020
/
Accepted: 3 February 2020
/
Published: 4 February 2020
(This article belongs to the Section Techno-Social Smart Systems)
Abstract
:The main goal of this article is to investigate techniques that can quickly lead to successful social systems by boosting network connectivity. This is especially useful when starting new online communities where the aim is to increase the system utilization as much as possible. This aspect is very important nowadays, given the existence of many online social networks available on the web, and the relatively high level of competition. In other words, attracting users’ attention is becoming a major concern, and time is an essential factor when investing money and resources into online social systems. Our study describes an effective technique that deals with this issue by introducing the notion of mermaids, special attractors that alter the normal evolutive behavior of a social system. We analyze how mermaids can boost social networks, and then provide estimations of fundamental parameters that business strategists can take into account in order to obtain successful systems within a constrained budget.
1. Introduction
Social networks are nowadays among the most important and successful online systems. Since 2010, when Facebook became the most visited site in the US beating all other players including Google, we have witnessed an enormous growth of the social world, with many social systems arising, and also with many other online systems adding social functionalities. This huge growth has also correspondingly brought lot of competition, making it very hard to build new successful social networks. It is therefore of crucial importance to study how social systems can blossom, maximizing their chances of success.
In this study, we analyze online social networks viewing them as complex systems: Whereas in a previous paper (cf. [1]) we studied complex systems along their spatial informational axes, this paper instead tackles the other informative axis, time. We focus on the temporal dynamics of social networks, so keeping fixed the spatial axes and investigating how networks evolve as time passes by. In particular, the analysis presented focus on the evolution of online social systems, and corresponding suitable strategies that allow for their successful development. However, we think that the models are general enough that they can easily fit other complex networks as well.
Previous studies ([2,3]) suggested that online interaction is driven by the same needs as face-to-face interaction, and should not be regarded as a separate arena but as an integrated part of modern social life (cf. [3]). Thus, communicative actions taken by members of online communities can be expected to share many features with the web of human acquaintances and romances in the offline social world. Indeed, for many people in contemporary western societies, interaction on the Internet is as real as any other interaction (e.g., see [4]). For these reasons, the formation, the dynamics, and the general evolution over time of online the social networks can provide important information for enhancing our understanding of social networks. This has been confirmed by several works (e.g., [2,5,6]) that shed new light on the hidden rules behind social mechanism like creation, maintenance, dissolution, and reconstitution of interpersonal ties.
Researchers that study these communities heavily use digital traces that virtual users leave while using social networks. Even though these datasets are usually owned by private companies, we are increasingly seeing new trends toward openness of data, for example by letting people access sampled subsets of the entire dataset (Twitter for example allows us to get a sample of roughly 1–2% of all users’ tweets, friendship relations, etc.) or by releasing anonymized data for mining or edge prediction challenges. Firstly, this is beneficial for the scientific community that is able to work with this social network in this new challenging area and secondly to propose research that is not limited by the number of persons involved in the experiments, as it is the case for many offline social studies.
The most studied social mechanisms include random wiring, triadic closure, and preferential attachment (the latter is usually used to describe situations other than the evolution of social networks). The first model assumes that the social networks evolve without being constrained by exogenous or endogenous factors like geographical proximity, socio-demographics, belonging to topic-specific sub communities (homophily), technological differences, etc. Every couple of people are linked in a random fashion. The second one, also known as the friend of a friend’s rule (or triadic closure), states that two friends of a person are more likely to know each other compared to two randomly chosen persons. In the latter model, new nodes establish links with existing nodes proportional to their current connectivity. Because of that, the older nodes will have a higher degree compared to the younger.
The main goal of this study regarding the temporal dimension of complex networks is to identify strategies, specifically in online social networks, that can drive network evolution. This is done by introducing special nodes (the so-called mermaids) acting as “super-attractors” that, when added into the social system, trigger a boost in network connectivity, making for a richer and more interactive community. We study the use of this novel tool by also considering its use within practical scenarios: Using a financial technology setting, we look for the best business strategies that can be used when operating within a certain set budget, predicting the best configurations in term of number of mermaids, attractiveness (i.e., the ability to create new links), and length of time these nodes are effective.
In the following sections we first touch on some related works, and then describe more formally the characteristics of the evolution models proposed, and in particular the network growth with mermaids. Next, we report on the encouraging results obtained by simulating two online social networks (VirtualTourist.com and Communities.com), show the benefit that special mermaid nodes can bring to enhance growth and, last but not least, identify the best usage strategies.
2. Related Works
The dynamics of social networks have been extensively studied in a wide variety of contexts. For instance, [7] analyzed the properties of the Flick and Yahoo! social networks, [8] studied scientist collaborations and mobile phone users, [9] studied meme propagation in Facebook, [10] studied the relationship between offline and online social interactions, and [11] studied mathematical posts in Stack Exchange.
All these studies have investigated both the properties of the specific networks, and also tuned various models of network growths (see [12,13]).
In this paper we deal instead with a different aspect of social network evolution: We do not try to find new models of temporal evolution that can reconstruct existing networks, but instead focus on the novel problem of finding strategies for faster network evolution. We tackle the practical issue of generating successful social systems by introducing the concept of mermaids, that is to say, special attractors that accelerate the efficiency of the system. Mermaids are actors introduced on top of a social network that are under the control of the network owner and act under specific rules. They can be impersonated by using persons specifically hired for that purpose, although (according to the nature of the social network) they might be also impersonated by using specially developed online social bots ([14]), or even using hybrid techniques like bots supervised by humans ([15]). Note existing social bots have different purposes than mermaids, namely to increase the number of followers and to spread information (and sometimes also misinformation, cf. [16]).
We analyze the use of mermaids within the business perspective of financial technology (see for instance [17,18,19,20]). This means that we consider the practical scenario of having a predefined budget constraint, and then proceed to study what the best strategies are in order to maximize the successful effects (in other words, to minimize the cost/benefit ratio).
3. Network Growth Models
In this section, we describe the details of the network growth models we investigated in this paper. We start from an empty network and, by repeatedly apply rules at local level, make the network evolve and (eventually) reach an equilibrium state.
We already know that many real-world systems such as power grids, communication networks, biochemical interaction, as well as social networks can be modeled as graphs (cf. [21]). Using standard graph theory notation, we will consider online social networks as unweighted undirected graphs , where V are the vertices and E the edges. Nodes represent users while edges mutual friendship relations between them. The evolution of a graph is conceptually represented by a series of graphs , so that is the graph at step i. Since represent different snapshots of the same graph, we have .
Note that it remains an open problem to have a fully detailed history of a social network: This is due to many reasons such as, for example, the unfeasibility of data gathering, or restrictions when crawling a web site. Indeed, if we want to consider big social network datasets with millions of users, the process of retrieving all the actions users perform could be a very difficult task caused by the large amount of dataset modification occurring at the same time (we obviously assume not to have direct access to the website dataset).
These limitations prompted us to take another path to reach our goal. Instead of searching and waiting for the gold datasets that contains the complete dynamics of a social systems, we propose to simulate it by using some basic and advanced growth rules that could be potentially applied to all kind of complex systems. In this framework, the assumptions that we will make is to have a snapshot of a complex system in an equilibrium state and that the growth dynamics is not free but it is constrained to the dataset snapshot that we have. This means that (unless stated otherwise) during simulations all the edges available to be picked up are those present in the referring snapshot graph; any other edge is not allowed in the simulation process. This way, the final graph will be always equal to the referring network.
In this phase of our research, we will not consider links or nodes removal, therefore . This choice is motivated by the observation that in online social networks there are fewer removals than there are users and friendships relations (see for instance [22]).
Simple network dynamics simulations need at least two parameters. The first is the definition of the order with which edges will be inserted into the network (the order will influence the overall connection pattern) and the second one defines how many edges will be added at each step. Network connectivity evolves according to the following three rules:
- Random order. Every edge will have the same probability to be selected during the growth process. This rule, as many studies showed, is far from real. However, it is a good candidate for a baseline.
- Aristocratic order. This rule is based on the preferential attachment process (cf. [23,24]) where older nodes have a higher probability of attracting new links. The process selects edges by choosing a source node, according to the degree, and a target node, randomly chosen on the available neighbors’ list of nodes. By randomly choosing target nodes, low degree nodes can acquire new links as well. More formally, the probability of selecting the source node is the following:where is a scale factor that increase or decrease the influence of degree on the final probability value, is the node degree.
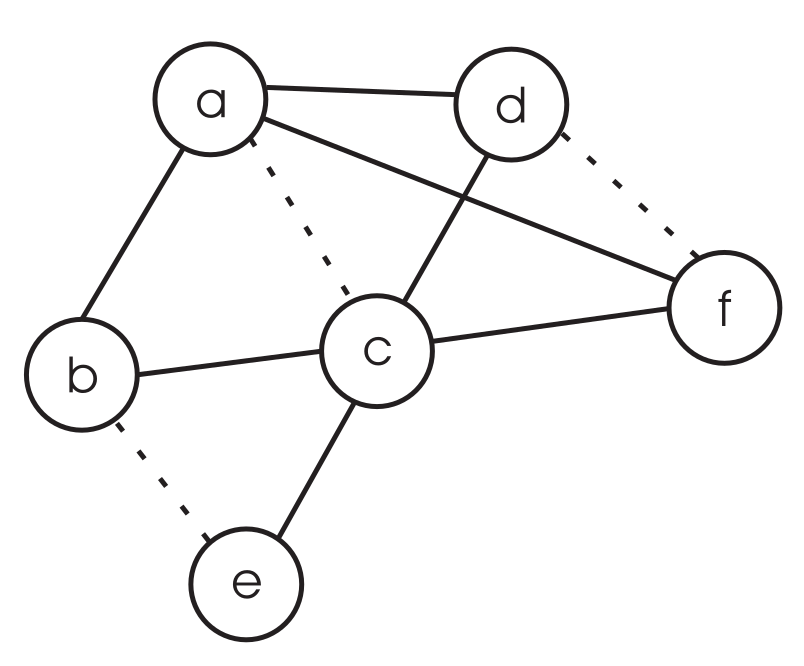
- Social order. This rule is inspired by the local clustering of small world networks (also known as triadic closure), and in particular from the observation that two friends of a person are likely to know each other (see [25]). This rule considers it more likely that the edges that close triangles will be selected. Edges that make more than one triadic closure are inserted sooner into the network than others. More formally, the probability of edge of being selected is the following:where is the number of times edge closes triangles (see for example Figure 1). As for the previous rule, tunes the effect of triadic closures on a final probability value.
Evolutionary Models: Serial and Parallel
Although the previous three rules are sufficient to define the order with which nodes will be connected, it is also necessary to define how many edges are inserted into the network at every time step. One trivial solution is the serial (also called inertial) setting: We add an edge every time slot, so that in a network composed by m edges the simulation will last m simulated time units. This represents the baseline in our experiments (see Section 5.2) and it is crucial for reporting which rules achieve best when the system behavior will be unfolded.
However, since the previous dynamics might be realistic only in specific situations (for instance in the initial part of a network evolution), we also consider simulations where more than one edge are allowed to be inserted at the same time. We assumed that the number of edges added changes as a function of network efficiency (cf. [26]). This model, that we call parallel (alternatively called accelerated), is described in Algorithm 1.
The algorithm accepts as input: (i) a graph and (ii) a rule . It starts from an empty graph that has the same nodes as G and no edges. The algorithm deals with parallel edges creation by selecting at each time a subset F such that to be added to . Since the edges can be added into the network only once, E will be updated adequately with the remaining edges. The number of connections selected varies according to the following formula:
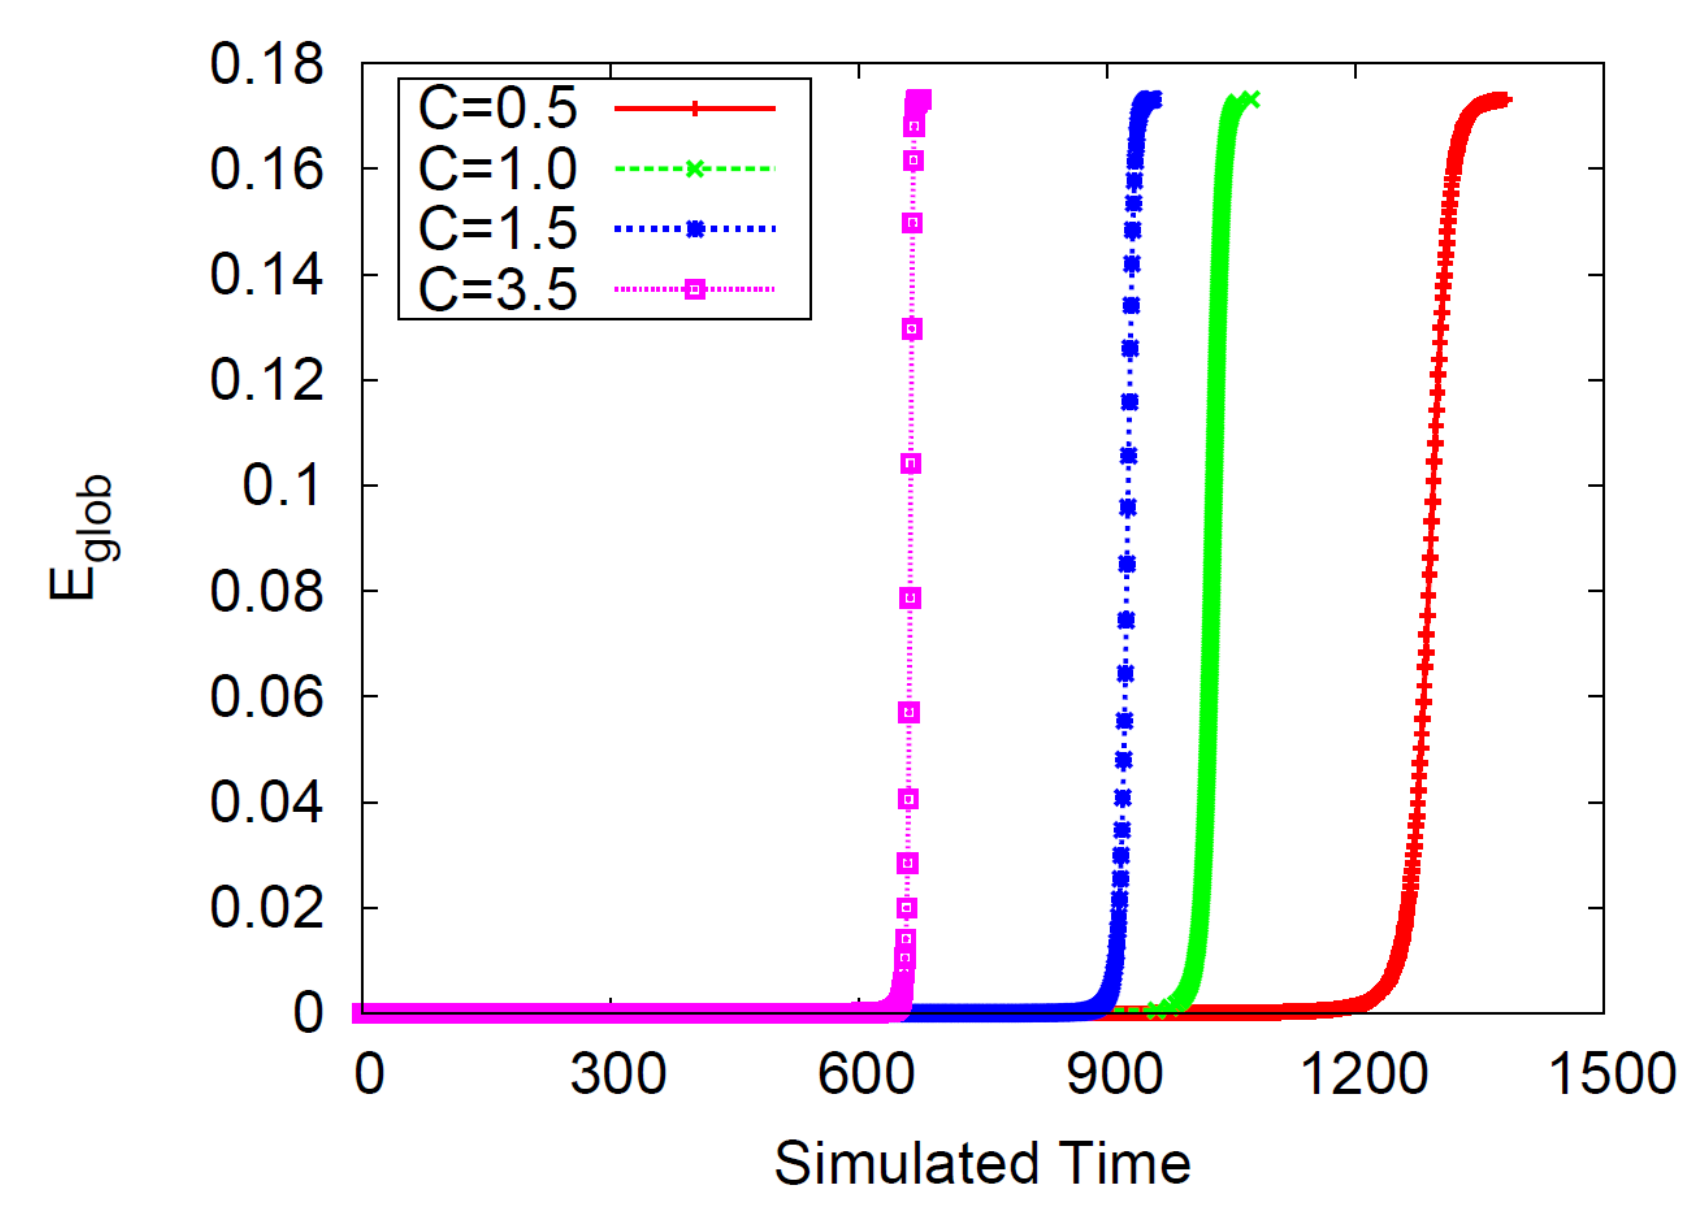
where is the ideal network in which all edges exist , is the number of edges that has to be inserted into the network, C is a constant factor and is the global efficiency of the network G at step . At the beginning, few nodes will be inserted because of low efficiency and, as soon as the network grows and many people are involved in the network, more edges will be chosen and added concurrently. The “” factor at the beginning of Equation (1) allows the ability to pick at least one edge at each step, which is fundamental to allow a minimal growth in the initial phase. The C factor is used to tune the effect of efficiency in the number of chosen edges. We studied the effect of C on the network growth and we found out that it only expands () or shrinks () the time needed to get target efficiency, without considerably altering the curve behavior (see Figure 2). For this reason, we decided to use in all our experiments and simulations.
| Algorithm 1: Parallel networks simulation |
 |
4. Mermaids
The aim of this section is to introduce the concept of a mermaid—a way to successfully drive network evolution and boost connectivity. The idea is to support the natural evolution of a network by introducing special nodes (the mermaids) that act as “helpers”, and that are used to quicken the process of network growth. The owner of a social system that wants to quickly reach a successful status can act with this kind of artificial boosters in order to modify the natural evolution process of the network and making it grow faster. This is especially important in today’s online world, where the importance of social systems is well-known and thus competition is fierce.
Mermaids are therefore special members of a social network that are in fact hired by the owners so to get speed-up and make the network successful. As said in Section 2, mermaids can operationally correspond to real people that are accordingly hired, or in some cases even to online bots, although the success of this second option depends on the features of the social system itself: For instance, if the social system is based on sustained personal interactions like chats or personalized images and videos, bots might not be sophisticated enough to sustain such complexity (at least in the present days). Whether human or artificial, every mermaid pursues the same goal: to boost the network growth of the system, so as to rapidly get a successful social environment.
We are therefore interested in practical strategies that can guide proper use of mermaids. In the following, we define the rules of operations defining the basic concept of mermaid, and also consider their use in terms of financial technology, that is to say by also considering the impact that mermaids have with respect to limited financial resources. In order to do so, we define the cost of use for mermaids, in order to then explore what the best strategy that fits a specific budget situation is.
4.1. Handling Mermaids
We define mermaids as external nodes (in the sense that they are new to the “normal” network of users) whose goal, as previously said, is to interact with normal users and stimulate overall network utilization (i.e., people engagement in online social networks) and increase efficiency. Informally, we can therefore distinguish between the “normal” social network (composed by legitimate users), and the extra boosting components that can be added to the network, taking the form of mermaid actors.
Formally, we denote the mermaids nodes as , and so the new combined graph (normal graph enriched with mermaids) now becomes , the total number of nodes and the number of edges (see for instance Figure 3).
Mermaids acts as special attractors to normal members of the network, and so we parameterize them by considering their level of attractiveness (how likely normal users are to socially link with a mermaid): the formal definition is provided later in this subsection. Operationally, this parameter can correspond for instance to physical beauty, and/or ability of interaction, any quality and skill that makes a mermaid a special node of attraction in the specific social system.
Last but not least, we are interested in the temporal impact that mermaids have on the system, and so we also have to consider the time range in which they are operative.
Summing up, we can define a mermaids’ configuration as a tuple formed by the following three parameters:
- m specifies the number of mermaids,
- a is the mermaids’ ability of attracting new edges (i.e., to generate interest in the community),
- d is the operational timespan of mermaids.
As mentioned before, in order to develop strategy guidelines for mermaids we are interested in optimizing the cost/benefit ratio, and therefore see what the best course of action is when dealing with a specific budget. Therefore, we define a cost of a configuration, , proportional to the previous parameters, that is:
In the following, for the sake of conciseness, we will simply write to indicate the cost when the underlying configuration is clear from the context.
Combinations of these parameters lead to different costs and ideally to different growth behaviors. Another important goal of this paper is to understand how the overall network evolution changes as a function of and in particular to test whether increasing the investment on the mermaids (that is, ) yields a proportional benefit to the global efficiency. Furthermore, we study which configuration parameters attain the best performance under a specific cost setting (see Section 5.2).
In this context, for the remainder of the paper, we make the following assumptions:
- during the network evolution, edges between mermaids are not allowed,
- mermaids are active at the beginning of simulation only, i.e., from time to .
The first assumption is just a separation rule that enables us to better factor the impact of mermaids on the social network (links among mermaids are all artificial, and as such they could improve the network statistics without actually being significant from an absolute point of view). In other words, we are interested in the connections among legitimate users, not those among the mermaids.
The second assumption instead pertains to the focus of this study: We focus on using the mermaid boosters in the initial (onset) phase of a social network, given the initial growth phase is the most critical. Further studies might consider relaxing this constraint and studying the effect of the activation in different time periods, so to act as boosters not only in the initial phase but also as an ongoing way to boost the network performances.
Mermaids are artificial components added to the social network and, as such, they are under complete control by the owner of the network: we are free to decide what kind of social rules they use to connect with the rest of the normal network. Still, mermaids should not behave in strange ways, so not to be suspicious to the normal users. So, we make them behave as normal users by making them use the classic social growth rules described in Section 3: the rules by which edges will be added are identical to those for normal users, namely random, aristocratic, and social (see previous section). Given that these rules are only an approximation of normal user behavior, in the following we also investigate all the mixed cases, so the combinations of having a certain social rule in action for normal users, and another social rule for the mermaids. This way we can investigate whether there are differences in setting a predefined social rule for mermaids, while possibly having another rule better approximating the behavior of the other users.
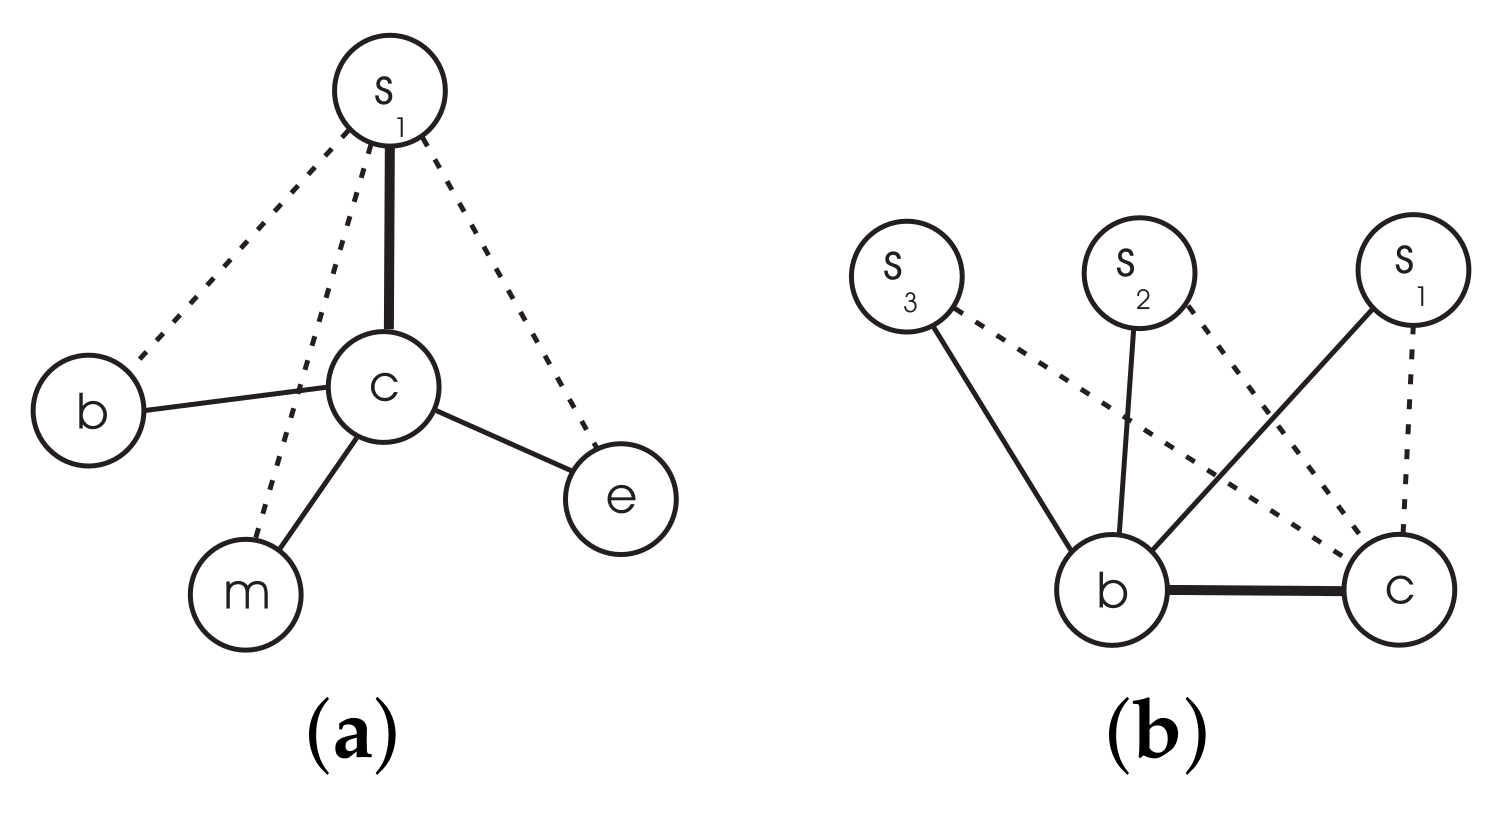
In general, mermaids’ dynamics evolve independently of users’ dynamics. However, an exception still exists. In fact, a new link in users’ subnetworks could trigger a modification in the likelihood of mermaids’ edges of being selected, specifically with the social rule. Figure 4 shows some examples. In particular, Figure 4b shows what happens when a new link in users’ network is added: edges ,, will be more likely to be selected in the following steps because of triadic closure rule.
Algorithm 2 describes how simulations are made, by combining the agent-based approach of mermaids with the normal evolution model of the network. It uses two sets E and from which the edges will be selected, two rules and (that specify which edge to choose in the users’ and mermaids’ subnetworks), and a configuration . The algorithm has a main loop (line 4) in which two distinct phases are executed and each one manages users’ and mermaids’ selection of edges (line 5 and 9) according to and respectively.
The number of edges selected in the first process (line 5) is calculated similarly as in Algorithm 1 (using Equation (1)) but for the input graph that now becomes instead of . In the second phase (line 9), the number of selected edges is set to a constant value and equal to . This means that the total number of links between mermaids and users can be estimated in advance as the following: (this number will be reached at time and will not change afterwards). The effect of mermaids will be limited to the first d iterations, after that the mermaids will be deactivated (line 8) and the system will evolve independently by itself.
| Algorithm 2: Accelerated networks simulation with mermaids |
 |
The attractiveness parameter a quantifies how much a mermaid is able to promote the utilization (i.e., edges creation) of the online community. It is defined as follows:
where is a weight function. In order to meet the requirement that mermaids have a better ability to establish new friendships, we assigned a doubled weight to them compared to normal nodes (see Section 5.2).
4.2. Managing Cost
From a business point of view, every system has to deal with costs. In our context, the cost can be split into two parts. The first, that accounts for mermaids’ cost (think of mermaids as handled by employees), and the second one that accounts for web site cost. More formally, the following formula gives an estimation of the managing cost of setting up a network until it reaches a steady state:
where is the cost due by using a particular configuration (as defined in Equation (2)), is the cost by time units of the web site and is the minimum timespan needed by the network to evolve toward a connection pattern with a specific global efficiency (given a configuration which costs ).
We are now interested in knowing the points in which the function f has minima. For this reason, by calculating the first derivative of Equation (4) and solve , we find that
and so the cost is minimum when:
We will return to this topic in Section 5.2, where we test how f’s minimal points change versus hypothetical values of .
5. Experimental Results
In this section, we report our experimental analysis. The simulation algorithms were implemented in Python and C programming languages. All the experiments were conducted on three Linux machines equipped with an i5 Intel processor and 8Gb of RAM.
5.1. Datasets
We conducted experiments on two real world datasets: the Communities and VirtualTourist online social networks. Communities (www.communities.com), CM for short, is considered to be the first social network in the world, as it started in 1996. It is similar to many other social networks like Facebook or LinkedIn where users meet new people, share photos, and chat with friends. Communities is managed by users themselves that create customized web pages in which they express passions, loves, and friendships. Every user can keep track of friends in a friends list, can use guestbooks, blogs, or use photo galleries. In Communities, users can establish virtual contacts, but unlike real world, these ties could be easily maintained over distance. This produces a network of virtual social ties that connects the entire world. Communities lets members create and join communities in order to easily find groups of people sharing similar interests. Joining a community means being able to chat with other members in the community forums and chat rooms.User’s locations in Communities are widely distributed and span over 185 nations.
VirtualTourist (www.virtualtourist.com), VT for short, is an online travel-oriented community started in 1998, in which users share their own travel experiences, suggest and review hotels, write comments and opinions on forums, find places to visit, share photos and videos, and is considered to be the ancestor of TripAdvisor (with more emphasis on social networking). It is a community of people that love traveling around the world. In VirtualTourist, users can meet new people and create a network of social virtual friendships as well.
Both analyzed networks were collected by crawling web pages of the sites as time of 2005 and 2006 (cf. [27,28]). Publicly available profiles and friendships were parsed and anonymized. At that time, there were approximately 700 thousand users in VT, 650 of which are singletons ( of the total), i.e., users that have joined the service but have never made a connection with another user. Conversely, 57 thousand users have at least one friend (approximately of the total). There were more than 200 thousand social ties at that time. The VT network has a giant component, a group of users who are pair-wisely connected through paths in the social network, formed by 53034 nodes ( of the total nodes with degree greater than zero). The rest of the network is formed by 2077 small (less than 14 nodes each) isolated communities (also called middle region [29]) that are disconnected from the giant component.
In Communities, there were about 30 thousand registered users, 18 of which are singletons ( of the total) and 12 have more than one friend (about ). There exists approximately 60 thousand friendship links. Apart from singletons, the vast majority of the nodes (about 12131, of the total) of the community belongs to the giant component, whereas the rest to the middle region were small communities having less than 8 nodes each.
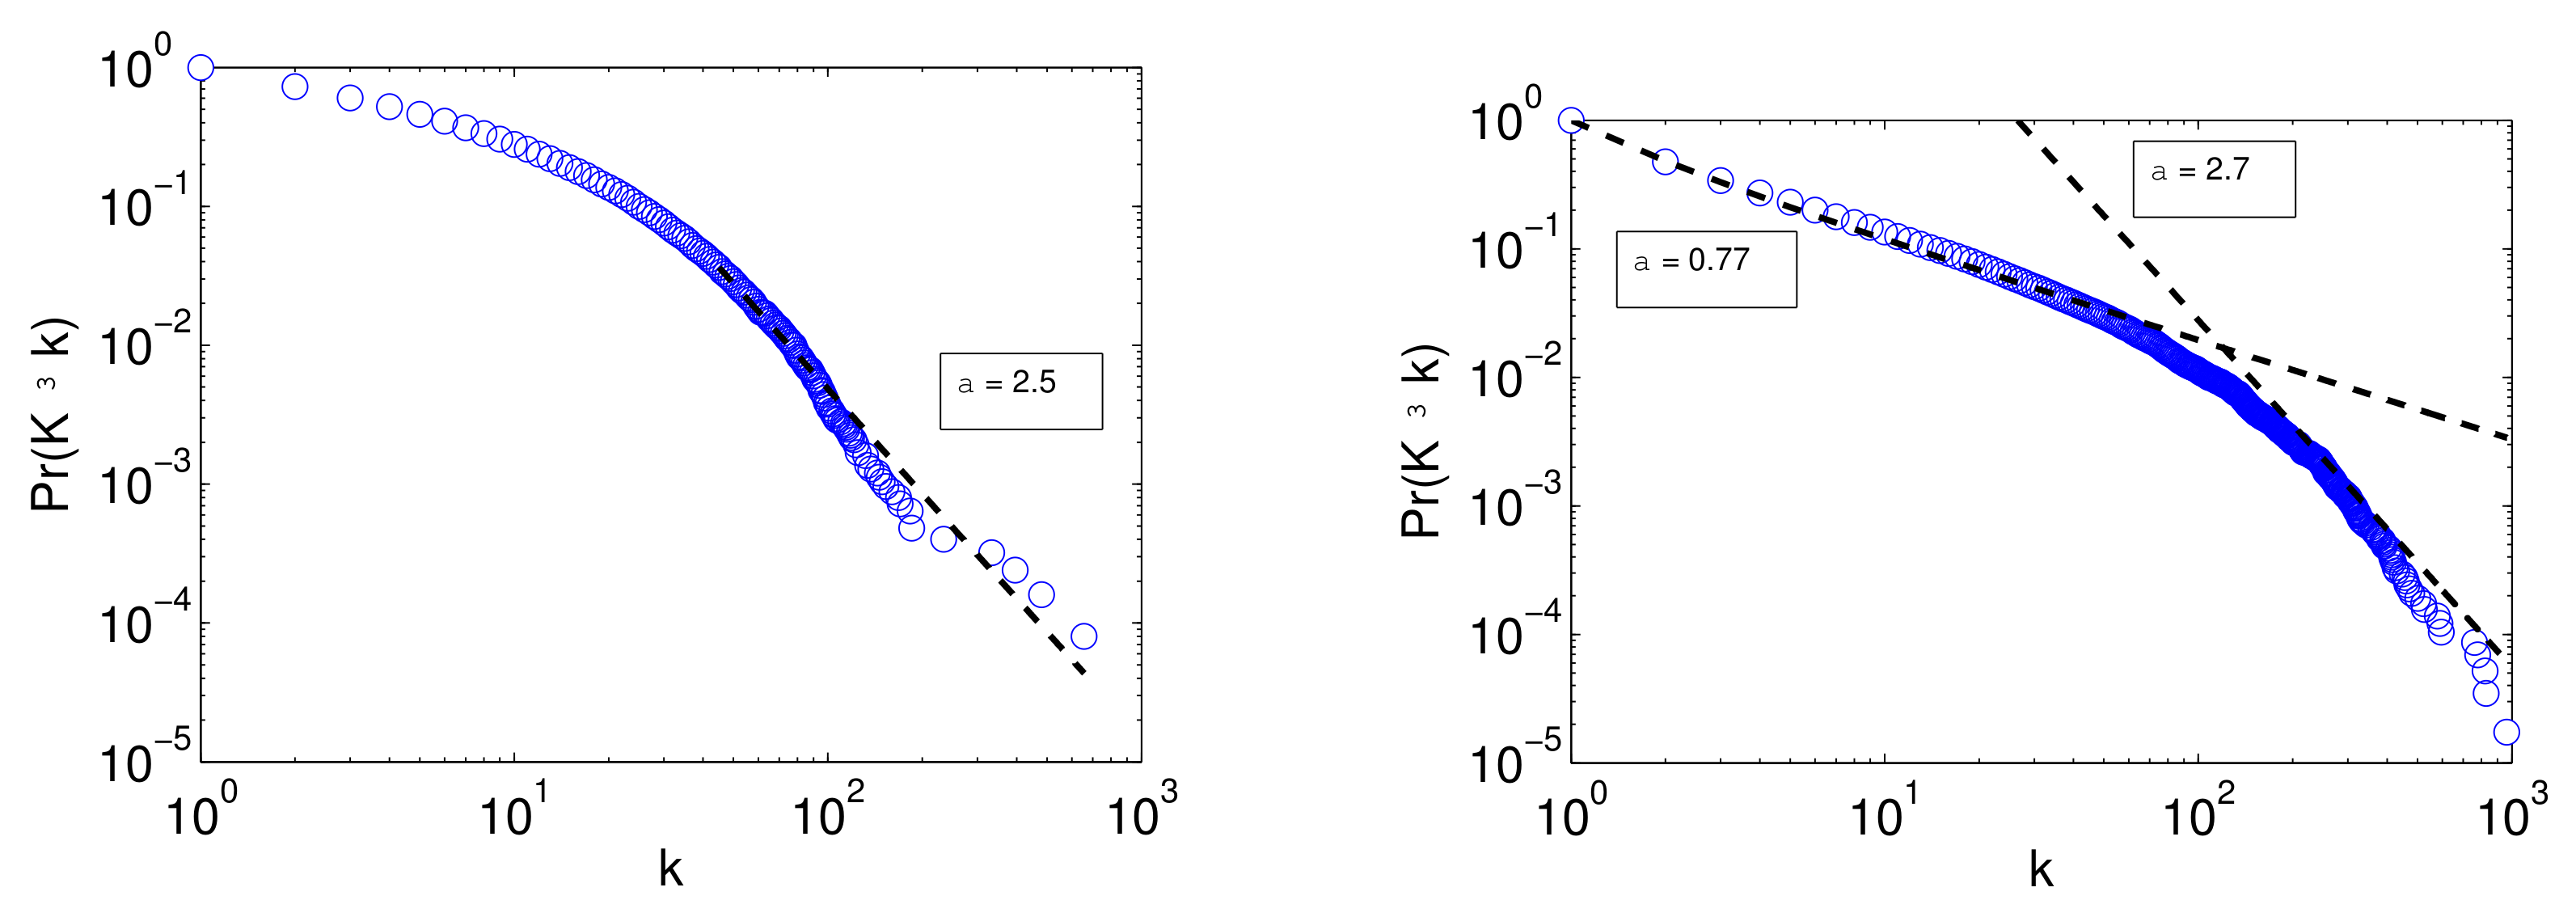
Since social ties are bidirectional in both systems, we mathematically treat those graphs as undirected. Table 1 summarizes the most important network statistical features. It also contains the metrics calculated on randomized versions of the same graphs. We note that both networks have a small average shortest path L (less than 5 hops between two randomly chosen nodes) and high clustering coefficient C (compared to the randomized versions, fourth, and fifth columns). High and has been detected too. These facts are evidence for classifying them as small world ([28]). Both networks are formed by many connected clusters, so average path length and clustering coefficient are calculated on the largest connected component (LLC), whereas global and local efficiency on the entire network (the latter two quantities work correctly even for disconnected networks, see [1,30]). Indeed, since cumulative degree distributions have tails that decay as a power law with exponents equal to and (see Figure 5) and maximum degree is higher compared to the average , they could be classified as scale-free networks.
The plots in Figure 6 and the assortativity values in Table 1 suggest that both networks are disassortative (Pearson correlation equal to and respectively). This means that, on average, users with many connections tend to connect to users with few friends (see classification in [31]). Many other studies found the same correlation pattern in online social networks, like for instance in the Youtube ([32]), pussokram ([2]) or Cyworld ([33]) networks. Being elite in online social networks simply means to have many connections and is just a matter of clicks (cf. [34]). However, this assortative pattern is the opposite compared to the real world where establishing and maintaining friendships require time and effort and where many other factors might influence the likelihood of being a friend of a person, such as cultural, economic, and geographical circumstances.
5.2. Results
We now evaluate our models by simulating the network evolution with respect to suitable configurations . We selected the global efficiency as the main statistical feature that has been tracked during the experiments. A configuration is defined as a tuple composed by (i) the number of mermaids m used, (ii) the mermaids’ attractiveness a, and (iii) the length of time d in which the mermaids are active (starting from ). We decided to employ 6 or 12 mermaids and to use those special nodes for the firsts 10 or 20 initial time units. To estimate the attractiveness as defined in Equation (3), we use a weight function that is for and or 20 for , in order that these special nodes acquire more links compared to normal nodes. Table 2 present the estimated attractiveness values of normal users and mermaids , together with the variables used to calculate them. With the previous parameters, we created a set of 8 configurations and 4 cost levels (listed in Table 3).
The possible configurations that were planned do not exhaust all the axes along with our simulations are based. In fact, two more dimensions are needed: the rule that selects edges between normal nodes and the rule that select edges between mermaids and users (remember from Section 4 we consider the more general case where the preset social rule of mermaids can also differ from the social rule that better approximates real user behavior). Since these dynamics are independent but the names of the rules are still the same, we dub the mermaids’ rules as Broadcast, Word of Mouth, and Preferential models in order to uniquely distinguish them from the users’ rules.
As said earlier in Section 3, the simulations considered in this paper (unless stated otherwise) are constrained in the sense that every edge that is added among users must exist in the original network. We decided to use this approach because other techniques like, for instance, stochastic simulations (Construct and Link Probability Model) are not well suited to describe big social systems (incurring in computational issues) and because they usually require setting a high number of initial parameters (incurring in a highly nontrivial initial settings to be able to simulate an existing original network).
We start by looking at results obtained for serial analysis (see Section 3.1) so as to understand the effect each rule has in the unfolded network evolution and, subsequently, we consider the more realistic situation in which more than one edge can be added at the same time (called equivalently accelerated parallel or simultaneous). Then, in order to evaluate the effectiveness of our methods to detect new instincts in social systems and to verify whether they are valuable as incentive for network utilization, we test (i) how faster global efficiency will increase when using mermaids and (ii) whether the growth curve will be altered by using these special nodes.
We are interested to uncover all these aspects of online virtual communities by trying to answer the following questions:
- Q0
- Does each rule behave equally in the inertial (serial) context? What happens in the accelerated context?
- Q1
- How do the same cost configurations influence efficiency?
- Q2
- How do parameter variations influence global efficiency?
- Q3
- How much do we have to invest in special nodes?
Before delving into the details of the answers for the previous questions, we can delineate a general discussion about the results for all the growth patterns. In fact, regardless of the configuration adopted, we found that the S-shaped curve characterizes all the growth pattern of . It is well known that the S-shaped curve is at the heart of many diffusion processes and is characteristic of a chain reaction, in which the number of people who adopt a new behavior follows a logistic-like function (cf. [35]): a slow growth in the initial stage, a rapid growth for critical mass time, and a rapid flattening of the curve beyond this point. Because of that, our models and rules could be considered as good candidates for estimating the real network evolution.
Q0: Unfolded serial setting. Figure 7 shows the unfolded behavior of the systems for the three proposed rules, namely: random, aristocratic, and social. Each curve represents global efficiency of the temporal networks that have been created by adding one edge at time. The plots allow for interesting observations. First, we note that until one sixth of the complete spectrum, each rule produces an indistinguishable behavior probably due to weak network structure. After that point, the cumulative effect of drawing edges in different ways starts to appear. The behavior detected is super-linear for the aristocratic rule meaning that preferential attachment is an effective way to boost network efficiency in networks. Conversely, with the social rule we observe a weak sub-linear increase ideally meaning that triadic closure is not the only key ingredient for network evolution. Linear increase is then detected for random rule. To avoid the bias of randomness, we made 100 simulations and then the averaged results are considered. Standard deviations are small and, therefore, are not plotted in favor of clearer plots.
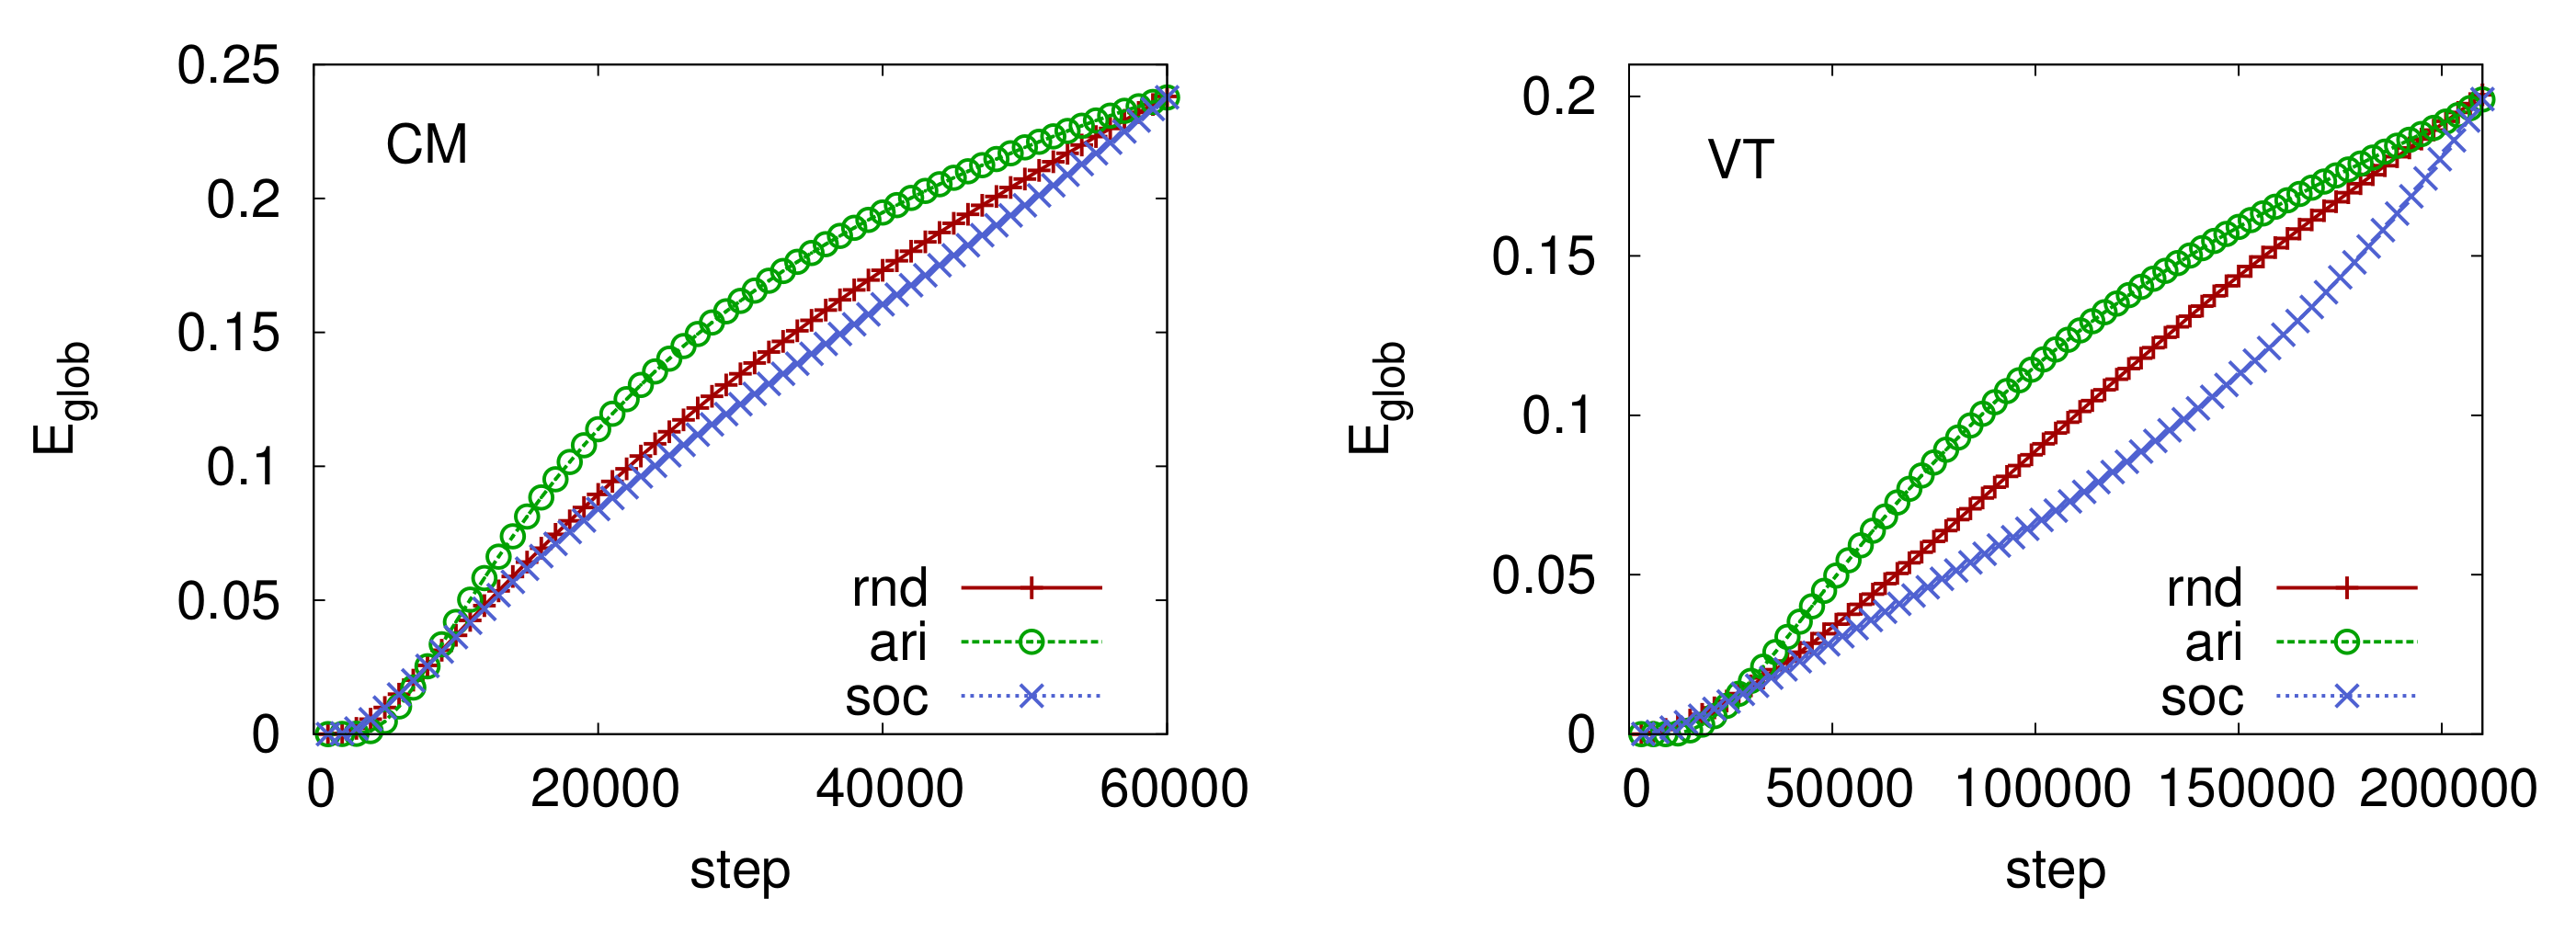
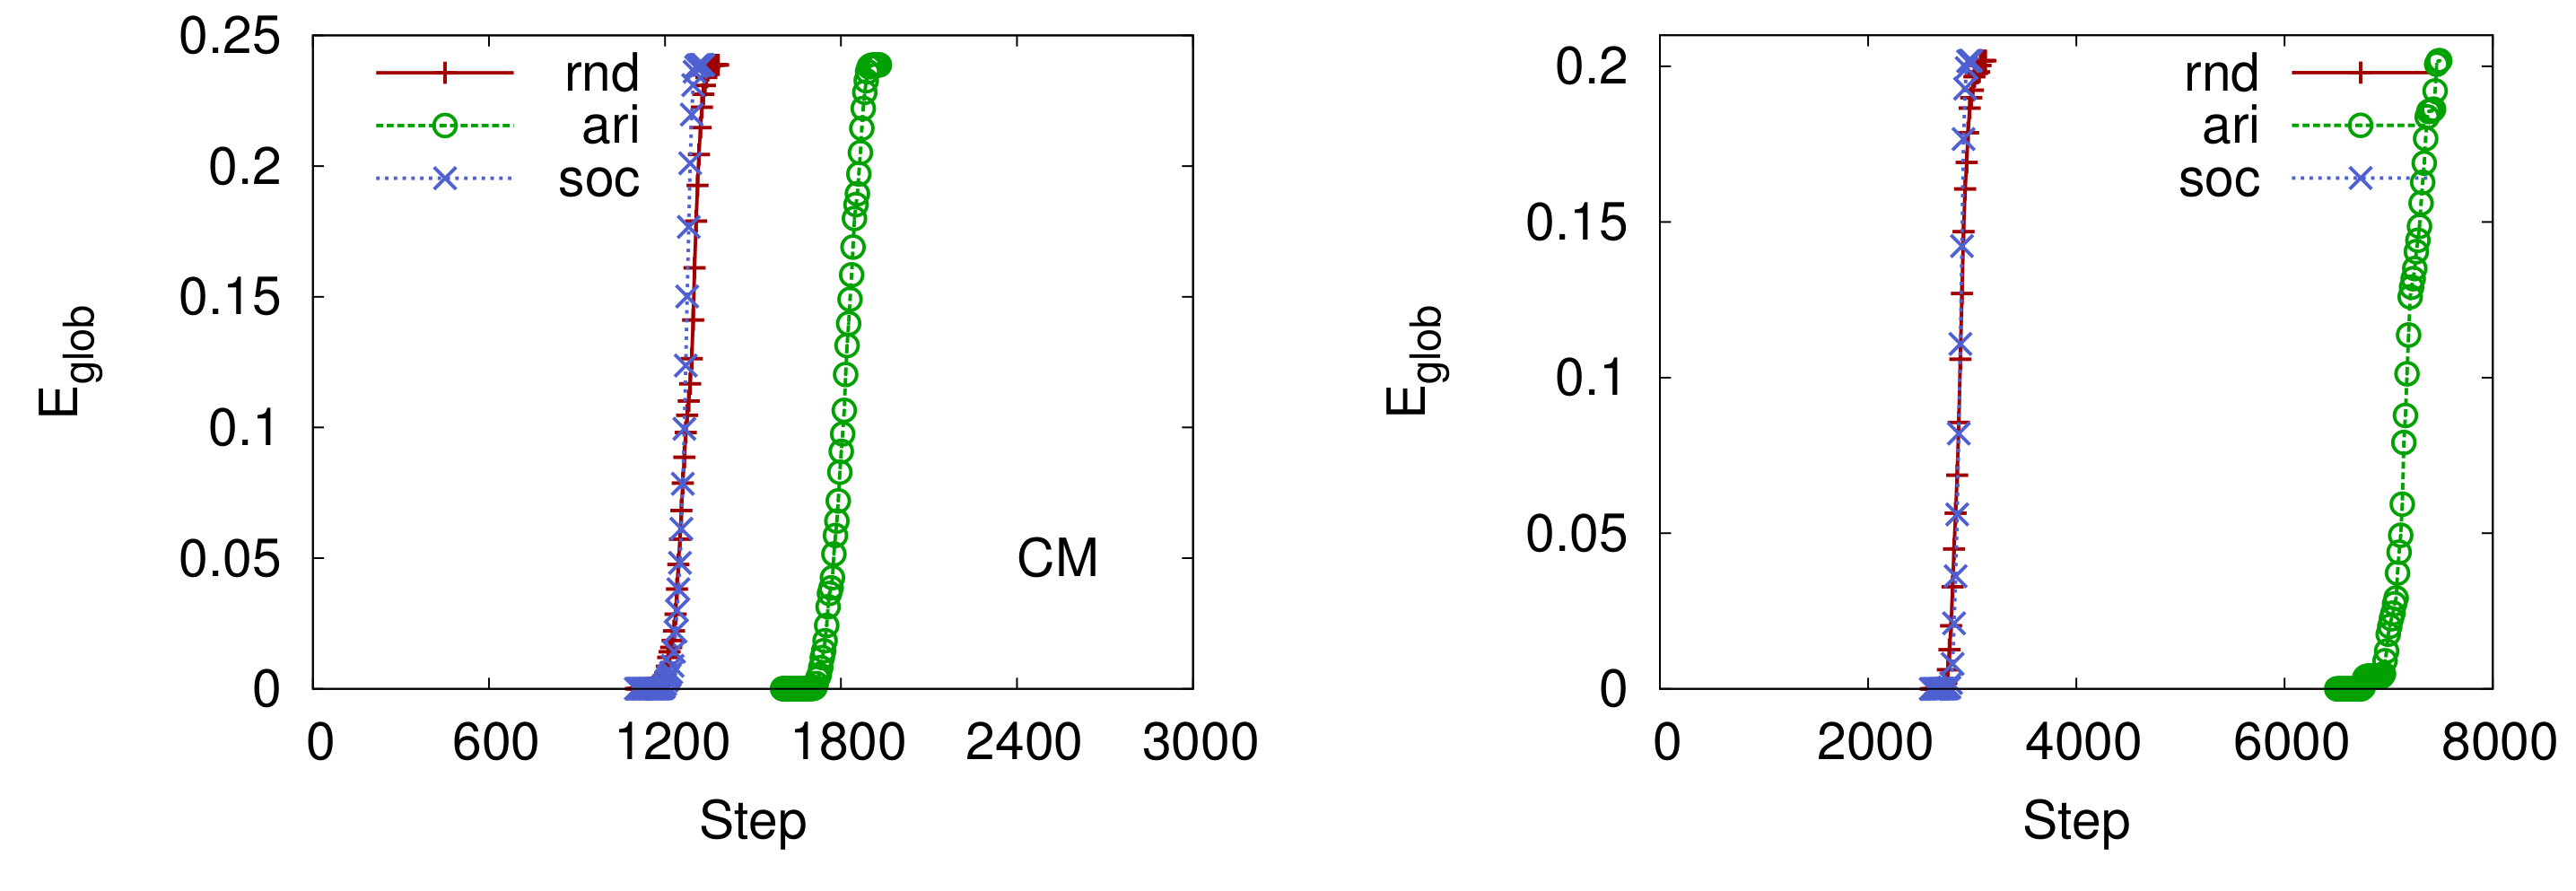
Even though preferential attachment seems to perform better than other rules in serial evolution, this does not necessarily hold in other settings like accelerated (parallel) simulations. In fact, as Figure 8 shows, the random and social rules turn out to be and (CM and VT) faster in reaching the maximum compared to the preferential attachment (see Table 4 that contains the minimum time needed () to get the original global efficiency). This is probably due to a combined effect of topological structure and rule applied. In fact, online social networks, like social networks in general (cf. [25]), are formed by weak ties that are responsible for keeping subcommunities together and preserving the global reachability among nodes. According to preferential attachment, nodes with high degree are more likely to acquire new links. However, weak ties are not necessarily connected to hubs, meaning that they will not be selected at the beginning, maintaining low the global efficiency.
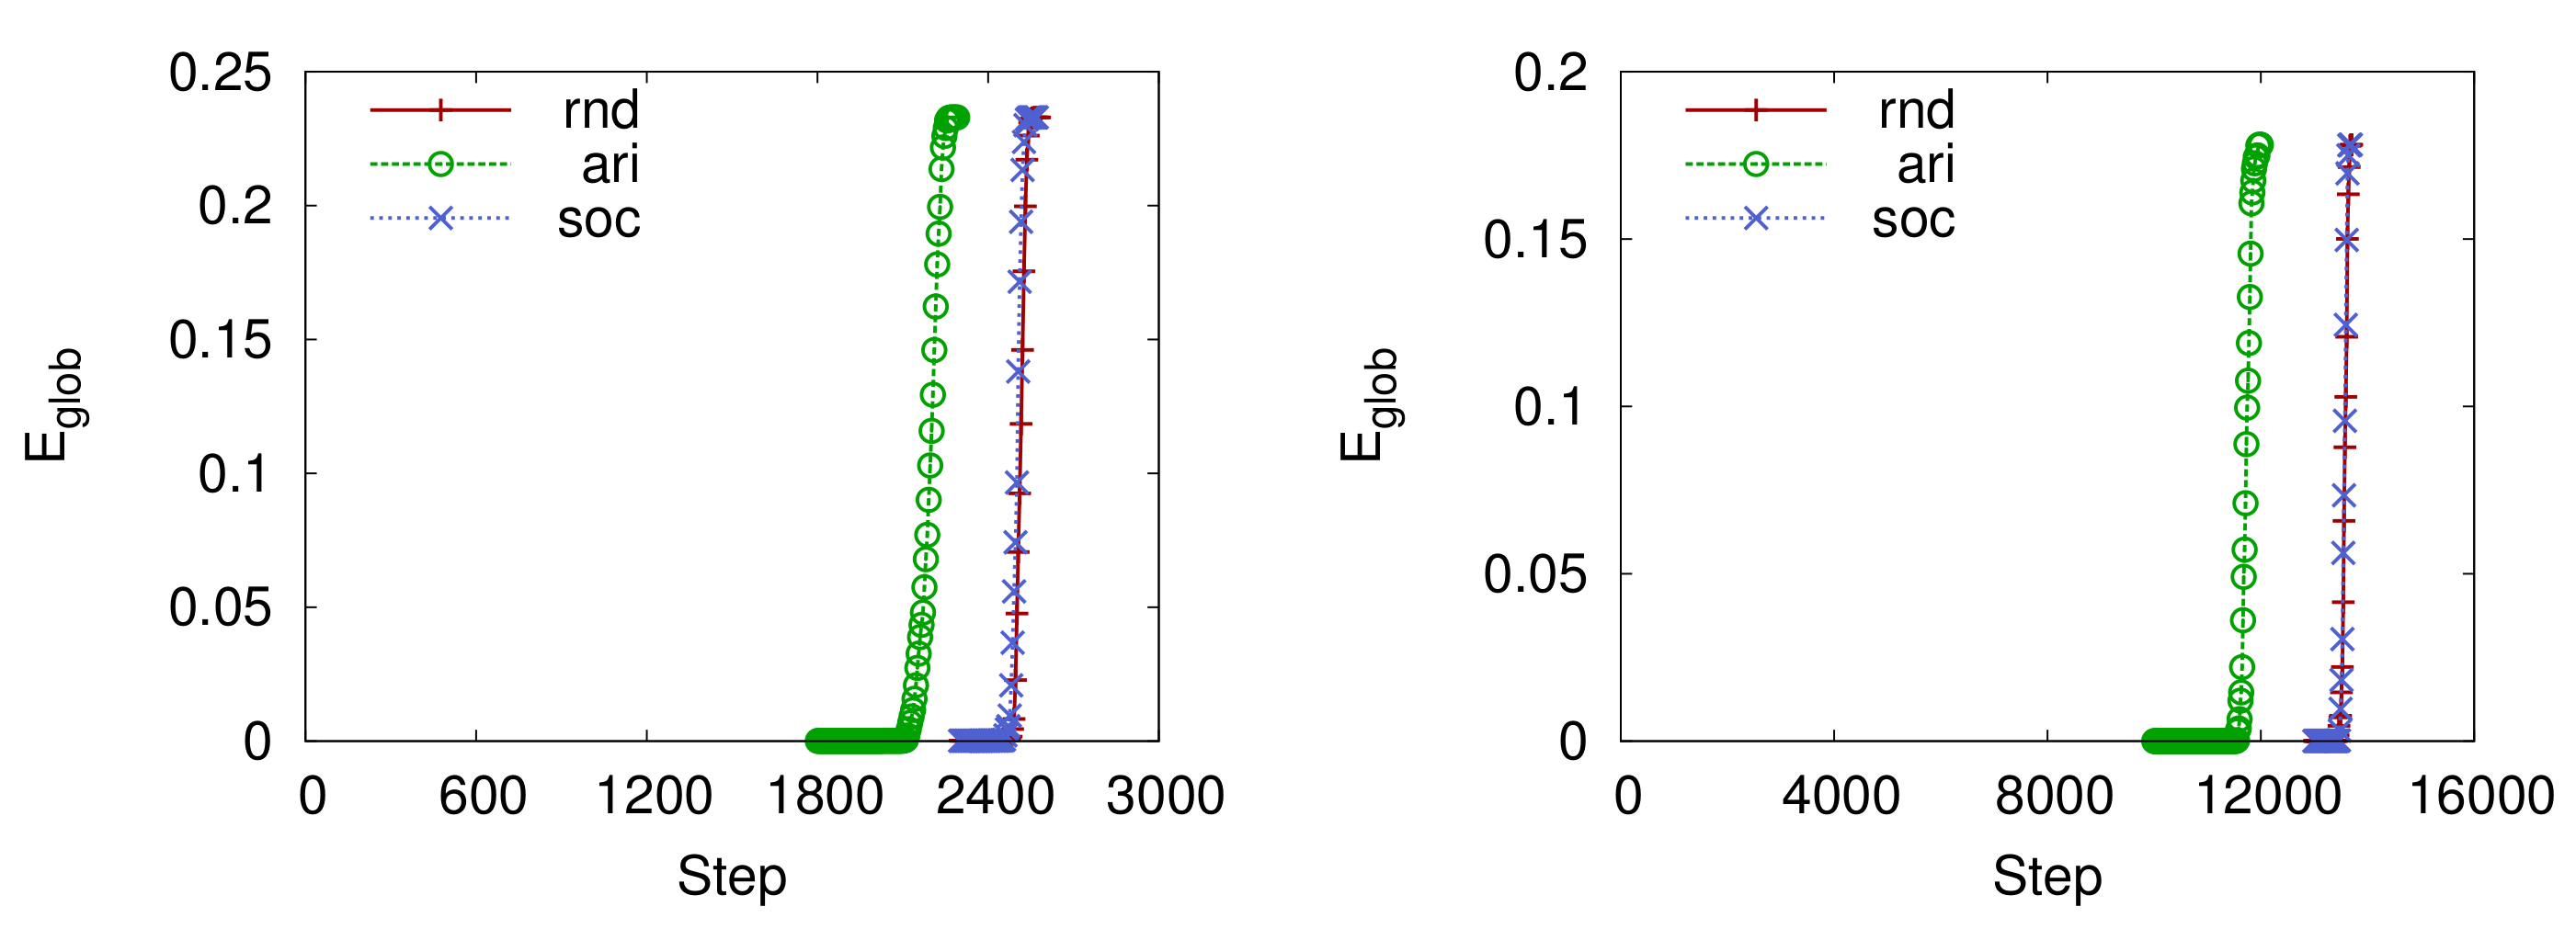
In order to verify whether the network topology affects the overall behavior, we applied the same rules on randomized version of the networks. Surprisingly, as Figure 9 and Table 4 show, the preferential attachment rule that previously was the slowest, now is and (CM and VT) faster than the others.
The explanation of this phenomenon is again dependent on the specific topological structure of the random networks. The main characteristic of these networks is that global connectivity is not based on the weak ties, but instead by scattered edges that connects randomly chosen nodes. As a consequence, the preferential attachment effect will be now strongly limited by the degree homogeneity of these networks and consequently the likelihood of selecting long-range edges is higher, bringing together far away substructures, yielding a fast increase of efficiency. Indeed, by comparing Figure 8 and Figure 9 we found that the topological structure strongly influences the overall simulated time. In fact, the simulations on artificial random networks are up to two times slower.
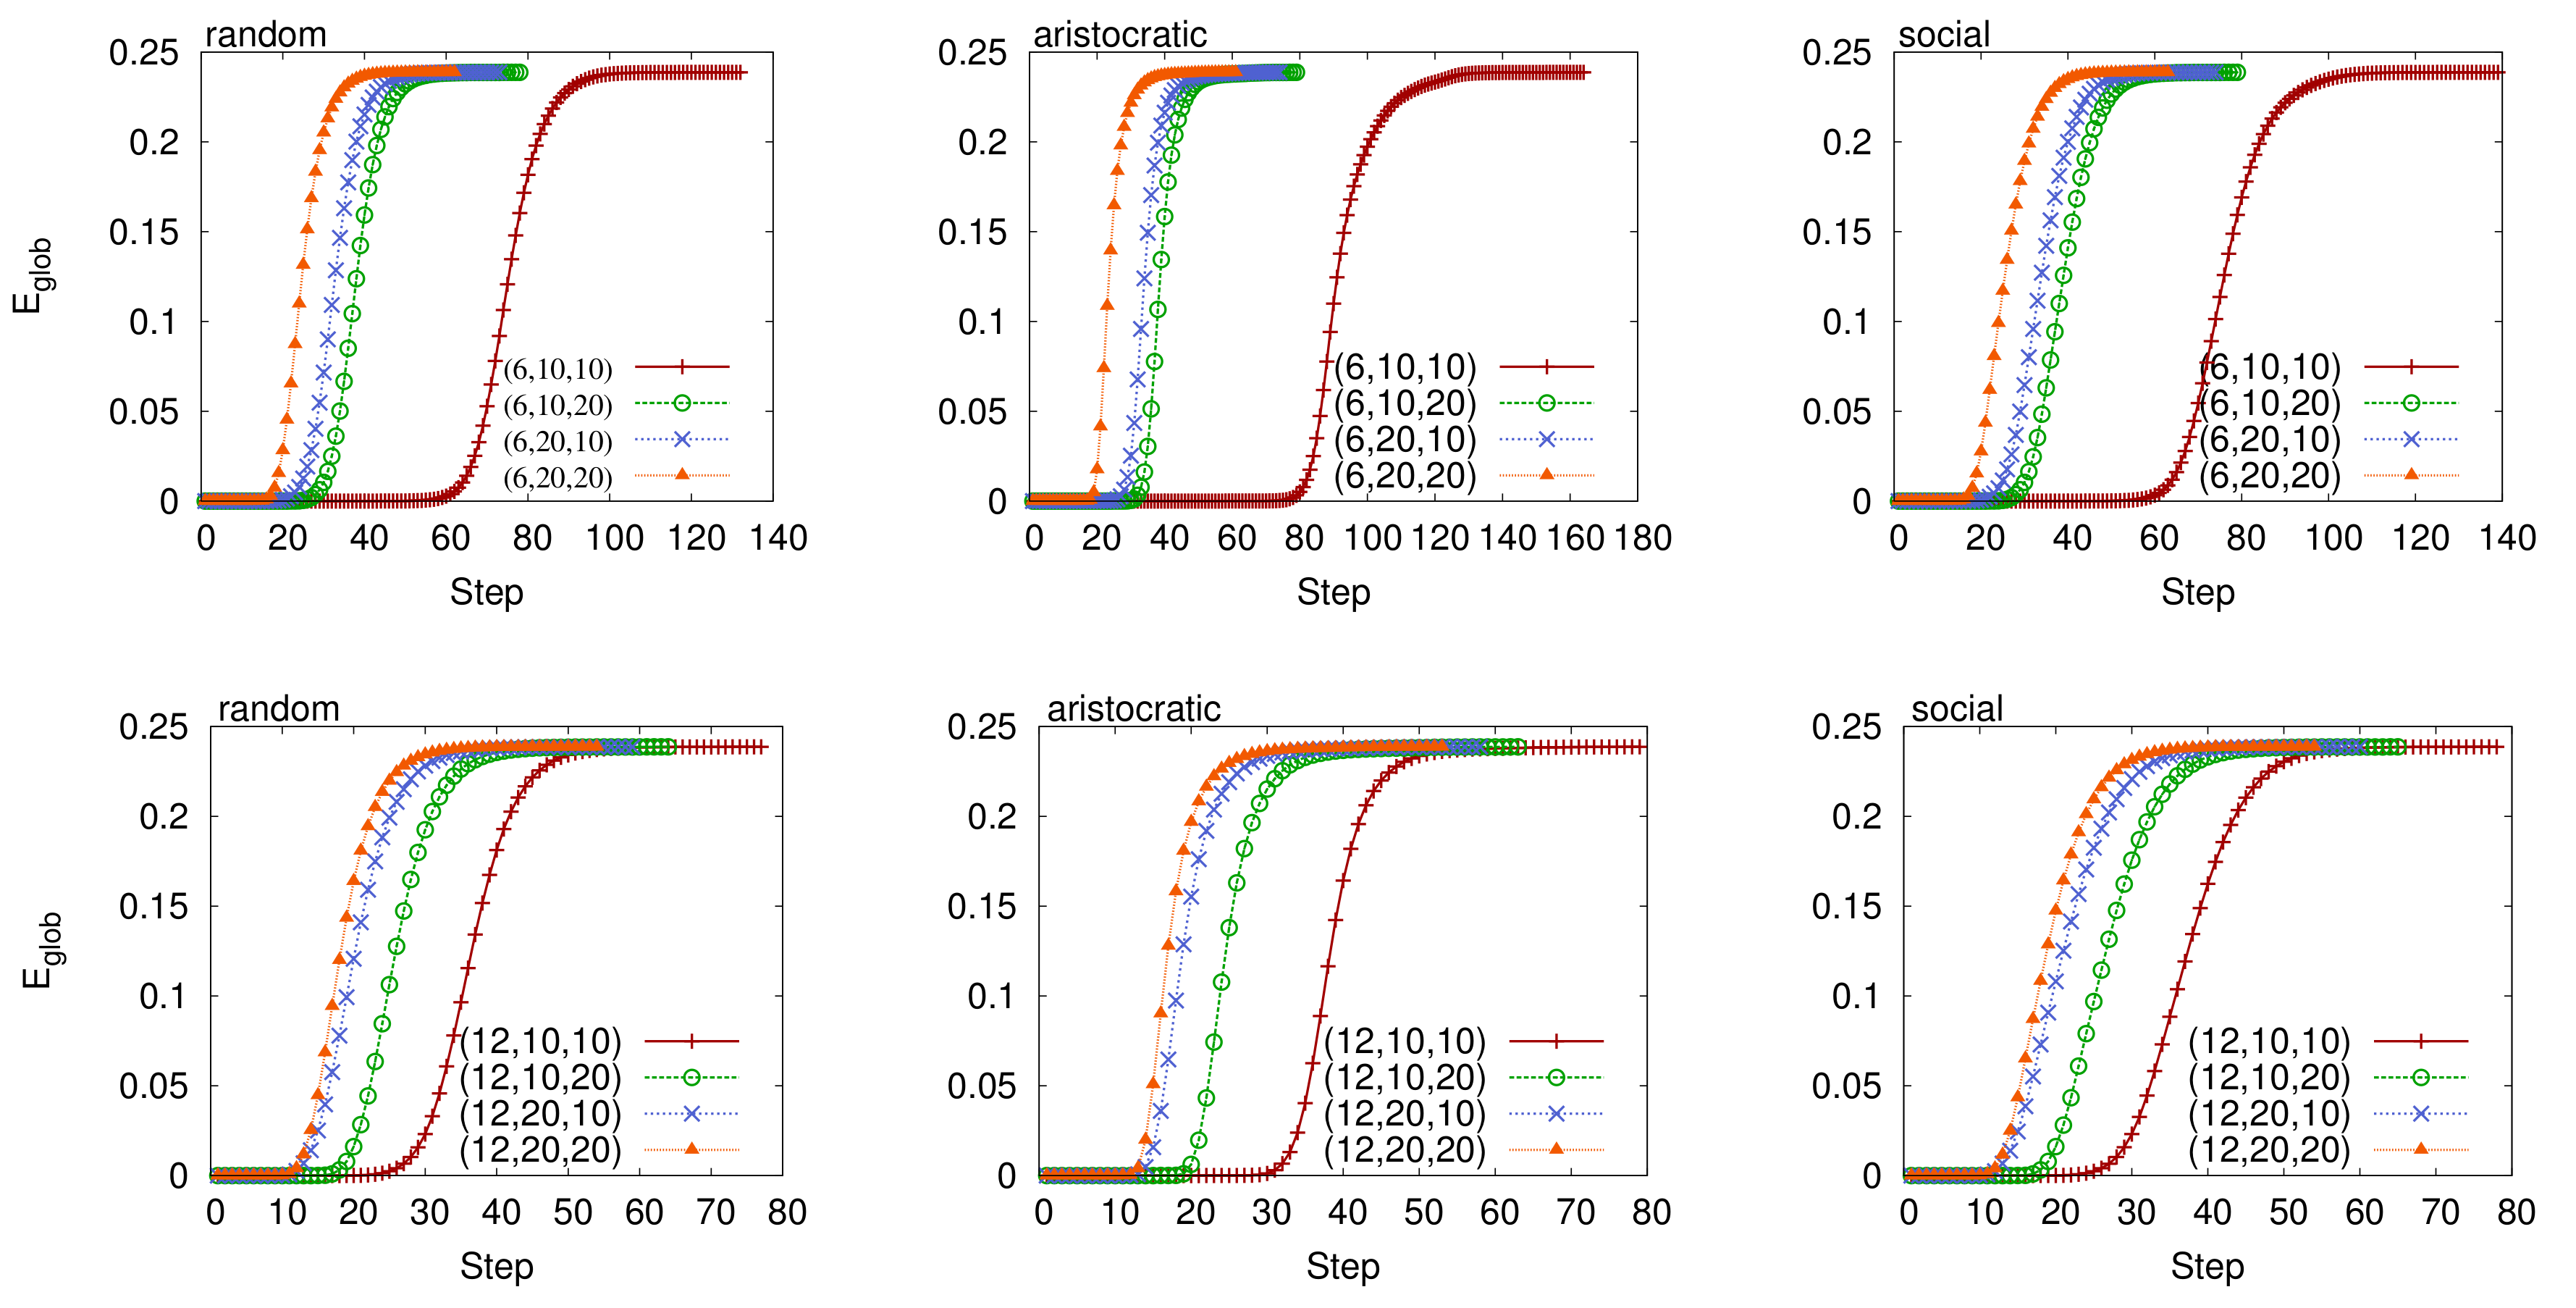
Q1: Same cost configurations. The following set of figures (from Figure 10, Figure 11, Figure 12, Figure 13, Figure 14, Figure 15 and Figure 16) represents how the same cost configurations affect the global efficiency. In particular, we consider the cost levels that have at least two configurations , namely 1200 and 2400. Table 3 collects all the possible configurations with a specific cost.
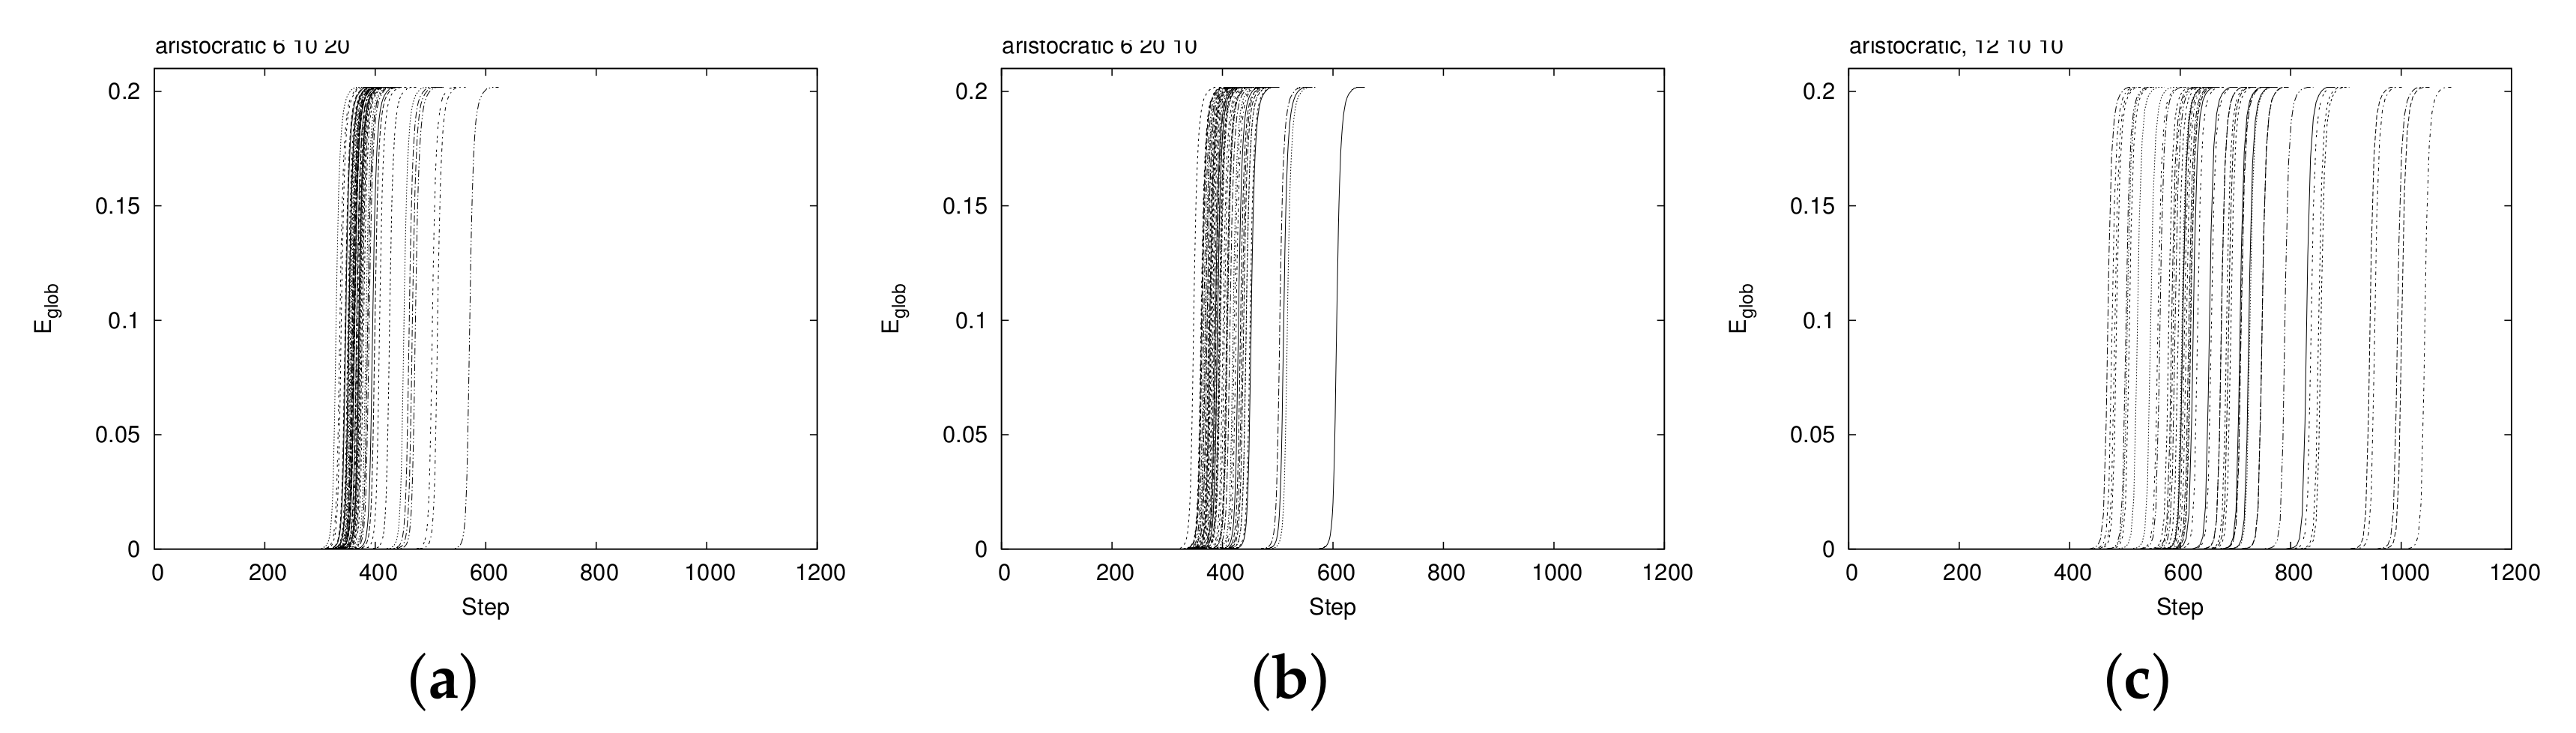
A single simulation’s run needs three parameters: a configuration and two rules. The first rule specifies the dynamics of users and the second one of the mermaids. In order to limit the bias due to the randomness of selecting the edges, we decided to repeat the same simulation 100 times and get the averaged results. However, the (simulated) timespan needed to get the target efficiency might vary in every run, making the calculation of averages not so straightforward. For this reason, we extended the timespan so that every simulation fit to the longest. In this way, we were able to average the y values at fixed x intervals. We found that when the spread of the timespan values is large (see for instance Figure 13c) and specifically with some of the VirtualTourist dataset, the method we used for averaging the results could create averaged behaviors that seems like stepping functions. We think this issue could be easily figured out by increasing the number of simulations.
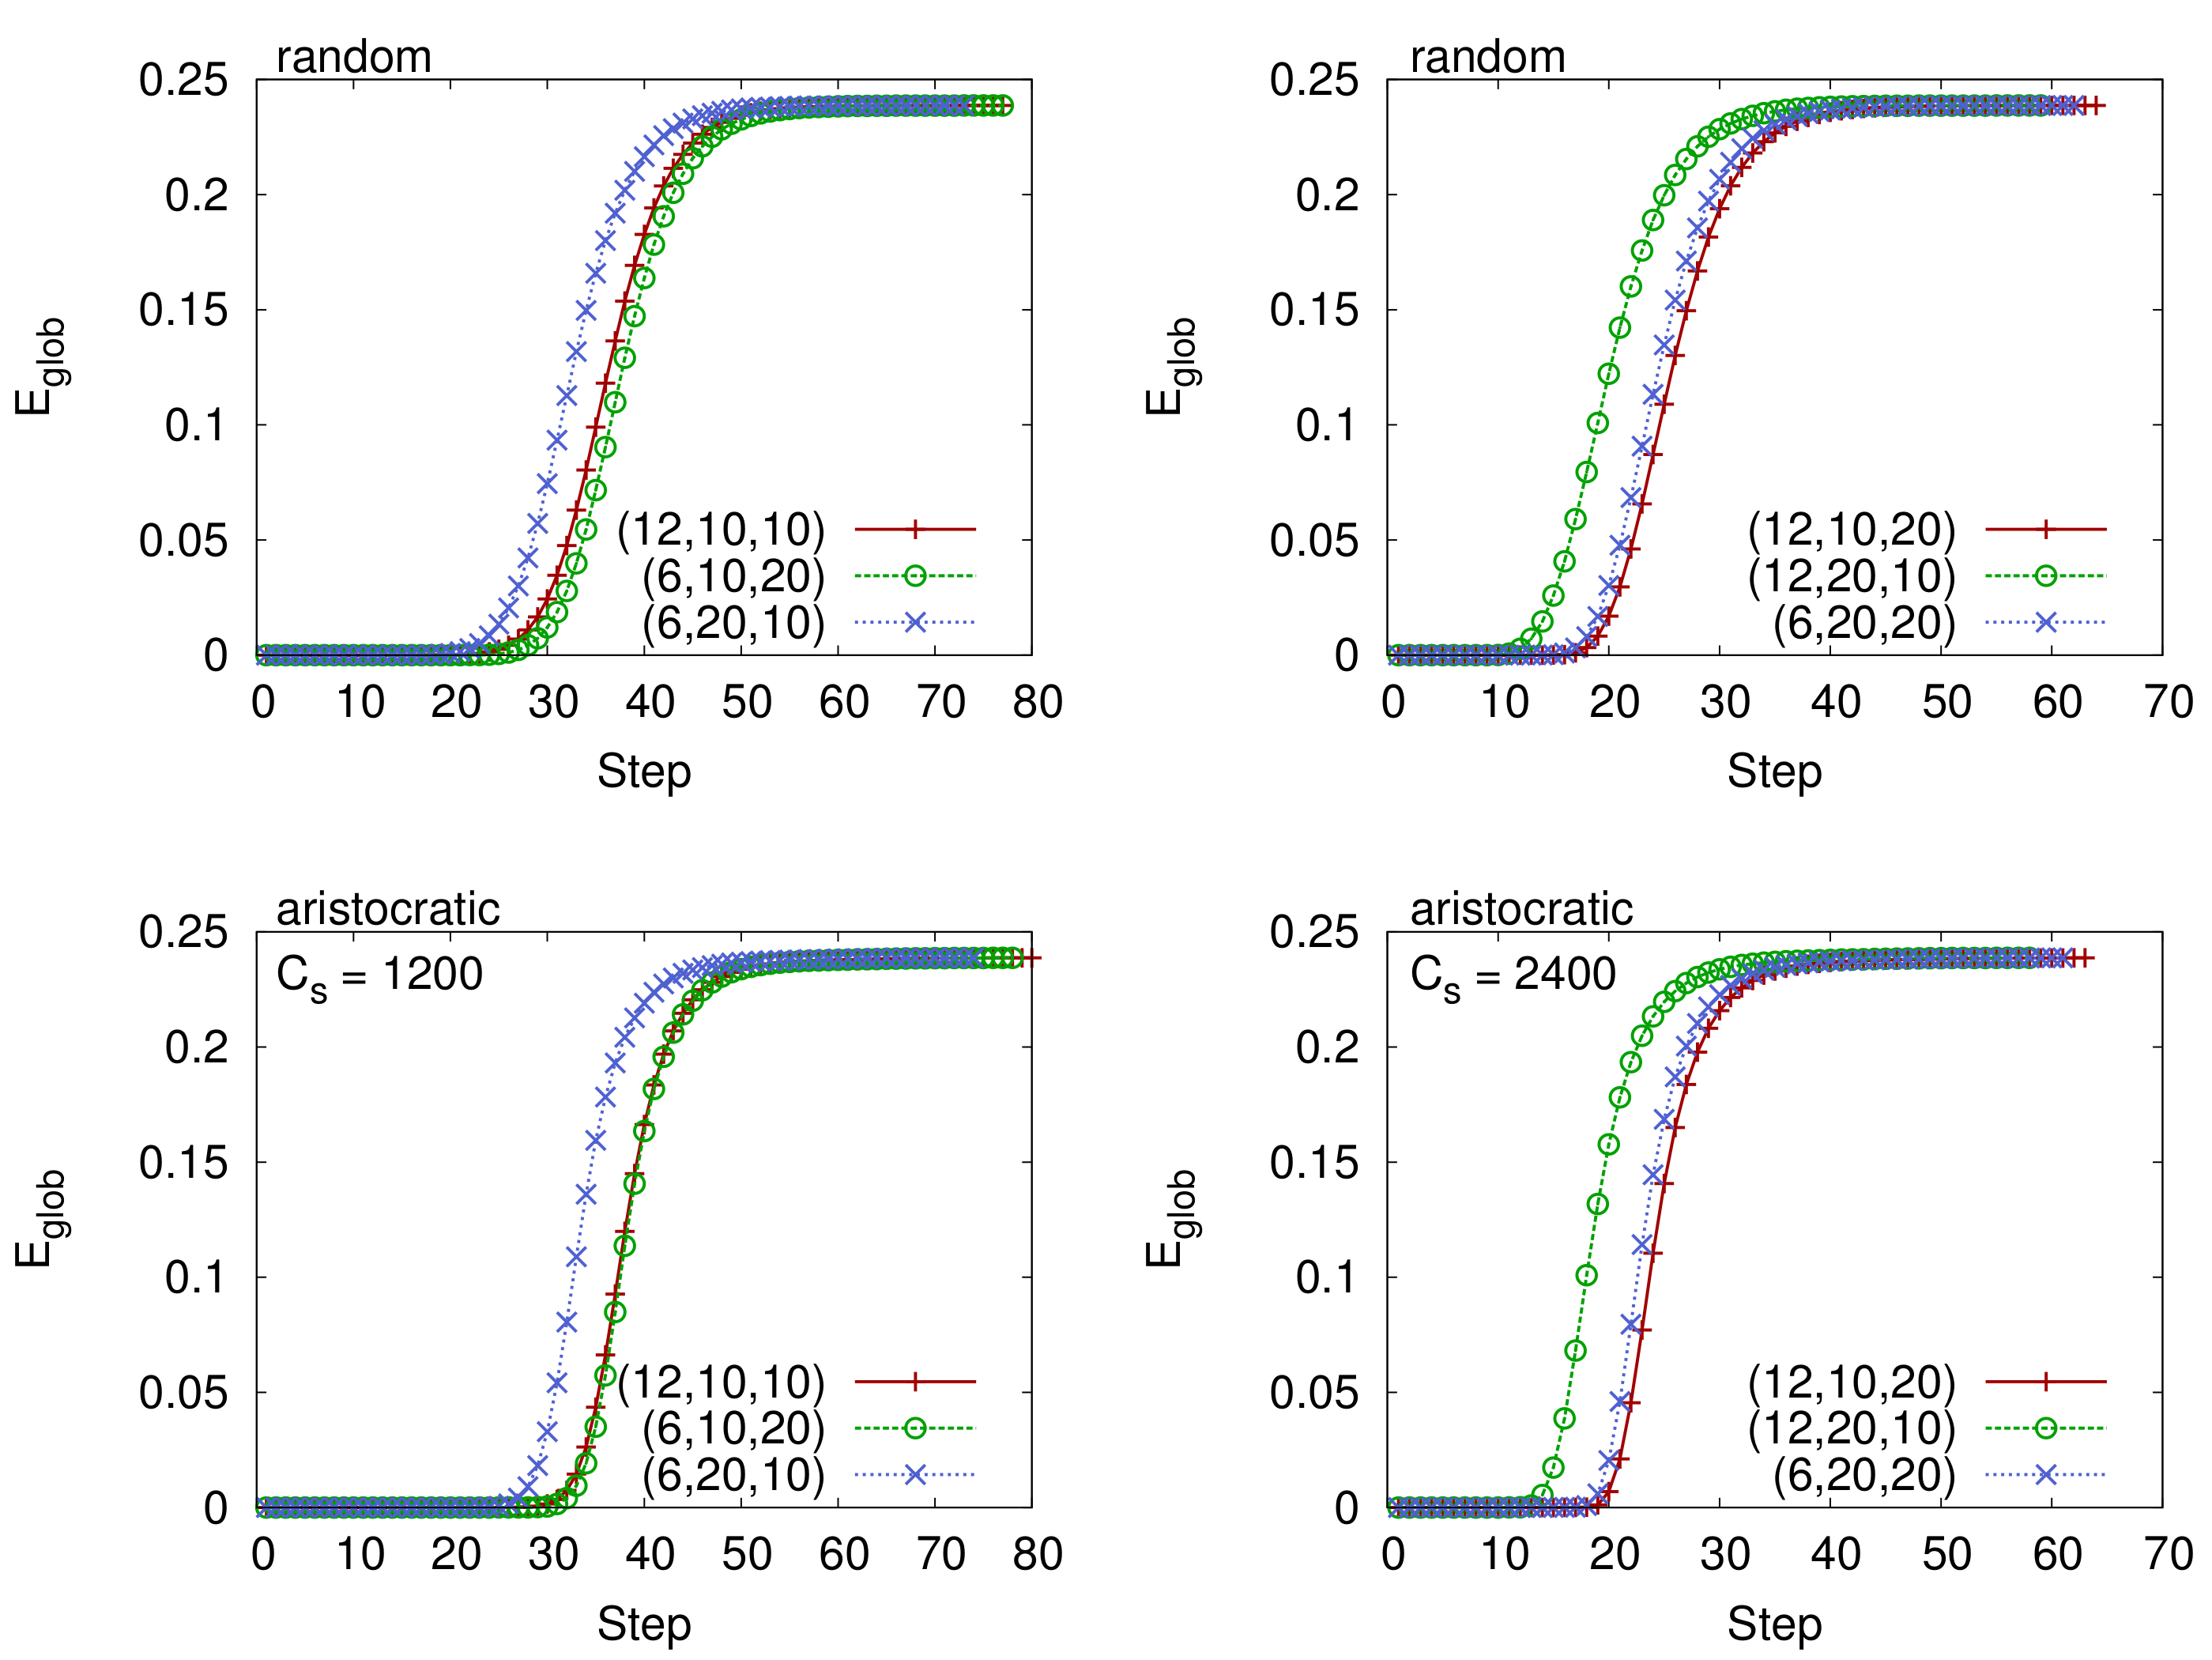
Figure 10 shows that only one specific configuration performs better compared to the others, and in particular the one that has the higher value of attractiveness. Surprisingly, this result is also quite general because it holds no matter what cost level or selected rule and regardless of the chosen mermaids’ dynamics.
Q2: Parameters variation. In the following experiments, we investigated the effects of parameters’ variation in configurations. In particular, we fixed the number of mermaids ( and ) and checked the performance of other configurations compared to the baseline (that are and respectively).
The plots presented are grouped by network (Communities and VirtualTourist). Figure 17, Figure 18 and Figure 19 show the results obtained for Communities and consider different mermaids’ dynamics, namely broadcast, word of mouth, and preferential. Table 5 then summarizes the for all the various configurations. Conversely, Figure 20, Figure 21 and Figure 22 refer to VirtualTourist, and Table 6 summarizes the corresponding ’s.
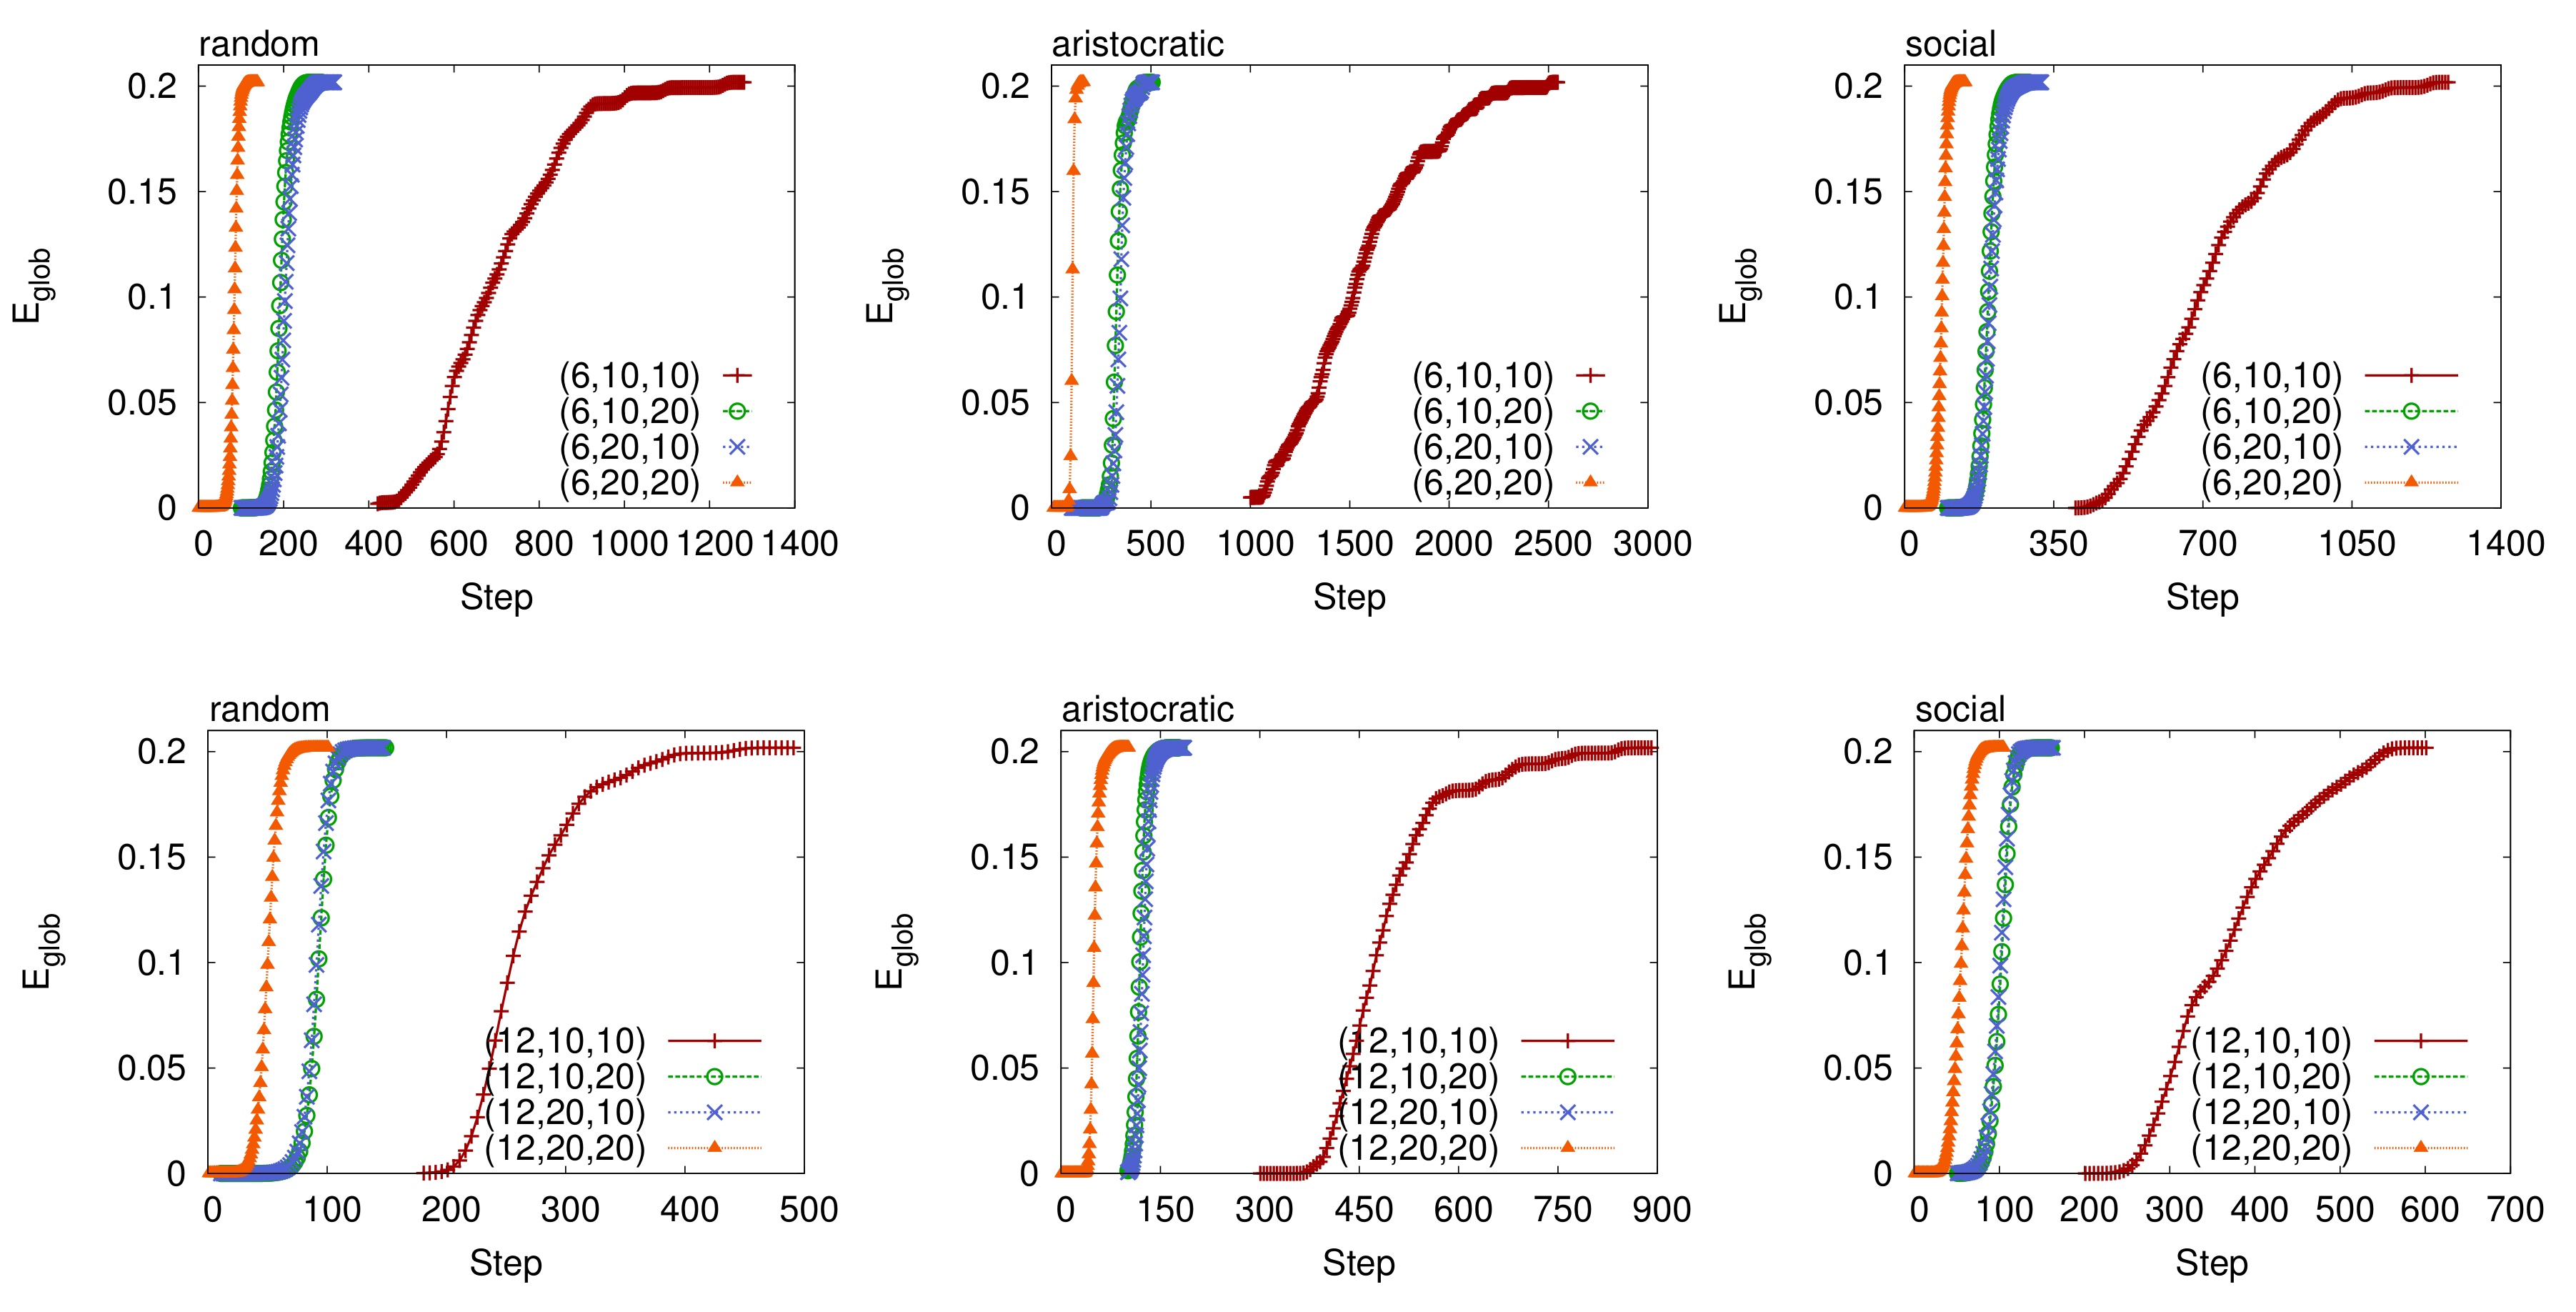
All the plots presented in this section clearly show that increasing results in shrinking times to obtain the target efficiency. This is a very interesting result because it confirms the effectiveness of employing more mermaids in order to boost network engagement and in particular to lower the threshold after which the connectivity spreads all over the network. Indeed, another interesting observation could be made. We note that even though increasing always triggers a broader connectivity distribution, the benefit is not proportional to . For instance, quadrupling , the simulated time shrinks less than four times. The question Q3 will account for quantitatively defining this benefit. Remarkably, the observed effects are universal in the sense that they hold regardless of the network and the considered rule, suggesting their validity in a wide class of social networks.
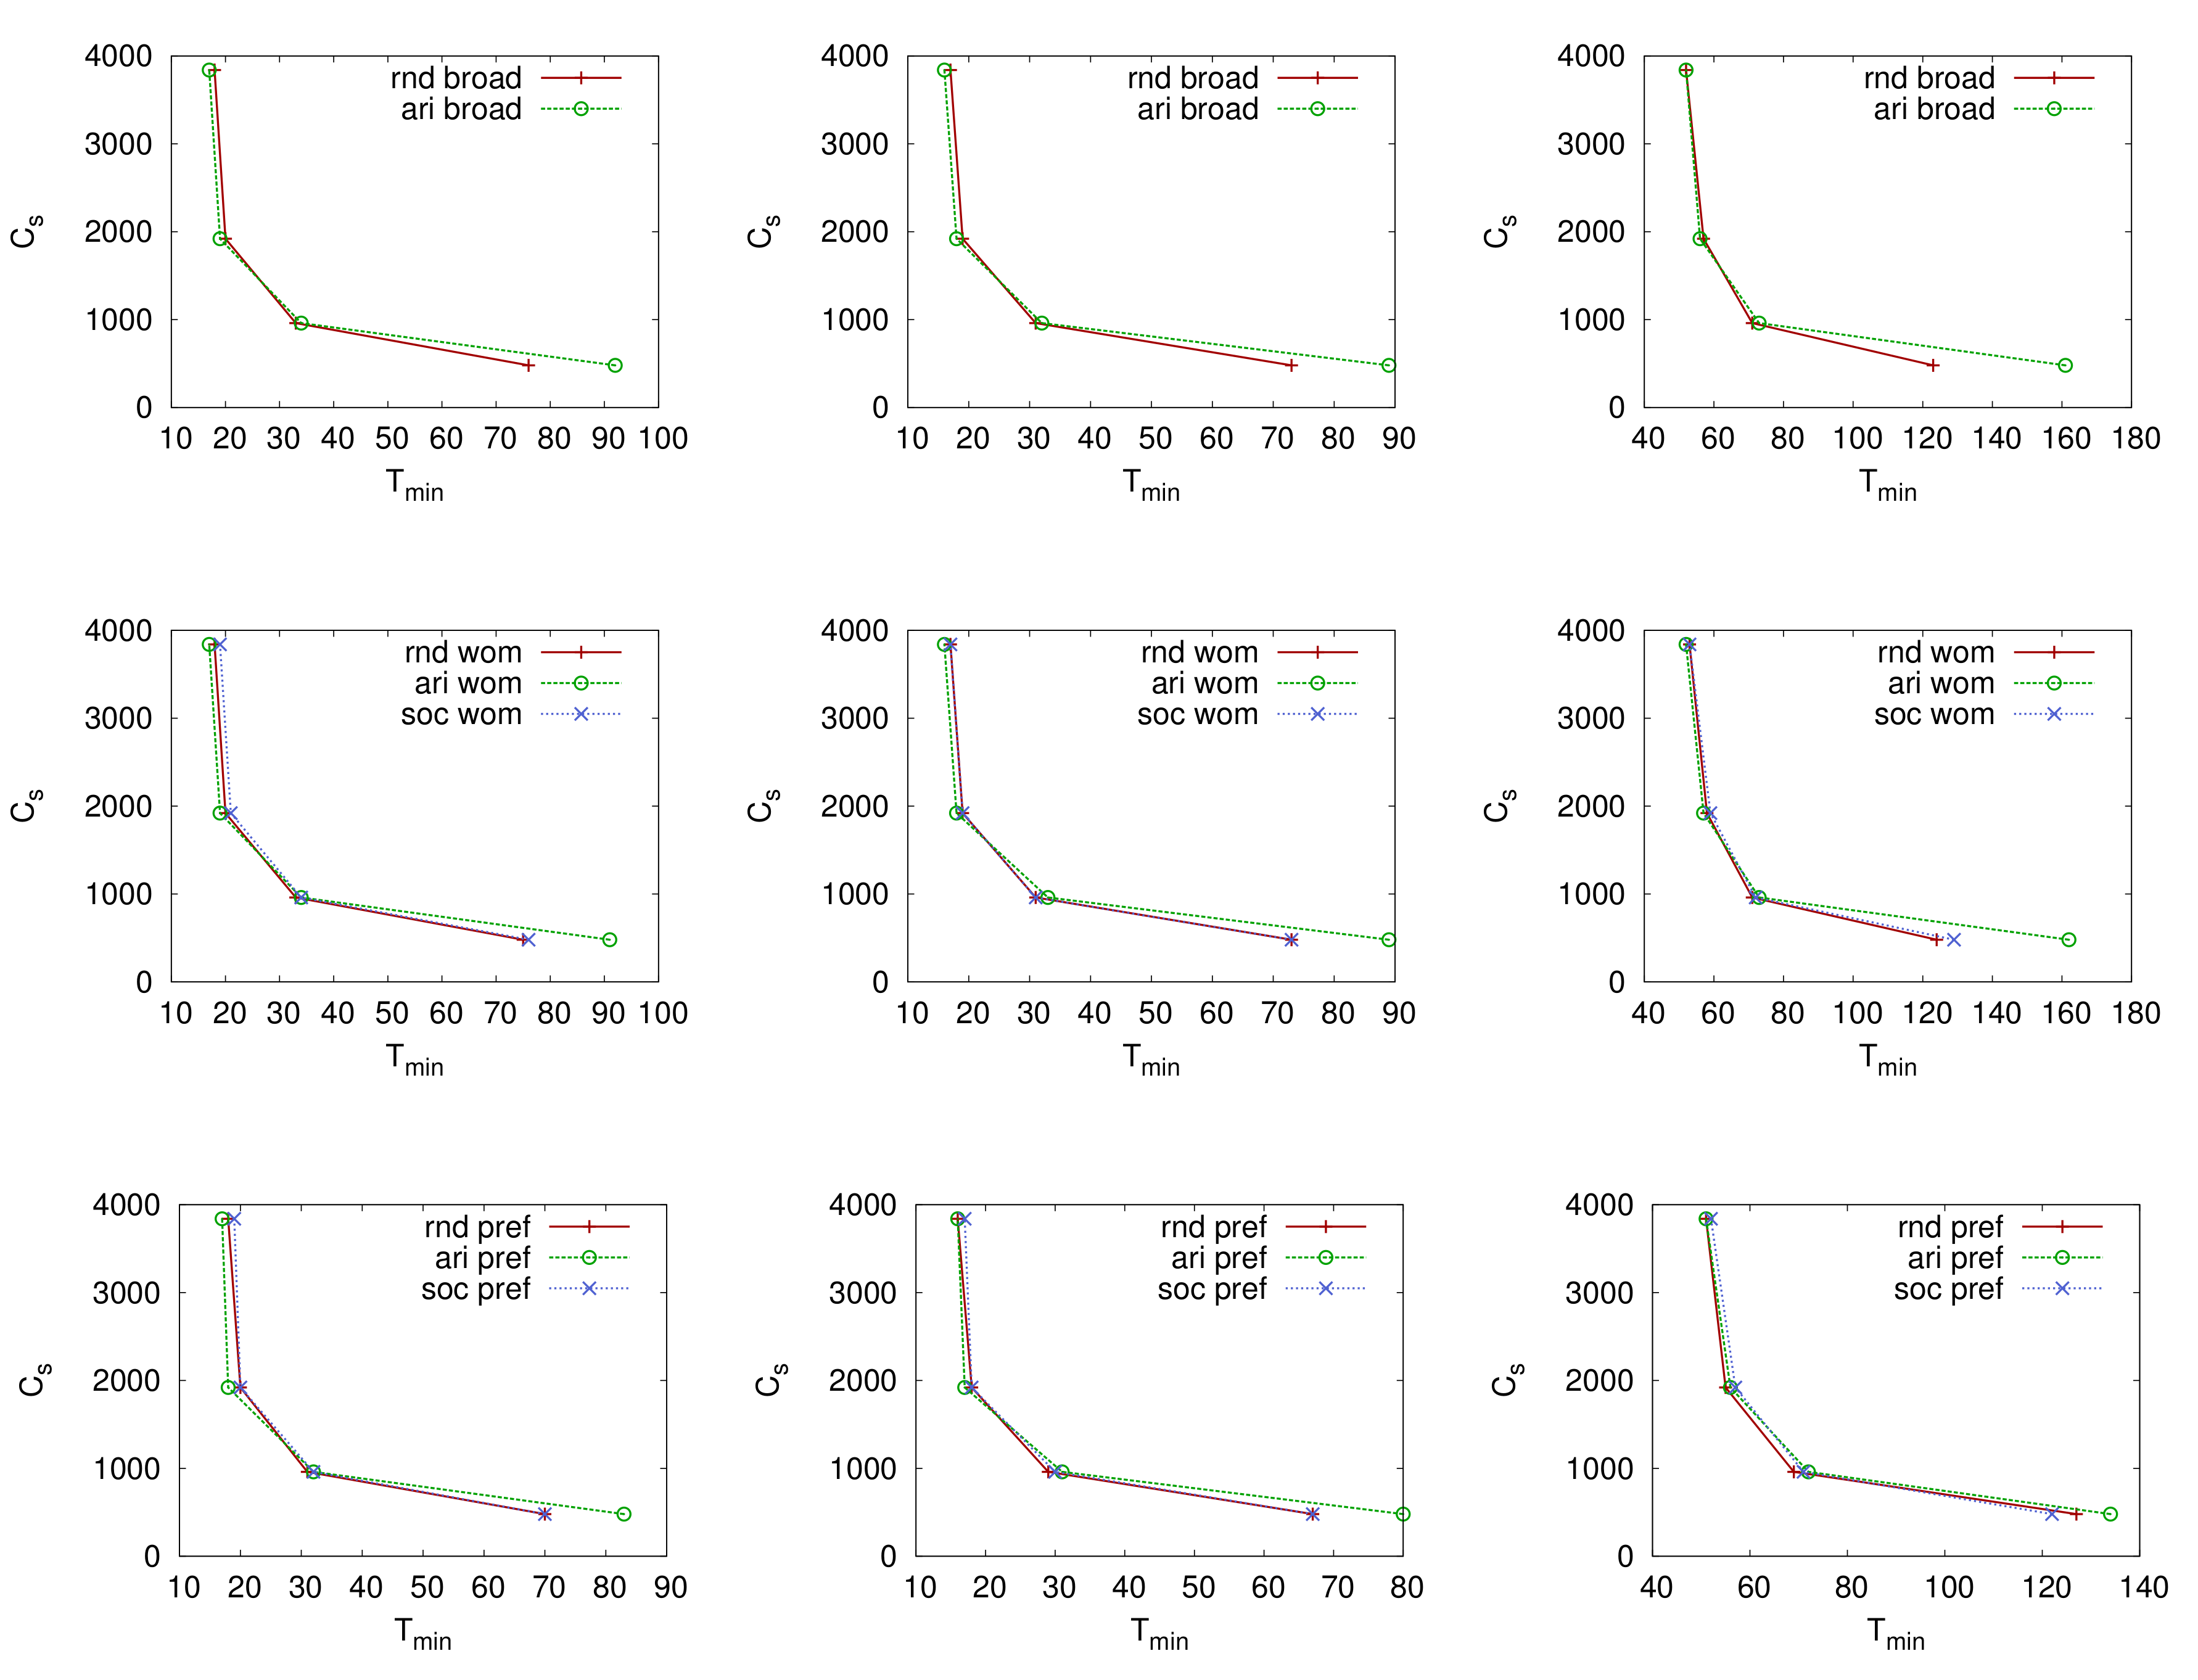
Q3: Trade-off between the benefit of investing on mermaids and the cost. In the plots presented previously, we described how the timespan needed to get the reference efficiency varies according to . Figure 23 and Figure 24 (rightmost panels) show as a function of and this allows to describe more quantitatively the benefit of investing on mermaids. In fact, plots clearly show that this is not linear as one might guess, instead it is inversely proportional as . We think this is probably due to the system saturation. In other words, the network is not able to respond to high level of exogenous stimuli from mermaids resulting in performances that are comparatively similar to those obtained with lower cost configurations.
In order to test whether this finding holds when considering threshold values of efficiency, we investigated the time needed to get half and one third . Surprisingly, as the figures show (left most and centermost panels), the benefit is still inversely correlated to . This means that the efficiency growth behavior is quite regular.
In Section 4.2 we introduced Equation (4) that accounts for the cost of running a social network and we analytically found that is minimum when Equation (5) holds. Since in real contexts , i.e., the hypothetical cost of running a web service, is influenced by many factors, a unique value might not exist. For this reason, we tried many combinations of that meet Equation (5). To obtain those values we calculate the first discrete derivative of (different threshold values are then considered). Table 7 lists all the values of we examined in our experiments. Table 8 shows the total cost as a function of and for different threshold values. This is a very interesting finding because, once the cost per unit time of a web service is known, our method can estimate the that accounts for the minimum . Indeed, since many configurations can have the same cost, the one that has the higher value of attractiveness will be the one that reach faster the target efficiency (see question Q1).
6. Conclusions
In this article we have dealt with the problem of temporal evolution of social networks, trying to shed light on the effective strategies that can trigger a successful system evolution.
To date, many models of network growth have been proposed, especially in the context of social networks. For instance, some researchers observed that new social ties are driven by randomness. Because of that, some classical models are based on random wiring rules, whereas others are based on preferential attachment (i.e., the rate with which older nodes acquire new links is faster than new nodes) or on triadic closure rule (also known as friend’s friend rule, that is, two friends of a person are more likely to know each other compared to two randomly chosen people).
Even though the previous classical growth models are well known and applied in social networks as well as in many other complex networks’ settings, we focused on what can be the fundamental ingredients for a successful network evolution (considerably boosting connectivity). In particular, we identified an important strategical tool by using a new set of special nodes, called “mermaids”, whose aim is to increase network utilization by establishing new links with existing nodes. We then proceeded to identify what the best strategies are to use this tool when also considering the cost factor and dealing with a predefined budget constraint.
The main questions we raised in this paper are the following: Are the mermaids beneficial as a way to widely spread the adoption of new online social systems? How is the global network behavior shaped by employing special nodes? Does the serial model (i.e., one edge added at time) or the simultaneous model (i.e., the number of edges added varies dynamically according to the current efficiency) achieve the best performance? How do the same cost configurations influence network efficiency? How much does it cost to use the mermaids?
We systematically simulated two online communities with different sizes and topics demonstrating the effectiveness of mermaids to drive social evolution and boost community engagement in general. Indeed, simulations were performed as a function of the mermaids configurations composed by three main parameters: the number of mermaids, attractiveness, and time span of the mermaids’ utilization. We found that at the same cost, the configurations that attain the best results are those with high attractiveness, regardless of the online social network considered. Therefore, the best strategy to use mermaids when operating within a set budget is to primarily focus on the attractiveness parameter, and consequently adjust the number of mermaids and their operational time.
Several other interesting features could be explored as a natural extension of this paper. For instance, it could be of great importance to investigate whether the identified strategies are universally applicable to any online (and also non-online) social network. Another important direction in the context of social modeling could be to study not only how varies with different configurations and parameters but also to consider other fundamental features such as local efficiency, assortativity, centrality, etc., in order to develop a deeper insight on boosted network evolution.
Author Contributions
Conceptualization, M.M.; methodology, M.M.; software, L.P.; formal analysis, M.M. and L.P.; investigation, M.M. and L.P.; writing—original draft preparation, L.P.; writing—review and editing, M.M.; supervision, M.M. All authors have read and agreed to the published version of the manuscript.
Funding
This research received no external funding.
Conflicts of Interest
The authors declare no conflict of interest.
References
- Marchiori, M.; Possamai, L. Micro-macro analysis of complex networks. PLoS ONE 2015, 10, e0116670. [Google Scholar] [CrossRef] [Green Version]
- Holme, P.; Edling, C.R.; Liljeros, F. Structure and time evolution of an Internet dating community. Soc. Netw. 2004, 26, 155–174. [Google Scholar] [CrossRef] [Green Version]
- Wellman, B.; Haythornthwaite, C. The Internet in Everyday Life; Blackwell Publishing: Oxford, UK, 2002. [Google Scholar]
- Wellman, B. Computer networks as social networks. Science 2001, 293, 2031–2034. [Google Scholar] [CrossRef] [PubMed] [Green Version]
- Backstrom, L.; Sun, E.; Marlow, C. Find me if you can: Improving geographical prediction with social and spatial proximity. In Proceedings of the 19th International Conference on World Wide Web, Raleigh, NC, USA, 26–30 April 2010; pp. 61–70. [Google Scholar]
- Bond, R.M.; Fariss, C.J.; Jones, J.J.; Kramer, A.D.I.; Marlow, C.; Settle, J.E.; Fowler, J.H. A 61-million-person experiment in social influence and political mobilization. Nature 2012, 489, 295–298. [Google Scholar] [CrossRef] [PubMed] [Green Version]
- Kumar, R.; Novak, J.; Tomkins, A. Structure and Evolution of Online Social Networks. In Link Mining: Models, Algorithms, and Applications; Yu, P.S., Han, J., Faloutsos, C., Eds.; Springer: New York, NY, USA, 2010; pp. 337–357. [Google Scholar] [CrossRef]
- Palla, G.; Barabási, A.L.; Vicsek, T. Quantifying Social Group Evolution. Nature 2007, 446, 664–667. [Google Scholar] [CrossRef] [Green Version]
- Adamic, L.A.; Lento, T.M.; Adar, E.; Ng, P.C. Information Evolution in Social Networks. In Proceedings of the Ninth ACM International Conference on Web Search and Data Mining; Association for Computing Machinery (WSDM ’16), San Francisco, CA, USA, 22–25 February 2016; pp. 473–482. [Google Scholar] [CrossRef] [Green Version]
- Kwak, D.; Kim, W. Understanding the Process of Social Network Evolution: Online-Offline Integrated Analysis of Social Tie Formation. PLoS ONE 2017, 12, e0177729. [Google Scholar] [CrossRef] [Green Version]
- Pavlopoulou, M.E.G.; Tzortzis, G.; Vogiatzis, D.; Paliouras, G. Predicting the Evolution of Communities in Social Networks Using Structural and Temporal Features. In Proceedings of the 2017 12th International Workshop on Semantic and Social Media Adaptation and Personalization (SMAP), Bratislava, Slovakia, 9–10 July 2017; pp. 40–45. [Google Scholar] [CrossRef] [Green Version]
- Toivonen, R.; Kovanen, L.; Kivelä, M.; Onnela, J.P.; Saramäki, J.; Kaski, K. A Comparative Study of Social Network Models: Network Evolution Models and Nodal Attribute Models. Soc. Netw. 2009, 31, 240–254. [Google Scholar] [CrossRef] [Green Version]
- Wang, H.; Hu, W.; Qiu, Z.; Du, B. Nodes’ Evolution Diversity and Link Prediction in Social Networks. IEEE Trans. Knowl. Data Eng. 2017, 29, 2263–2274. [Google Scholar] [CrossRef]
- Ferrara, E.; Varol, O.; Davis, C.; Menczer, F.; Flammini, A. The Rise of Social Bots. Commun. ACM 2016, 59, 96–104. [Google Scholar] [CrossRef] [Green Version]
- Grimme, C.; Preuss, M.; Adam, L.; Trautmann, H. Social Bots: Human-Like by Means of Human Control? Big Data 2017, 5, 279–293. [Google Scholar] [CrossRef]
- Shao, C.; Ciampaglia, G.L.; Varol, O.; Yang, K.C.; Flammini, A.; Menczer, F. The Spread of Low-Credibility Content by Social Bots. Nat. Commun. 2018, 9, 1–9. [Google Scholar] [CrossRef] [PubMed] [Green Version]
- Puschmann, T. Fintech. In Business & Information Systems Engineering; Springer: New York, NY, USA, 2017; Volume 59, pp. 69–76. [Google Scholar] [CrossRef]
- Dhar, V.; Stein, R.M. FinTech Platforms and Strategy. Commun. ACM 2017, 60, 32–35. [Google Scholar] [CrossRef]
- Gai, K.; Qiu, M.; Sun, X. A Survey on FinTech. J. Net. Comput. Appl. 2018, 103, 262–273. [Google Scholar] [CrossRef]
- Lee, I.; Shin, Y.J. Fintech: Ecosystem, Business Models, Investment Decisions, and Challenges. Bus. Horiz. 2018, 61, 35–46. [Google Scholar] [CrossRef]
- Albert, R.; Barabási, A. Statistical mechanics of complex networks. Rev. Mod. Phys. 2002, 74, 47–97. [Google Scholar] [CrossRef] [Green Version]
- Gallos, L.K.; Rybski, D.; Liljeros, F.; Havlin, S.; Makse, H.A. How People Interact in Evolving Online Affiliation Networks. Phys. Rev. X 2012, 2, 031014. [Google Scholar] [CrossRef] [Green Version]
- Barabasi, A.; Albert, R. Emergence of scaling in random networks. Science 1999, 286, 509–512. [Google Scholar] [CrossRef] [Green Version]
- Réka, A.; Barabási, A.L. Topology of Evolving Networks: Local Events and Universality. Phys. Rev. Lett. 1999, 85, 5234. [Google Scholar]
- Granovetter, M.S. The Strength of Weak Ties. Am. J. Soc. 1973, 78, 1360–1380. [Google Scholar] [CrossRef] [Green Version]
- Latora, V.; Marchiori, M. Efficient Behaviour of Small-World Networks. Phys. Rev. Lett. 2001, 87. [Google Scholar] [CrossRef] [PubMed] [Green Version]
- Falco, S. Analisi di Comunità Virtuali: Il caso Virtualtourist.com. Master’s Thesis, Università Ca’ Foscari, Venice, Italy, 2005. [Google Scholar]
- Casagrande, A. Analisi di Comunità Virtuali: Il caso Communities.com. Master’s Thesis, Università Ca’ Foscari, Venice, Italy, 2006. [Google Scholar]
- Kumar, R.; Novak, J.; Tomkins, A. Structure and evolution of online social networks. In Proceedings of the 12th ACM SIGKDD International Conference On Knowledge Discovery and Data Mining, Philadelphia, PA USA, 20–23 August 2006; ACM: New York, NY, USA, 2006; pp. 611–617. [Google Scholar] [CrossRef]
- Marchiori, M.; Latora, V. Harmony in the small-world. Phys. A: Stat. Mech. Appl. 2000, 285, 539–546. [Google Scholar] [CrossRef] [Green Version]
- Newman, M. Assortative mixing in networks. Phys. Rev. Lett. 2002, 89, 208701. [Google Scholar] [CrossRef] [PubMed] [Green Version]
- Mislove, A.; Marcon, M.; Gummadi, K.P.; Druschel, P.; Bhattacharjee, B. Measurement and analysis of online social networks. In Proceedings of the 7th ACM SIGCOMM Conference on Internet Measurement, San Diego, CA, USA, 23–26 October 2007; ACM: New York, NY, USA, 2007; pp. 29–42. [Google Scholar] [CrossRef]
- Ahn, Y.Y.; Han, S.; Kwak, H.; Moon, S.; Jeong, H. Analysis of topological characteristics of huge online social networking services. In Proceedings of the 16th International Conference on World Wide Web, Banff, AB, Canada, 8–12 May 2007; ACM: New York, NY, USA, 2007; pp. 835–844. [Google Scholar] [CrossRef]
- Hu, H.; Wang, X. Evolution of a large online social network. Phys. Lett. 2009, 373, 1105–1110. [Google Scholar] [CrossRef]
- Tsoularis, A. Analysis of logistic growth models. Math. Biosci. 2002, 179, 21–55. [Google Scholar] [CrossRef] [Green Version]
Figure 1.
Example of social rule. The figure represents a hypothetical snapshot of graph G at time t during network evolution. Straight links indicate already existing edges whereas the dashed lines indicate the ones that will be added in the following steps. Edge closes three triads , , and , whereas and only close two and one triangle respectively. Therefore, the probability of been selected at time is , and respectively.

Figure 2.
How the scale parameter C influences the global efficiency curve. It directly impacts the time span needed to get the referring network .
Figure 2.
How the scale parameter C influences the global efficiency curve. It directly impacts the time span needed to get the referring network .

Figure 3.
Example of online social network with normal users and mermaids . Nodes inside the rounded rectangle belong to the users’ graph. Mermaids aim to connect to nodes of the users’ network in order to increase overall utilization (for instance edge ).
Figure 3.
Example of online social network with normal users and mermaids . Nodes inside the rounded rectangle belong to the users’ graph. Mermaids aim to connect to nodes of the users’ network in order to increase overall utilization (for instance edge ).

Figure 4.
Examples of the word of mouth model (a,b). and . Highlighted links indicate the edges that have just been added to the network, straight lines are edges inserted in the previous steps, and dashed ones represent the possible options for new links (and that have a higher probability to be chosen).

Figure 5.
Cumulative degree distributions of Communities (left panel) and VirtualTourist (right panel). k is the degree, and is the coefficient of the fitting (dashed) line . The Figure clearly shows a power law behavior in the degree and is approximately equal to and , respectively.
Figure 5.
Cumulative degree distributions of Communities (left panel) and VirtualTourist (right panel). k is the degree, and is the coefficient of the fitting (dashed) line . The Figure clearly shows a power law behavior in the degree and is approximately equal to and , respectively.

Figure 6.
Node degree correlations in Communities (left panel) and VirtualTourist (right panel) online social networks. is the average degree of first neighbors. Figures show a negative correlation. In fact, Pearson correlation is equal to and respectively. The inset graphs contain the same data but plotted in linear axes.

Figure 7.
Effect of serial network simulation for Communities (left panel) and VirtualTourist (right panel). After an initial time span (approximately one sixth of the entire simulation time), the preferential attachment rule (aristocratic) outperforms the others.
Figure 7.
Effect of serial network simulation for Communities (left panel) and VirtualTourist (right panel). After an initial time span (approximately one sixth of the entire simulation time), the preferential attachment rule (aristocratic) outperforms the others.

Figure 8.
Effect of parallel network simulation for Communities (left panel) and VirtualTourist (right panel). These plots help us to understand how parallel links’ creation modifies the dynamics of online social systems. Surprisingly, preferential attachment (that outperforms other rules in inertial setting) is the slowest, obtaining bad performance in terms of time needed to reach the target efficiency. Curves start at simulation time , but we cropped the points for low values of for graphical clarity. Standard deviations are very small and are not plotted for graphical reasons.

Figure 9.
Effect of simultaneous network simulation in randomized version of Communities (left panel) and VirtualTourist (right panel). Curve starts at simulation time , but we cropped the points for low values of for graphical clarity. Standard deviation is very small and therefore is not plotted.
Figure 9.
Effect of simultaneous network simulation in randomized version of Communities (left panel) and VirtualTourist (right panel). Curve starts at simulation time , but we cropped the points for low values of for graphical clarity. Standard deviation is very small and therefore is not plotted.

Figure 10.
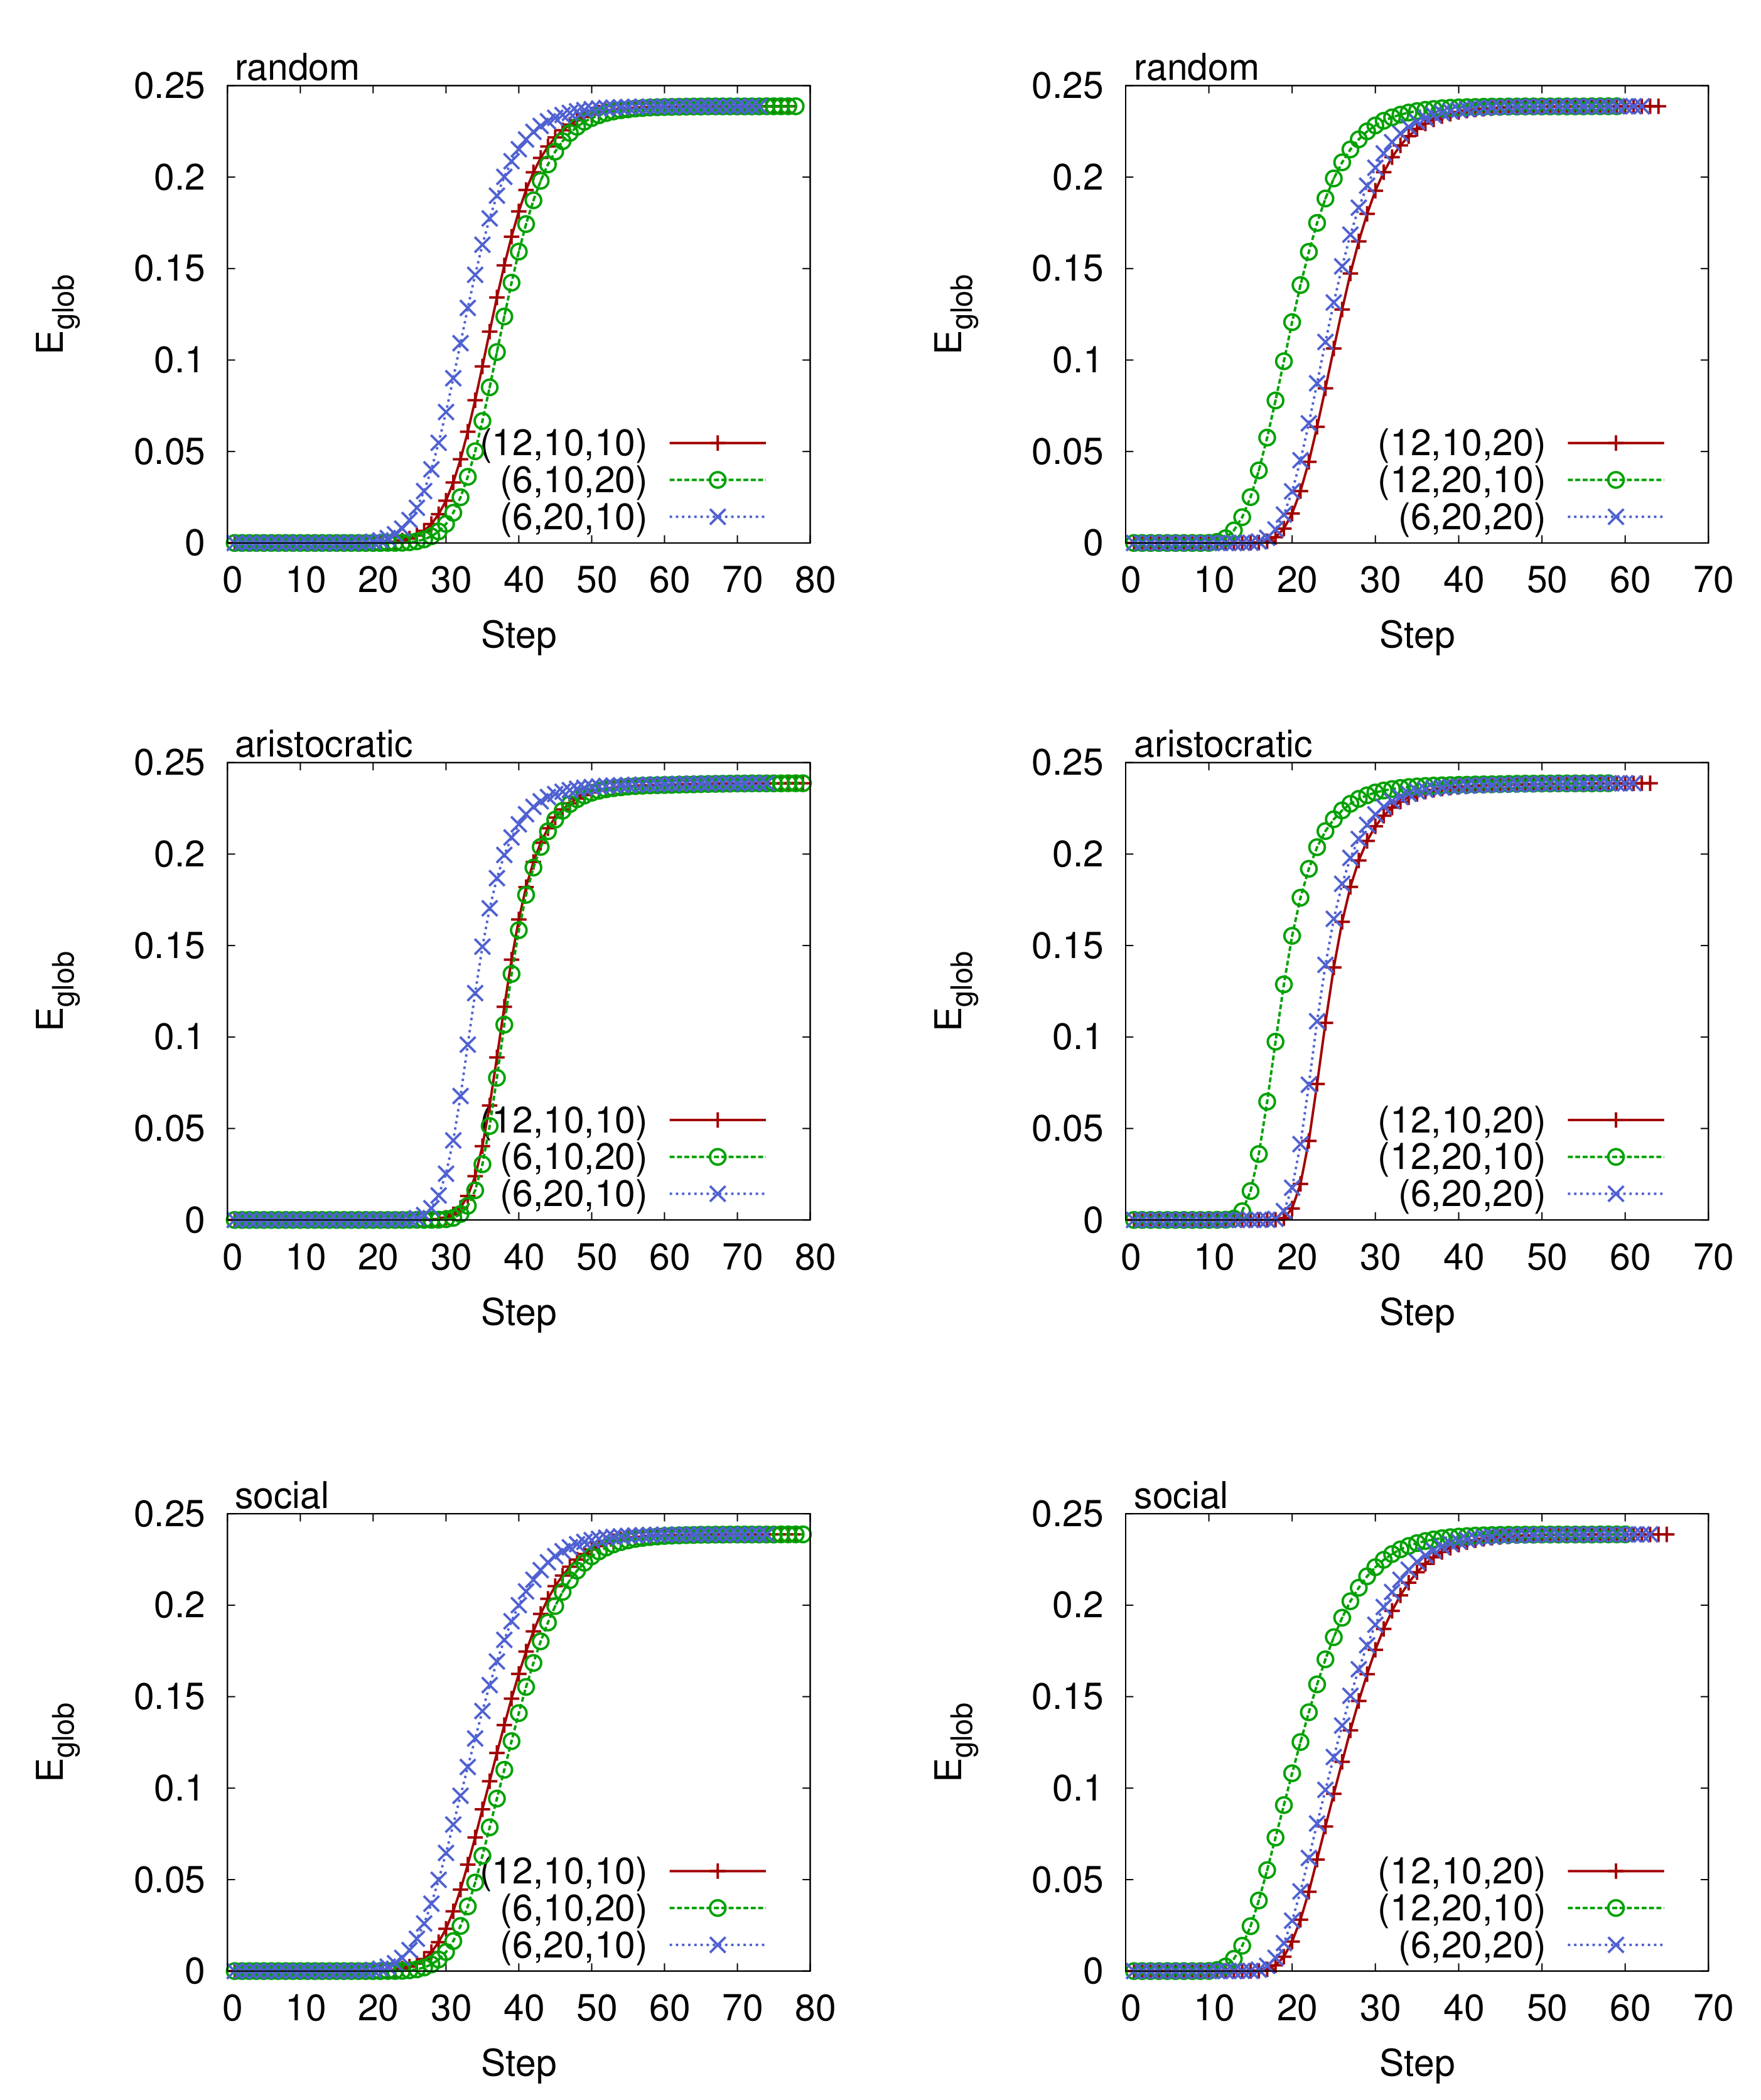
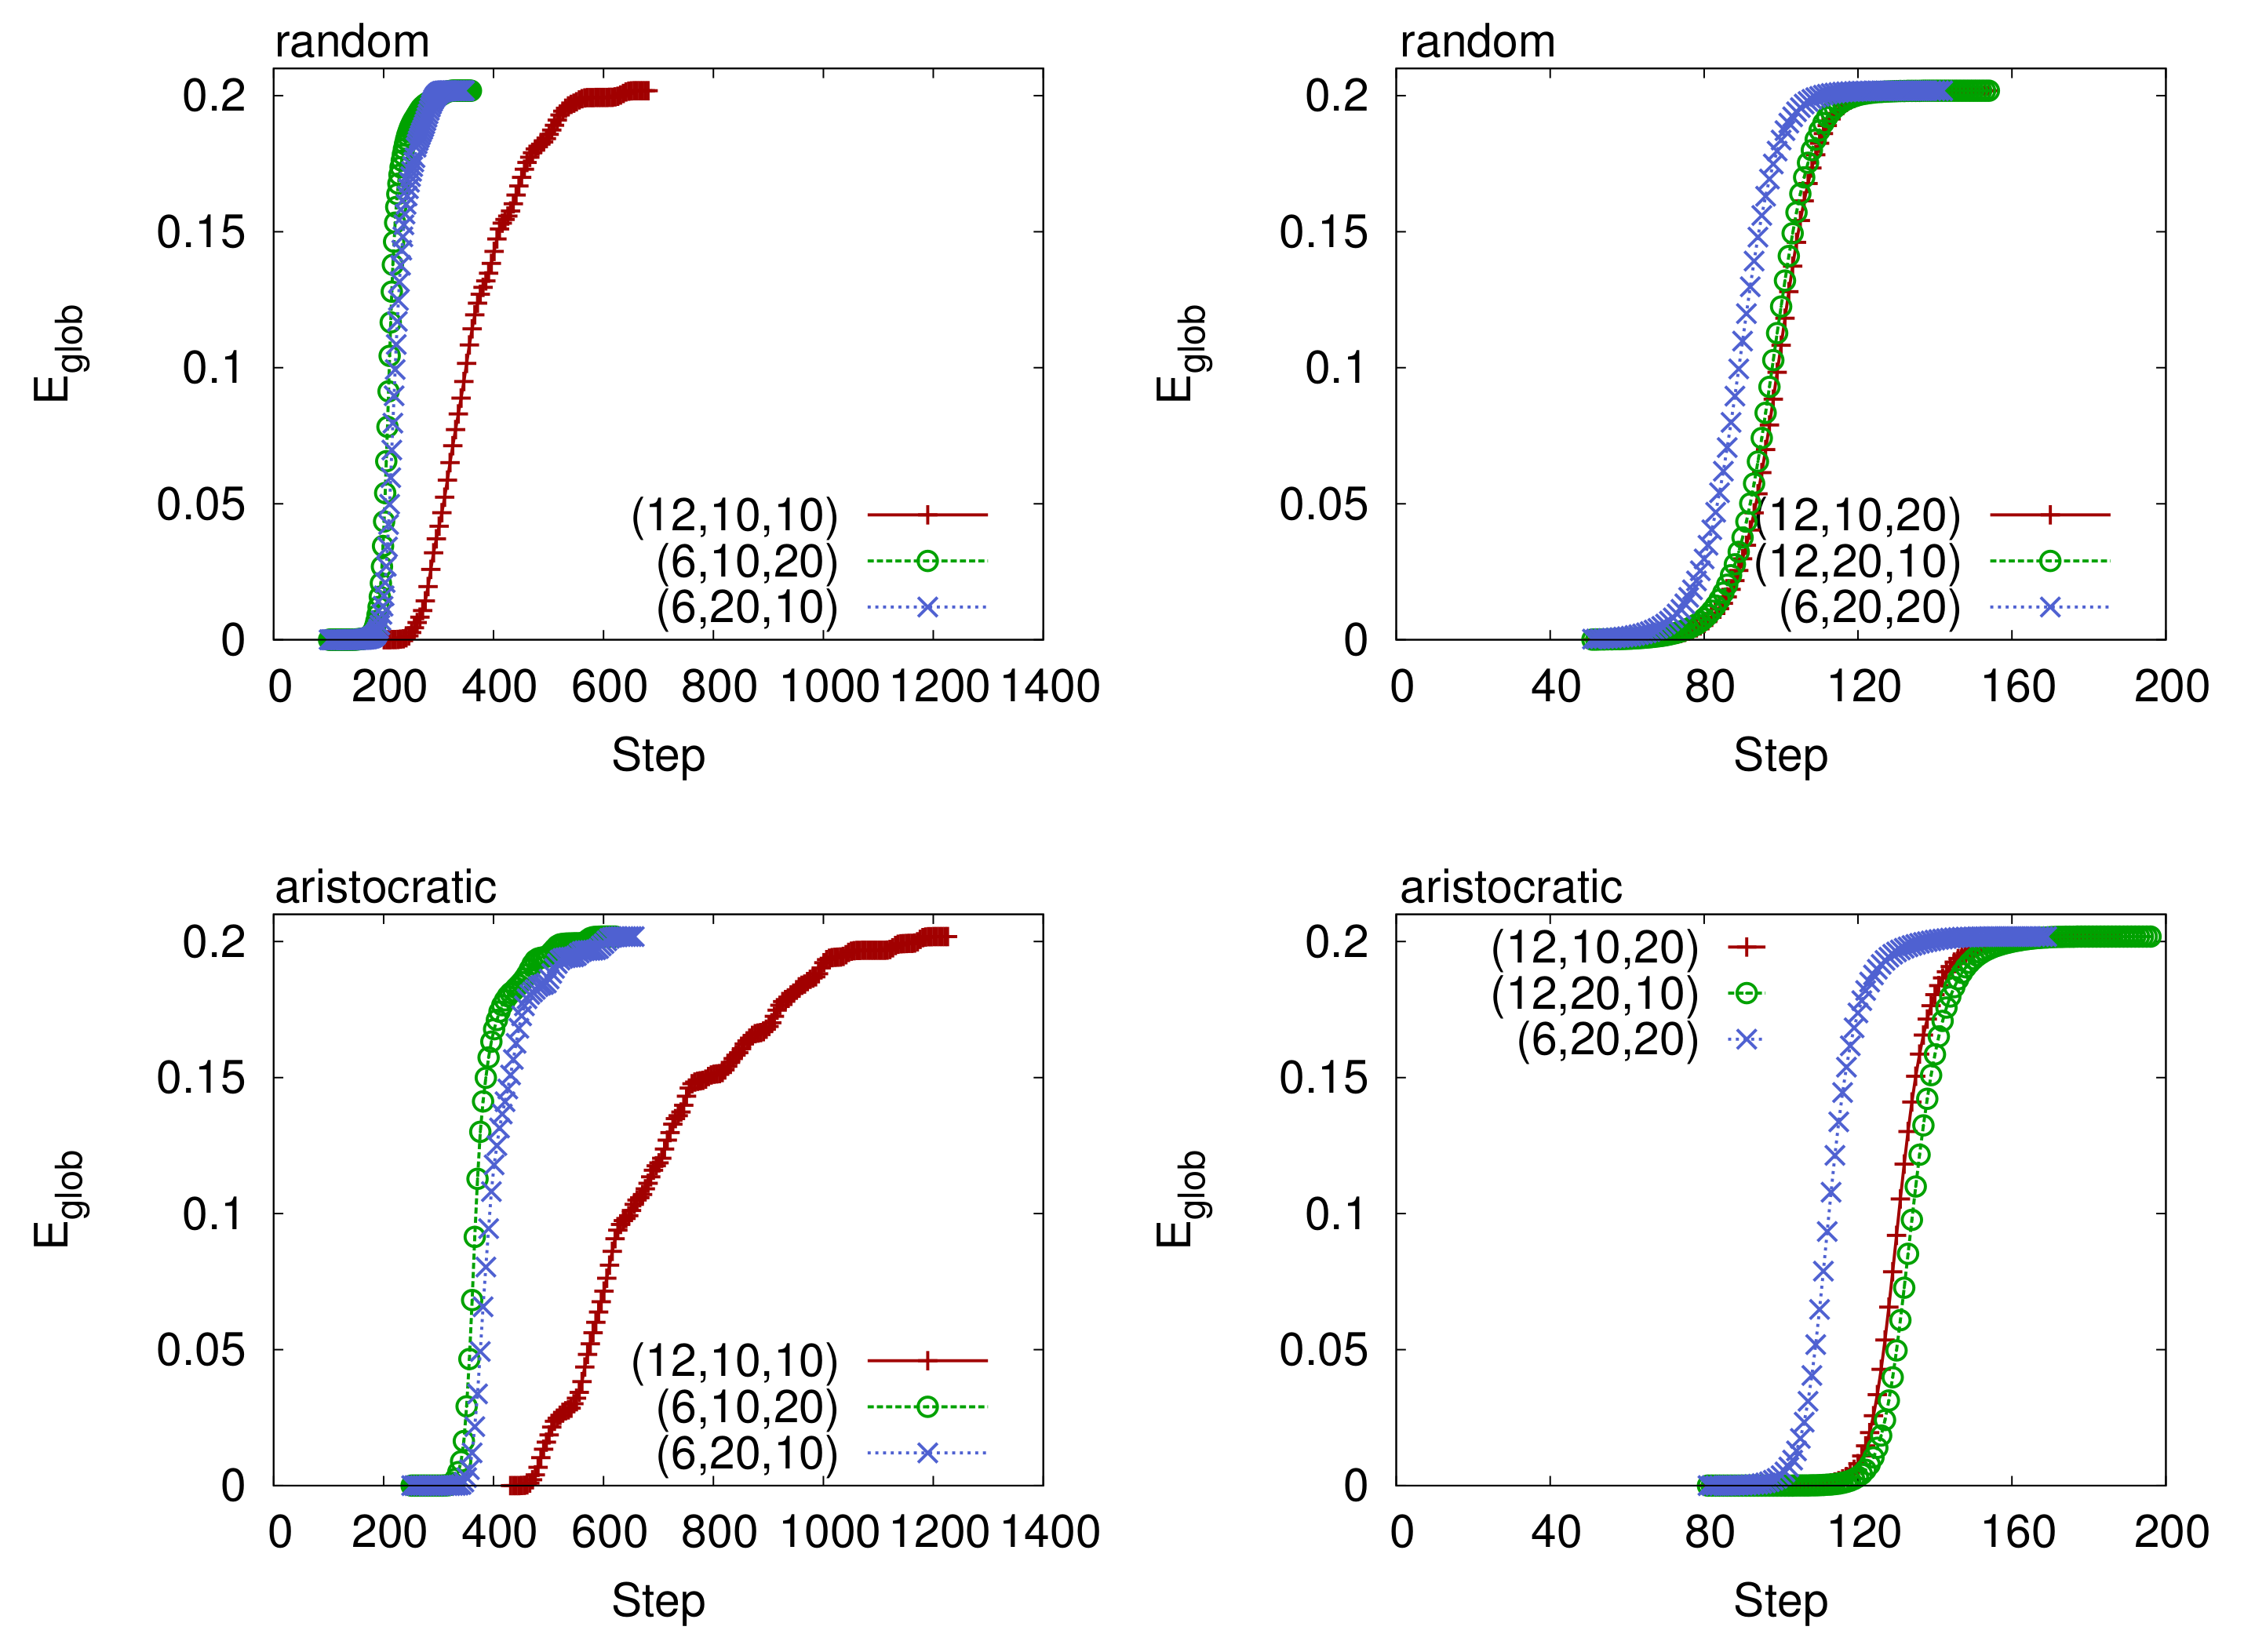
The figures describe the benefit of higher attractiveness for the same cost configurations of the Communities online social network. In particular, we selected broadcast model, random (top panels), and aristocratic (bottom panels) rules. Two cost levels have been considered: (left panels) and (right panels). Configurations and outperform the others and in this case network efficiency will start to increase earlier, regardless of the growing rule of the users’ network.
Figure 10.
The figures describe the benefit of higher attractiveness for the same cost configurations of the Communities online social network. In particular, we selected broadcast model, random (top panels), and aristocratic (bottom panels) rules. Two cost levels have been considered: (left panels) and (right panels). Configurations and outperform the others and in this case network efficiency will start to increase earlier, regardless of the growing rule of the users’ network.

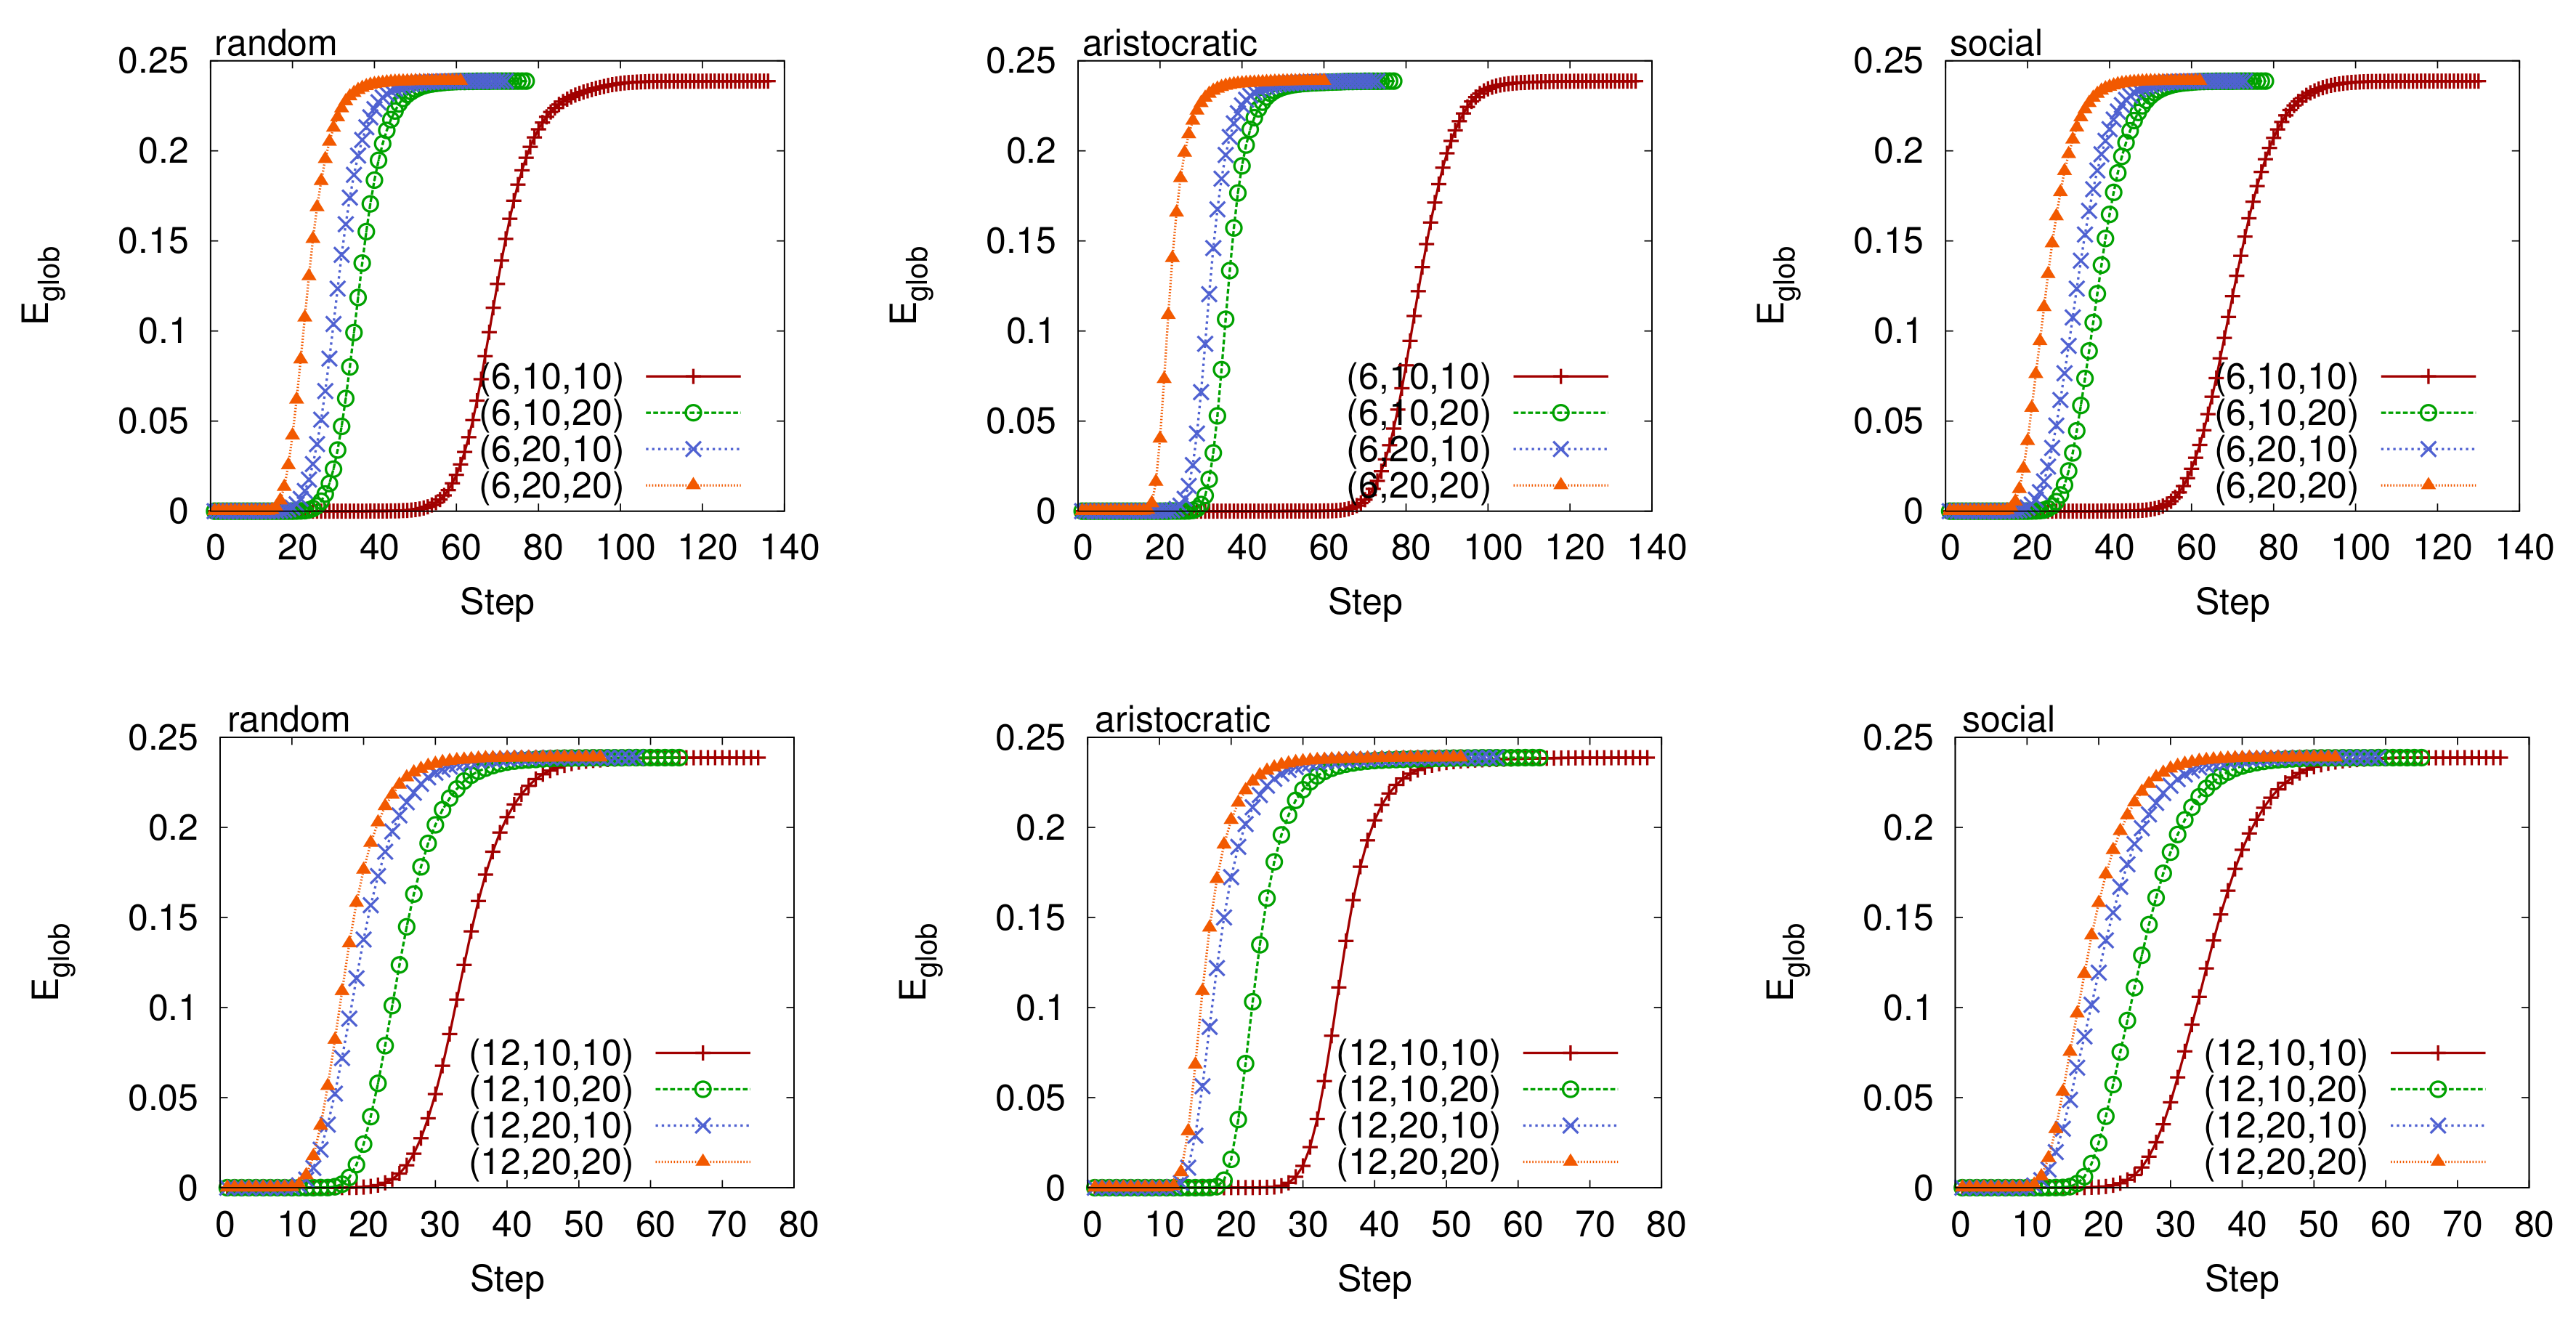
Figure 11.
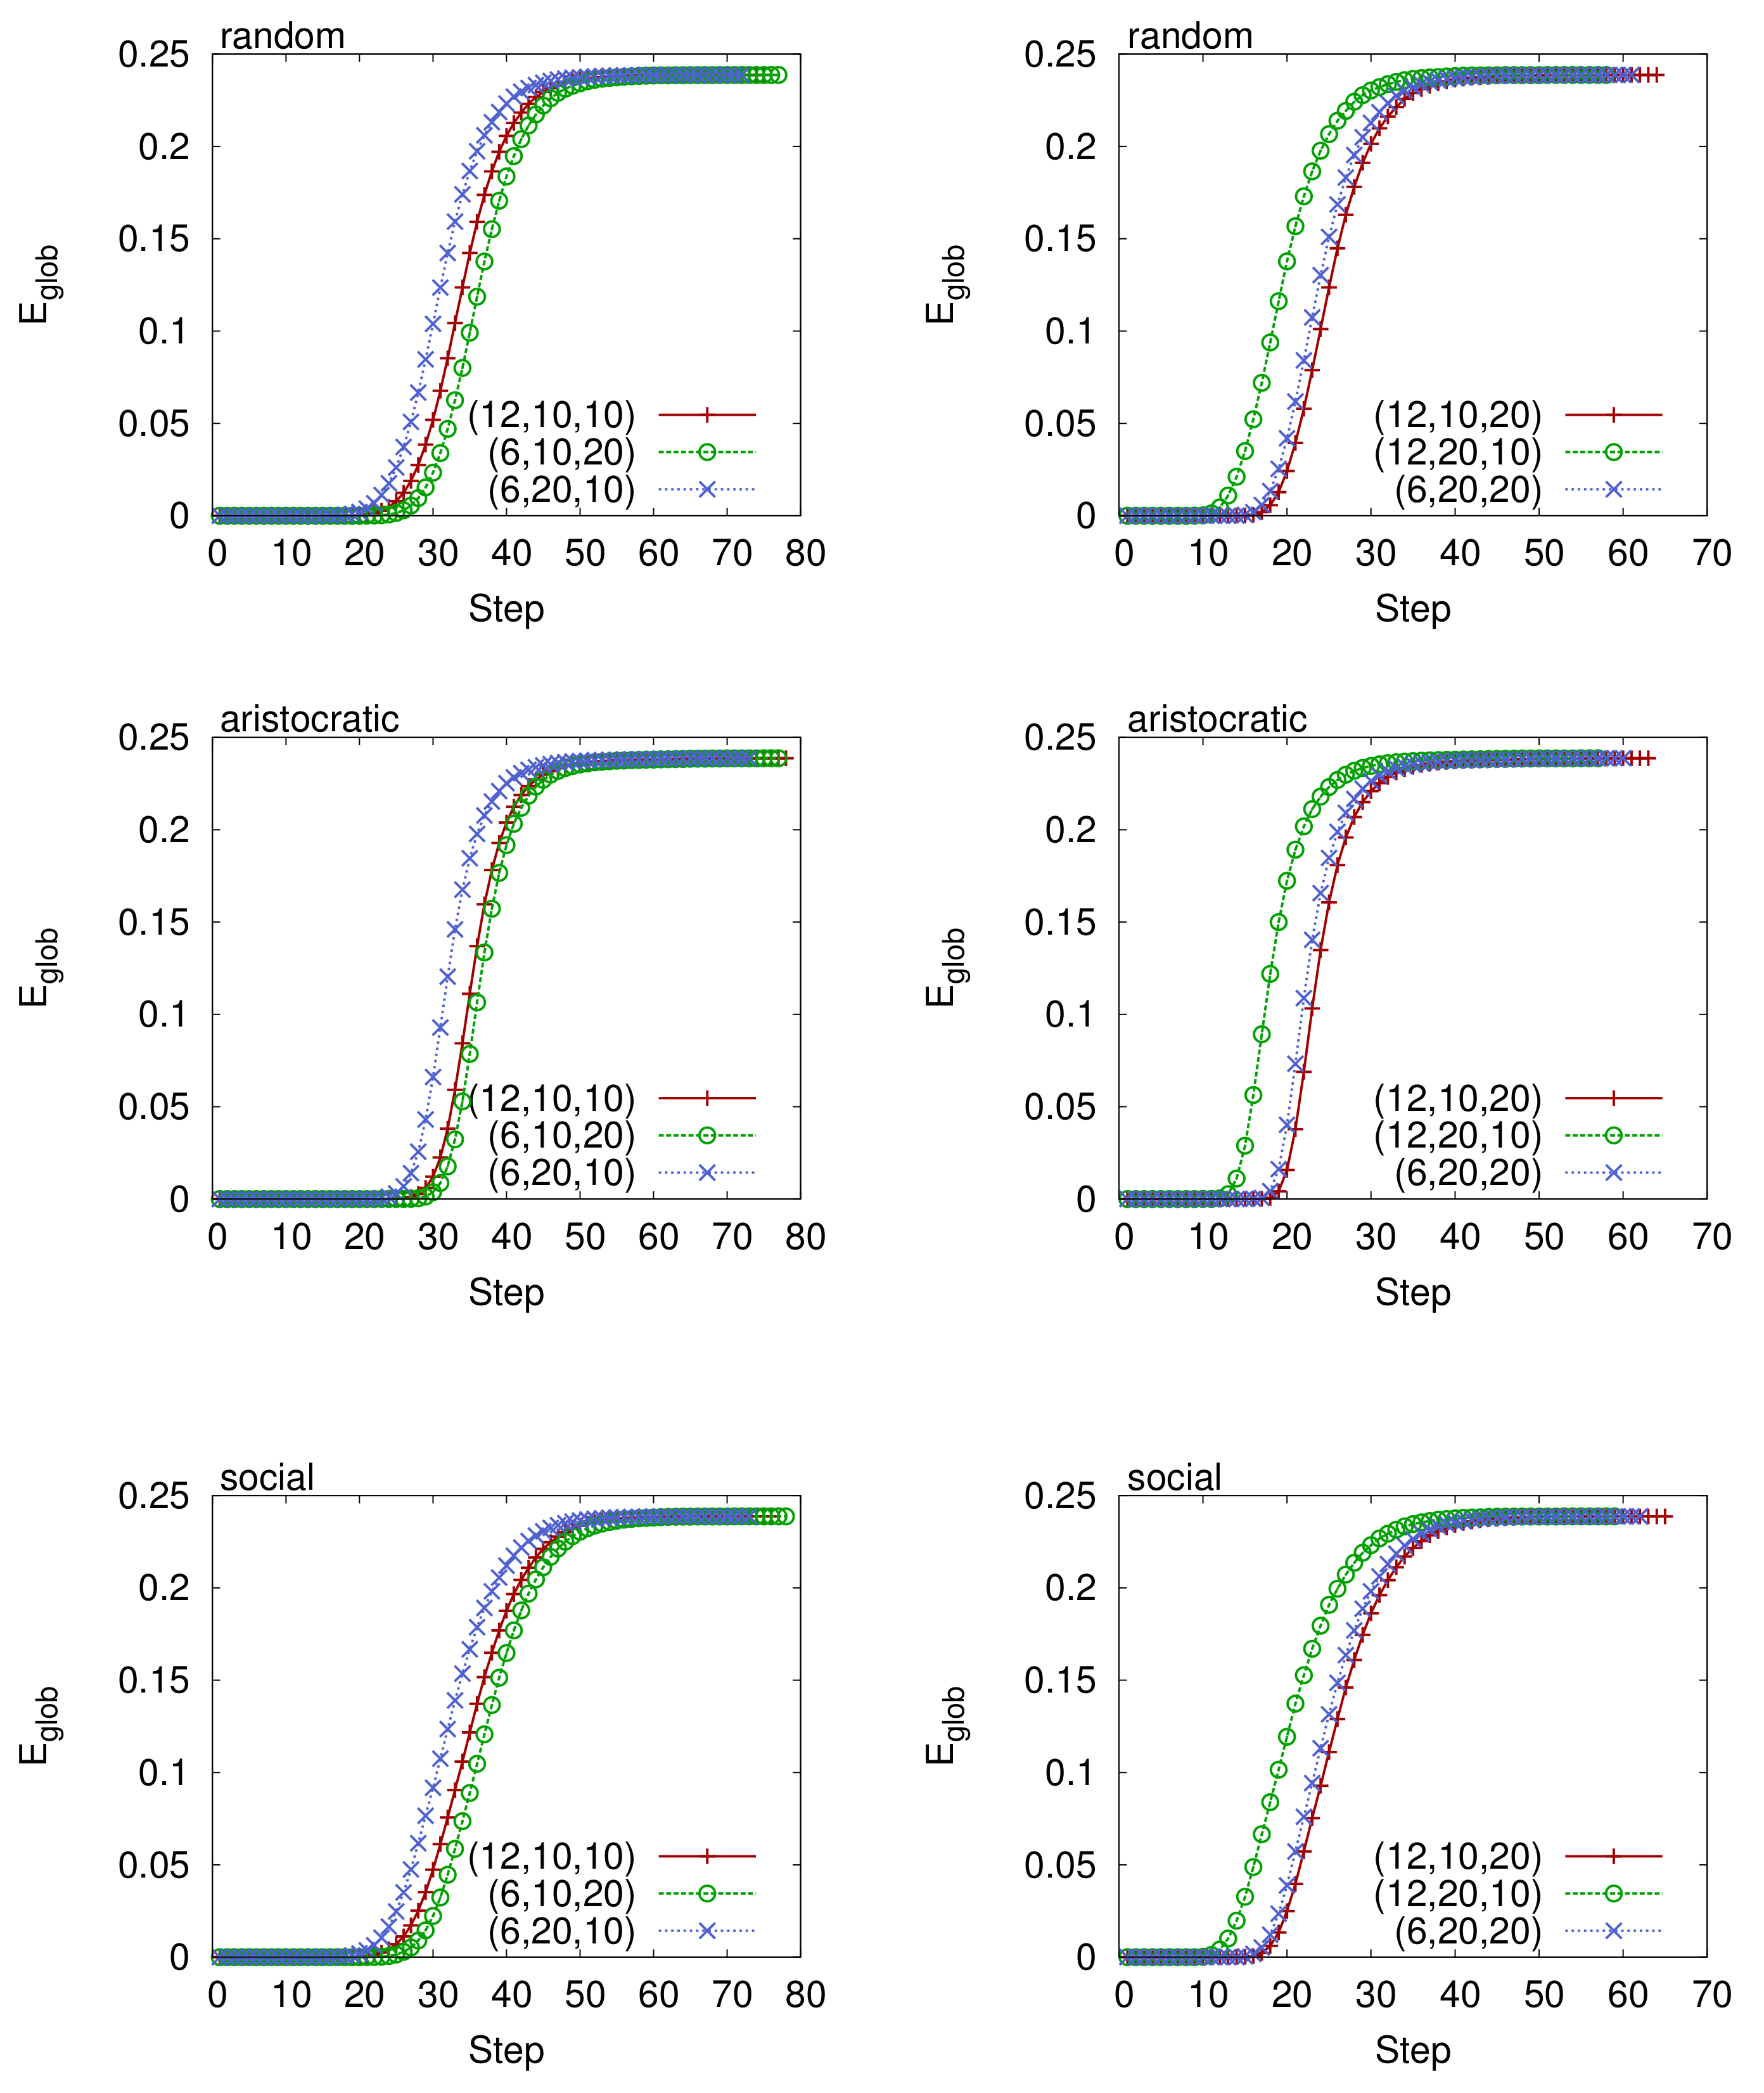
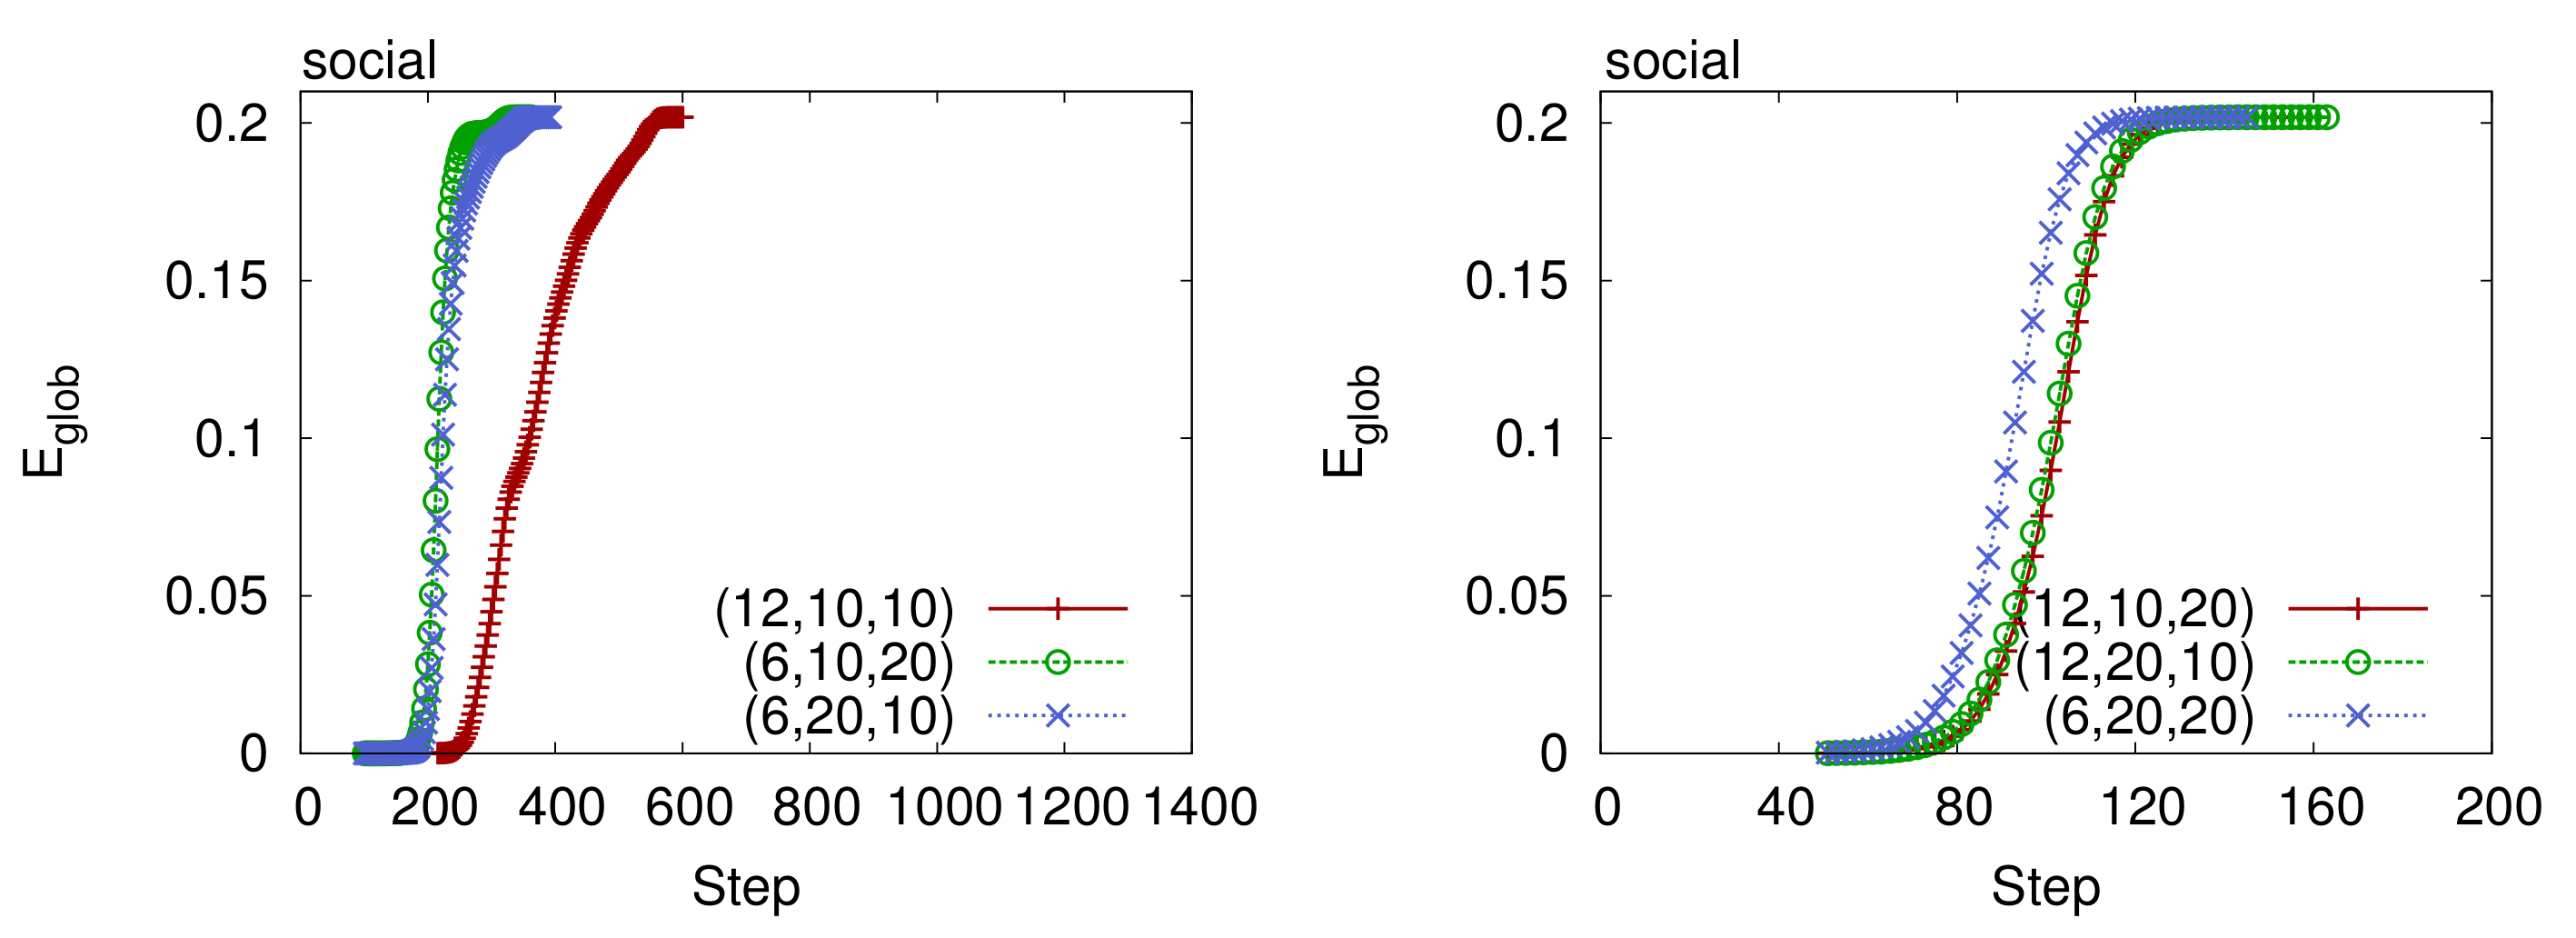
Comparison between the same cost of configurations of the Communities online social network. We consider two cost level (left panels), (right panels), and random, aristocratic, and social rules. All plots refer to the word of mouth model. We clearly see that network efficiency increases faster in configurations that have a higher value of attractiveness, no matter what cost level or rule has been selected.
Figure 11.
Comparison between the same cost of configurations of the Communities online social network. We consider two cost level (left panels), (right panels), and random, aristocratic, and social rules. All plots refer to the word of mouth model. We clearly see that network efficiency increases faster in configurations that have a higher value of attractiveness, no matter what cost level or rule has been selected.

Figure 12.
Accelerated analysis with mermaids, random, and aristocratic, social rules, preferential model, for the Communities social network with cost (left panels) and (right panels).
Figure 12.
Accelerated analysis with mermaids, random, and aristocratic, social rules, preferential model, for the Communities social network with cost (left panels) and (right panels).

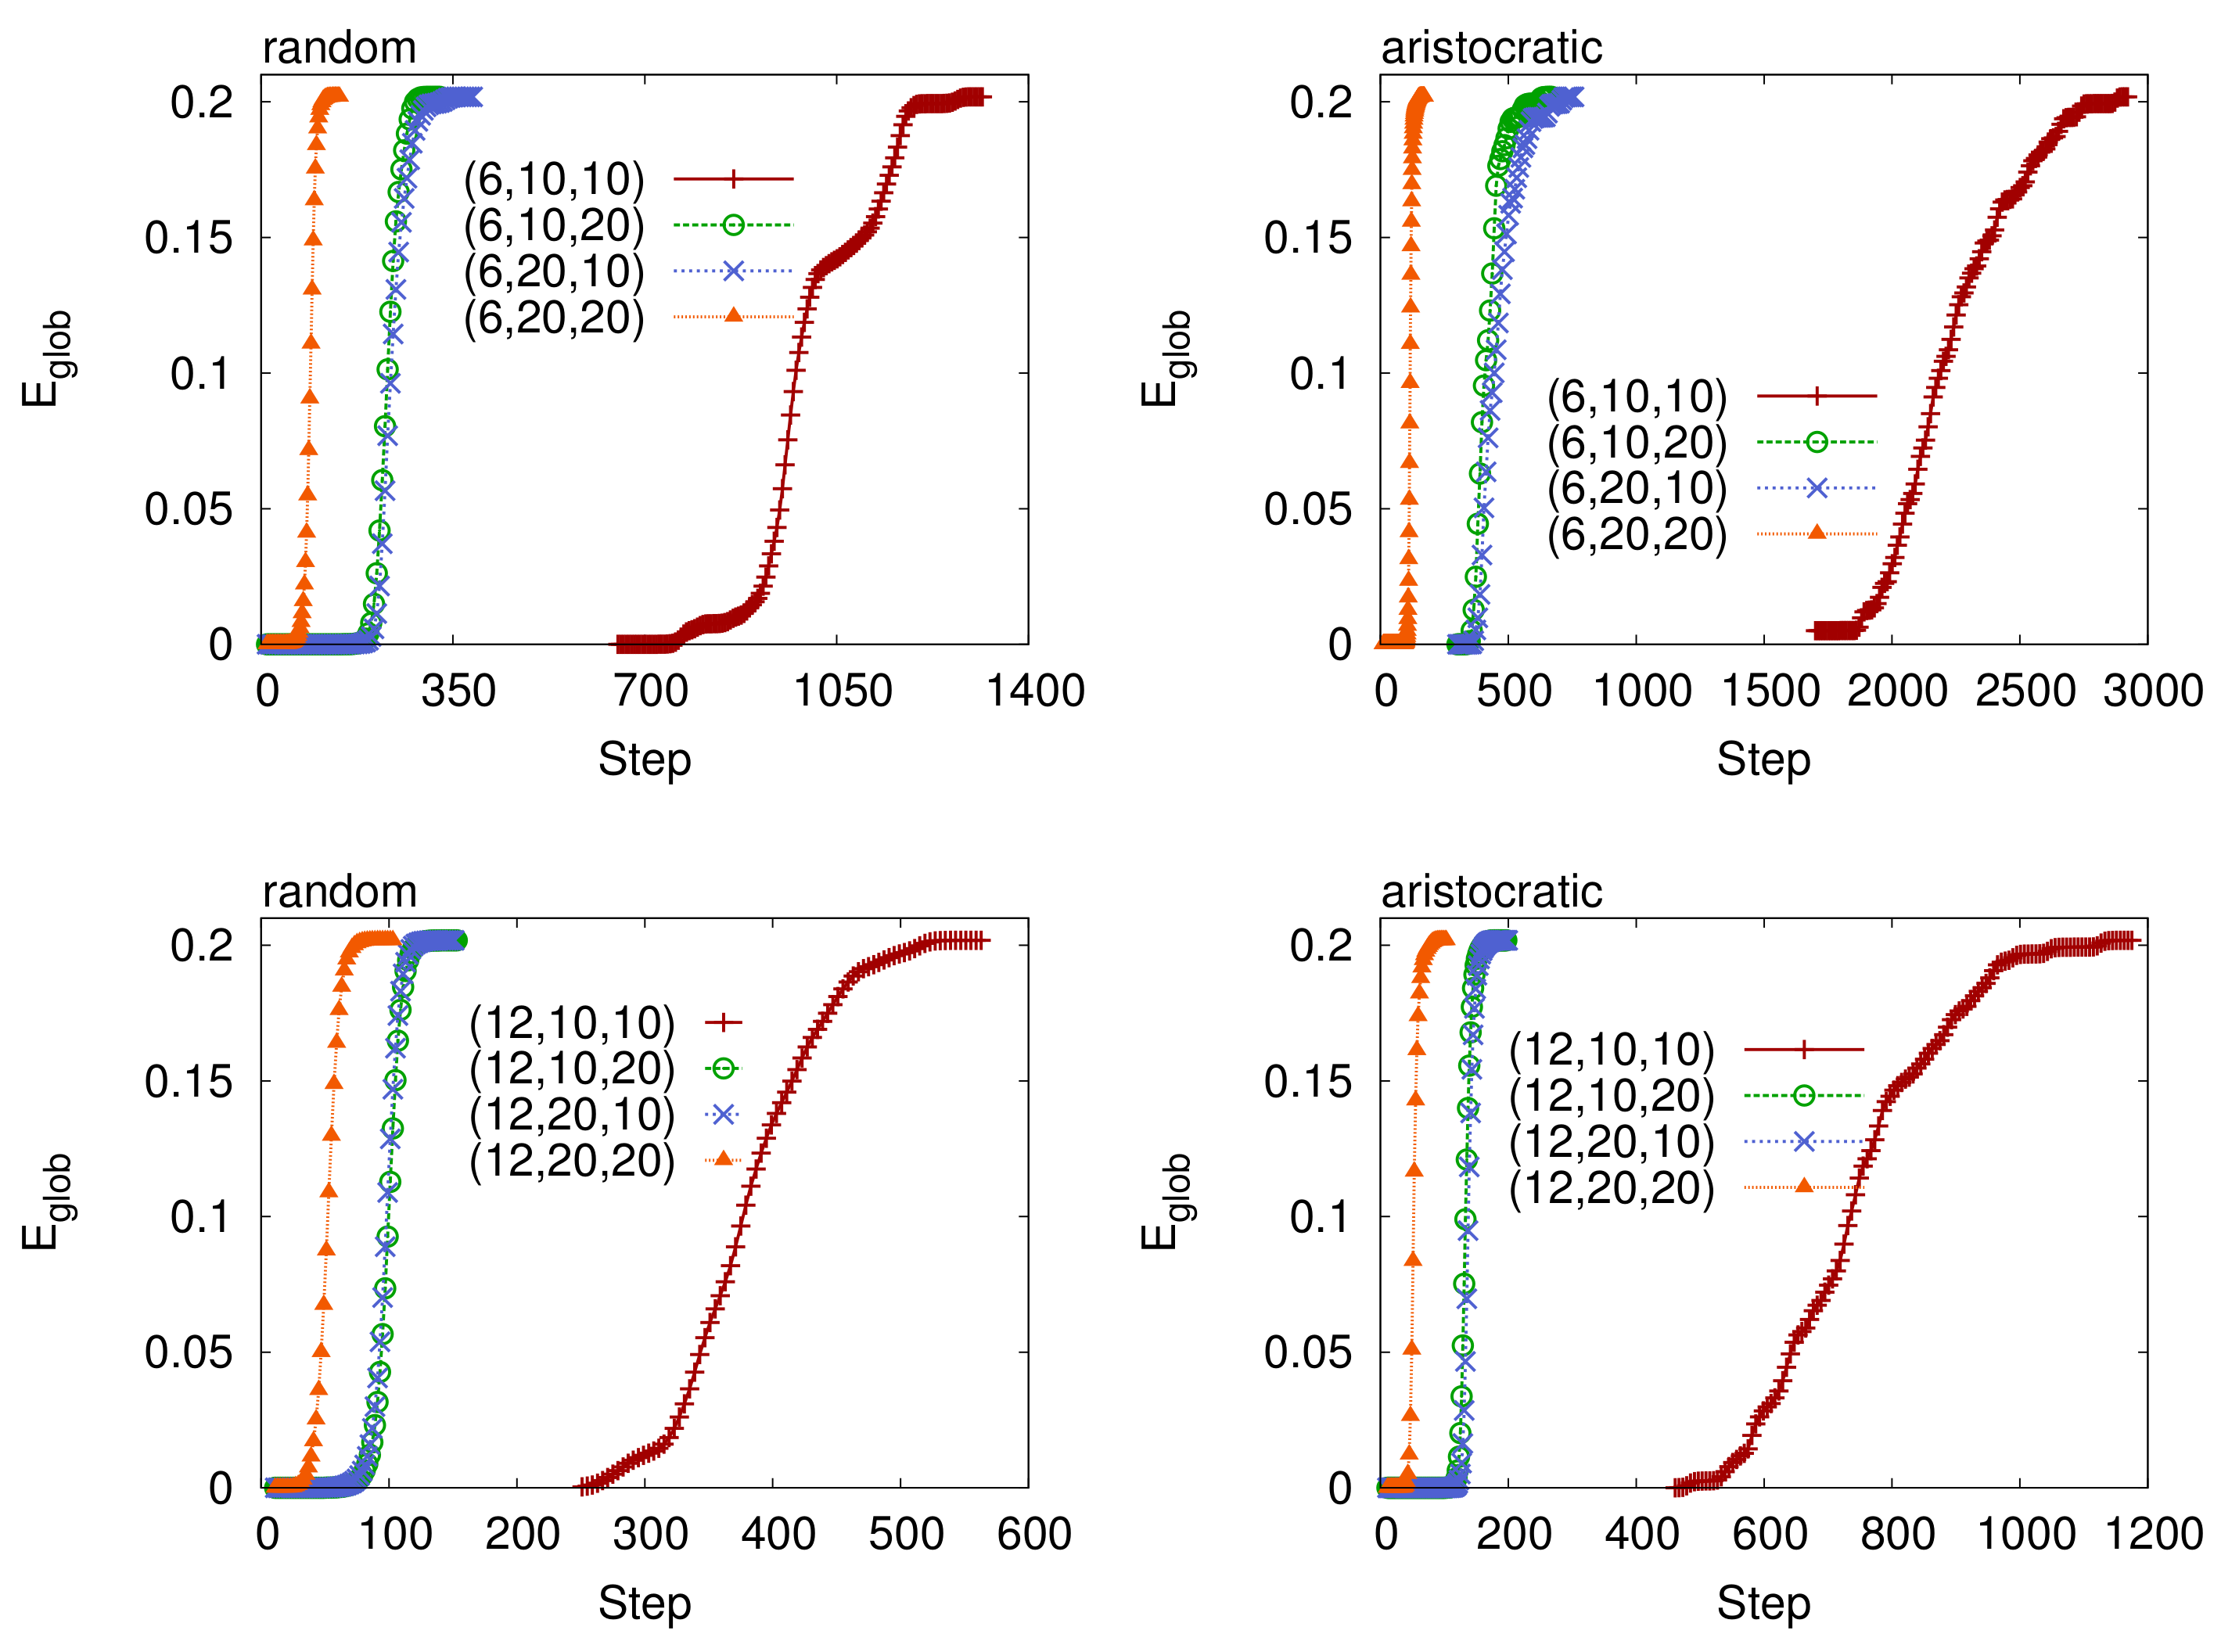
Figure 13.
Spread of curves over multiple runs of simulations (aristocratic rule) on the same VT dataset, with same cost configurations: in left panel (a), in center panel (b), in right panel (c).
Figure 13.
Spread of curves over multiple runs of simulations (aristocratic rule) on the same VT dataset, with same cost configurations: in left panel (a), in center panel (b), in right panel (c).

Figure 14.
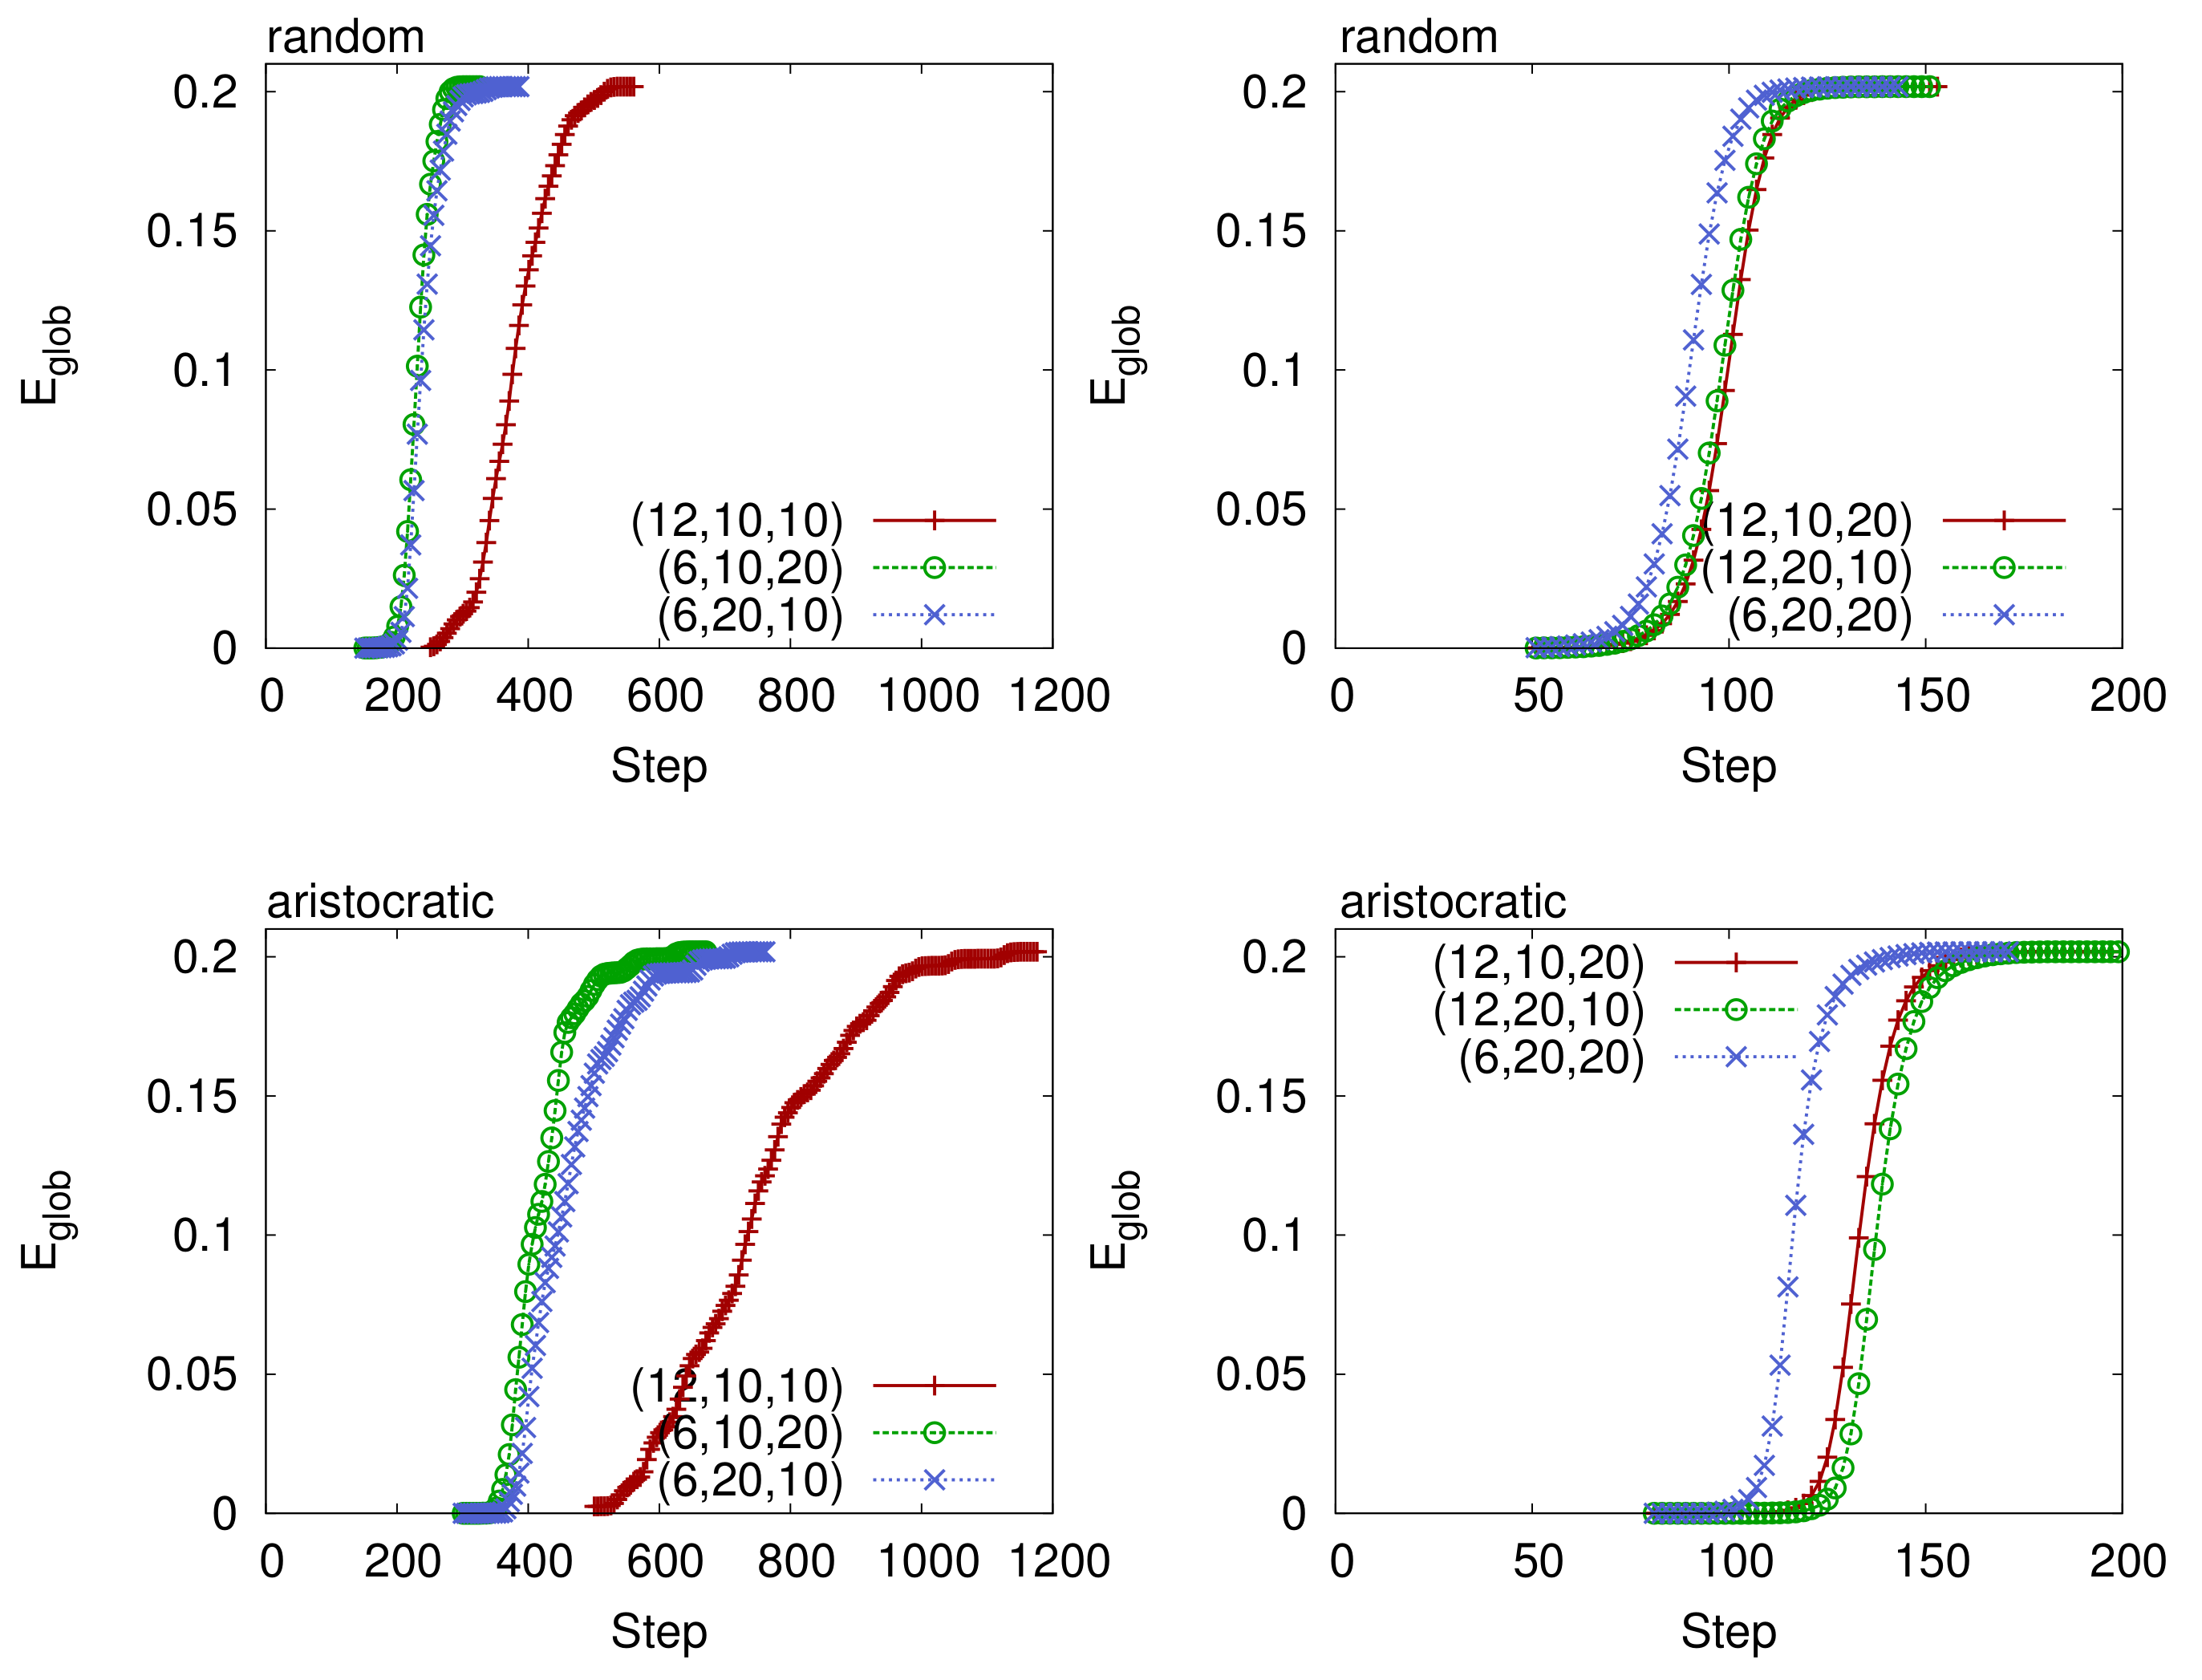
Behavior of the network’s with two different cost levels: (left panels) and (right panels) for the VirtualTourist social network, broadcast model. In total, six configurations are considered. The one that has higher attractiveness is the favored one because can reach the efficiency of the original network faster than the others.
Figure 14.
Behavior of the network’s with two different cost levels: (left panels) and (right panels) for the VirtualTourist social network, broadcast model. In total, six configurations are considered. The one that has higher attractiveness is the favored one because can reach the efficiency of the original network faster than the others.

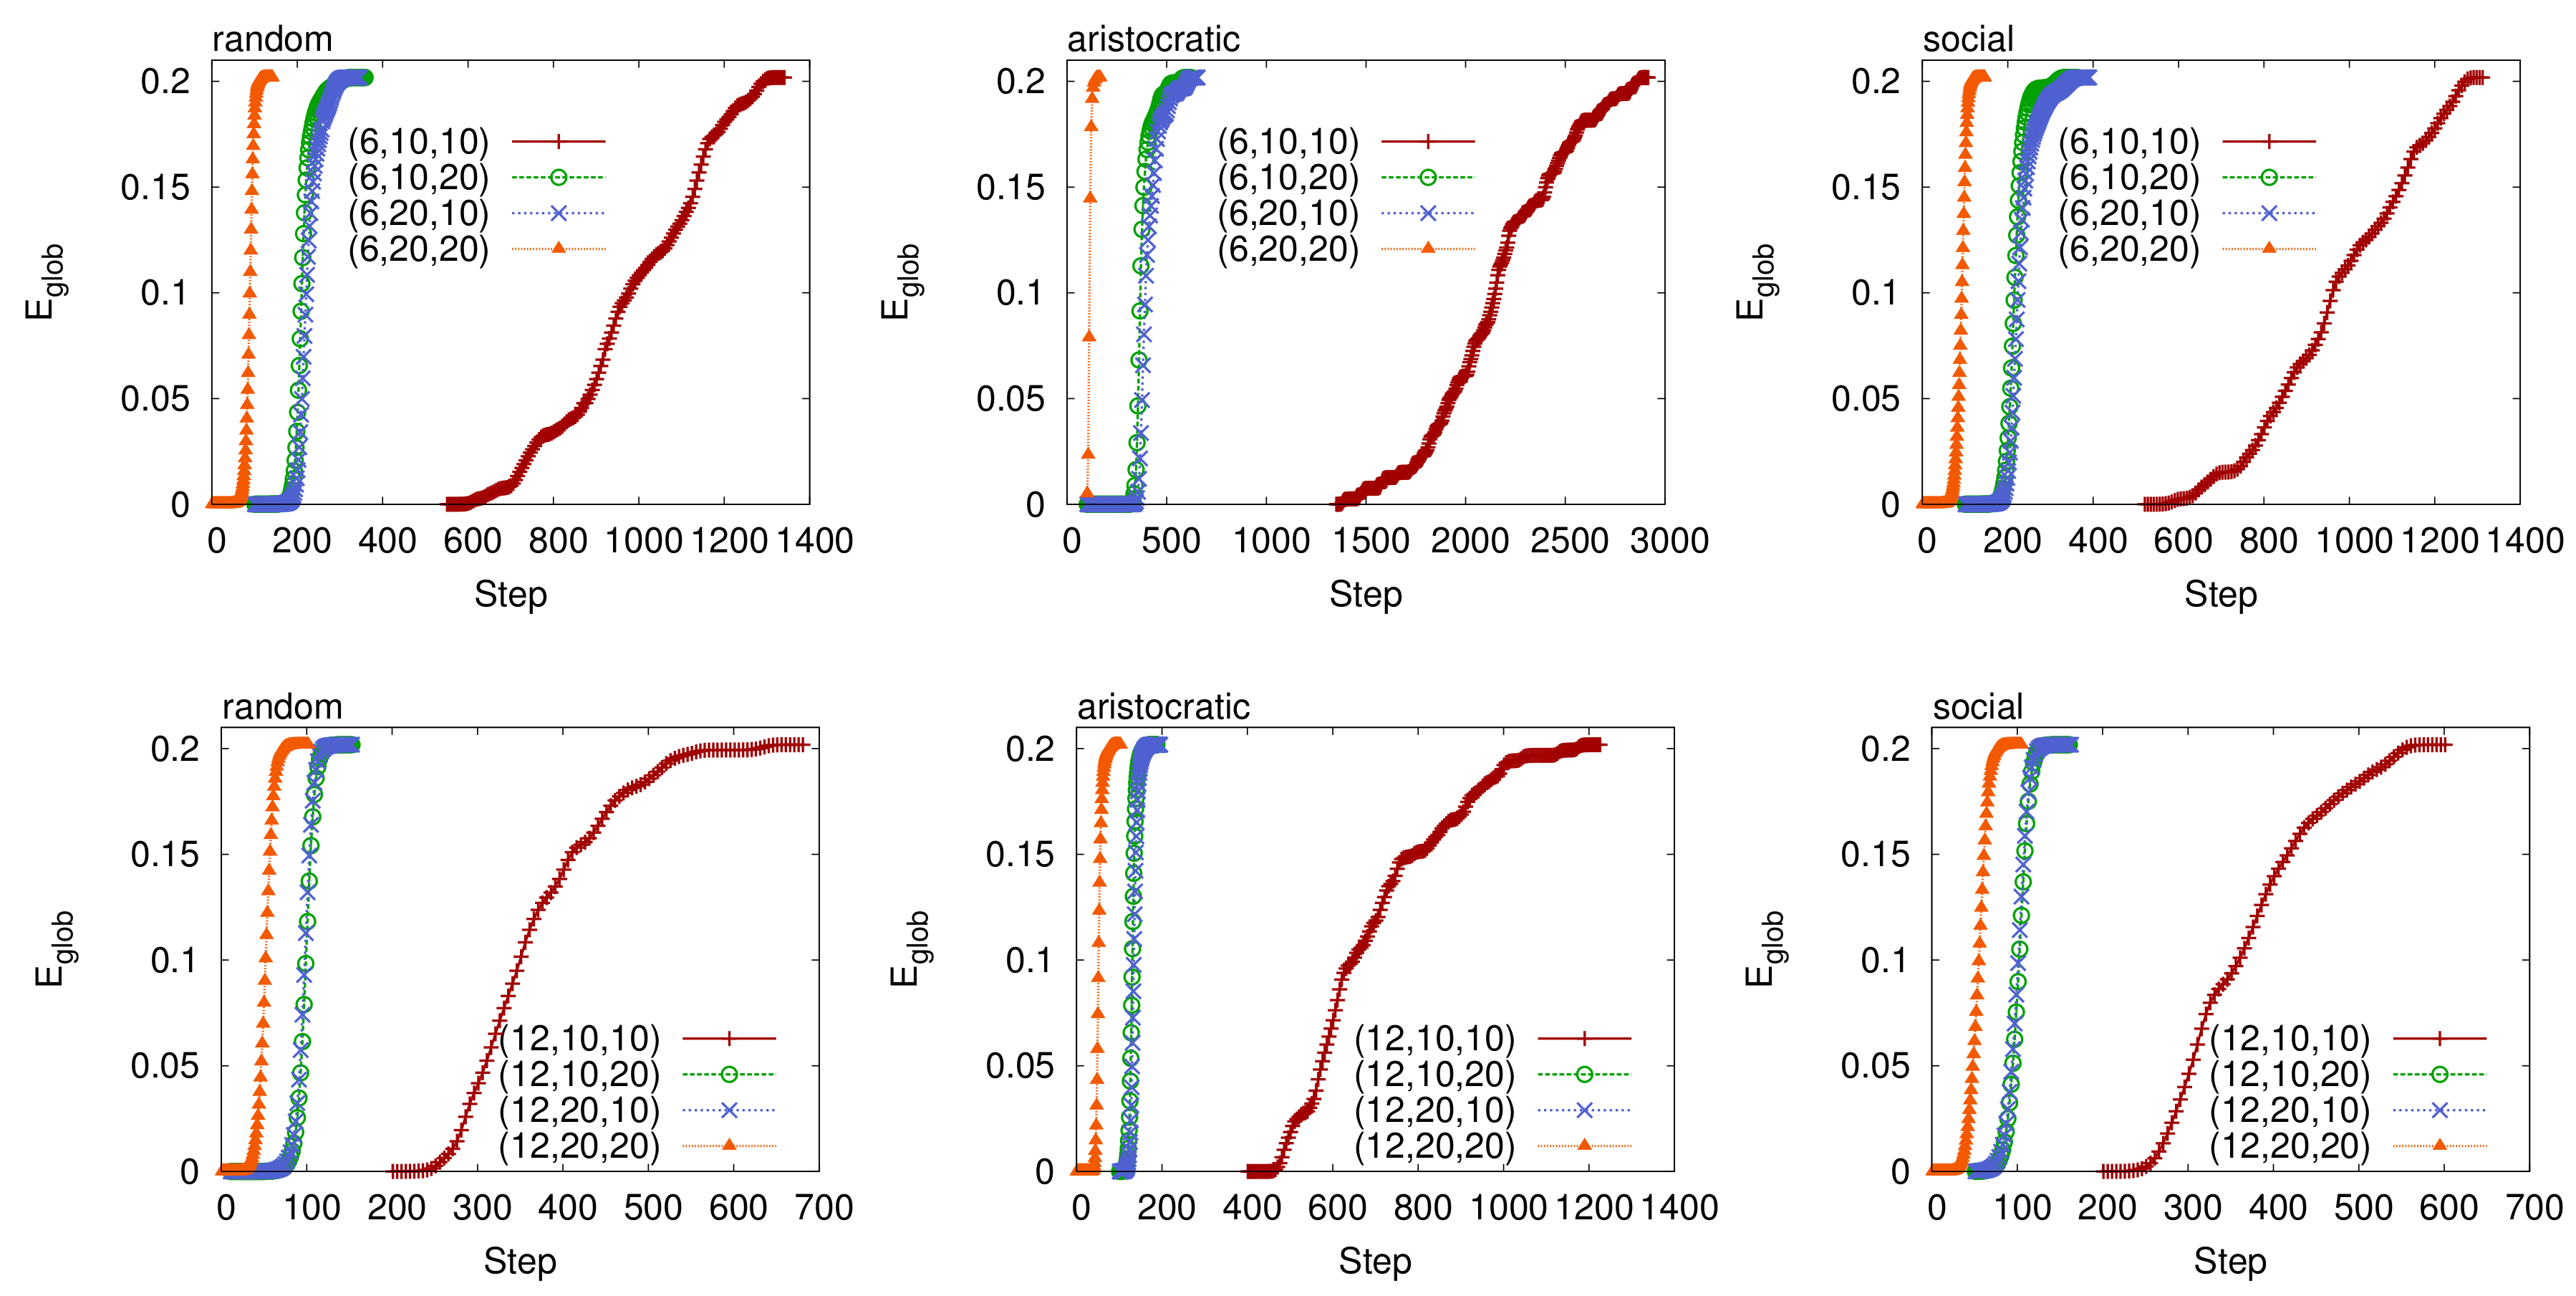
Figure 15.
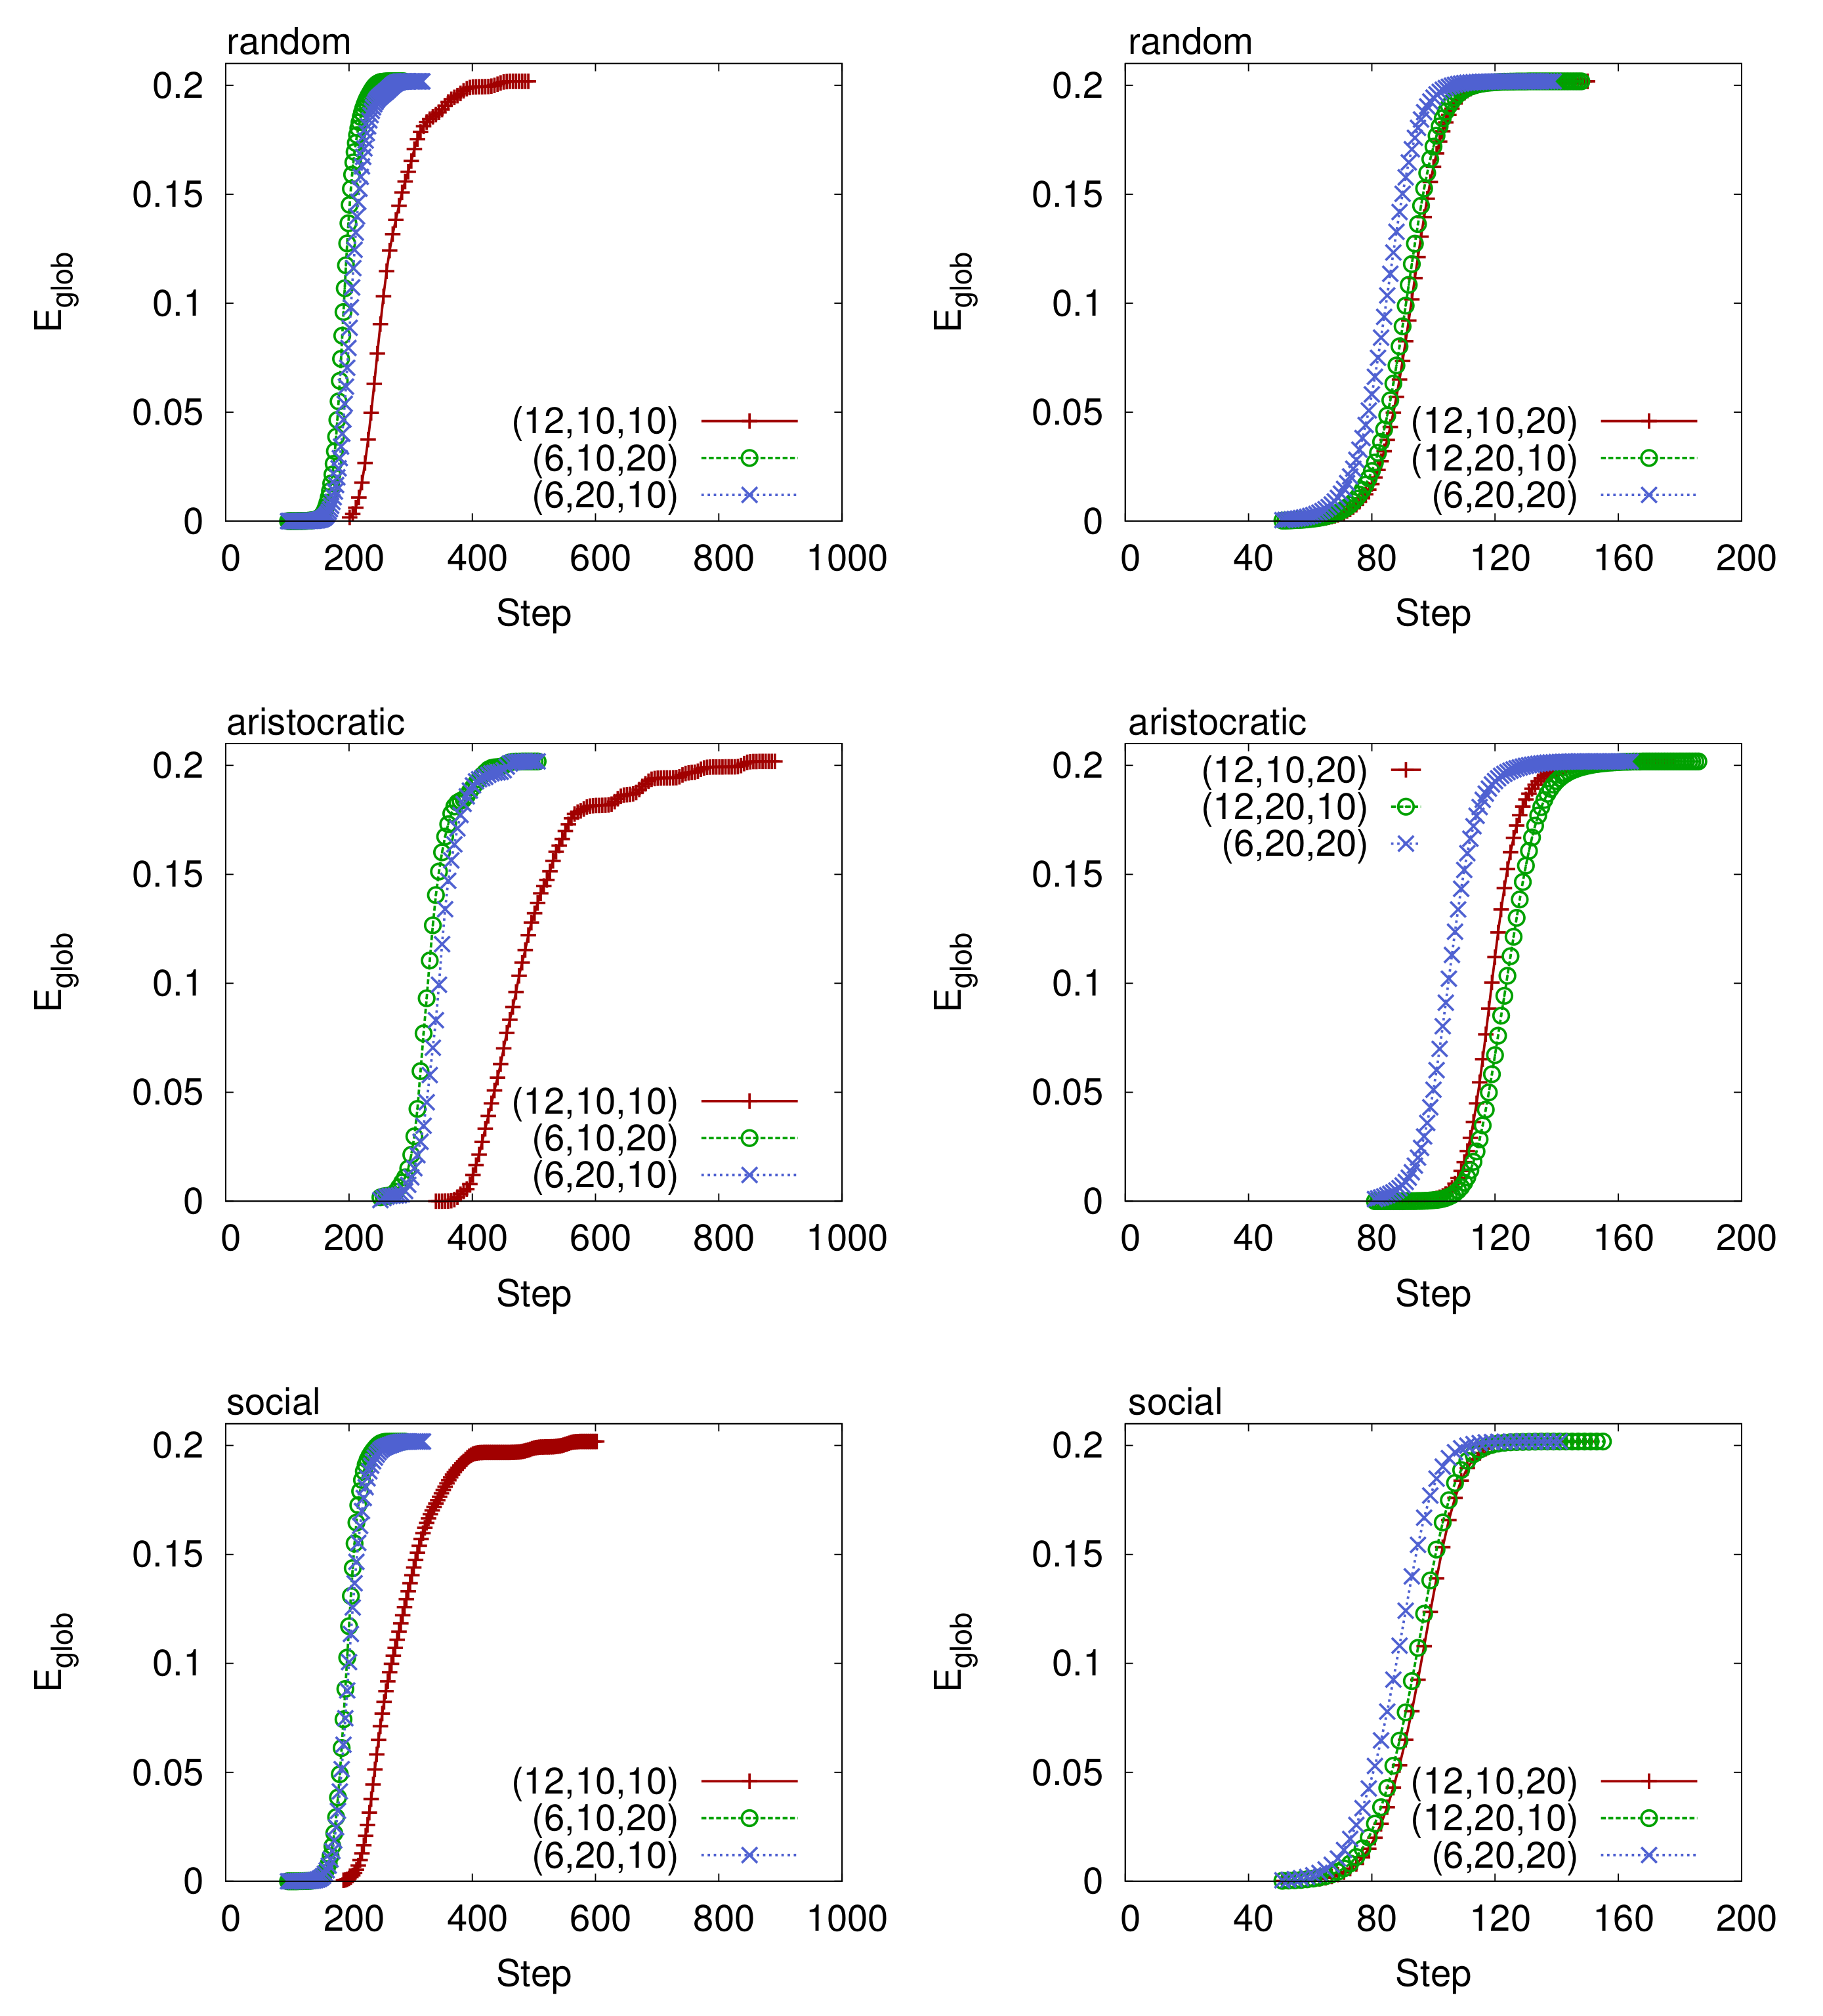
Same cost configurations for VirtualTourist, Cs = 1200 (left panels) and Cs = 2400 (right panels), word of mouth model. For each cost Cs, three configurations are then considered. In all experiments, the configuration that performs better is the one that has fewer mermaids and higher attractiveness (or equivalently that last more). In accordance with the results of accelerated analysis with no mermaids (Figure 7), random and social rules attain the target efficiency in fewer steps than the aristocratic rule.
Figure 15.
Same cost configurations for VirtualTourist, Cs = 1200 (left panels) and Cs = 2400 (right panels), word of mouth model. For each cost Cs, three configurations are then considered. In all experiments, the configuration that performs better is the one that has fewer mermaids and higher attractiveness (or equivalently that last more). In accordance with the results of accelerated analysis with no mermaids (Figure 7), random and social rules attain the target efficiency in fewer steps than the aristocratic rule.


Figure 16.
Accelerated analysis with mermaids, random, aristocratic, and social rules, preferential model, in the VirtualTourist social network with cost equal to (left panels) and (right panels). We clearly see that the configurations with higher attractiveness reach faster the target efficiency, regardless of the users’ growing rules.

Figure 17.
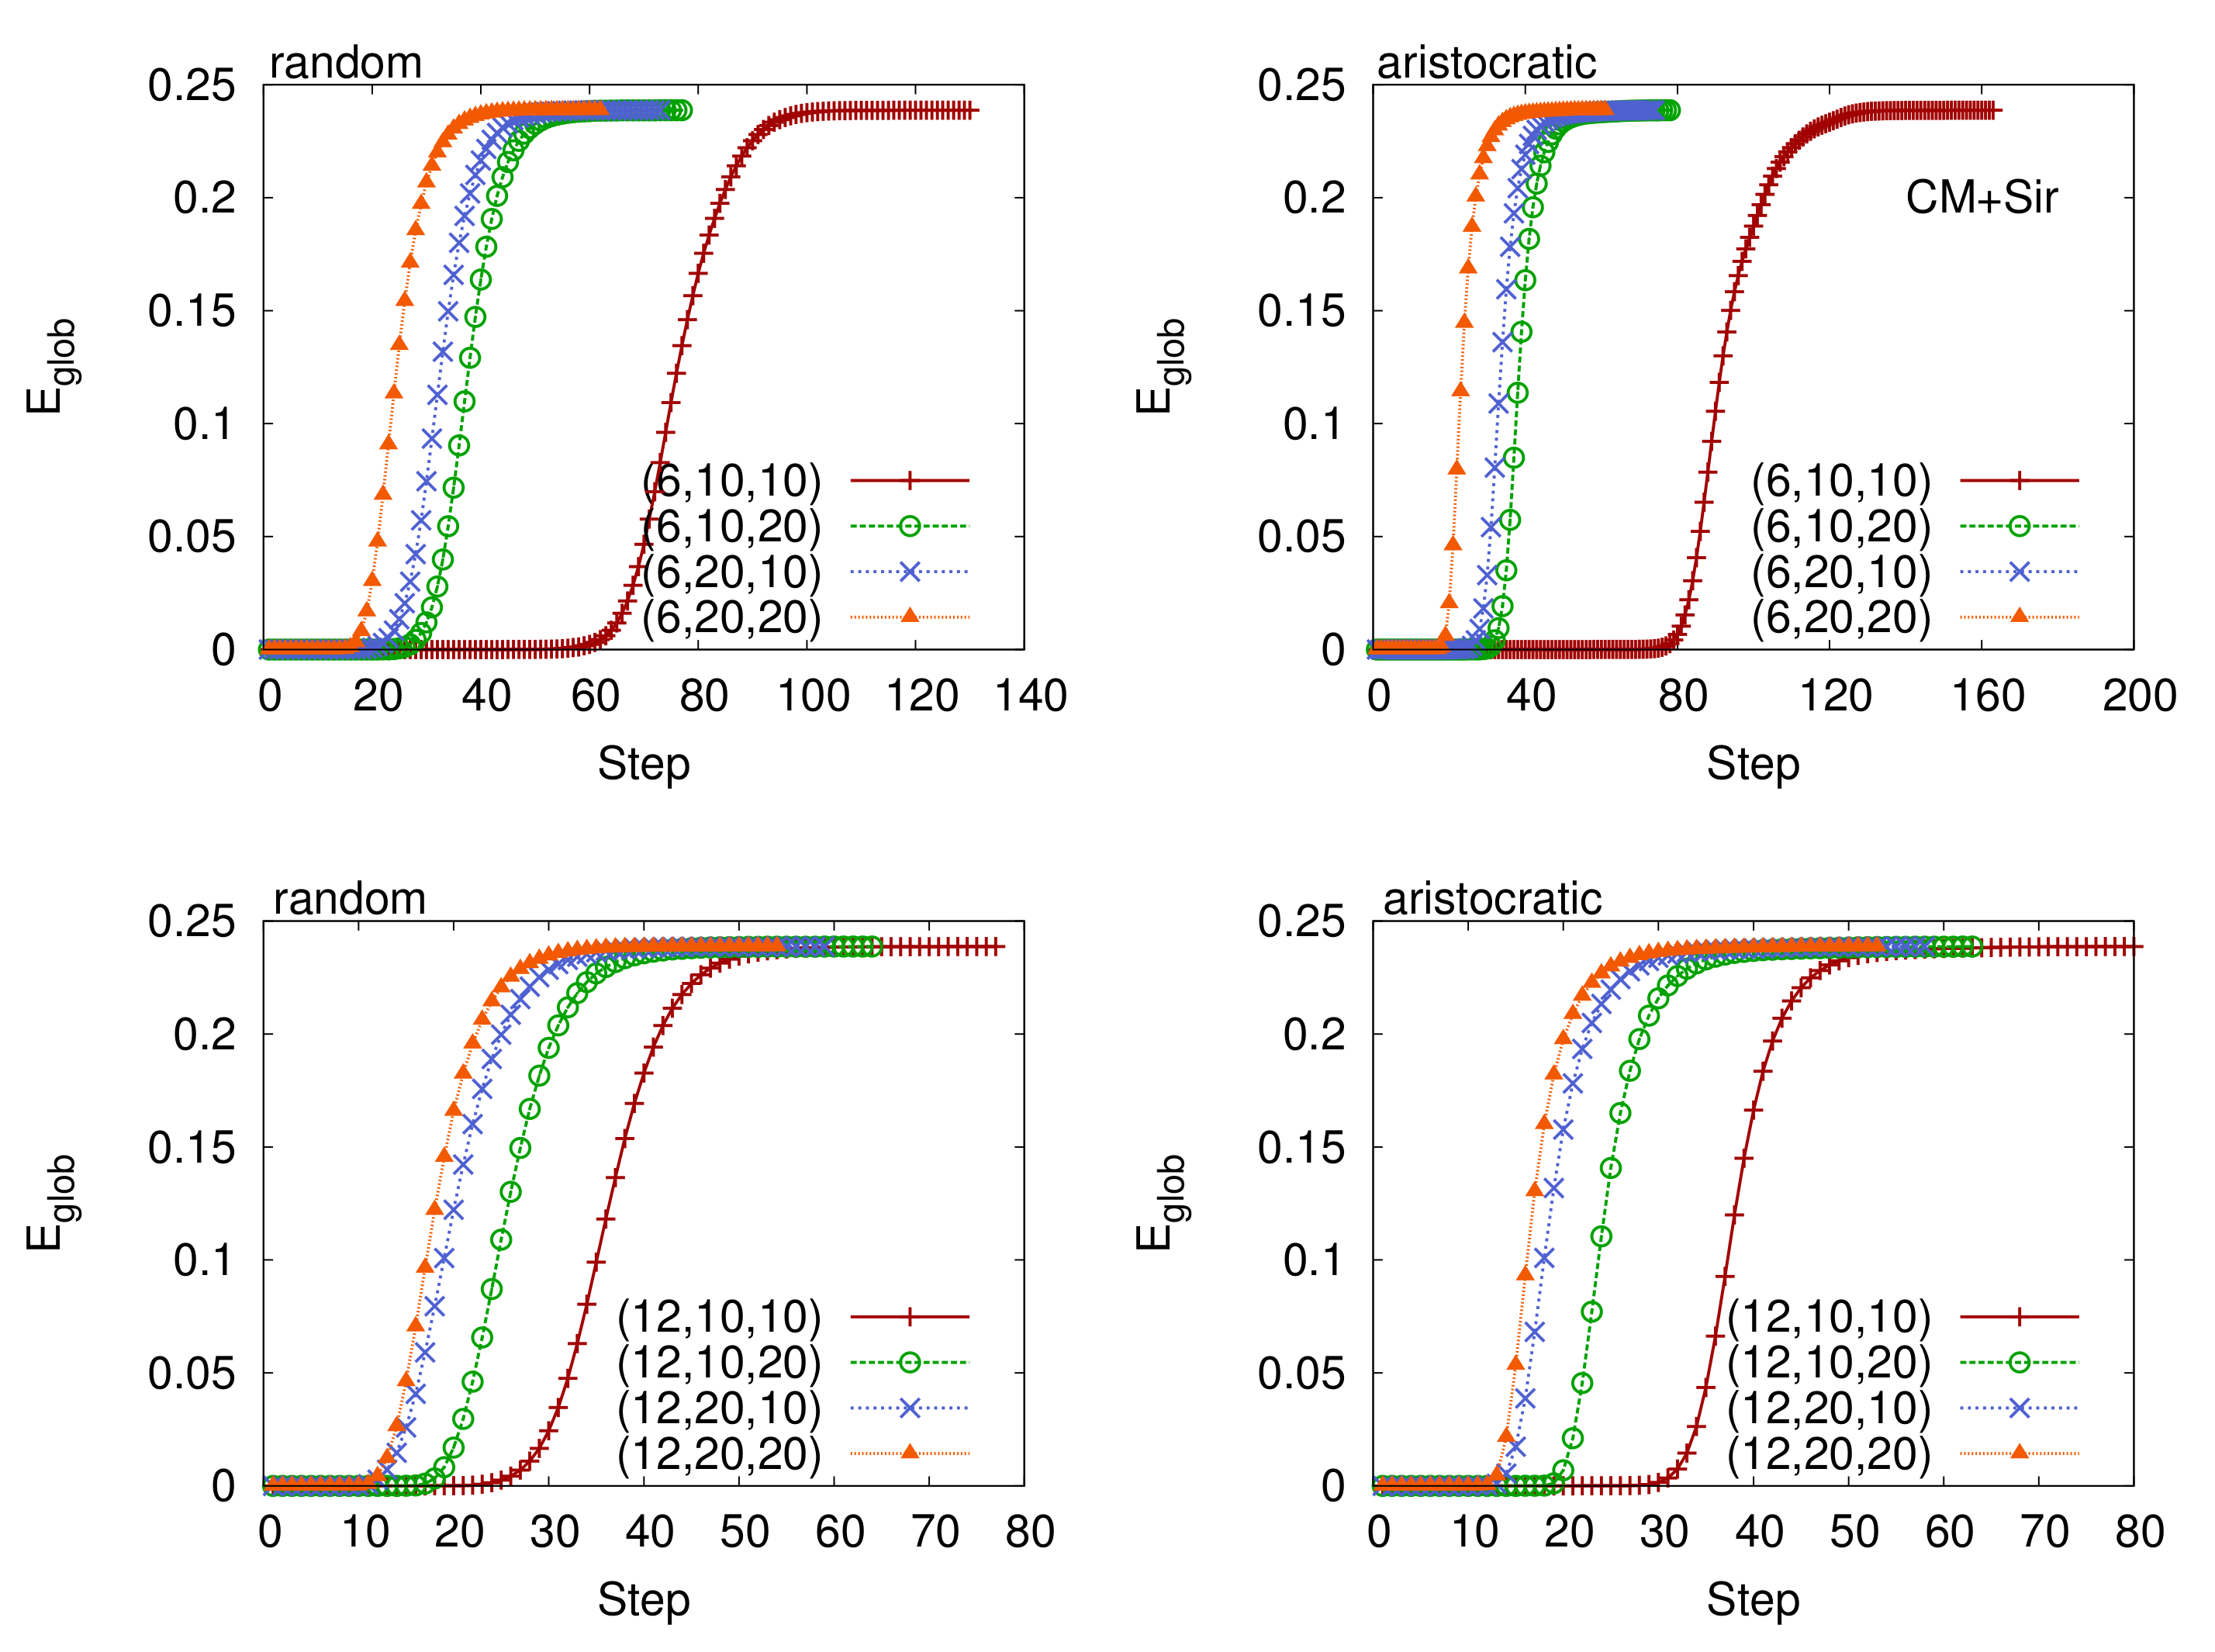
Accelerated analysis with mermaids, broadcast model (for mermaids’ dynamics), Communities online social network, fixing (top panels), and (bottom panels). Three cost levels are then considered for each plot.
Figure 17.
Accelerated analysis with mermaids, broadcast model (for mermaids’ dynamics), Communities online social network, fixing (top panels), and (bottom panels). Three cost levels are then considered for each plot.

Figure 18.
Accelerated analysis with mermaids fixing (top plots) and (bottom plots), random, aristocratic, and social rules, word of mouth model (for mermaids’ dynamics). Communities online social network.
Figure 18.
Accelerated analysis with mermaids fixing (top plots) and (bottom plots), random, aristocratic, and social rules, word of mouth model (for mermaids’ dynamics). Communities online social network.

Figure 19.
Accelerated analysis with mermaids fixing the number of mermaids to and , random, aristocratic, and social rules. The mermaids’ dynamics evolve according to the preferential model. Communities online social network.
Figure 19.
Accelerated analysis with mermaids fixing the number of mermaids to and , random, aristocratic, and social rules. The mermaids’ dynamics evolve according to the preferential model. Communities online social network.

Figure 20.
Effect on parameters’ variation on the configurations fixing the number of mermaids to (top panels) and (bottom panels). Four cost levels are then considered in each plot, from 600 to 4800. Broadcast model, VirtualTourist online social network.
Figure 20.
Effect on parameters’ variation on the configurations fixing the number of mermaids to (top panels) and (bottom panels). Four cost levels are then considered in each plot, from 600 to 4800. Broadcast model, VirtualTourist online social network.

Figure 21.
Accelerated analysis with mermaids fixing and , random, aristocratic, and social rules, word of mouth model (for mermaids’ dynamics), VirtualTourist online social network.
Figure 21.
Accelerated analysis with mermaids fixing and , random, aristocratic, and social rules, word of mouth model (for mermaids’ dynamics), VirtualTourist online social network.

Figure 22.
Accelerated analysis with mermaids fixing and , with random, aristocratic, and social rules, preferential model (for mermaids’ dynamics), VirtualTourist online social network.
Figure 22.
Accelerated analysis with mermaids fixing and , with random, aristocratic, and social rules, preferential model (for mermaids’ dynamics), VirtualTourist online social network.

Figure 23.
Scatter plots between cost and in Communities. represents the minimum number of steps (in simulated time units) necessary to get the target efficiency (). We consider three thresholds: half efficiency (leftmost column), one third (centermost column), and no threshold (rightmost column). Every row represents a different mermaids’ model namely broadcast, word of mouth, and preferential.

Figure 24.
Scatter plots between cost and in VirtualTourist. represent the minimum number of steps (in simulated time units) necessary to get the target efficiency (). We consider three thresholds: half (leftmost column), one third (centermost column) and full (rightmost column) efficiency. Every row represents a different mermaids’ model, namely broadcast, word of mouth, and preferential.


Table 1.
Statistical features of the Communities and Virtualtourist online social networks, together with randomized versions of the same networks: number of nodes , number of edges , average node degree , maximum degree , average shortest path L and average clustering coefficient C (for the largest connected component), global efficiency , local efficiency , cost, cost over efficiency, exponent of the cumulative degree distribution , number of connected clusters , and the correlation pattern .
| Feature | Communities | Virtual Tourist | Randomized CM | Randomized VT |
|---|---|---|---|---|
| 12,479 | 57,639 | 12,479 | 57,639 | |
| 60,209 | 211,415 | 60,209 | 211,415 | |
| 9.64 | 7.34 | 9.64 | 7.34 | |
| 656 | 963 | 24 | 21 | |
| L | 4.18 | 4.95 | 4.42 | 5.72 |
| C | 0.1067 | 0.04425 | 0.0006 | 0.0001 |
| 0.238683 | 0.201822 | 0.23296 | 0.17817 | |
| 0.131466 | 0.056248 | 0.00074 | 0.00013 | |
| (density) | 0.00077 | 0.00013 | 0.00077 | 0.00013 |
| 0.00324 | 0.00063 | 0.00332 | 0.00073 | |
| 2.5 | 2.7 | ∼0 | ∼0 | |
| 161 | 2078 | 3 | 43 | |
| −0.027 | −0.027 | −0.002 | 0.00082 |
Table 2.
Summary of attractiveness values used during network simulations in Communities (first four rows) and VirtualTourist (last four rows). is the number of nodes, m the number of mermaids, is the weight assigned to mermaids, is the attractiveness of normal nodes, and is the attractiveness of mermaids.
| m | ||||
|---|---|---|---|---|
| 12,479 | 6 | 10 | 0.000079751 | 0.000797512 |
| 12,479 | 6 | 20 | 0.000079371 | 0.001587428 |
| 12,479 | 12 | 10 | 0.000079371 | 0.000793714 |
| 12,479 | 12 | 20 | 0.000078623 | 0.001572451 |
| 57,639 | 6 | 10 | 0.000017331 | 0.000173313 |
| 57,639 | 6 | 20 | 0.000017313 | 0.000346266 |
| 57,639 | 12 | 10 | 0.000017313 | 0.000173133 |
| 57,639 | 12 | 20 | 0.000017277 | 0.000345548 |
Table 3.
List of the all possible configurations available with , , and with the corresponding costs.
Table 3.
List of the all possible configurations available with , , and with the corresponding costs.
| Configurations | |||
|---|---|---|---|
| 600 | (6,10,10) | ||
| 1200 | (6,10,20) | (6,20,10) | (12,20,20) |
| 2400 | (12,10,20) | (12,20,10) | (6,20,20) |
| 4800 | (12,20,20) | ||
Table 4.
Summary of , i.e., the minimum number of simulated steps to get the original , for all accelerated simulations in Communities (CM), VirtualTourist (VT), and randomized version of both networks. Random (rnd), aristocratic (ari), and social (soc) rules are considered.
Table 4.
Summary of , i.e., the minimum number of simulated steps to get the original , for all accelerated simulations in Communities (CM), VirtualTourist (VT), and randomized version of both networks. Random (rnd), aristocratic (ari), and social (soc) rules are considered.
| CM | VT | |||||
|---|---|---|---|---|---|---|
| rnd | soc | ari | rnd | soc | ari | |
| Normal | 1384 | 1333 | 1931 | 3130 | 2996 | 7505 |
| Randomized | 2585 | 2571 | 2294 | 13,718 | 13,704 | 12,003 |
Table 5.
Summary of the average in all configurations of the number of mermaids (m), attractiveness (a), and length of time (d) of accelerated analysis with and without mermaids. Mermaid’s dynamics are broadcast (bro), word of mouth (word) and preferential (pref), combined with users’ dynamics random (rnd), aristocratic (ari) and social (soc). Communities online social network.
| CM | bro rnd | bro ari | word rnd | word ari | word soc | pref rnd | pref ari | pref soc |
|---|---|---|---|---|---|---|---|---|
| (no mermaids) | 1381 | 1930 | 1381 | 1930 | 1328 | 1381 | 1930 | 1328 |
| (6,10,10) | 112.92 | 128.16 | 111.66 | 126.95 | 113.01 | 106.82 | 118.48 | 108.16 |
| (6,10,20) | 73.10 | 73.67 | 73.80 | 73.80 | 74.93 | 72.45 | 71.28 | 74.20 |
| (6,20,10) | 68.28 | 68.29 | 68.61 | 68.61 | 69.90 | 67.38 | 66.88 | 69.08 |
| (6,20,20) | 58.14 | 56.75 | 58.52 | 56.65 | 59.09 | 57.61 | 55.02 | 59.22 |
| (12,10,10) | 72.35 | 73.32 | 72.07 | 74.23 | 73.34 | 70.51 | 70.39 | 72.34 |
| (12,10,20) | 60.29 | 58.69 | 60.44 | 58.09 | 62.01 | 59.25 | 56.70 | 60.70 |
| (12,20,10) | 55.08 | 52.73 | 55.21 | 52.92 | 56.12 | 53.90 | 51.90 | 55.60 |
| (12,20,20) | 49.44 | 47.90 | 50.05 | 48.60 | 50.81 | 49.23 | 47.11 | 50.66 |
Table 6.
Summary of the average in all configurations of accelerated analysis with and without mermaids. Mermaid’s dynamics are broadcast (bro), word of mouth (word) and preferential (pref), combined with users’ dynamics random (rnd), aristocratic (ari) and social (soc). VirtualTourist online social network.
| VT | bro rnd | bro ari | word rnd | word ari | word soc | pref rnd | pref ari | pref soc |
|---|---|---|---|---|---|---|---|---|
| (no mermaids) | 3120 | 7496 | 3120 | 7496 | 2987 | 3120 | 7496 | 2987 |
| (6,10,10) | 1051.37 | 2272.84 | 1041.35 | 2215.34 | 999.88 | 752.16 | 1607.41 | 771.30 |
| (6,10,20) | 283.12 | 461.48 | 262.40 | 428.12 | 264.58 | 243.19 | 375.16 | 242.17 |
| (6,20,10) | 293.92 | 512.32 | 276.52 | 454.18 | 276.97 | 253.02 | 392.34 | 245.84 |
| (6,20,20) | 137.42 | 163.84 | 134.42 | 156.91 | 136.71 | 130.49 | 148.74 | 132.45 |
| (12,10,10) | 431.78 | 807.28 | 432.89 | 725.23 | 415.61 | 311.19 | 521.40 | 333.13 |
| (12,10,20) | 147.04 | 180.44 | 144.94 | 174.75 | 146.64 | 138.53 | 163.60 | 140.48 |
| (12,20,10) | 145.96 | 184.40 | 143.78 | 178.64 | 146.17 | 137.33 | 168.59 | 138.82 |
| (12,20,20) | 98.46 | 98.70 | 96.63 | 95.89 | 98.95 | 94.74 | 93.39 | 96.72 |
Table 7.
Summary of and calculated for different threshold values of and .
| 2400 | ||||||
| 3333 |
Table 8.
Total cost as a function of and different values of . First row, from left to right: (a), (b), and 2400 (c) for half . Second row: (d), (e), and 3333 (f) for one third of the efficiency. Third row: (g), (h), and (i) with no threshold at all. Once is known, our method estimates the best to obtain the minimum cost. For instance, suppose that the cost per unit time is approximately equal to 90 (with no threshold on ), the configurations that achieve the minimum cost are those with . Indeed, since there are many configurations with the same cost level, the ones that perform better (outlined in bold) are those with the higher value of attractiveness.
| (a) | (b) | (c) | |||
|---|---|---|---|---|---|
| 600 | 1732 | 600 | 7248 | 600 | 150,600 |
| 1200 | 1732 | 1200 | 4327 | 1200 | 71,760 |
| 2400 | 2728 | 2400 | 4327 | 2400 | 45,888 |
| 4800 | 5110 | 4800 | 6621 | 4800 | 45,888 |
| (d) | (e) | (f) | |||
| 600 | 1700 | 600 | 7126 | 600 | 201,833 |
| 1200 | 1700 | 1200 | 4168 | 1200 | 92,733 |
| 2400 | 2698 | 2400 | 4168 | 2400 | 56,933 |
| 4800 | 5085 | 4800 | 6490 | 4800 | 56,933 |
| (g) | (h) | (i) | |||
| 600 | 2314 | 600 | 9724 | 600 | 88,527 |
| 1200 | 2314 | 1200 | 7132 | 1200 | 58,363 |
| 2400 | 3289 | 2400 | 7132 | 2400 | 48,000 |
| 4800 | 5642 | 4800 | 9283 | 4800 | 48,000 |
© 2020 by the authors. Licensee MDPI, Basel, Switzerland. This article is an open access article distributed under the terms and conditions of the Creative Commons Attribution (CC BY) license (http://creativecommons.org/licenses/by/4.0/).
Share and Cite
MDPI and ACS Style
Marchiori, M.; Possamai, L. Strategies of Success for Social Networks: Mermaids and Temporal Evolution. Future Internet 2020, 12, 25. https://doi.org/10.3390/fi12020025
AMA Style
Marchiori M, Possamai L. Strategies of Success for Social Networks: Mermaids and Temporal Evolution. Future Internet. 2020; 12(2):25. https://doi.org/10.3390/fi12020025
Chicago/Turabian StyleMarchiori, Massimo, and Lino Possamai. 2020. "Strategies of Success for Social Networks: Mermaids and Temporal Evolution" Future Internet 12, no. 2: 25. https://doi.org/10.3390/fi12020025
Note that from the first issue of 2016, this journal uses article numbers instead of page numbers. See further details here.