Article

Functional Characterization of Saccharomyces Yeasts from Cider Produced in Hardanger

by
Urban Česnik
1,
Mitja Martelanc
1,
Ingunn Øvsthus
2,
Tatjana Radovanović Vukajlović
1,
Ahmad Hosseini
3,
Branka Mozetič Vodopivec
1 and
Lorena Butinar
1,*
1
Wine Research Centre, University of Nova Gorica, Glavni trg 8, 5271-SI Vipava, Slovenia
2
NIBIO, Norwegian Institute of Bioeconomy Research, P.O. Box 115, NO-1431 Ås, Norway
3
Center for Information Technologies and Applied Mathematics, University of Nova Gorica, Glavni trg 8, 5271-SI Vipava, Slovenia
*
Author to whom correspondence should be addressed.
Fermentation 2023, 9(9), 824; https://doi.org/10.3390/fermentation9090824
Submission received: 30 July 2023 / Revised: 25 August 2023 / Accepted: 31 August 2023 / Published: 8 September 2023
(This article belongs to the Special Issue Development and Application of Starter Cultures)

Abstract

:
Saccharomyces cerevisiae is commonly used for the production of alcoholic beverages, including cider. In this study, we examined indigenous S. cerevisiae and S. uvarum strains, both species commonly found in cider from Hardanger (Norway), for their strain-specific abilities to produce volatile and non-volatile compounds. Small-scale fermentation of apple juice with 20 Saccharomyces strains was performed to evaluate their aroma-producing potential as a function of amino acids (AAs) and other physicochemical parameters under the same experimental conditions. After fermentation, sugars, organic acids, AAs, and biogenic amines (BAs) were quantified using the HPLC–UV/RI system. A new analytical method was developed for the simultaneous determination of nineteen AAs and four BAs in a single run using HPLC–UV with prior sample derivatization. Volatile compounds were determined using HS-SPME-GC-MS. Based on 54 parameters and after the removal of outliers, the nineteen strains were classified into four groups. In addition, we used PLS regression to establish a relationship between aroma compounds and predictor variables (AAs, BAs, organic acids, sugars, hydrogen sulfide (H2S) production, CO2 release) of all 19 strains tested. The results of the VIP show that the main predictor variables affecting the aroma compounds produced by the selected yeasts are 16, belonging mainly to AAs.

1. Introduction

Norwegian cider is becoming more and more popular in Norway in recent years among producers and consumers. Especially in the Southwest part of Norway, in the Hardanger region, there is a long tradition of producing ciders. Available data show that traditional cider from Hardanger is very different from French, English, or Spanish ciders in terms of sensory characteristics, apple cultivars, and fermentation process. A recent comparison of the aromatic component composition of different French and Norwegian ciders, including ciders from Hardanger, has confirmed that Norwegian ciders contain more aromas, which are behind fruity and fresh sensory sensations [1]. Cider from Hardanger is mostly made from desert apples, which have different chemical compositions in comparison to cider apples [2,3]. Ciders in Hardanger were traditionally produced by employing long spontaneous fermentation, even over winter, at low temperatures, often with the addition of sucrose and nothing else to increase the alcoholic strength [2]. Nowadays, spontaneous fermentation is more and more replaced by inoculated commercial yeasts. In our previous study of yeast ecology from ciders produced in the Hardanger area, we had seen that in ciders, apart from the presence of non-Saccharomyces species at the early stages of fermentation, the most predominant species isolated during fermentation were S. cerevisiae and S. uvarum [4].
S. uvarum is a cryotolerant yeast and belongs to the Saccharomyces sensu stricto clade, being the furthest relative from S. cerevisiae, and is now recognized as a pure species, distinct from S. bayanus, which is a hybrid of S. uvarum and S. eubayanus [5,6]. Due to its problematic taxonomy and incorrect identification, it is difficult to trace it in the scientific literature and obtain data about its origin, diversity, and potential usage in cider and winemaking. S. uvarum is not only related to cider fermentations, but it is also known in white wine production from colder grape-growing regions [7].
S. uvarum in grape juice, in comparison to S. cerevisiae, produces less acetic acid, acetaldehyde, and ethanol but more glycerol, succinic acid, and malic acid [7]. It is also capable of producing substantially more 2-phenyl ethanol (rose note), isoamyl alcohol (whisky), iso-butanol (solvent, bitter), and ethyl acetate (pineapple) [8,9]. There are also reports about the use of S. uvarum in cider production [10,11]. The phenotypic differences between S. uvarum and S. cerevisiae, the primary yeast species used worldwide for wine and cider making, are associated with pronounced proteomic differences [12].
S. cerevisiae gives ciders consistent aroma and taste and less risk of spoilage, however, resulting in less complex ciders [13]. Thus, to modulate the profile of ciders by enhancing microbial diversity seems a rational approach and was shown in recent studies [14,15]. To better evaluate the potential of different natural Saccharomyces strains, we need to assess the impact of nitrogen sources on fermentative behavior and possible undesirable production of metabolites such as acetic acid, H2S, and BAs as well. In spontaneous fermentations, yeasts generally use naturally present amino acids, which results in higher aromatic complexity but also higher production of BAs.
The impact of Saccharomyces strains on the aroma profile related to different fermentation conditions is already well described in wine and beer production [7]; however, in recent years, cider production has been supported by research mainly based on non-Saccharomyces yeast strains [14,15,16,17], and not so much on potential alternative Saccharomyces species, such as S. uvarum.
S. cerevisiae is known to be more controllable in its fermentation output and performance in wine and beer production [7,18]. Therefore, it is very important to study them in natural media for cider production, namely apple juice. Most of the yeast characterization studies are still performed in synthetic must.
This study aimed to characterize traits of isolated S. cerevisiae and S. uvarum strains from ciders produced in Hardanger [4], an important area for cider production. We aimed to take a deeper look at their amino acid and sugar consumption in typical Hardanger apple juice (Malus domestica cv. ‘Aroma’), the conversion of present sugars into ethanol, the yeast production potential of characteristic volatile compounds, and possible production of undesirable compounds, such as BAs, acetic acid and H2S. To sum up, a comprehensive study of 20 yeast metabolite phenotypes has been used to classify the yeasts into groups with similar properties with the help of statistical methods, and partial least squares (PLS) regression has been used to reveal the correlation between amino acids and other primary metabolites with a synthesis of five different chemical groups of volatile compounds in apple ciders.

2. Materials and Methods

2.1. Yeast Strains, Media, and Culture Conditions

A list of the 20 strains from the Saccharomyces genus used in this study is provided in Table S1 (in Supplementary Materials). The yeast strains were isolated during the biodiversity study on cider yeasts in cider from Hardanger (in preparation for MDPI Foods) [4] and kept as cryo-cultures at −80 °C in 15% glycerol in the in-house culture collection at NIBIO Ullensvang (Lofthus, Norway) and the Wine Research Centre at the University of Nova Gorica (Vipava, Slovenia).

2.2. Screening for Sulfite Reductase Activity Using BiGGY Agar

Strains were tested for H2S production on Bismuth Sulfite Glucose Glycine Yeast agar (BiGGY) [19]. BiGGY plates were spot-inoculated with a one-day-old liquid culture pregrown in Yeast Extract-Peptone-Dextrose (YPD) medium (10 g/L yeast extract, 20 g/L peptone, 20 g/L glucose) at 25 °C and 150 rpm. BiGGY plates were inoculated at 25 °C, and colony color was assessed after 5 days. The assay was performed in triplicate.

2.3. Micro-Fermentations

Monoculture fermentations were performed with selected Saccharomyces strains listed in Table S1. For the fermentation experiment, apples from the apple cultivar Aroma (M. domestica cv. ‘Aroma’), grown in the Hardanger area, were milled and pressed with a belt press; apple juice was immediately frozen at −20 °C till the experimental set-up. Apples and the obtained juice were not pre-treated with enzymes or other enological additives during processing.
Pre-cultures were prepared by inoculating single colonies of Wallerstein Laboratory Nutrient Agar (WL) (VWR) plate cultures in 3 mL YPD medium in 15 mL tubes. After incubation for 24 h at 25 °C and 150 rpm, the pre-cultures were centrifuged (2000 rpm, 10 min, room temperature (RT)) and washed with 0.85% NaCl solution. Finally, the yeast pellets were resuspended in diluted sterile apple juice (1:1 with sterile water). The optical density at 600 nm (OD 600 nm) of the yeast suspensions was adjusted to 1.0 and left at RT for 30 min for adaptation.
The apple juice was unfrozen and sterile filtered using a vacuum filtration system (500 mL Polyethersulfone (PES), 0.2 µm membrane filter (VWR)). Then, 20 mL of the apple juice was placed in 40 mL glass vials and inoculated with the pre-culture to achieve a final OD of 600 nm 0.1 AU. Fermentations were prepared in triplicates and conducted at 15 °C for 26 days.
During fermentation, mass loss was monitored and H2S was quantified using 120SF gas detector tubes (Komyo Kitagawa, Kawasaki-City, Japan), as described by Ugliano and Henschke [20]. The detector tubes were inserted into the vials through a hole in the PTFE/silicone partition of the lids.
At the end of fermentation, samples were centrifuged (20 min, 6000 rpm) and stored at −20 °C before chemical analysis.

2.4. Determination of Sugars, Acids, and Ethanol

Reagents, Materials, and Standards for HPLC–UV/RI Analyses

Chemicals: we used glucose (99%) (Acros Organics, Fair Lawn, NJ, USA), fructose (99%) (Acros Organics, Fair Lawn, NJ, USA), sucrose (99.9%) (Acros Organics, NJ, USA), tartaric acid (Alfa Aesar, Karlsruhe, Germany), lactic acid (30%) (Sigma, Steinheim, Germany), D-L malic acid (99%) (Aldrich, Steinheim, Germany), and citric acid (99.9%) (Sigma, Steinheim, Germany). Concentrated sulfuric acid (VI) was purchased from VWR Chemicals (Leuven, Belgium).
Three in-house developed HPLC–UV/RI methods were used for the determination of sugars, organic acids, and ethanol in cider samples, respectively. An Agilent 1100 series HPLC system (Agilent Technologies©, Palo Alto, CA, USA) was equipped with Agilent OpenLab CDS ChemStation 2.3.54 software, a UV detector (G1314A VWD) for the analysis of organic acids (detection at 210 nm), and a refractive index detector (model G7162A) for the analysis of sugars (fructose and glucose) and ethanol. Samples were filtered using Polytetrafluoroethylene (PTFE) 0.45 µm syringe filters (VWR® International, Radnor, PA, USA). For the determination of glucose and fructose, 4 µL of each sample was injected onto a Phenomenex Luna® Omega Sugar HPLC column (150 mm long and ø of 4.6 mm, particle size of 3 µm) with a precolumn (5 mm long and ø of 4.6 mm, particle size of 3 µm) using a mobile phase of acetonitrile/water = 75:25 (v/v) at a flow rate of 0.9 mL/min and a run time of 15 min [21]. Separation of the organic acids was performed on two HPLC columns, which were coupled sequentially: Phenomenex C18 Kinetex F5 (dimensions 150 × 4.6 mm with a particle size of 2.6 µm) with a precolumn (5 mm long and ø of 4.6 mm, particle size of 3 µm) and a Phenomenex C18 Kinetex EVO (dimensions 250 × 4.6 mm with a particle size of 5 µm) kept at 30 °C during analyses. The injection volume was 4 µL, the mobile phase consisted of 5 mM H2SO4, the flow rate was 0.7 mL/min, and the run time was 20 min [22]. Ethanol was evaluated on a multimodal ROA Organic Acid H+ (8%) column (Phenomenex) with a size of 300 × 7.8 mm and a sample injection volume of 5 μL. Isocratic elution was performed using 5 mM H2SO4 as the mobile phase with a flow rate of 0.9 mL/min and a run time of 25 min [23]. All HPLC columns were kept at 30 °C during chromatographic analyses.
Method validation data are summarized in Table S2 (in Supplementary Materials).

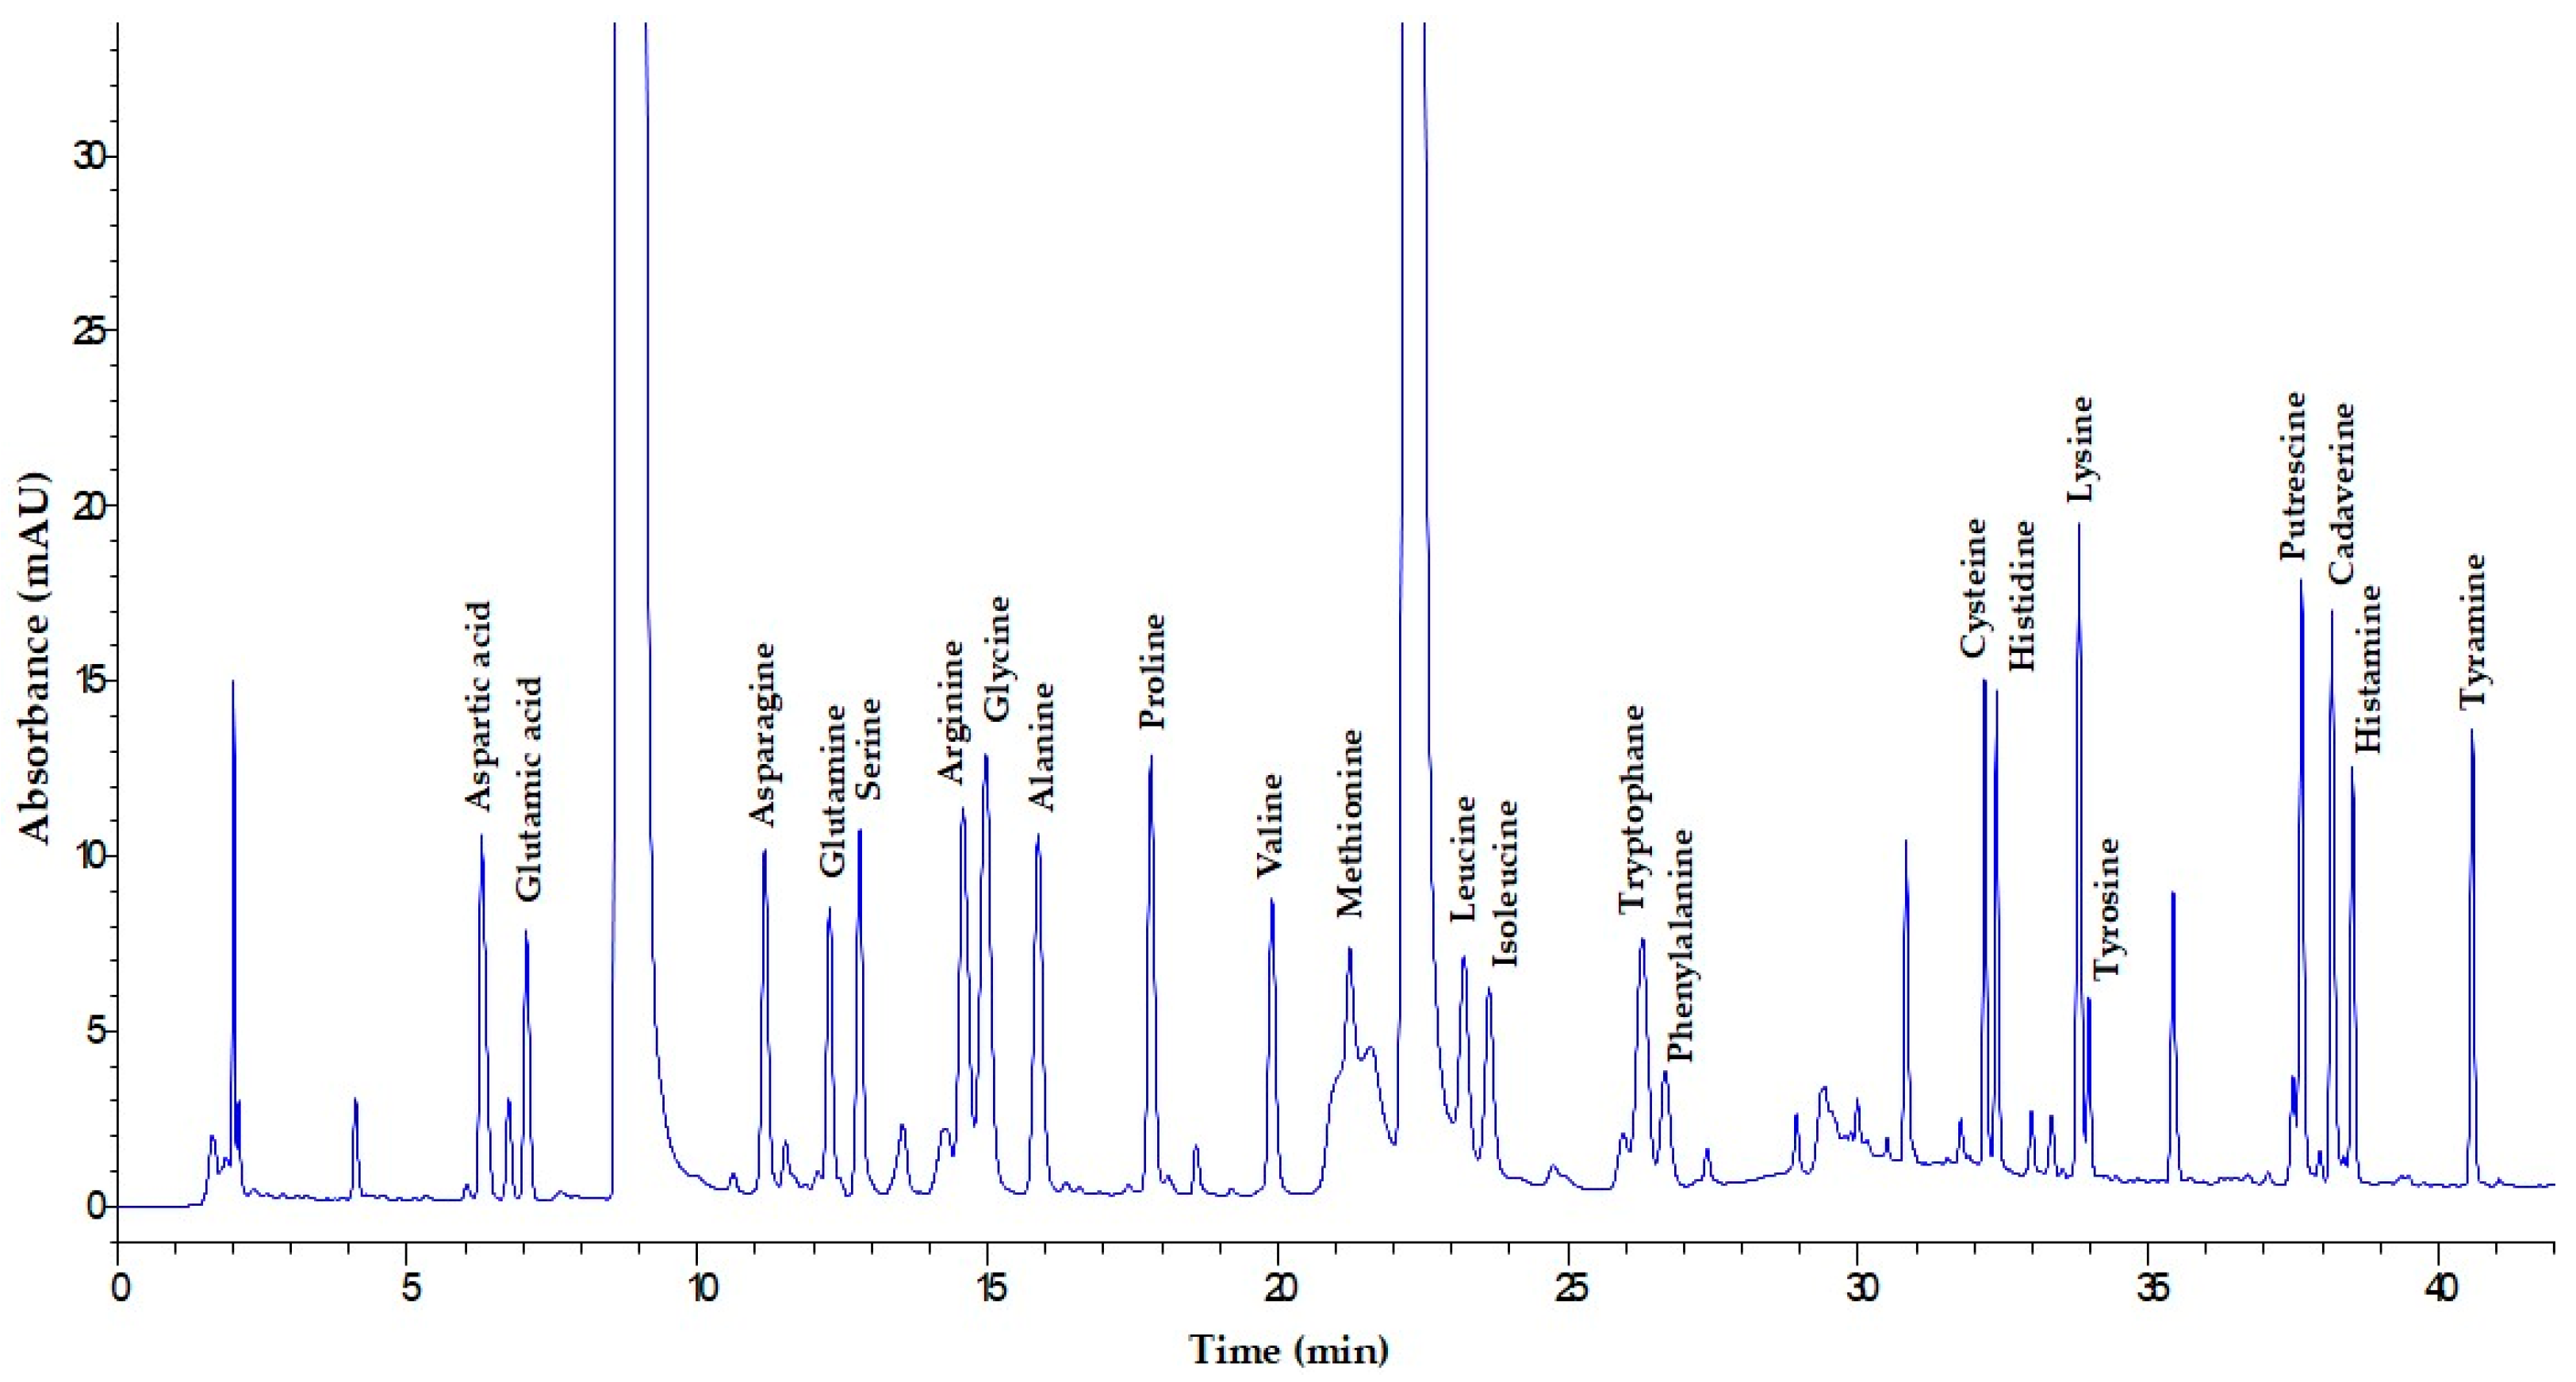
2.5. HPLC–UV Determination of Amino Acids and Biogenic Amines

2.5.1. Reagents, Materials, and Standards for HPLC–UV Analyses

Amino acids: L-tyrosine disodium salt hydrate (98%) (Sigma, Steinheim, Germany), L-aspartic acid (99,5%) (AppliChem, Darmstadt, Germany), L-serine (99%) (Sigma, Steinheim, Germany), L-leucine (98%) (Sigma, Steinheim, Germany), L-cystein (99%) (Merck, Darmstadt, Germany), isoleucine (99.5%) (AppliChem, Darmstadt, Germany), L-phenylalanine (99.5%) (Sigma, Steinheim, Germany), L-asparagine (98%) (Sigma, Steinheim, Germany), L-lysine monohydrochloride (98%) (Sigma, Steinheim, Germany), L-glycine (99%) (Sigma, Steinheim, Germany), L-glutamine (99%) (Sigma, Steinheim, Germany), L-thryptophan (98%) (Sigma, Steinheim, Germany), L-arginine monohydrochloride (99.5%) (Sigma, Steinheim, Germany), L-alanine (99.5%) (AppliChem, Darmstadt, Germany), L-lysine monohydrochloride (99%) (Acros Organics, NJ, USA), L-proline (99.5%) (AppliChem, Darmstadt, Germany), L-glutamic acid (99%) (Sigma, Steinheim, Germany), L-valine (98%) (Sigma, St. Louis, MO, USA), L-methionine (99.5%) (Fisher Scientific, Geel, Belgium), threonine (99%) (Fisher Scientific, Geel, Belgium), L-hystidine monohydrochloride monohydrate (99%) (VWR Chemicals, Leuven, Belgium).
Biogenic amines: putrescine dihydrochloride (98%) (AppliChem, Darmstadt, Germany), cadaverine dihydrochloride (98%) (Sigma, Steinheim, Germany), histamine dihydrochloride (98%) (Alfa Aesar, Karlsruhe, Germany), tyramine hydrochloride (98%) (Alfa Aesar, Karlsruhe, Germany).
Other reagents and chemicals: hypochloric acid (Gram-Mol, Zagreb, Croatia), sodium hydroxide, sodium hydrogen carbonate and ammonia were purchased from (Sigma, Steinheim, Germany), ethanol, acetonitrile (HPLC grade) (J.T. Baker, Gliwice, Poland), sodium acetate (Carl Roth, Karlsruhe, Germany). Derivatization reagent dansyl chloride was supplied from Sigma (Steinheim, Germany).
Chemicals were prepared with ultrapure water, which was prepared using a Milli-Q water purification system Purelab Option-Q system (ELGA LabWater, High Wycombe, UK) to a specific resistance of >18.0 MΩ cm−1 at 25 °C.
A mix stock standard solution of 19 amino acids and a mix stock solution of 4 biogenic amines (1000 mg/L) were prepared in 0.1 M HCl. The solutions were stirred in an ultrasonic bath for 5 min.

2.5.2. Derivatization Procedure for Determining Amino Acids and Biogenic Amines

Derivatization was performed according to the procedure described by Topić Božič et al. [24] with modifications. 250 µL of the standard (amino acids or biogenic amines) and cider samples were mixed with 70 µL of saturated NaHCO3, 75 µL of 0.1 M NaOH, and then with 1.5 mL of dansyl chloride derivatization reagent (0.2% in acetonitrile). The mixture was then shaken and incubated in an oven at 40 °C for 45 min. Then, 100 µL of ammonia was added to the reaction mixture and the mixture was incubated at RT for 30 min. Samples were filtered using 0.45 µm PTFE syringe filters before HPLC analysis. Calibration curves for amino acids and biogenic amines were generated in the range of 1–100 mg/L by diluting the standard stock solution (1000 mg/L).

2.5.3. HPLC–UV Analysis of AAs and BAs

Separation and quantification of 19 amino acids and 4 biogenic amines was performed on Agilent’s HPLC–UV system (described in Section 2.4) using Kinetex® 2.6 µm EVO C18 RP column (150 mm long and ø of 4.6 mm, Phenomenex) with a pre-column (Kinetex® 2.6 µm EVO C18 RP, 5 mm long and ø of 4.6 mm). The separation was done at 35 °C with gradient elution at a flow rate of 0.8 mL/min. The total run time was 65 min.
The mobile phase was prepared from 20 mM sodium acetate. The pH of the mobile phase was pH adjusted to 6.5 with 0.8 M acetic acid. An injection volume of 3 µL was used. Derivatized amino acids and biogenic amines were detected at 246 nm. The gradient profile is described in Table S3 (in Supplementary Materials).

2.5.4. Method Validation

Method validation was performed by testing linearity, repeatability, the limit of detection (LOD), the limit of quantification (LOQ) and recovery (presented in Supplementary Materials in Table S4). The derivatization step was included in the validation procedure.

2.6. Determination of Volatile Compounds Using HS-SPME-GC-MS

Selected aroma compounds were determined in the ciders using an automated robotic system for Solid Phase Micro-Extraction (SPME) in head space (HD) and injected on a gas chromatograph coupled with a mass spectrometric detector (GC-MS). Esters, C6 alcohols, and volatile phenols were analyzed using a method adapted from a previously published protocol [25]. Samples were extracted by headspace Solid Phase Micro-Extraction (HS–SPME) using an SPME fiber assembly (50/30 μm DVB/CAR/PDMS, Stableflex, 24 Ga, Autosampler, Gray (Supelco, St. Louis, MO, USA)). To a 20 mL SPME vial, 3 mL of the cider sample was added with 2 g NaCl and 3 mL deionized water, and 20 μL solution of internal deuterated standards (ethyl butyrate-4,4,4 d3, ethyl d5 hexanoate, ethyl octanoate d15, ethyl trans-cinnamate d5) was added. The solution was then homogenized using a vortex mixer and the samples were loaded into a Gerstel MPS Robotic Autosampler. The program consisted of introducing the fiber into the SPME Arrow Conditioning Module for 2 min at 270 °C. The fiber was then introduced into the headspace of a sample vial for 30 min at 40 °C while simultaneously vortexing the sample with the agitator at 250 rpm. The fiber was then transferred to the injector for desorption at 250 °C for 15 min. The time for sample injection into the GC column was set to 30 s, followed by cleaning of the fibers in the SPME Arrow Conditioning Module at 270 °C for 10 min.

2.7. Multivariate Data and Statistical Analysis

Data were presented as means ± standard deviation (SD) from three repetitions. ANOVA and Tukey’s method were employed using IBM SPSS Statistics 27 to compare the variances among the means of various groups. A significance level of α = 5% was chosen to determine statistical significance.
Data analysis was performed by a multivariate approach. Principal components analysis (PCA) and the partial least squares (PLS) regression analysis were carried out to explore the differences among ciders produced from apple juice by different Saccharomyces strains. To deal with non-detectable values, the data matrix was pre-processed, and non-detectable values were replaced with LLOQ/2.
All computational efforts and multivariate data analysis were implemented in IBM SPSS Statistics 27, Minitab 21, GraphPad Prism 9.5.1, and XLSTAT 2023 on a Lenovo PC with Intel(R) Core (TM) i7-6600U CPU @ 2.60 GHz and 16 GB of RAM, Microsoft Windows 10 OS. Boxplots for AAs utilization were prepared by R v. 4.1.2 for macOS.

3. Results and Discussion

3.1. H2S Production

According to the results obtained on BiGGY plates, seven strains were classified as non-H2S producers (white colony color), two as moderate (white, light brown edge), and the rest as strong H2S producers (brown color) (Table 1). Using detector tubes inserted into a hole in the septum of the vial cap, we quantitatively assessed H2S formation by the strains tested under fermentative conditions. The H2S formation potential determined by color staining on BiGGY agar did not agree with the results obtained with detector tubes. Five S. uvarum strains produced H2S; in strain 2176, we detected an average of 58.3 ppm H2S, followed by strains 2402 and 2128 with 48.3 and 36.7 ppm, respectively (Table 1). The lowest H2S production was detected in S. uvarum 2401 (average 13.3 ppm) (Table 1).

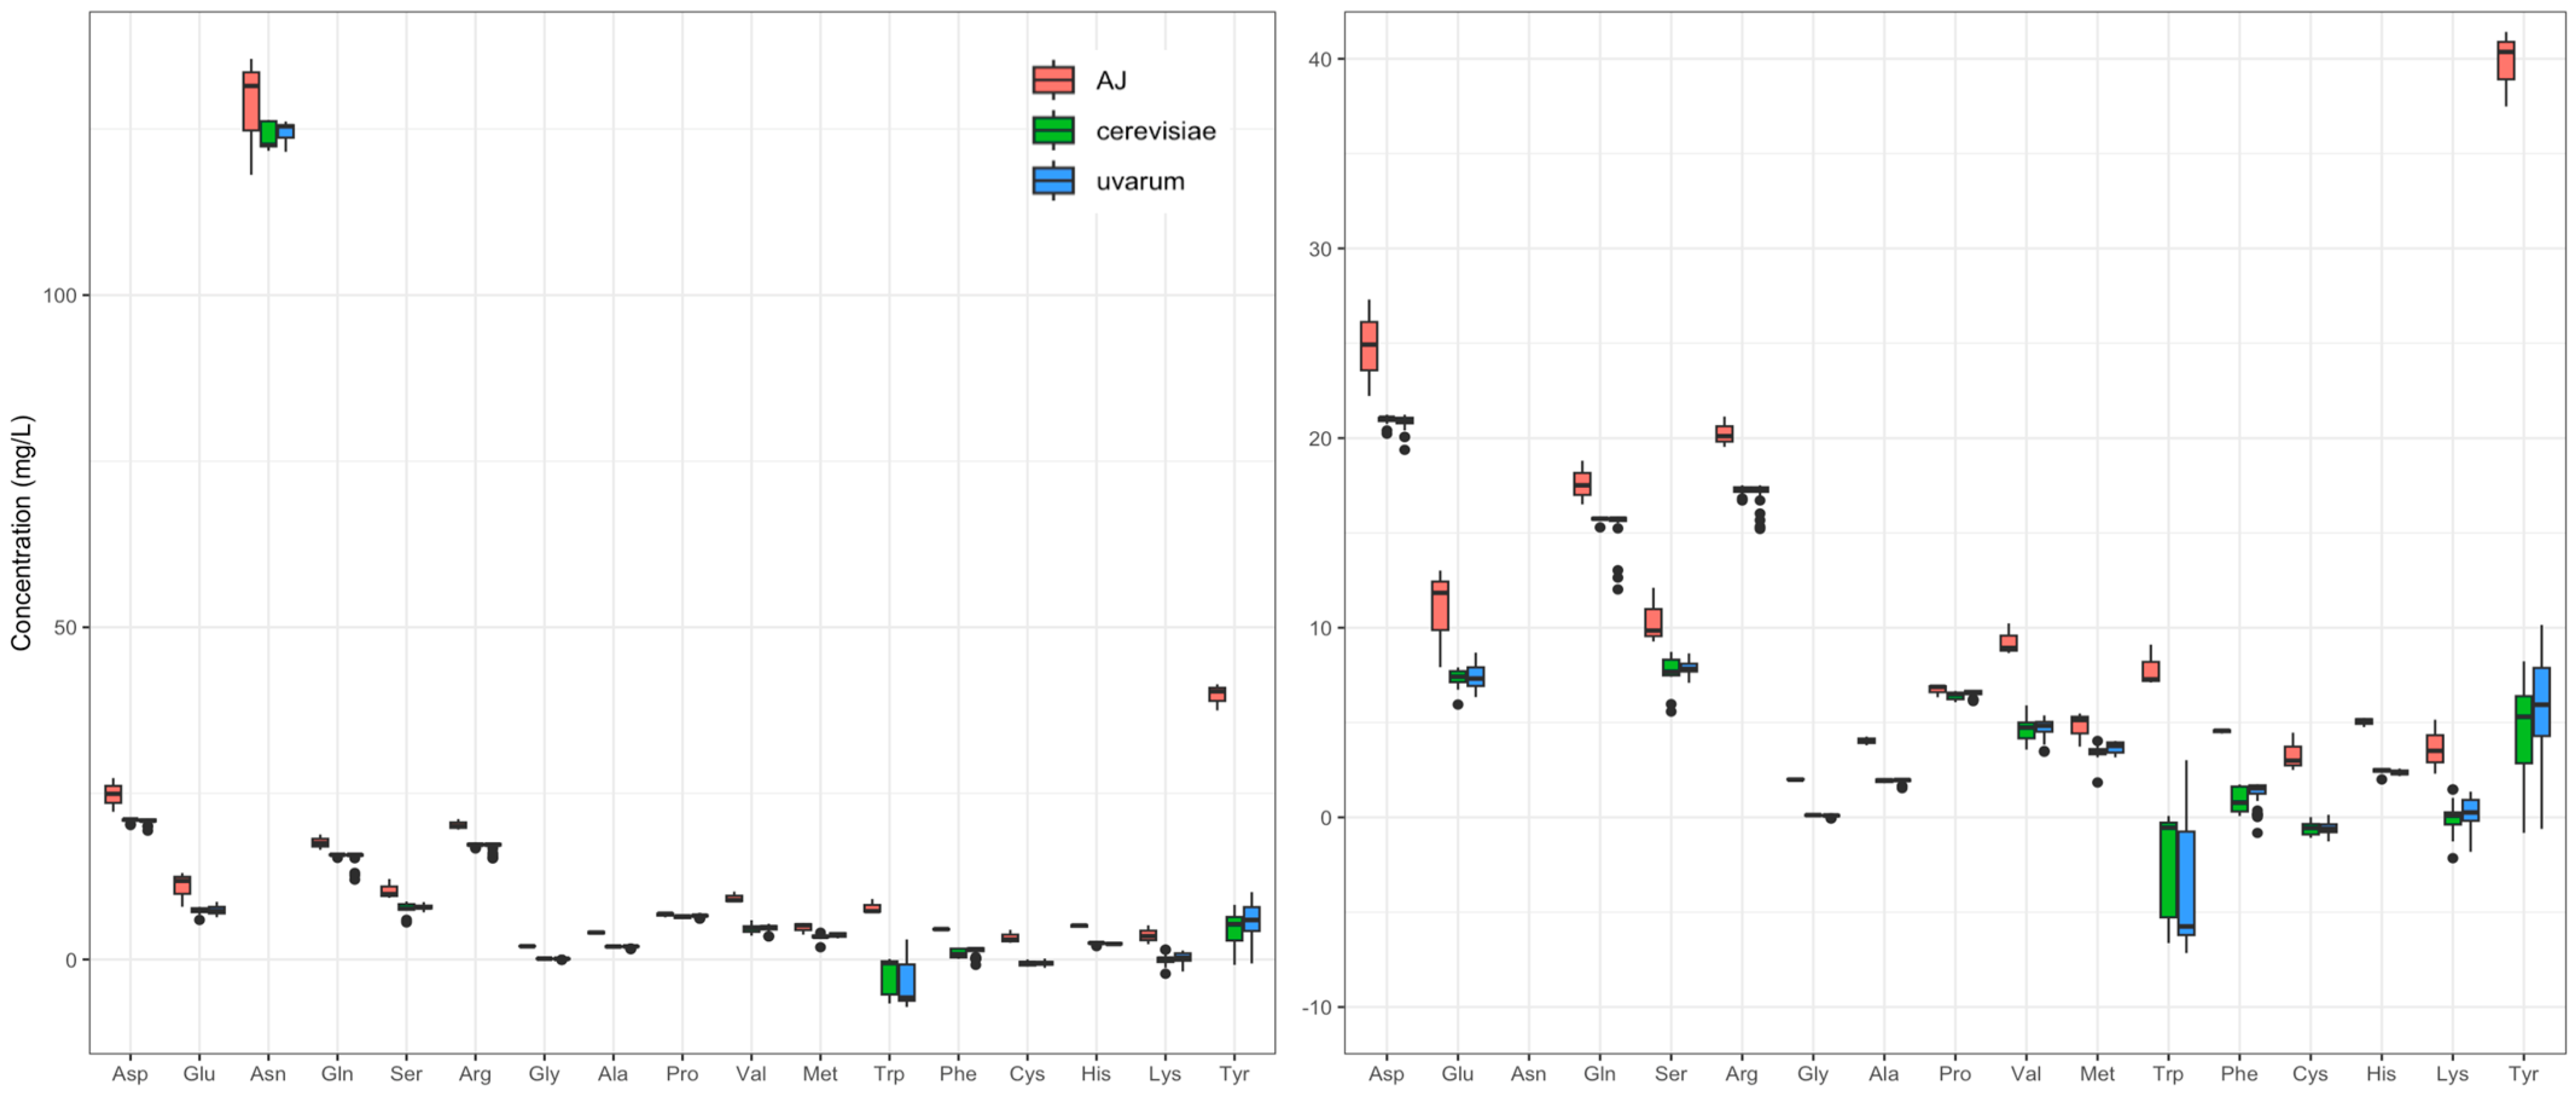
3.2. HPLC–UV Determination of Amino Acids and Biogenic Amines

Determination of AAs and BAs is challenging when using the HPLC–UV system since both AAs and BAs lack chromophores for detection. Therefore, if HPLC coupled with mass spectrometric detection (MS) is not used, a sample derivatization step requiring HPLC coupled with a fluorescence detector (FLD) is necessary before analysis, especially if quantitation below 1 mg/L is required [26]. The HPLC–FLD system has more than a 10-fold higher sensitivity for such analyses compared to HPLC–UV [27]. All in all, only two methods for simultaneous determination of AAs and BAs have been published to the best of our knowledge, one based on the HPLC–MS system [28] and the second based on ultra-performance liquid chromatography (UPLC) coupled with a diode array detector (DAD) [29]. Here, we present a newly developed method for the simultaneous determination of nineteen AAs and four BAs based on the HPLC–UV system using dansyl chloride as a derivatizing agent for AAs and BAs. The method was validated and applied for the analysis of fermented beverages based on apple juice (cider) and can also be used for wine samples or, as in our study, for the in-depth characterization of AA utilization and BA production of a larger number of yeasts. The separation system is based on the C18 reverse phase (RP) system with 3 µm particles, which allows better resolution as well as higher sensitivity for the analyzed compounds (Figure 1). Together with the previous derivatization with dansyl chloride, we were able to obtain adequate LODs and LOQs for the determination of AAs and BAs in the analyzed samples. These LODs and LOQs are comparable to the published method [29], although the UPLC system with 1.8 µm particles was used. The linearity range of the method for each compound is between 0.5 mg/L and 200 mg/L, which corresponds to the actual range of occurrence of the analyzed compounds in juices and fermented beverages (the detection limits are between 0.03 and 0.3 mg/L). All validated parameters indicate that the method presented here can be a relevant and useful tool for the quality control of cider by monitoring fermentation, especially due to the fact that the HPLC–UV system is an easily accessible tool in analytical/research laboratories.

3.3. Behavior of Saccharomyces Strains under Fermentative Conditions

The total AA content in apple juice from the cultivar Aroma averaged 303.97 mg/L. The evaluation of the AA content revealed that asparagine (42.2%) was the most important AA in juice, followed by tyrosine (13.1%), aspartic acid (8.2%), arginine (6.7%), and glutamine (5.8%) (Table S5 in Supplementary Materials).
The AA utilization profile of both species showed a similar utilization pattern of AAs present in apple juice, and the pattern of AAs utilized also reflected the strain effect (Figure 2, Table S6 in Supplementary Materials). The major AA source for all strains tested was asparagine, which provided an average of 57.7% of the total AAs utilized. Note that the initial asparagine concentration in apple juice was 3–65 times higher than that of the other AAs (Table S5). Aspartic acid, arginine, and glutamine were the next most utilized AAs, followed by glutamic acid, serine, proline, and then valine and tyrosine (Figure 2, Table S6). The remaining AAs were present in very low concentrations in apple juice and were mostly utilized during fermentation. For methionine, histidine, and alanine, some residual amounts were still detected at the end of fermentation (Figure 2, Table S6).
The good utilization of asparagine and glutamine by the Saccharomyces strains tested in this study is consistent with what has been reported in the literature, as these two AAs, along with ammonium, have often been reported as preferred nitrogen sources for S. cerevisiae [26,27]. Aspartic acid, arginine, glutamic acid, and serine were also included among the preferred nitrogen sources [26,27], which we also observed in our study.
Although tyrosine was the second most abundant AA in apple juice, less than a quarter of it was utilized by the strains, which is consistent with the literature where tyrosine is considered a non-preferred nitrogen source [26,27].
Cysteine, lysine, and especially tryptophan were found in higher concentrations at the end of fermentation compared to what was present in the apple juice. This could be explained by the release of these AAs into the medium during fermentation (Tables S5 and S6). Tryptophane and methionine were also previously classified as non-preferred nitrogen sources [26,27]. However, the data in the literature on the classification of nitrogen sources were mostly based on their ability to support yeast growth of laboratory strains under non-fermentative conditions.
The HPLC–UV method enabled us to determine AAs and BAs simultaneously. Thus, we were able to detect strains with BA-producing ability using this method (Table S6). At the end of fermentation, strains of both species formed two BAs, putrescine and tyramine. Putrescine was detected at relatively low concentrations in all strains tested, whereas the highest concentrations for tyramine averaged 3.9 mg/L in the high-producing strains 2104, 2186, and 2402 (Table S6). The BA production capability is another characteristic that is important for the selection of starter yeasts for cider production, especially when substrates for the production of BA are present in apple juice, such as tyrosine, which can be further decarboxylated to tyramine.
The initial sugar content of apple juice was 101.6 g/L, and the main sugar was fructose (52.9%), followed by sucrose (35.2%) and glucose (11.9%), as shown in Table S7 (in Supplementary Materials). At the end of fermentation, most of the sugar was consumed (98.6% on average), and the residual sugar consisted mainly of remaining glucose, which varied in very low concentrations from 1.3 to 1.6 g/L (Table S7). Hence, studies showed that Saccharomyces yeasts display a clear preference for glucose over fructose [29,30,31]. If we assume that hydrolysis of sucrose was a limiting step during our fermentation, the glucophilic nature of Saccharomyces yeasts would still leave more fructose at the end. However, there are few systematic studies on the preference for glucose and fructose of cider yeast strains, especially in mixed sugar media, such as apple juice [17]. Therefore, it would be of immense importance to focus on the utilization of glucose, fructose, and sucrose by cider yeasts under different fermentation conditions in the near future. Nevertheless, such studies could provide tools for the evaluation and selection of yeast strains for cider production, especially yeasts with fructophilic character, since fructose is the main sugar in apple juice and may pose a problem for stuck fermentation. In addition, sucrose is usually added during fermentation in the production of cider from Hardanger to increase the alcoholic strength. Moreover, from this point of view, it would be important to study the consumption of fructose, glucose, and sucrose during the fermentation process.
Ethanol content averaged between 3.99 and 4.82% (v/v) and did not differ statistically among the Saccharomyces strains tested (Table S7).
In terms of organic acids in apple juice, malic acid was the most abundant (97.0% of total organic acids), which is consistent with previous studies [2,32]. Citric acid and tartaric acid were also detected, and their contents were much lower than those of malic acid. In cider, malic acid averaged between 5.2 g/L and 6.6 g/L, being least affected by the degradation of S. uvarum 2046 and most affected by strain S. uvarum 2176 (Table S7). Acetic acid was within acceptable levels [13], with the highest concentration determined in the ferments of S. cerevisiae 2349; otherwise, the levels were less than 0.09 g/L in the other yeast strains (Table S7). Citric acid and tartaric acid were also detected in very low concentrations in the finished ciders, ranging from 0.46 to 1.31 g/L and from 0.04 to 0.06 g/L, respectively (Table S7).

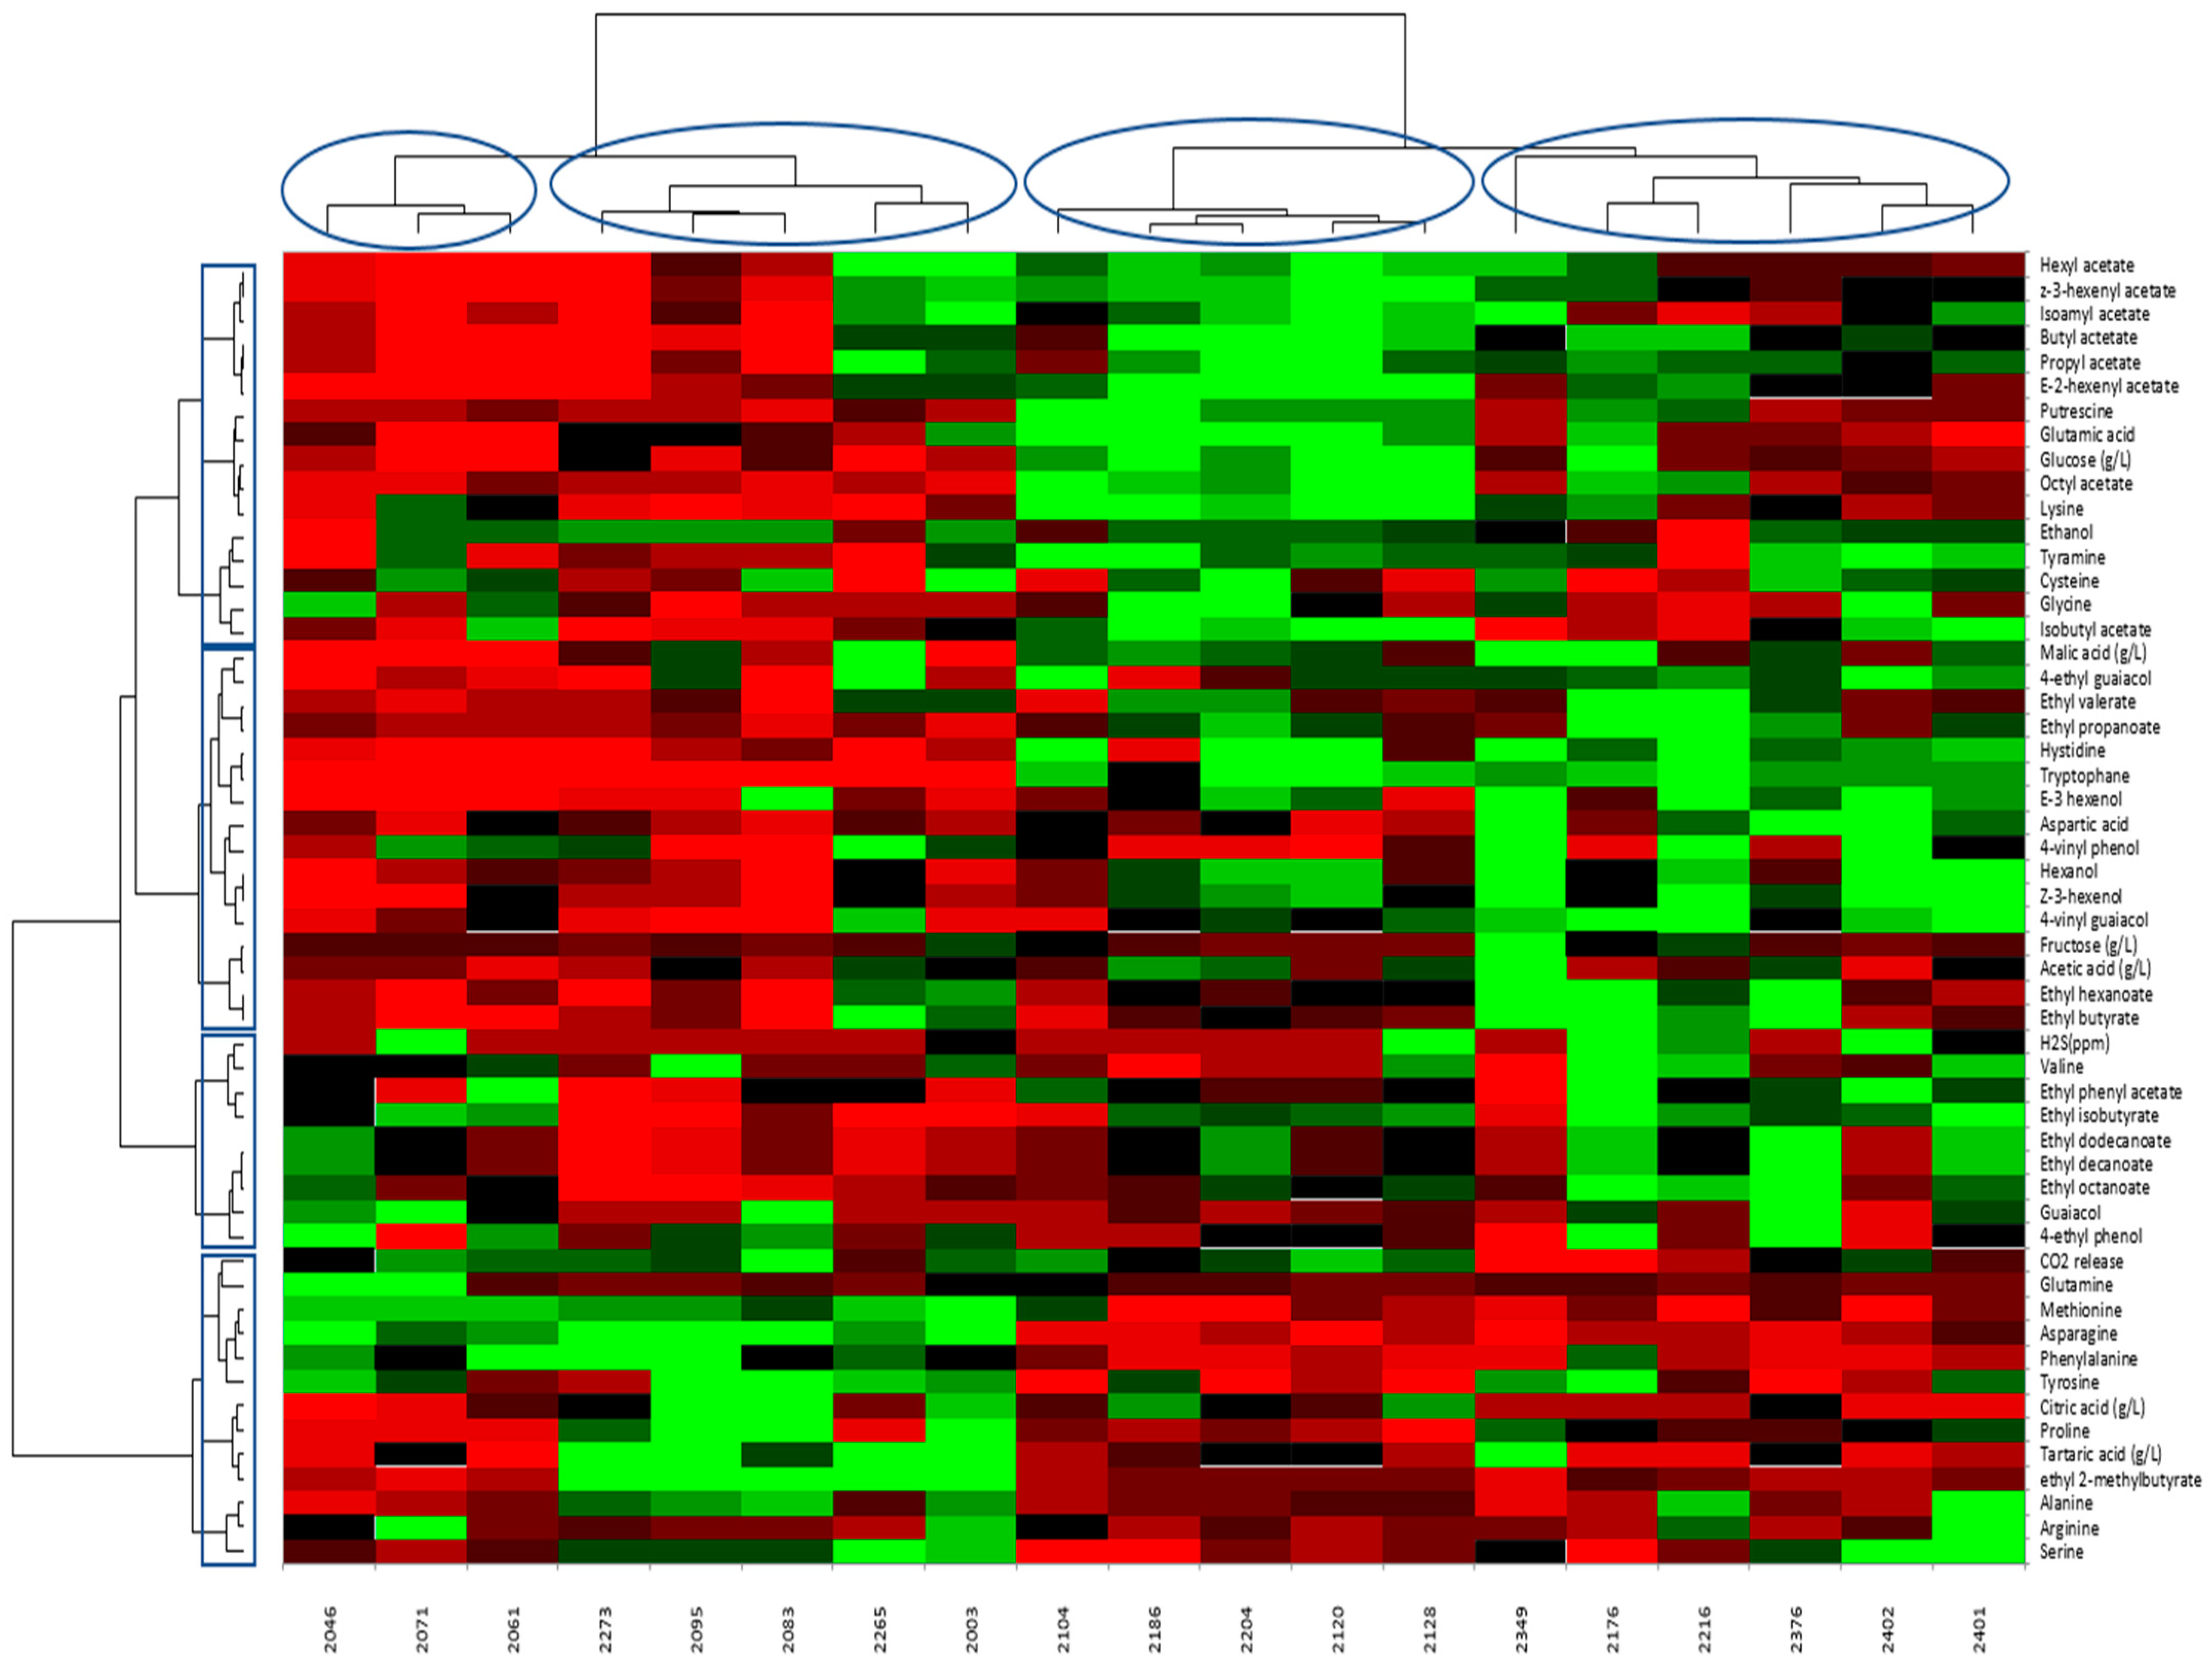
3.4. Volatile Compound Production Profiles of the Saccharomyces Ferments

The concentrations of the volatile compounds are listed in Table 2. We measured a total of twenty-six aroma compounds, eighteen esters (seven ethyl esters of fatty acids, two ethyl esters of branched acids, and nine acetate esters), three C6 alcohols, and five volatile phenols in experimental ciders.
The main group of aroma compounds in our experiment were C6 alcohols, ethyl esters of fatty acids, and volatile phenols. When we sum all aroma compounds, we see a large variability between strains, ranging from 2503 μg/L (S. cerevisiae 2095) to 8654 μg/L (S. uvarum 2376).
The major aroma compound in all ciders was hexanol, which varied from 1222 μg/L (S. uvarum 2083) to 2539 μg/L (S. cerevisiae 2349). According to Waterhouse et al. [33], the olfactory threshold value for 1-hexanol is 8000 μg/L, which means that its contribution to the aroma profile is most likely negligible. In the study of Scandinavian and British ciders, 1-hexanol was the major C6 alcohol [34], ranging from 32 to 6541 μg/L. In our recent study, Norwegian ciders, on average, contained 5137 μg/L of 1-hexanol, and French ones 6555 μg/L [1].
Higher alcohols are known to be the most abundant group of aroma compounds in cider and apple juice [35,36], but they are mainly important as precursors of esters, which are known for their fruity and sweet aroma [37]. The concentration of higher alcohols generally decreases or disappears during cider fermentation [16,34], but in some cases, it also increases or remains unchanged [36].
Seven different ethyl esters of fatty acids were quantified, namely ethyl propanoate, ethyl butyrate, ethyl hexanoate, ethyl octanoate, ethyl decanoate, ethyl valerate, and ethyl dodecanoate. The amounts varied greatly between strains, as shown in Table 2. Ethyl esters are known to be an important component of the Norwegian cider flavor (Øvsthus et al., 2023, in press [1]) and also for other ciders [34,38]. Although some esters may be originally present in apple juice before fermentation, most esters in the ciders are formed by the esterification of alcohols with carboxylic acids during fermentation and aging [36,39].
The yeast with the lowest total concentration of fatty acid ethyl esters (average 269.3 μg/L) (S. cerevisiae 2273) produced almost no ethyl decanoate and ethyl dodecanoate (0 and 15.5 μg/L, respectively). Whereas in the cider with the highest total ethyl ester of fatty acids contents among all yeast strains (S. uvarum 2376) (5123.67 μg/L), these two esters were among the two most abundant ones (1905.93 and 1899.66 μg/L, respectively). None of the Saccharomyces yeasts produced ethyl valerate in higher concentrations (on average, less than 1% of all ethyl esters of fatty acids).
When comparing the relative values in the ethyl fatty acid ester group, all yeasts produced from 19–40% of ethyl octanoate. S. uvarum strains produced, in general, more ethyl esters of decanoic and dodecanoic acids (18–36% of each), while ethyl esters of propanoic, butanoic, and hexanoic acids were less abundant in this group of ciders (from 2–10% of all ethyl esters). The later esters were more abundant in S. cerevisiae strains and less in the contribution of decanoate or dodecanoate ethyl esters to the total ethyl ester of fatty acids fingerprint.
There was no or low significant difference in the concentration of the acetate esters between the yeast strains. The group of acetate esters was represented by propyl acetate, isobutyl acetate, butyl acetate, isoamyl acetate, Z-3-hexenyl acetate, E-2-hexenyl acetate, ethyl phenyl acetate, hexyl acetate, and octyl acetate. The major acetate ester was butyl acetate, which varied between 63.5–220.8 μg/L among yeasts but was generally quite comparable among samples, followed by isoamyl acetate (12.0–118.73 μg/L) and hexyl acetate (8–39 μg/L).
We determined five different volatile phenols in our ciders, namely 4-ethylphenol, 4-ethylguaiacol, 4-vinylguaiacol, 4-vinylphenol, and guaiacol. These five volatile phenols together accounted, on average, for between 1% (S. cerevisiae 2303) and 40% (S. cerevisiae 2365) of the measured volatile fingerprint of the ciders.
The major volatile phenolics were 4-vinylguaiacol and 4-vinylphenol, the presence of which varied among samples due to differences in yeast metabolic characteristics. Moreover, 4-vinylguaiacol varied from 36 to 2121 μg/L and 4-vinylphenol from 18 to 473 μg/L.
Ethyl phenols varied in low concentrations, below the odor threshold (OT). The OT determined in water/10% ethanol solution at pH 3.2 for 4-ethylguaiacol and 4-ethylphenol was 33 and 440 μg/L, respectively [40]. Their presence imparts equine, peasant, smoky, and medicinal aromatic odors when present above their OTs concentrations.

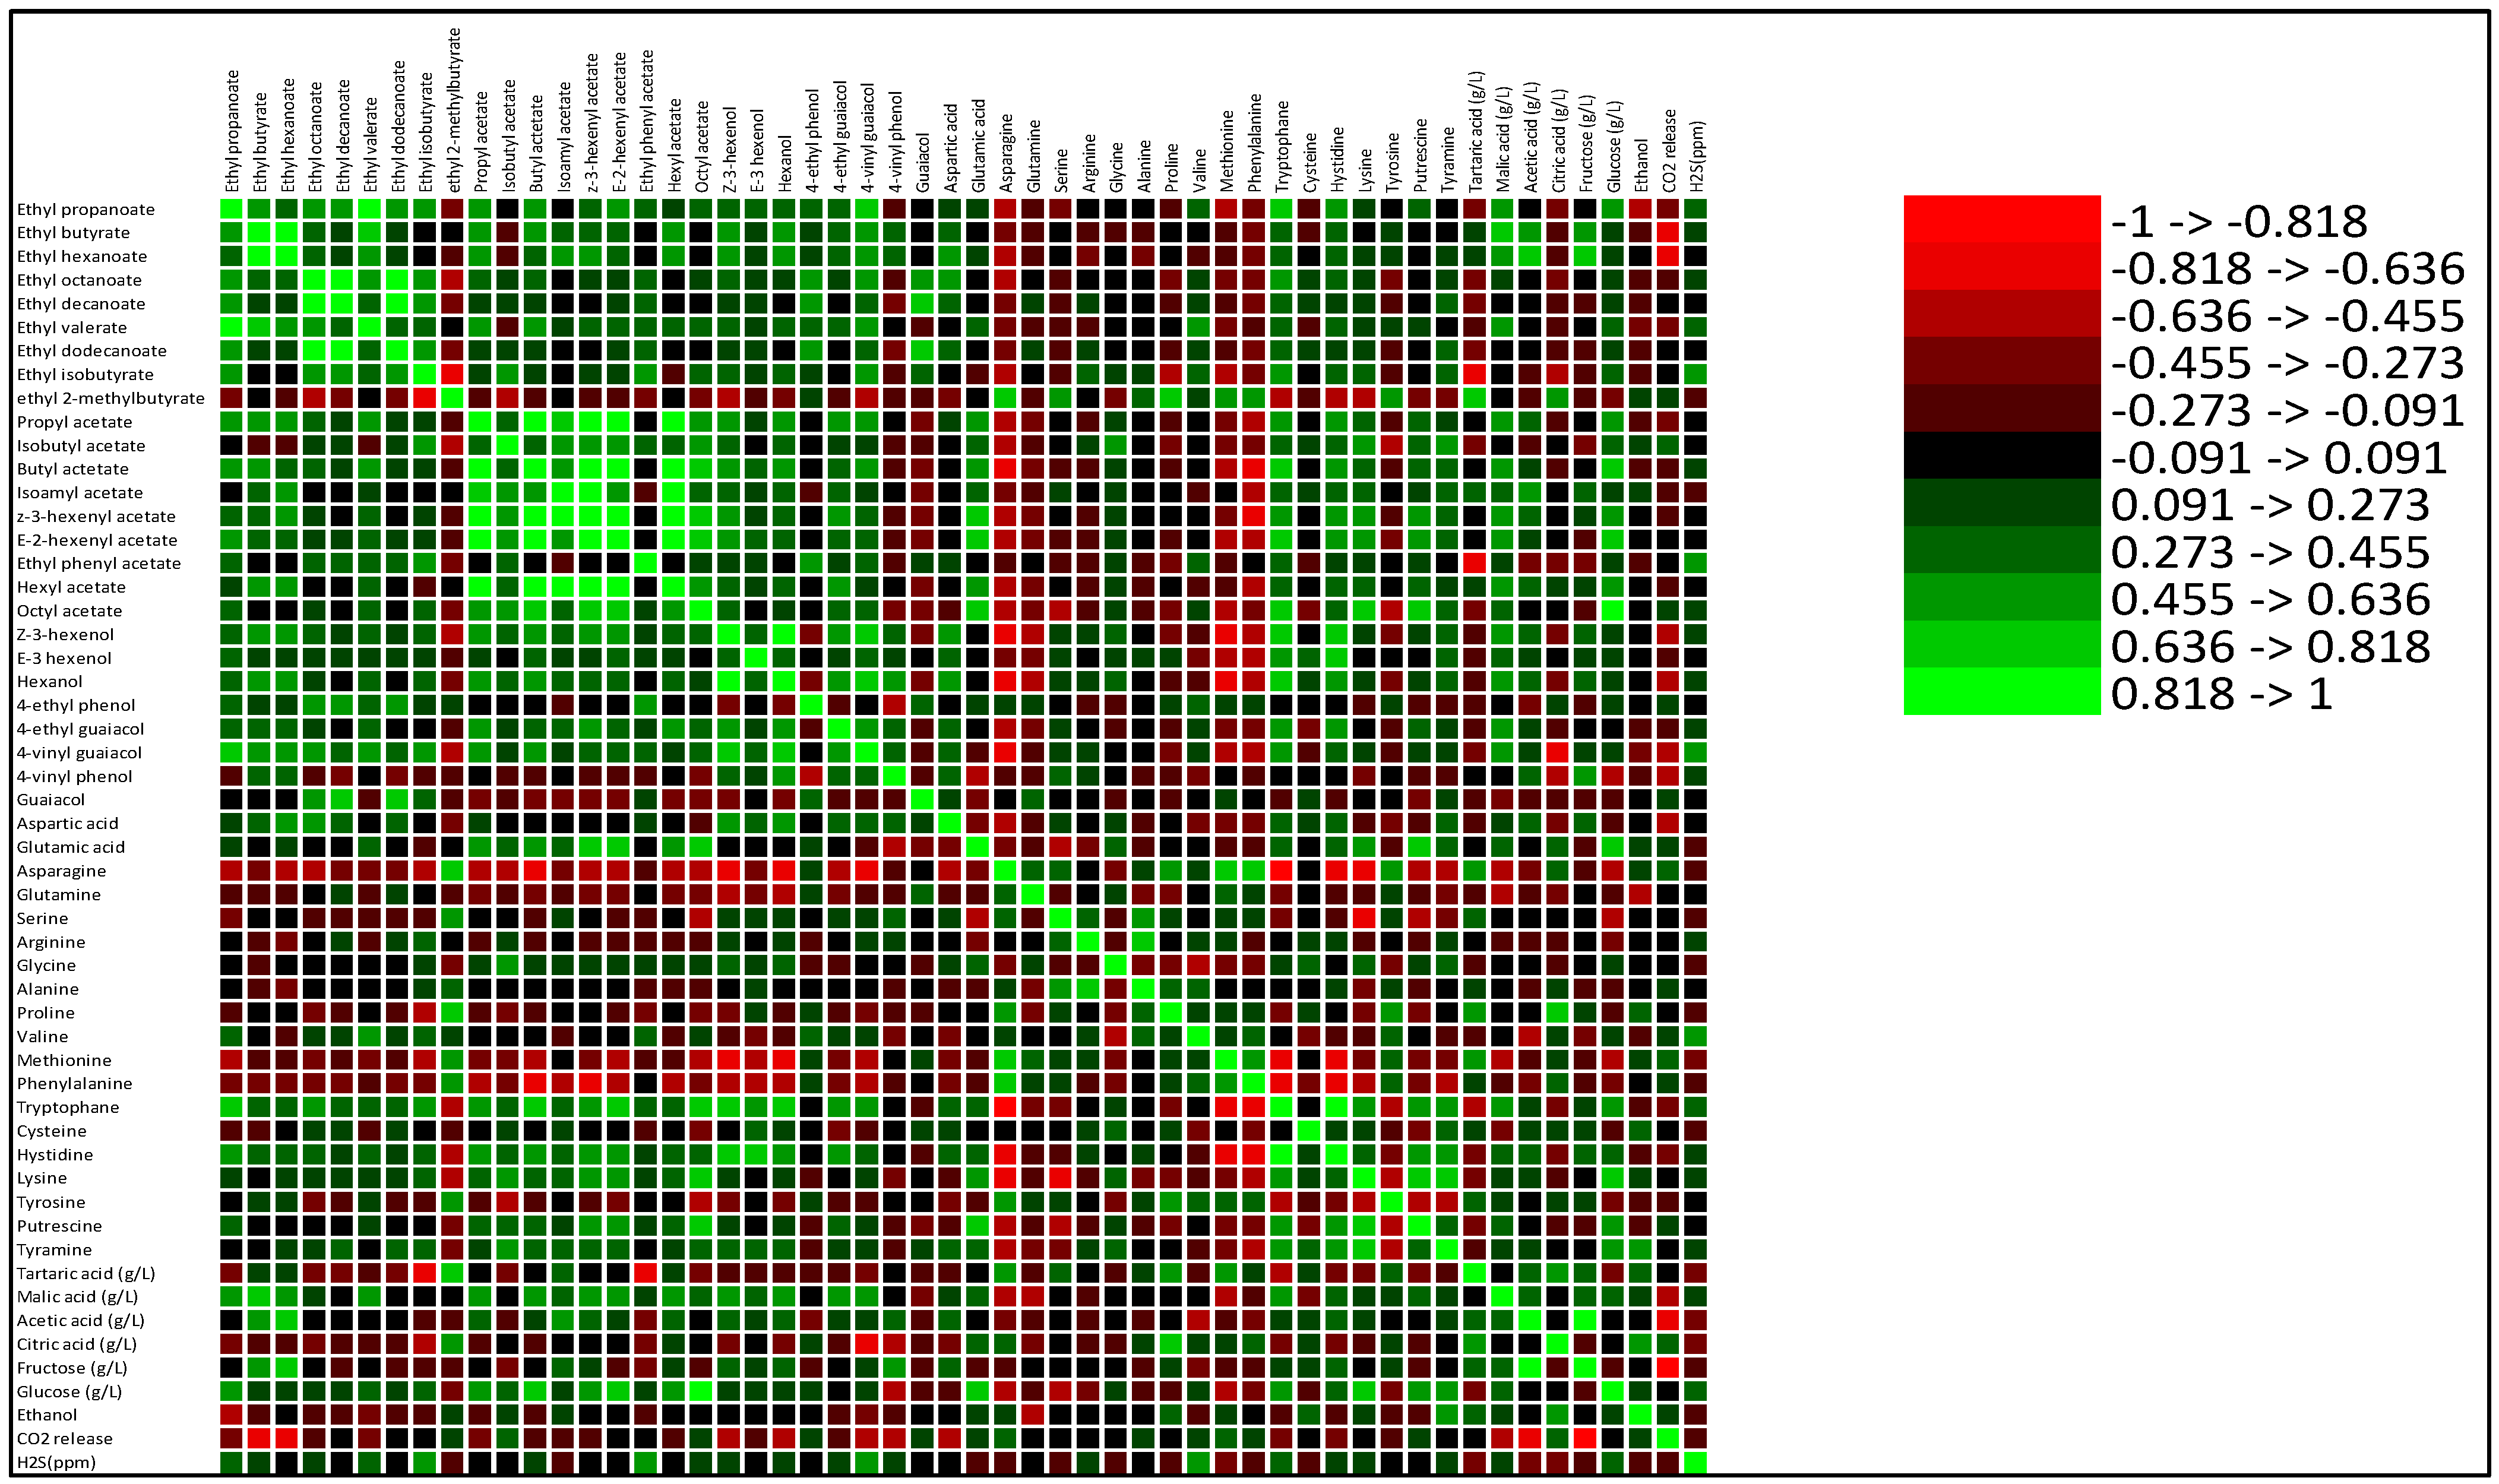
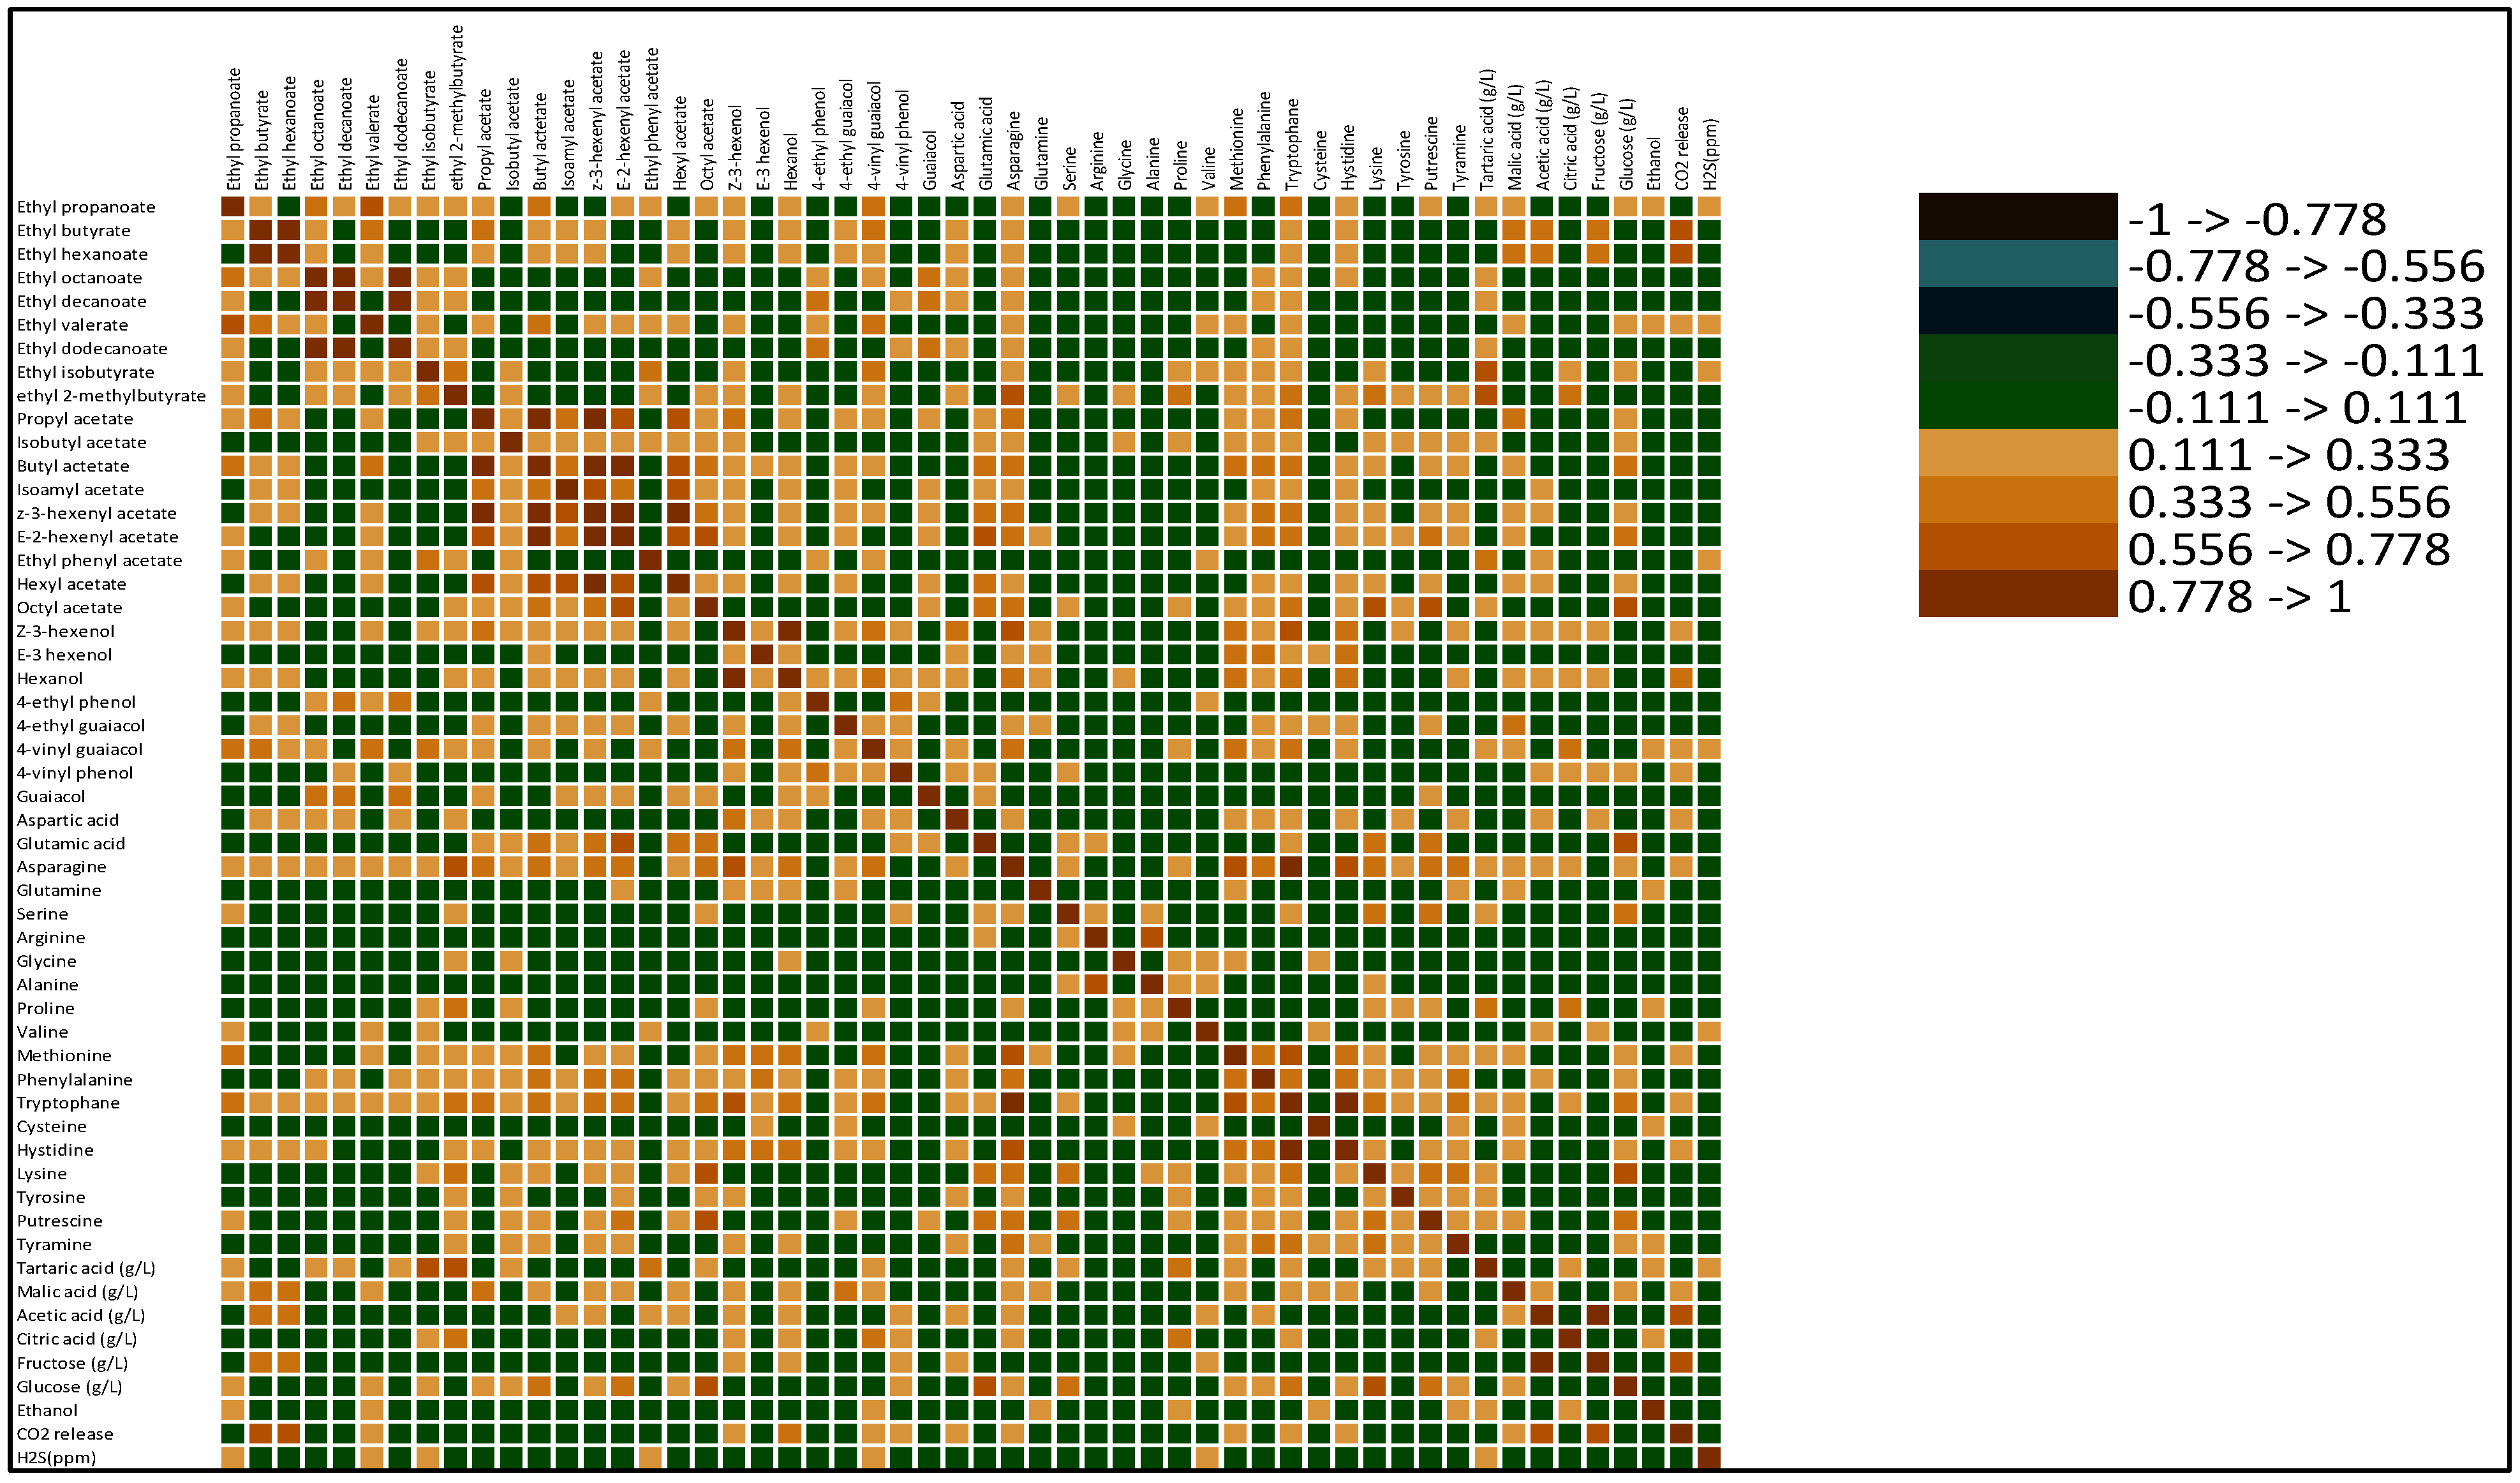
3.5. Correlations of AAs and Physico-Chemical Parameters with Aroma Compound Formation

Data Analysis and Data Configuration

As described in previous sections, we determined 54 different compounds (Table 1 (measured H2S production), Table 2, Tables S6 and S7) in the resulting ciders. Strain S. cerevisiae 2303 was identified as an outlier and omitted in further statistical analyses (see Appendix A). All 54 continuous variables (summarized in Table 1 (measured H2S production), Table 2, Tables S6 and S7) associated with 19 different yeast strains were selected to draw a heat map (Figure 3). In Figure 3, the rows represent the measured compounds (and the corresponding clusters), and the columns represent the different yeast strains (and the resulting clusters) used for the single-strain fermentations in the fermentation experiment.
Before generating the heat map, the data were standardized to a value between 0 and 100 using the following equation:
new score = (score − min(x))/(max(x) − min(x)) * 100,
The dendrograms on the top and left side of the heatmap show how the variables and the rows are clustered independently (they indicate the degree of similarity between the variables or yeast strains). Color coding is used to show the values of each variable in the dataset and also to show clusters of variables or samples that have similar expression patterns. The color scale indicates the range of values for each variable, with low values represented by dark colors and high values represented by light colors. Variables and/or samples (i.e., yeast strains) that are more similar to each other are grouped in the same cluster/block. The height of the dendrogram branches represents the degree of similarity between the variables or samples, with lower heights indicating a higher degree of similarity.
Although all patterns in the heat map may indicate a relationship between rows and columns, we look for rectangular areas that are approximately the same color. This indicates a group of rows correlated with the corresponding group of columns. According to the results of the heatmap analysis, the total of 54 variables associated with the 19 yeasts used for fermentation can be divided into four main classes, shown on the left side of the heatmap. In addition, the yeast strains are also divided into four main groups, shown in the upper part of the heatmap (Figure 3).
The first class of variables (i.e., the first class on the upper left) consists mainly of aromatic compounds (hexyl acetate, Z-3-hexenyl acetate, isoamyl acetate, butyl acetate, octyl acetate, propyl acetate, E-2-hexenyl acetate, octyl acetate); in this class are the amino acids glutamic acid and lysine and the biogenic amines putrescine and glucose. The second class of variables (i.e., the second class on the upper left) includes malic acid, 4-ethyl guaiacol, 4-ethyl valerate and ethyl butyrate. The third class of variables (i.e., the third class at the top left) includes H2S, the amino acid valine, and the aromatic compounds ethyl phenyl acetate and 4-ethyl phenol. The fourth class of variables (i.e., the fourth class at the top left) consists of CO2 release, glutamine, methionine, and serine.
It was found that the compounds of the first class of variables on the upper left in cider fermented with S. uvarum strains 2046, 2071, and 2061 (i.e., the first group of yeast strains on the upper left) had the lowest content. The highest levels of the same class of variables/compounds were found in cider fermented with S. uvarum 2104, 2186, 2204, 2120, and 2128 (i.e., the third group of yeasts above). In an analogous analysis, the compounds of the second class of variables are found to have the second lowest content in fermented strains S. uvarum 2046, 2071, and 2061 (i.e., the first group at the top left).
The second yeast group with 4 S. cerevisiae strains (2273, 2095, 2265, and 2003) and one S. uvarum strain (2083) showed predominantly high levels of the fourth class of variables/compounds: relatively high CO2 release, high levels of the remaining amino acids glutamine, methionine, asparagine, phenylalanine, tyrosine, proline, alanine, serine, and tartaric and citric acids, and the highest levels of the aromatic compound ethyl 2-methylbutyrate.
Based on the observed color scales, it can also be said that the fourth yeast group (i.e., the fourth group at the top from the left), consisting of one S. cerevisiae strain (2349) and five S. uvarum strains (2176, 2216, 2376, 2402, and 2401), has the highest content of the second class of variables (relatively high contents of malic acid and the other amino acids histidine and tryptophan, high contents of volatile phenols 4-vinylphenol, 4-vinylguaiacol and 4-ethylguaiacol, relatively high contents of all three C6 alcohols and ethyl esters ethyl valerate, ethyl propanoate, ethyl hexanoate, and ethyl butyrate).

3.6. Relationships between Aroma Compounds and Variables

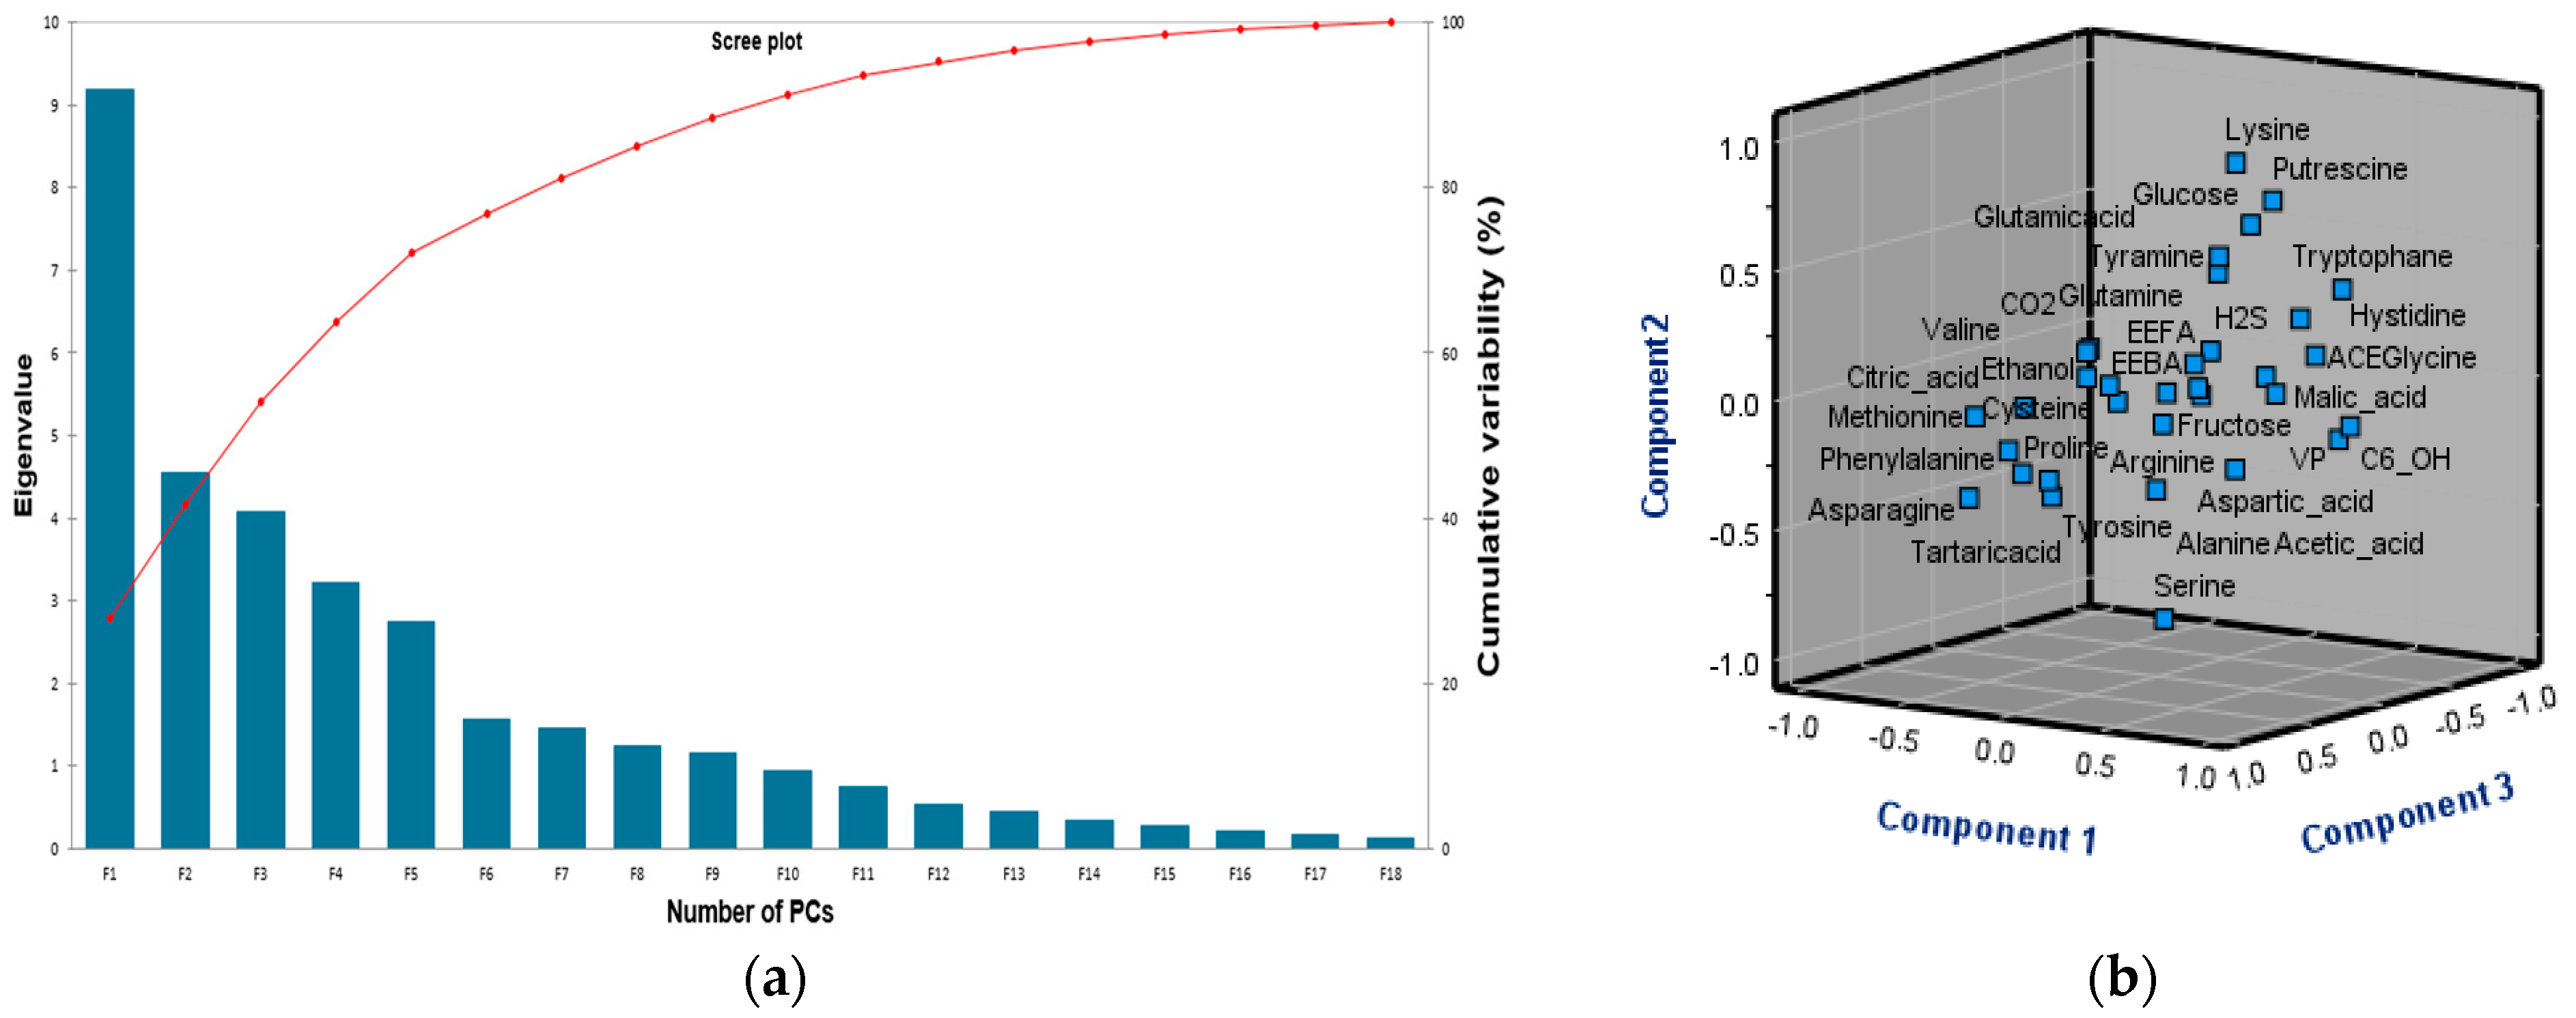
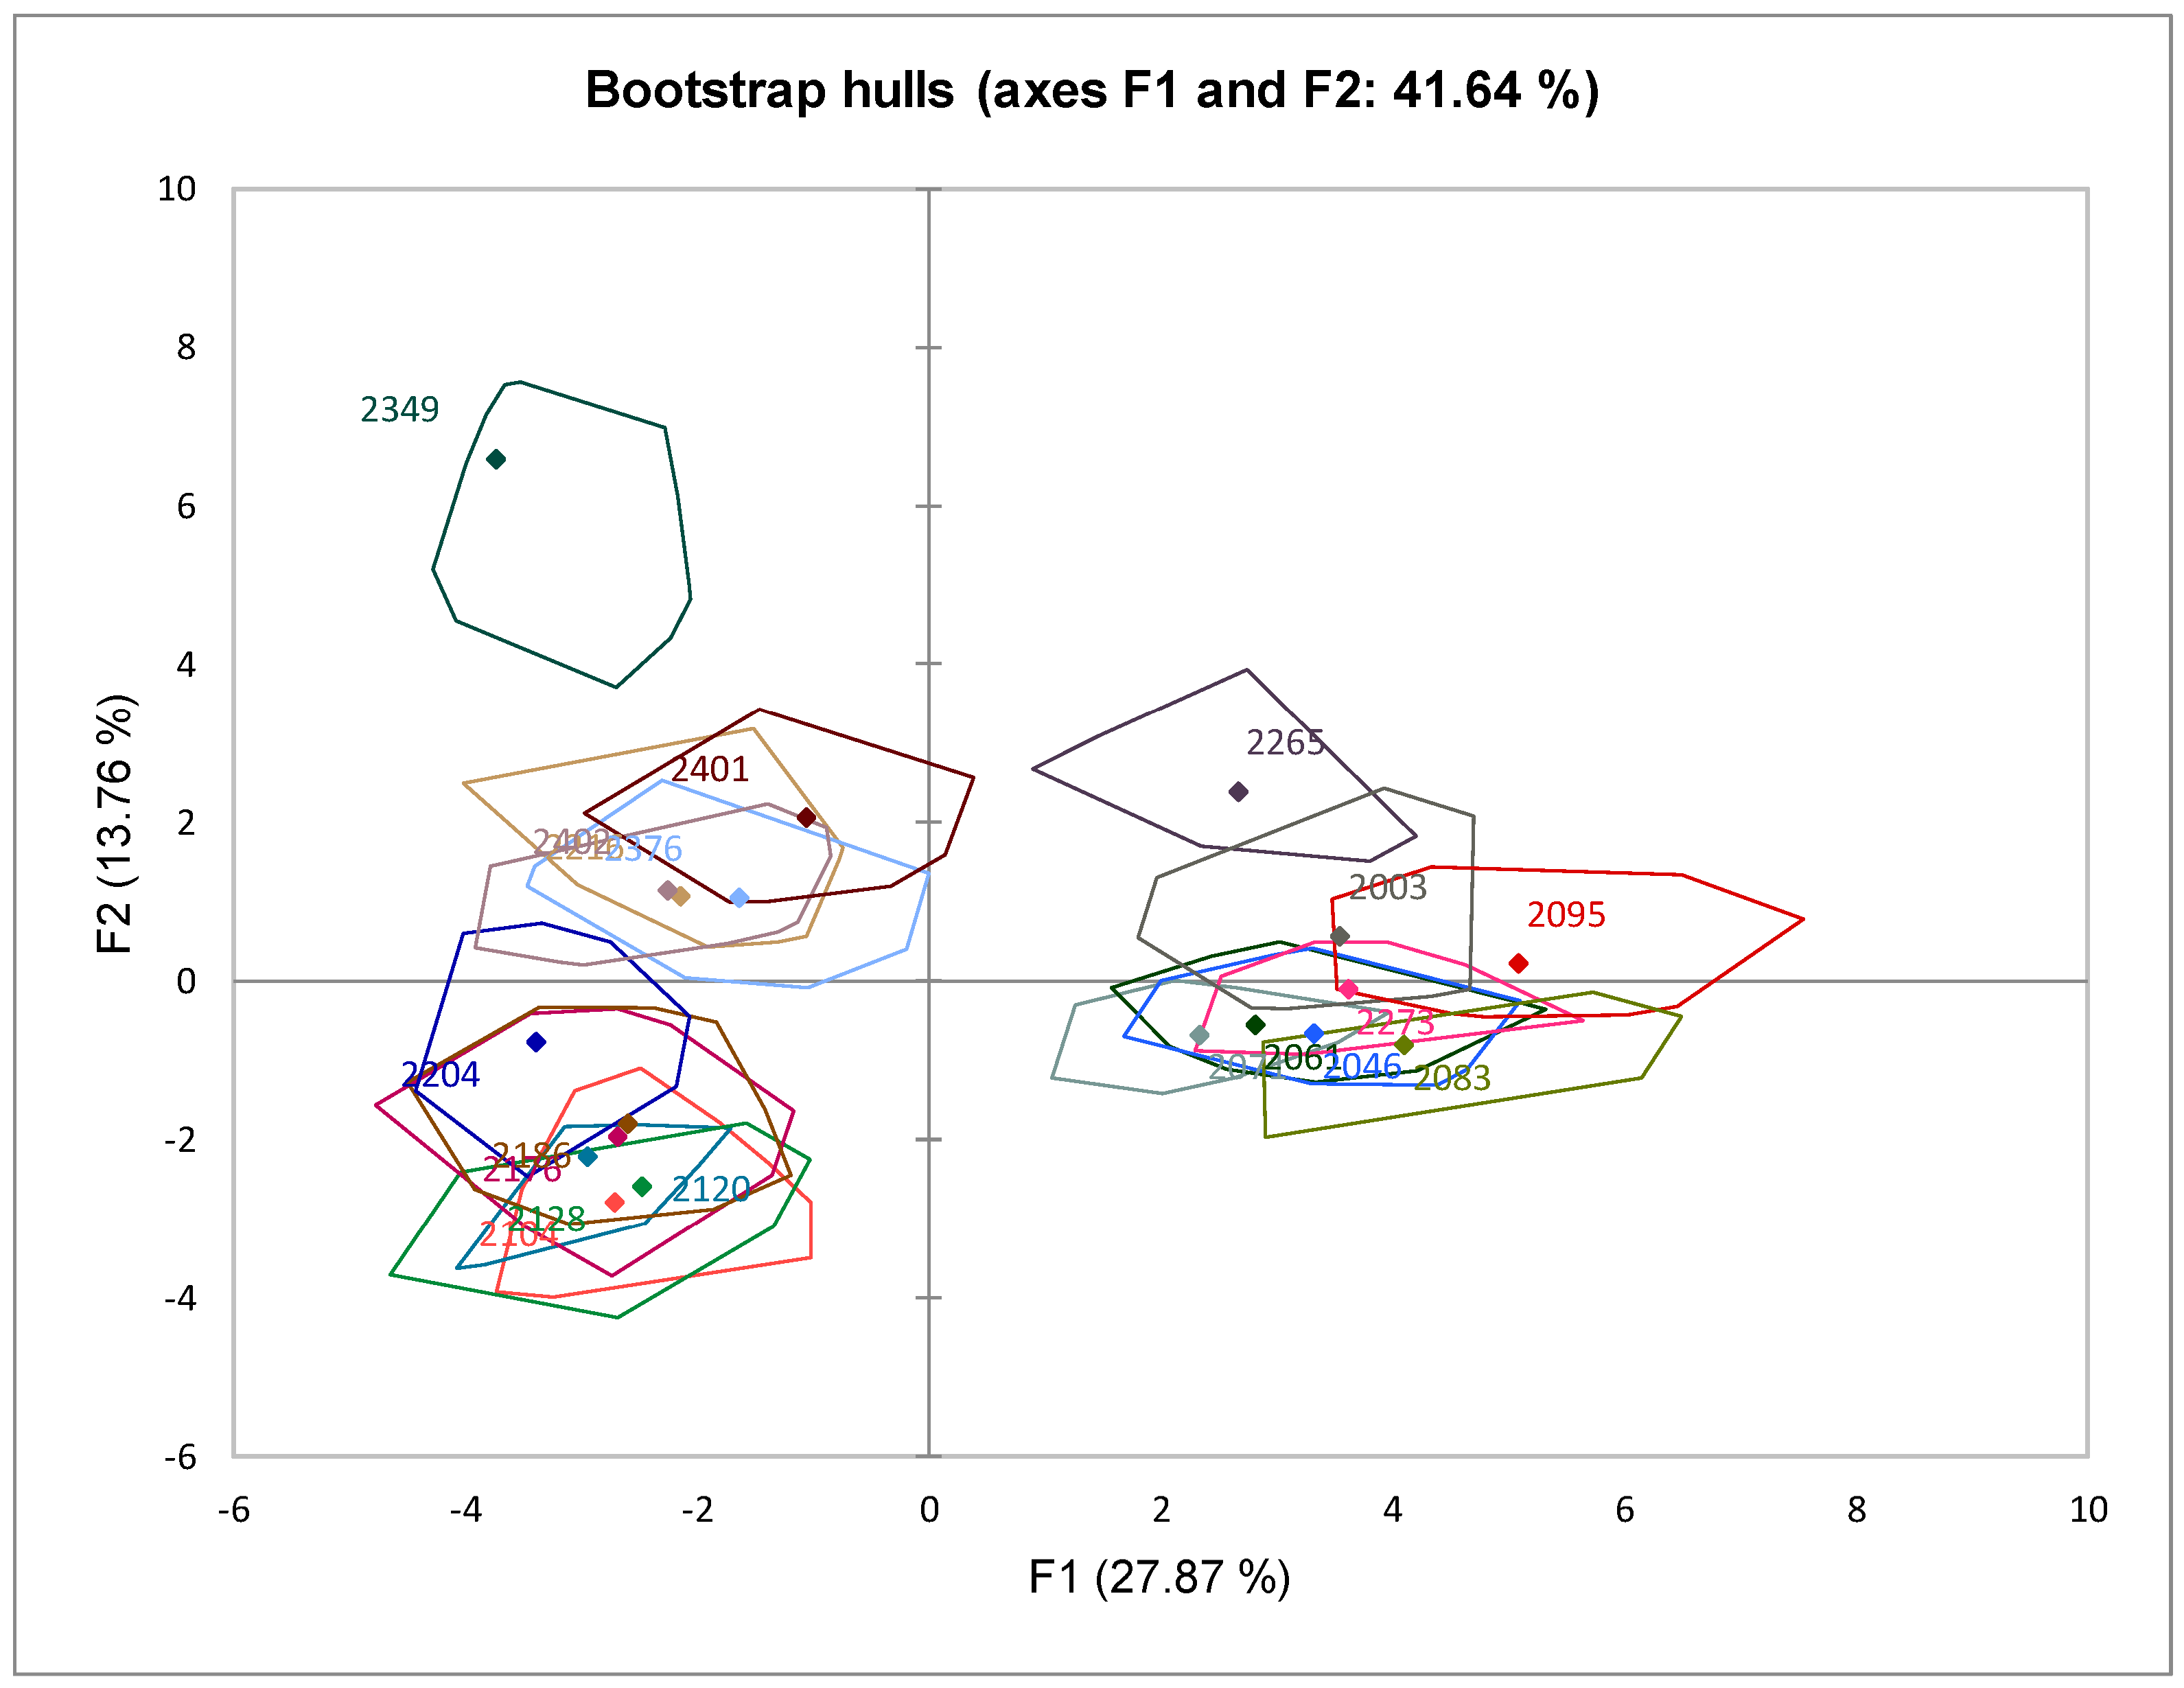
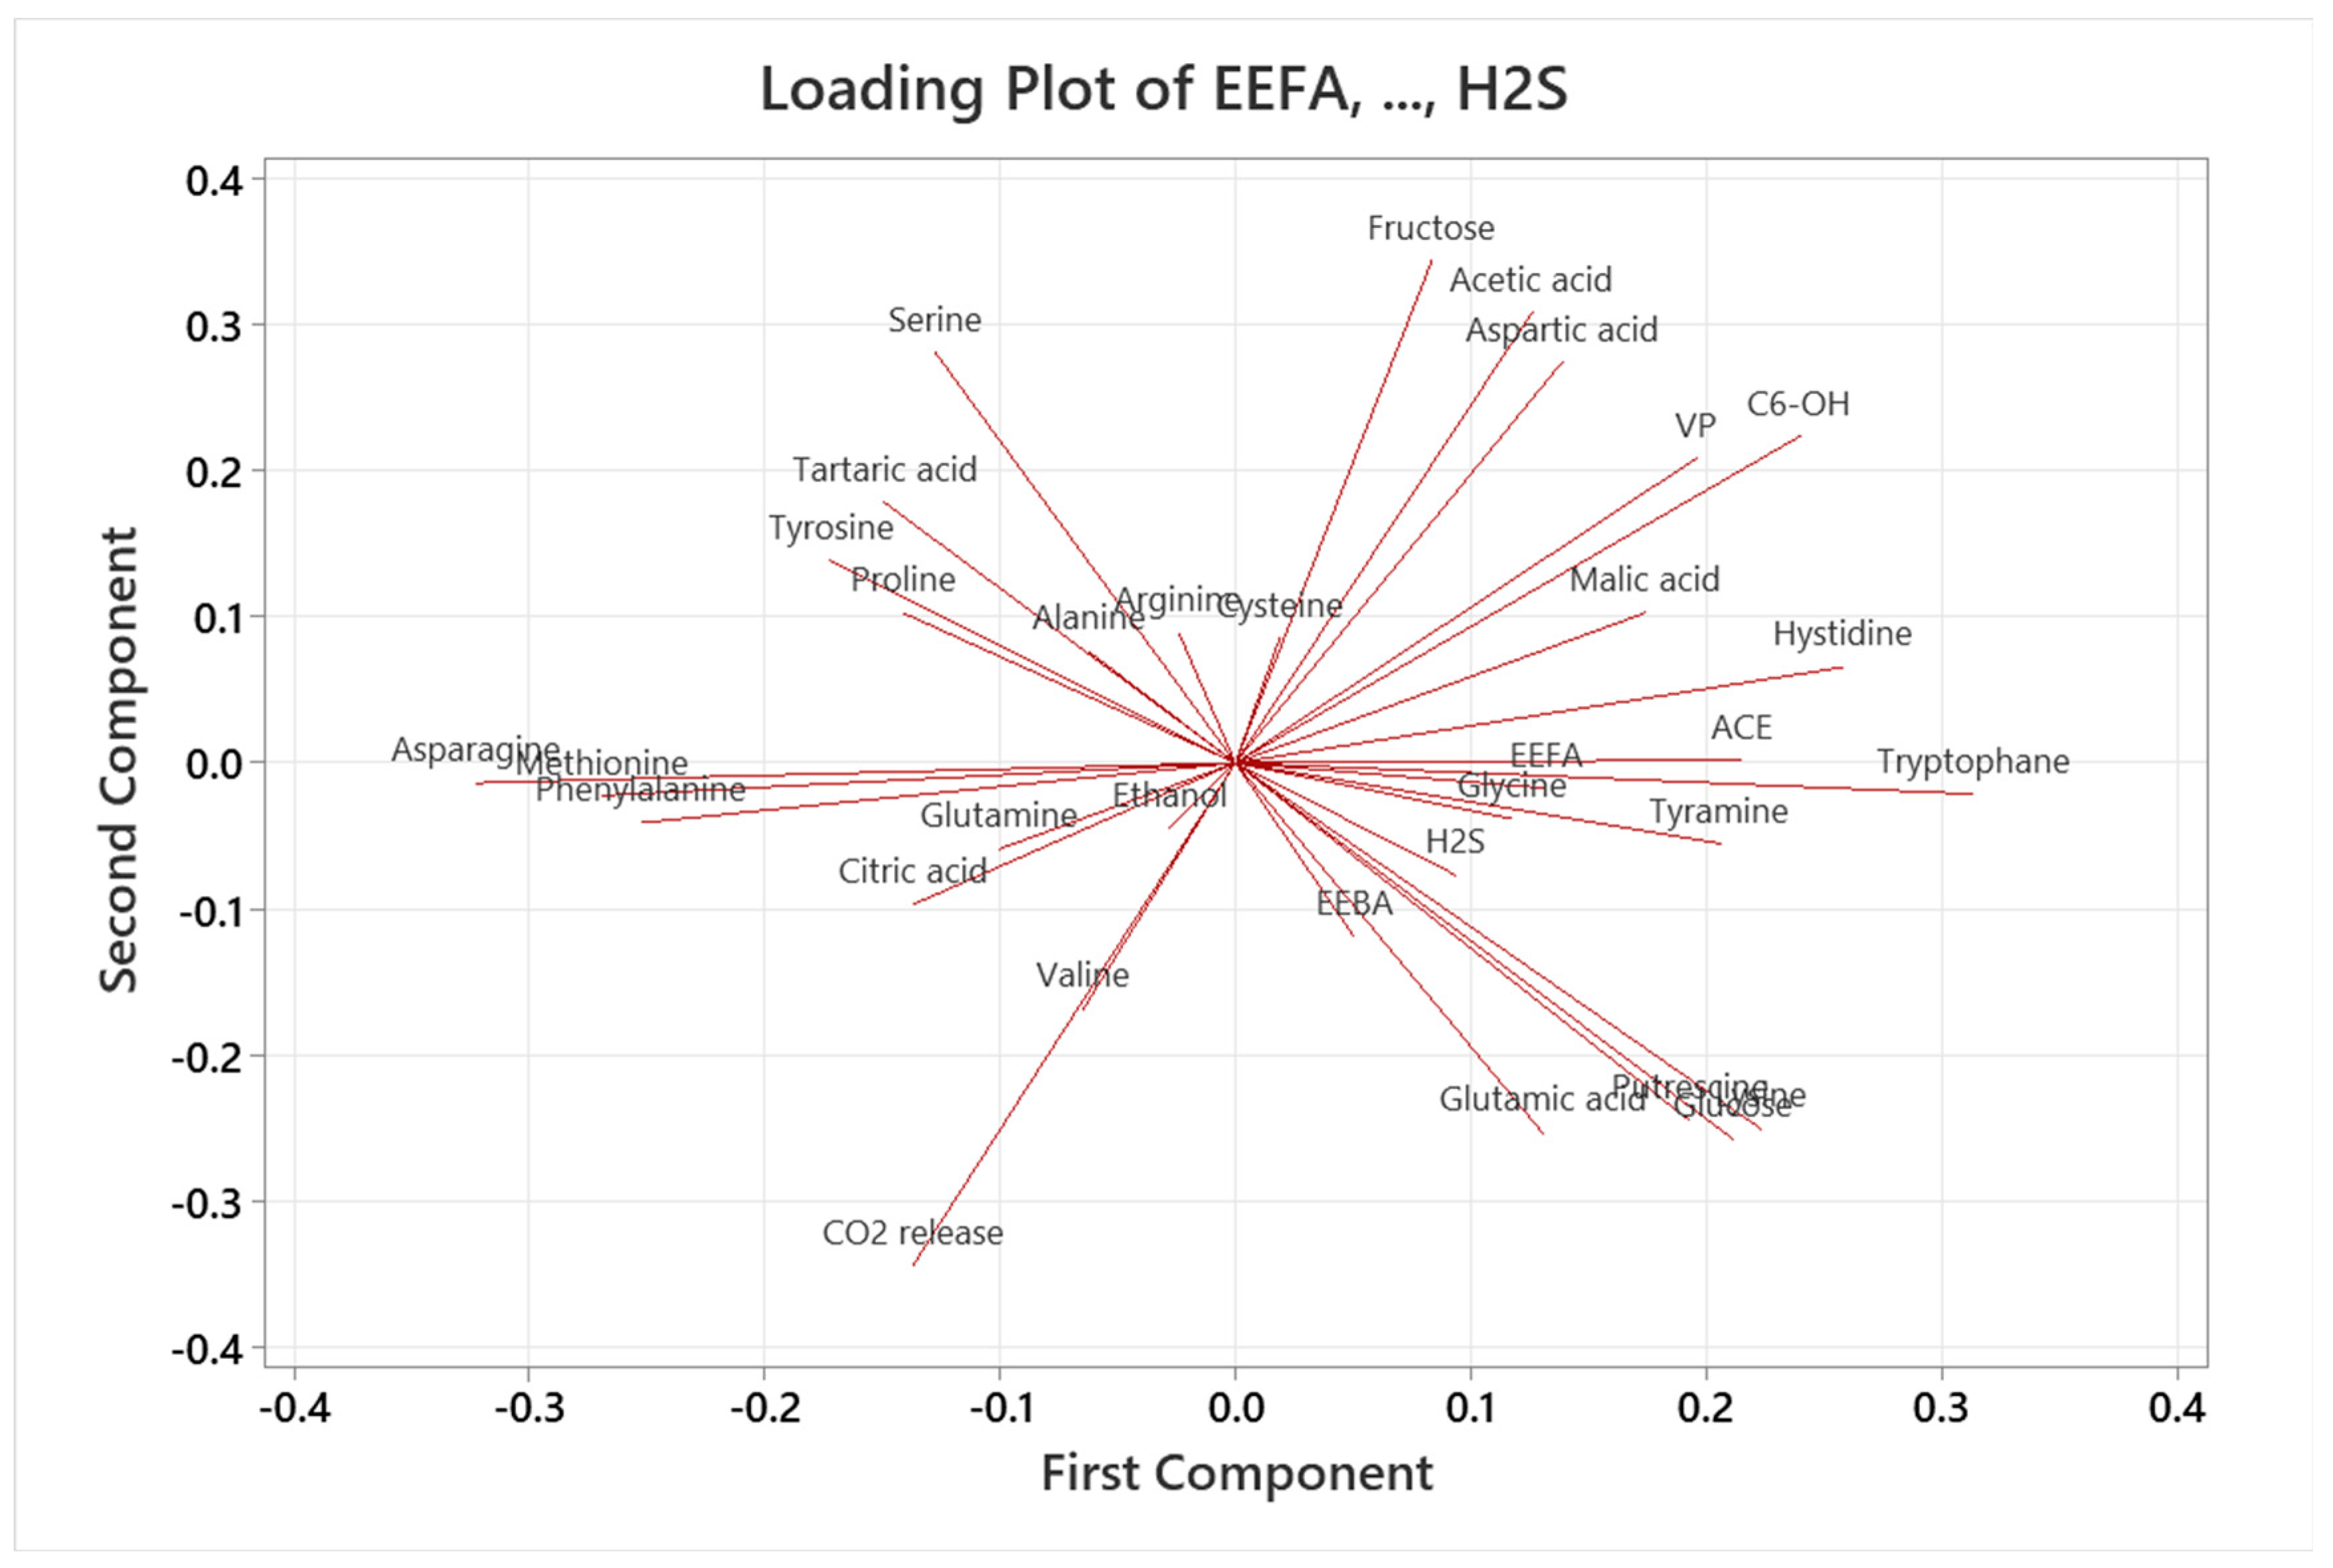
3.6.1. Principal Component Analysis (PCA)

To perceive an initial configuration of our data/variables and to simplify the dataset by identifying possible patterns and relationships between all variables, a principal component analysis (PCA) was performed and validated using the correlation matrix in IBM SPSS Statistics 27 and GraphPad Prism 9.5.1 (see Appendix A for additional description). In the PCA analysis, ethyl esters of fatty acids, ethyl esters of branched acids, acetate esters, C6 alcohols, and volatile phenols were the five chemical classes/groups of aroma compounds, and the other 28 features, including amino acids, sugars, ethanol, organic acids, etc., were entered as other important variables.
From the eigenanalysis of the correlation matrix related to PCA, nine principal components (represented by PC or F) were extracted, and 54.0% of the variance in the data set was explained by the first three components (F1 = PC1 = 27.9%, F2 = PC2 = 13.8%, and F3 = PC3 = 12.4%). When we refer to explained variance in terms of the PCs, we are referring to the proportion of variance in the entire collection of response and predictor variables that is explained by the PCs. In our results, the first nine principal components have eigenvalues greater than 1 (see the scree plot in Figure 4). These nine components explained approximately 89% of the variation in the data (Figure 4). However, since the cumulative variance of 54.1% in the first three components does not report the adequate amount of variation we expected, we performed another statistical analysis, the partial least squares (PLS) regression analysis.
The Component Plot in Rotated Space (CPRS) shown in Figure 4 displays the scores of the first three PCs, which capture most of the variance in our data set. This plot is a graphical representation of the results of PCA with orthogonal rotation. Each point on the plot represents a variable in our data set, and the position of the point in the new rotated space is determined by the scores of the observation on the PCs. In other words, the CPRS shows how the variables in our dataset are related based on the underlying patterns identified by the PCA method. Variables that are close to each other on the graph (e.g., lysine and putrescine) have similar principal component values, indicating that they share similar underlying patterns. Observations that are far apart on the graph (e.g., lysine and serine) have different values on the PCs, indicating that they have different underlying patterns. The CPRS can be useful in identifying clusters or groups of variables in the data set that have similar patterns. The problem of clustering yeast strains can also be explored in the PCA Bootstrap hulls (implemented in XLSTAT 2023) in Figure 5 and the partial least squares (PLS) regression analysis (implemented in Minitab 21 and XLSTAT 2023) in Figure 6.
Bootstrap hulls involve generating a series of bootstrap samples from the original dataset and then computing the PCs for each bootstrap sample. We use them to assess the significance of individual observations/yeasts in our dataset and to see the possible clusters in our 19 fermented yeast strains (in the first two PCs). Yeast strains that consistently fall within the convex hull of the scores for each bootstrap sample are considered statistically significant, while yeast strains that consistently fall outside the convex hull are considered statistically non-significant. By using bootstrap hulls in PCA, we identified influential observations (i.e., the yeast strains) in the dataset that could affect the results of the analysis. The results of the analysis can be interpreted based on the location of the observations relative to the bootstrap hulls. Observations that consistently fall outside the convex hull may be outliers or noise in the data. By identifying influential observations, it is possible to determine if they are outliers that need to be removed from the analysis or if they represent important patterns in the data that should be investigated further. However, as can be seen in Figure 5, our observations consistently fall within the designated convex envelope. Therefore, they should all be considered statistically important and reliable; this is because we have already identified and removed the outliers from our data set.

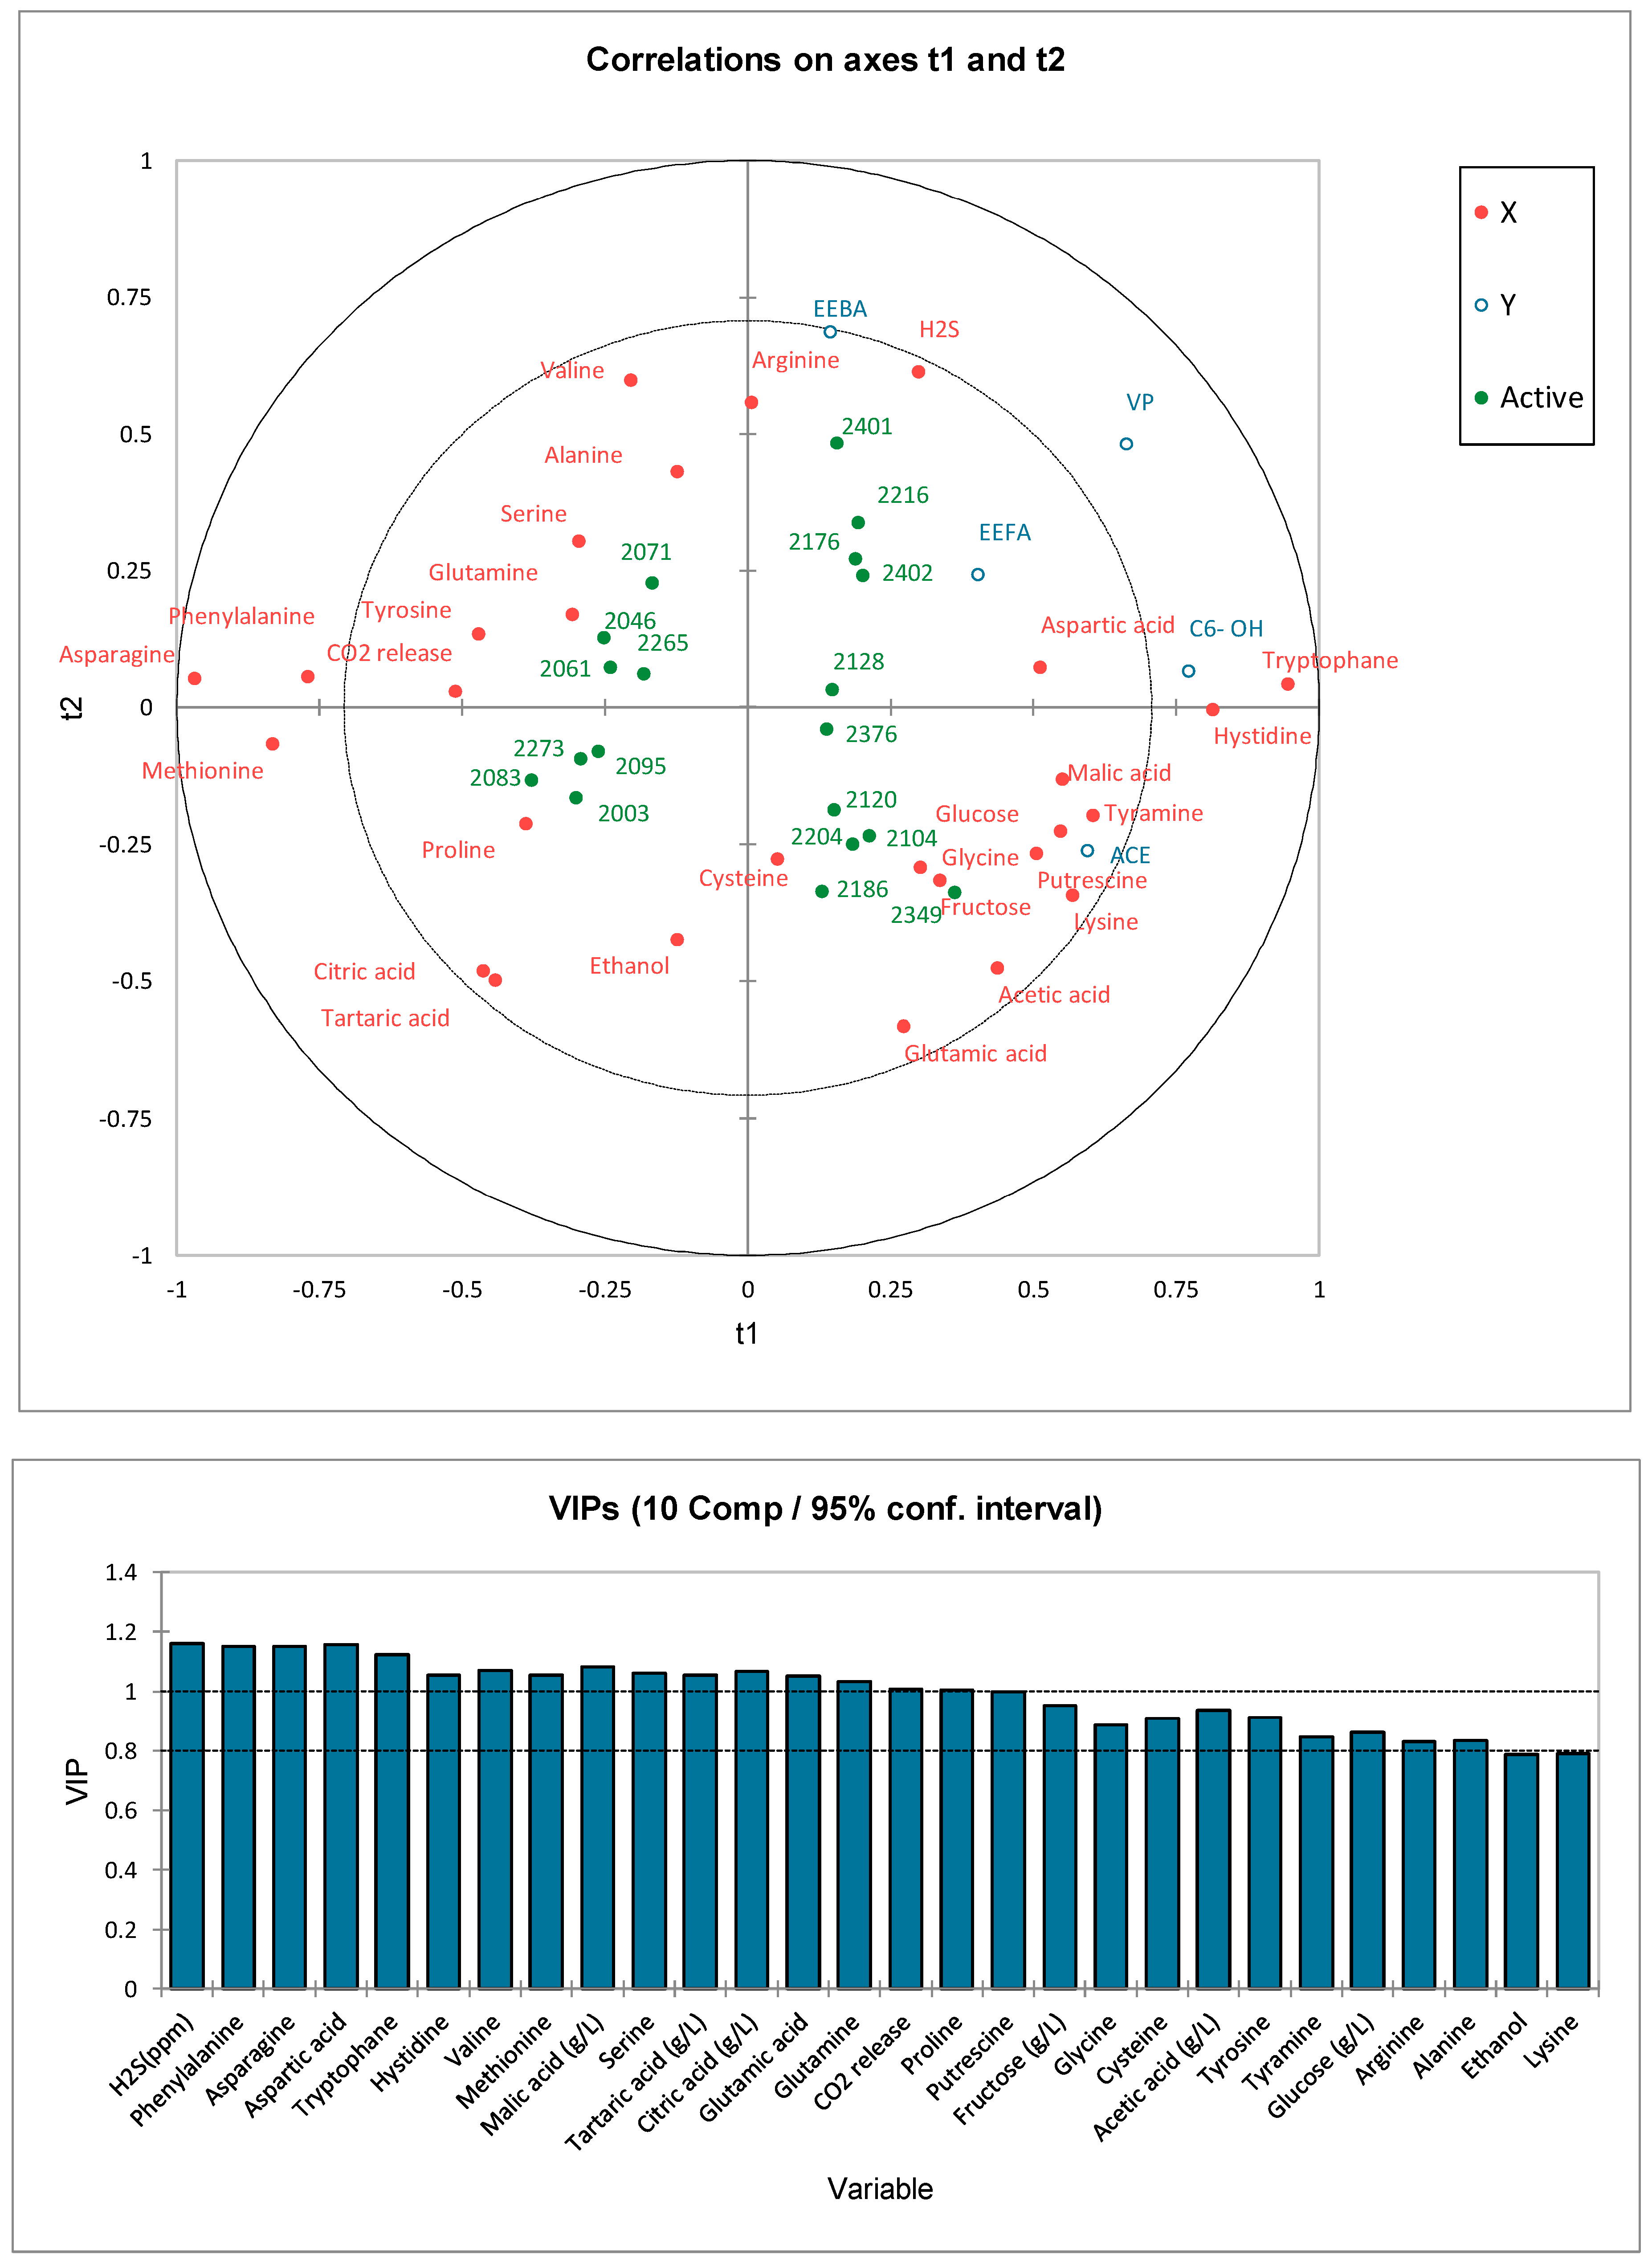
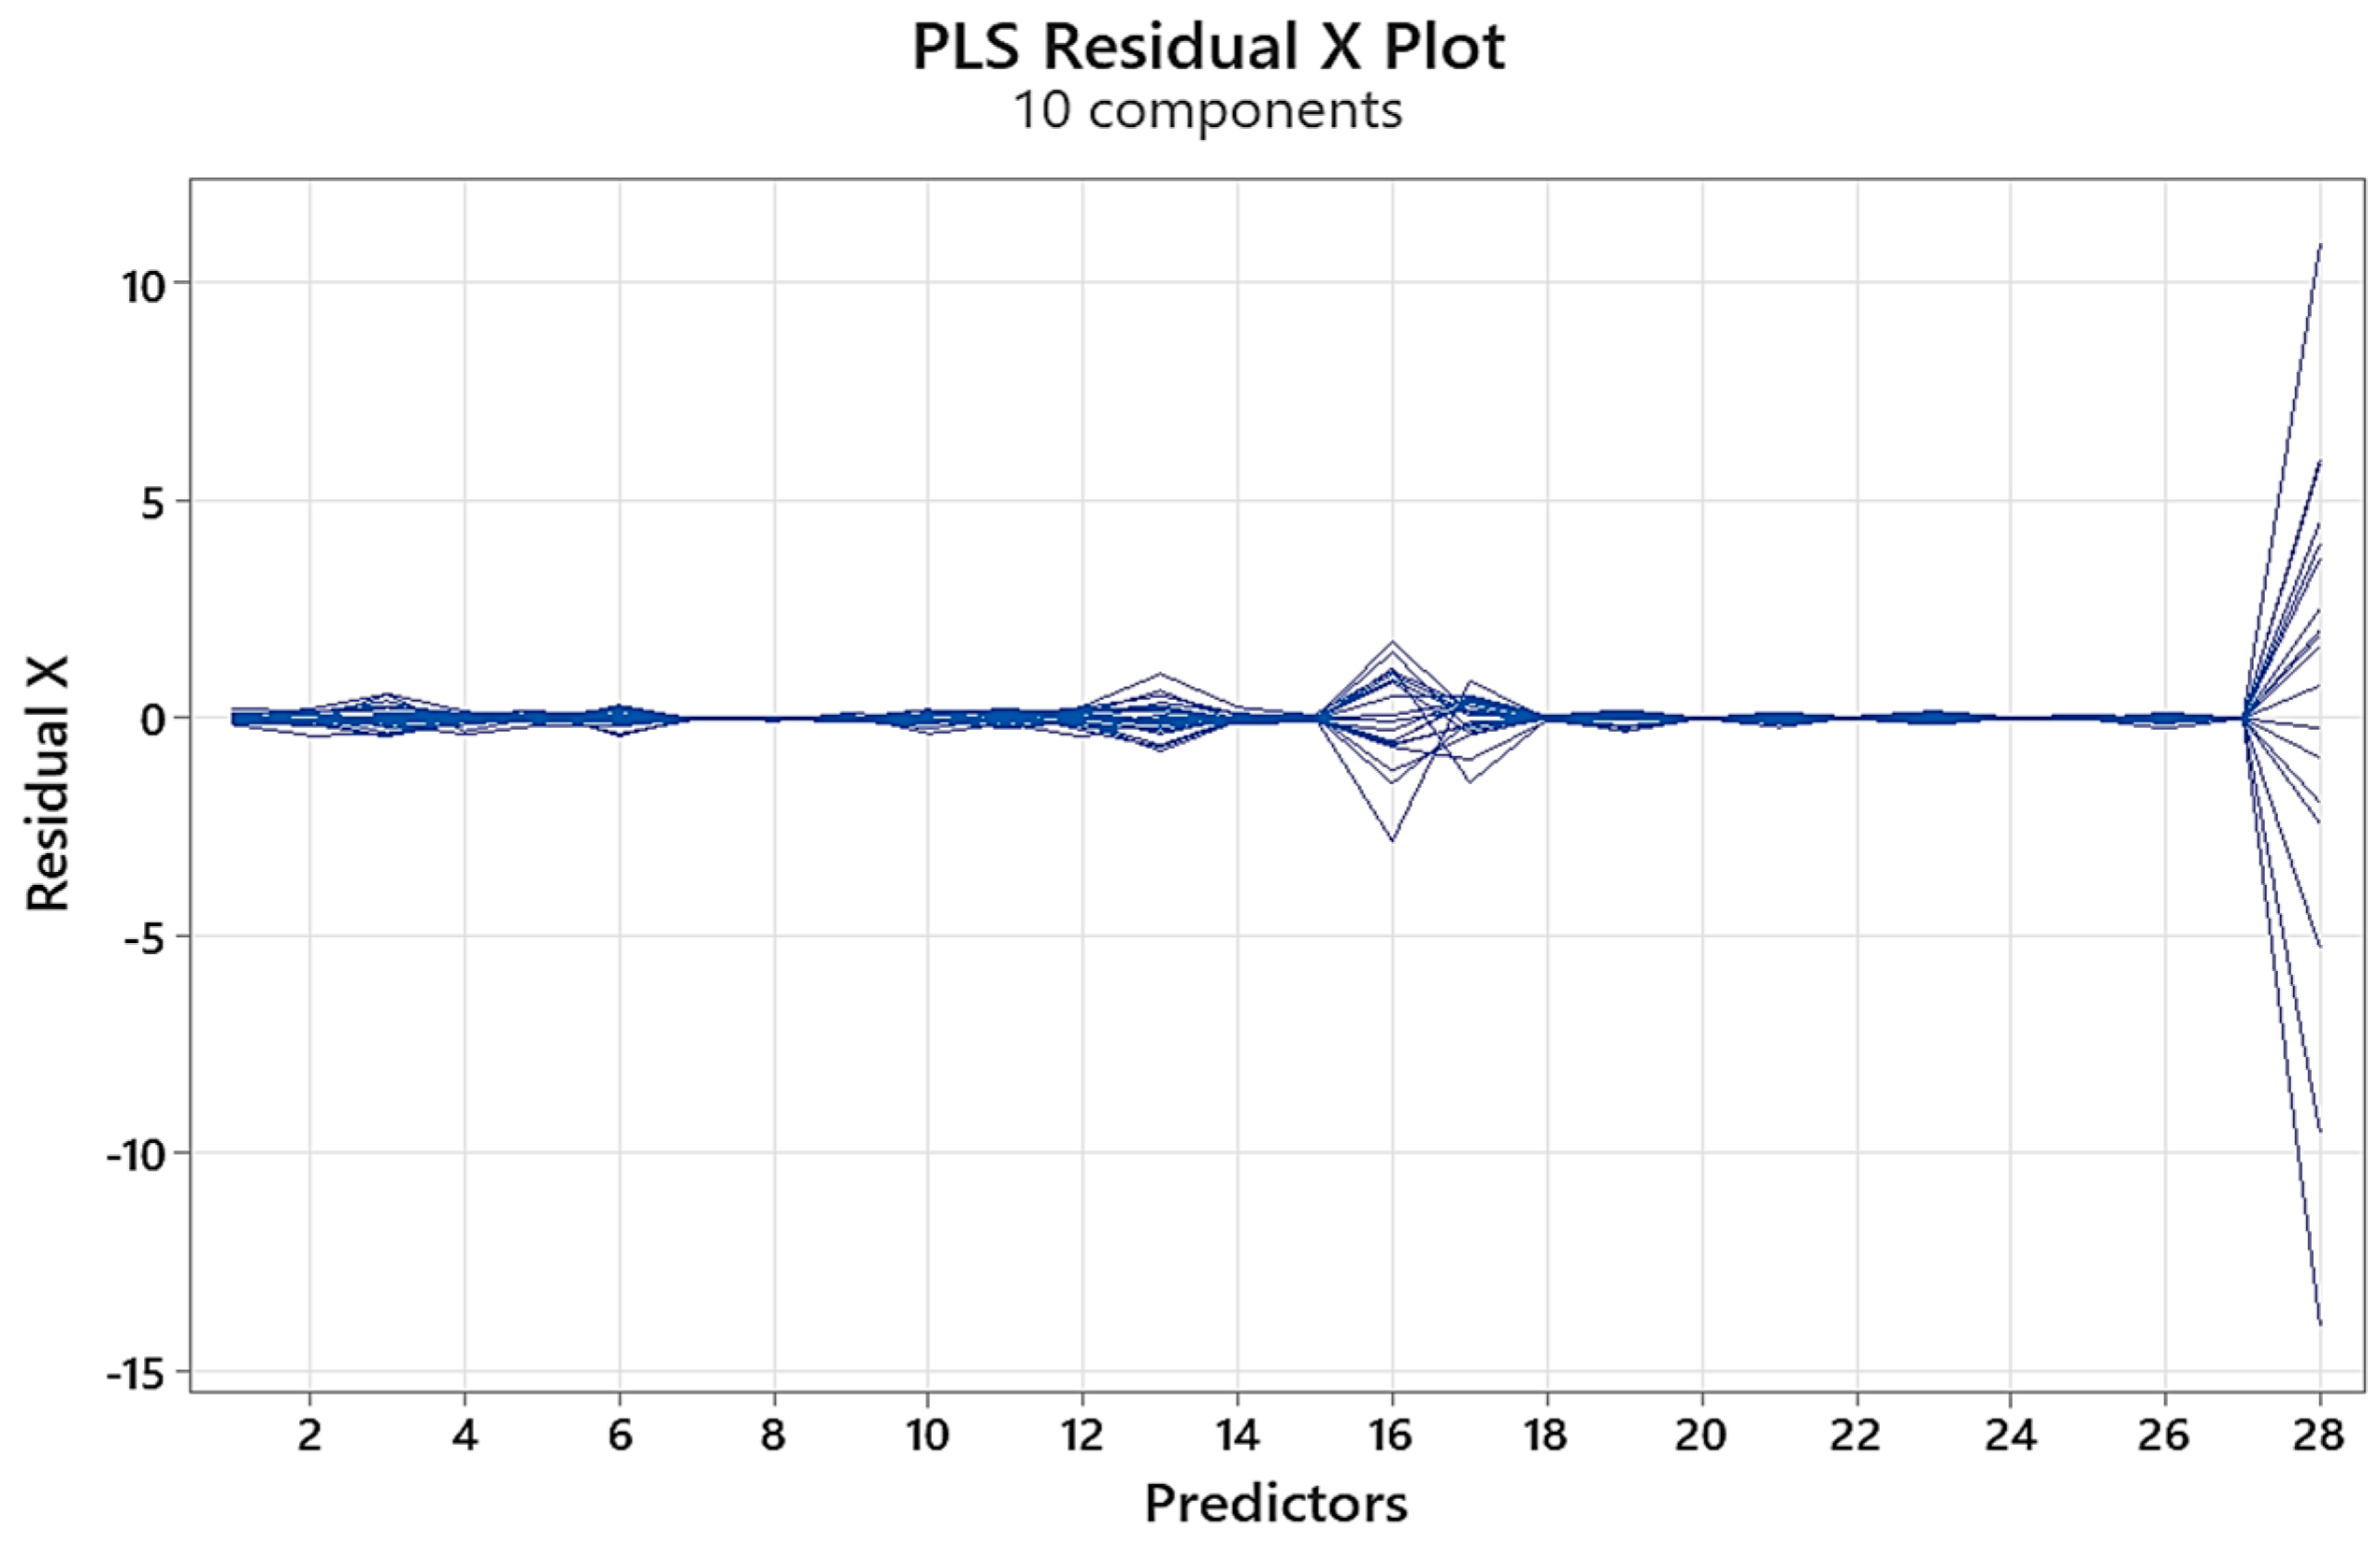
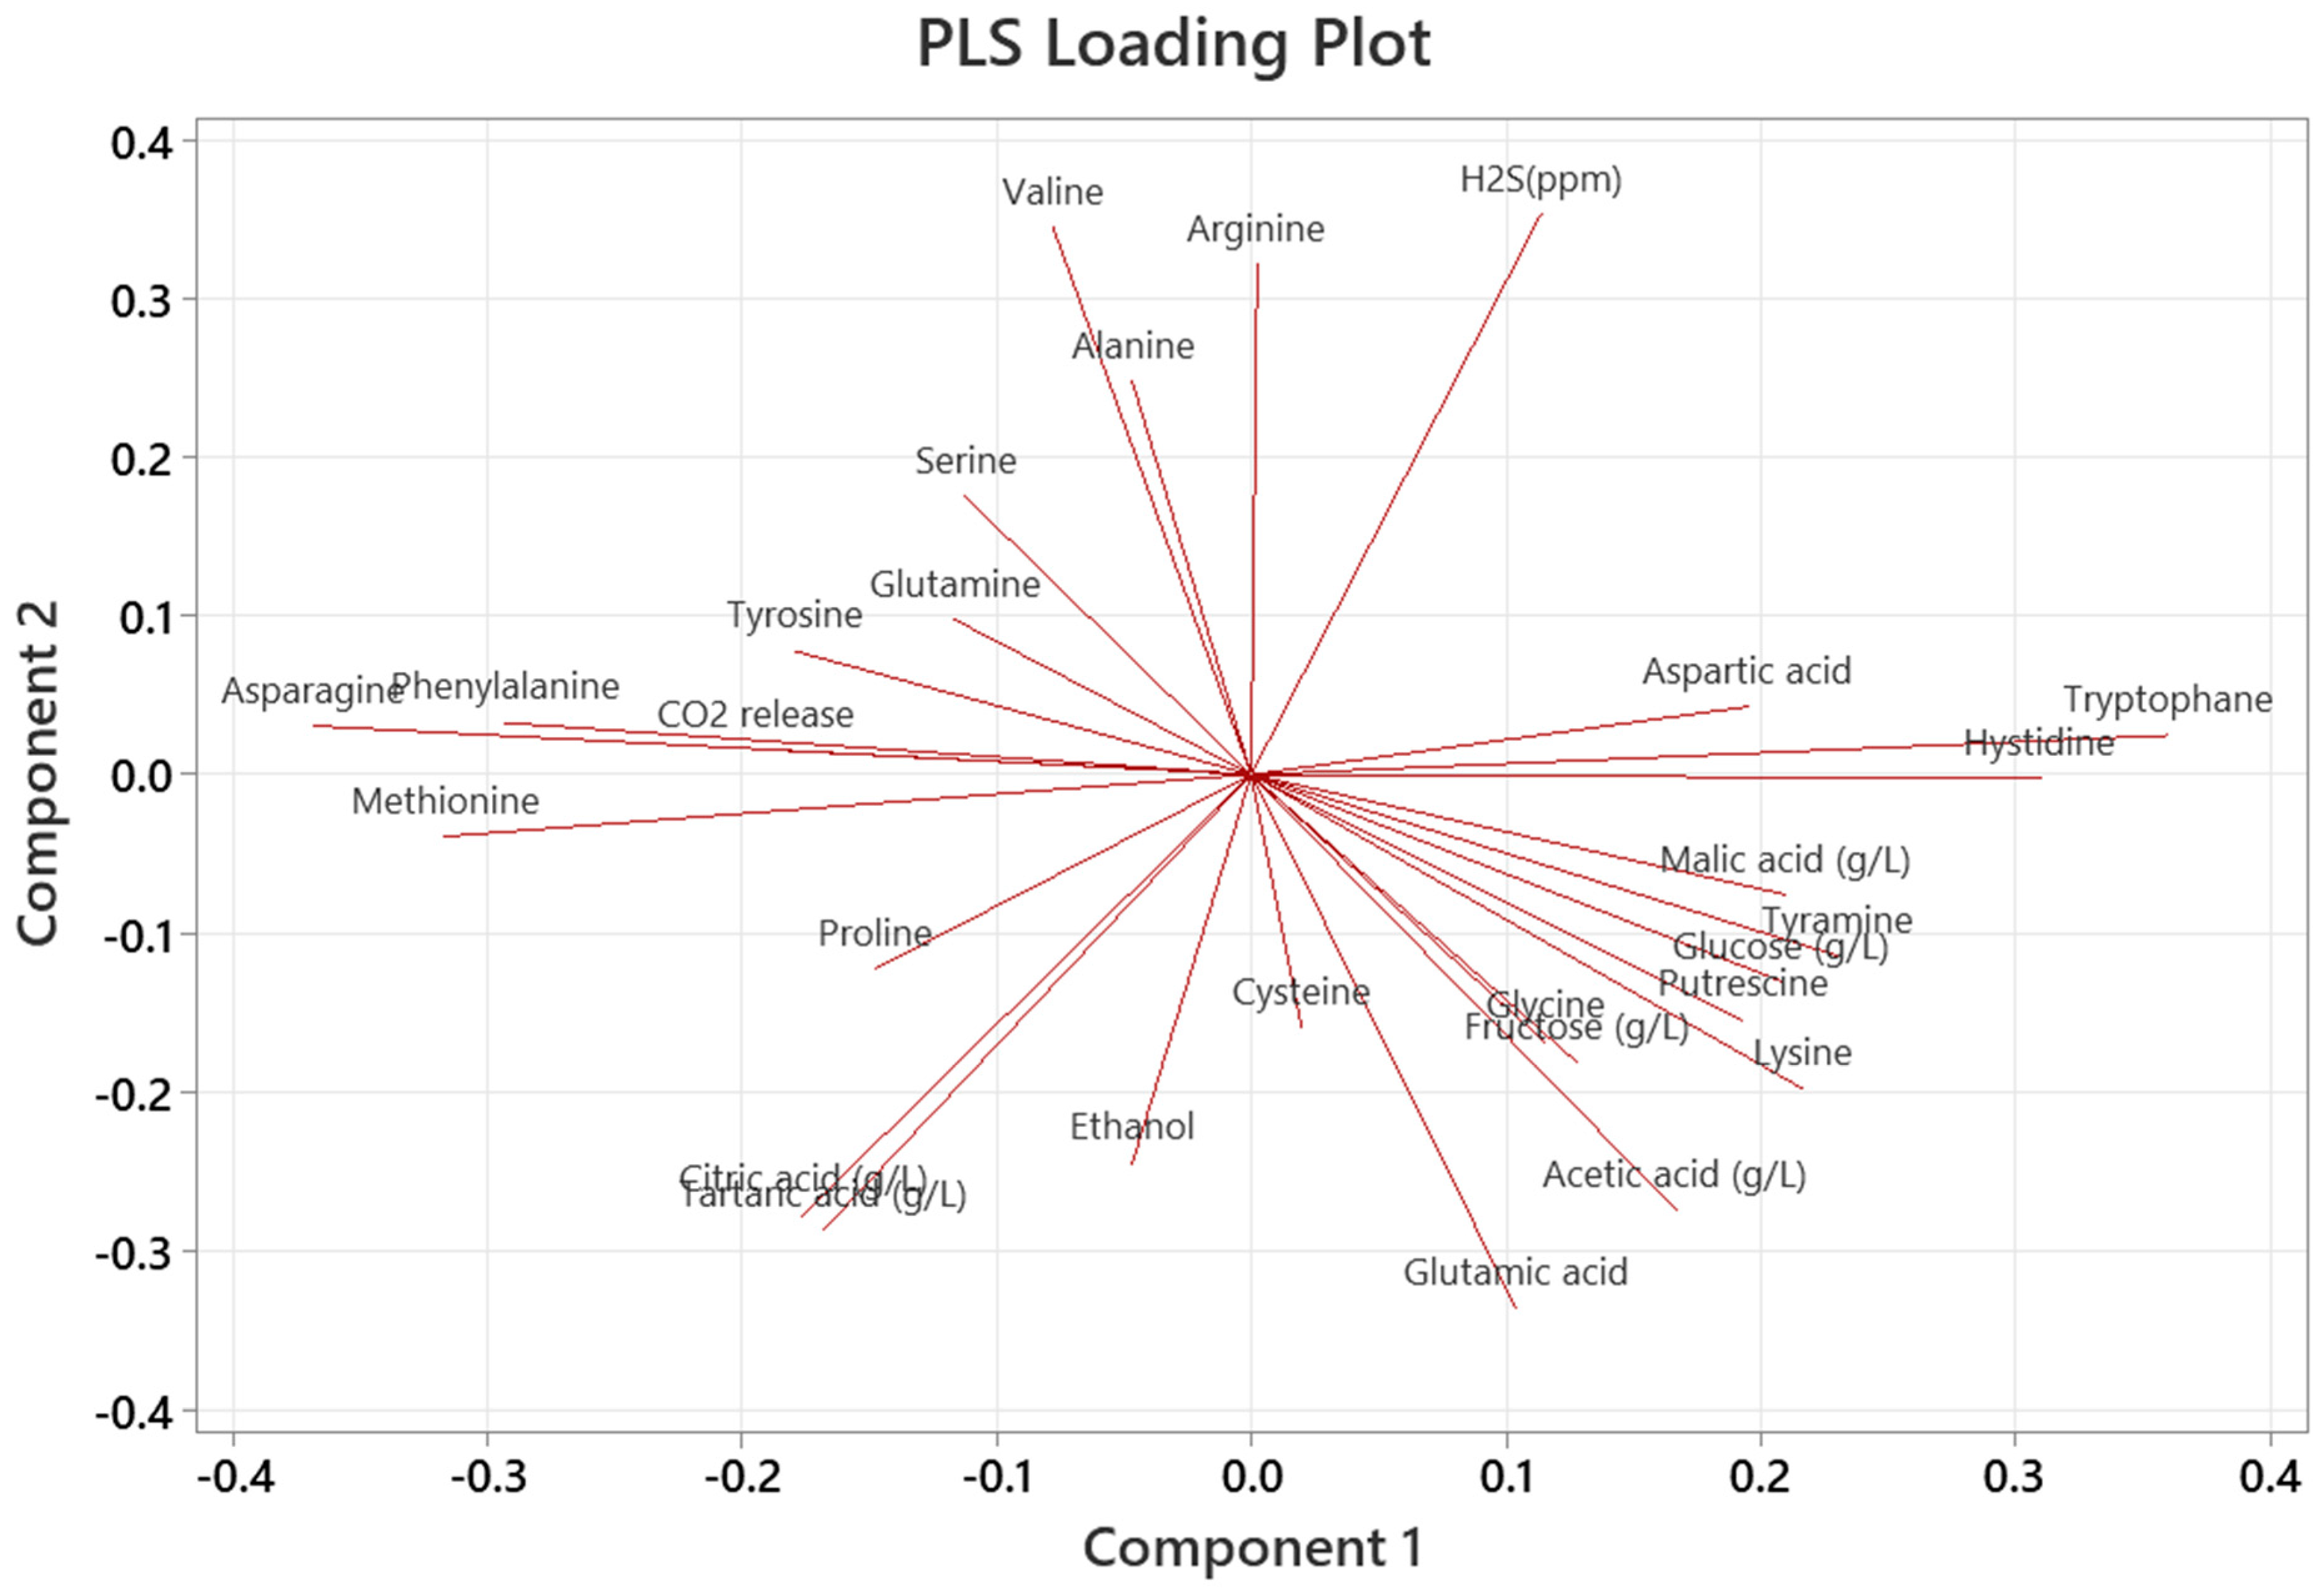
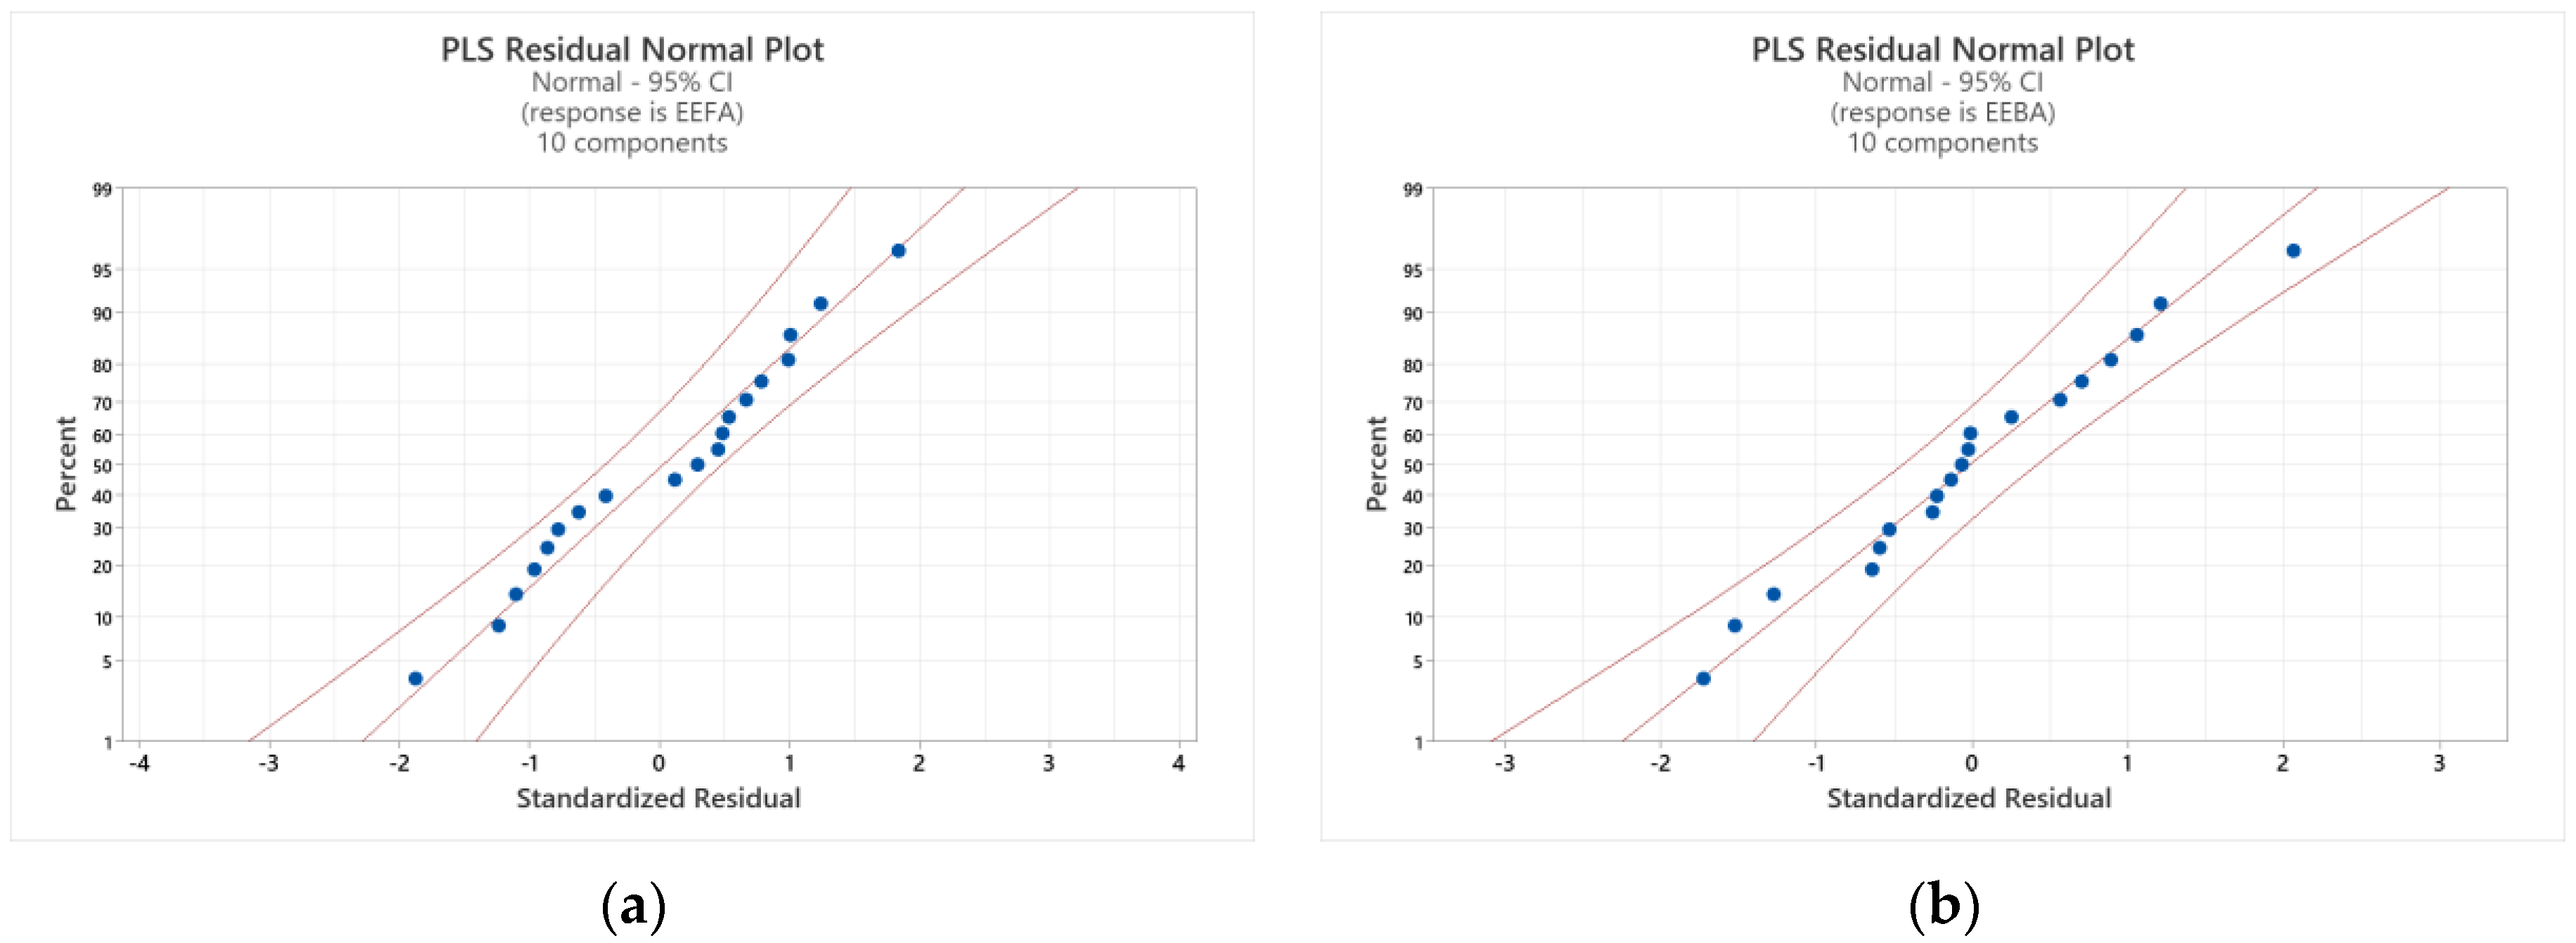
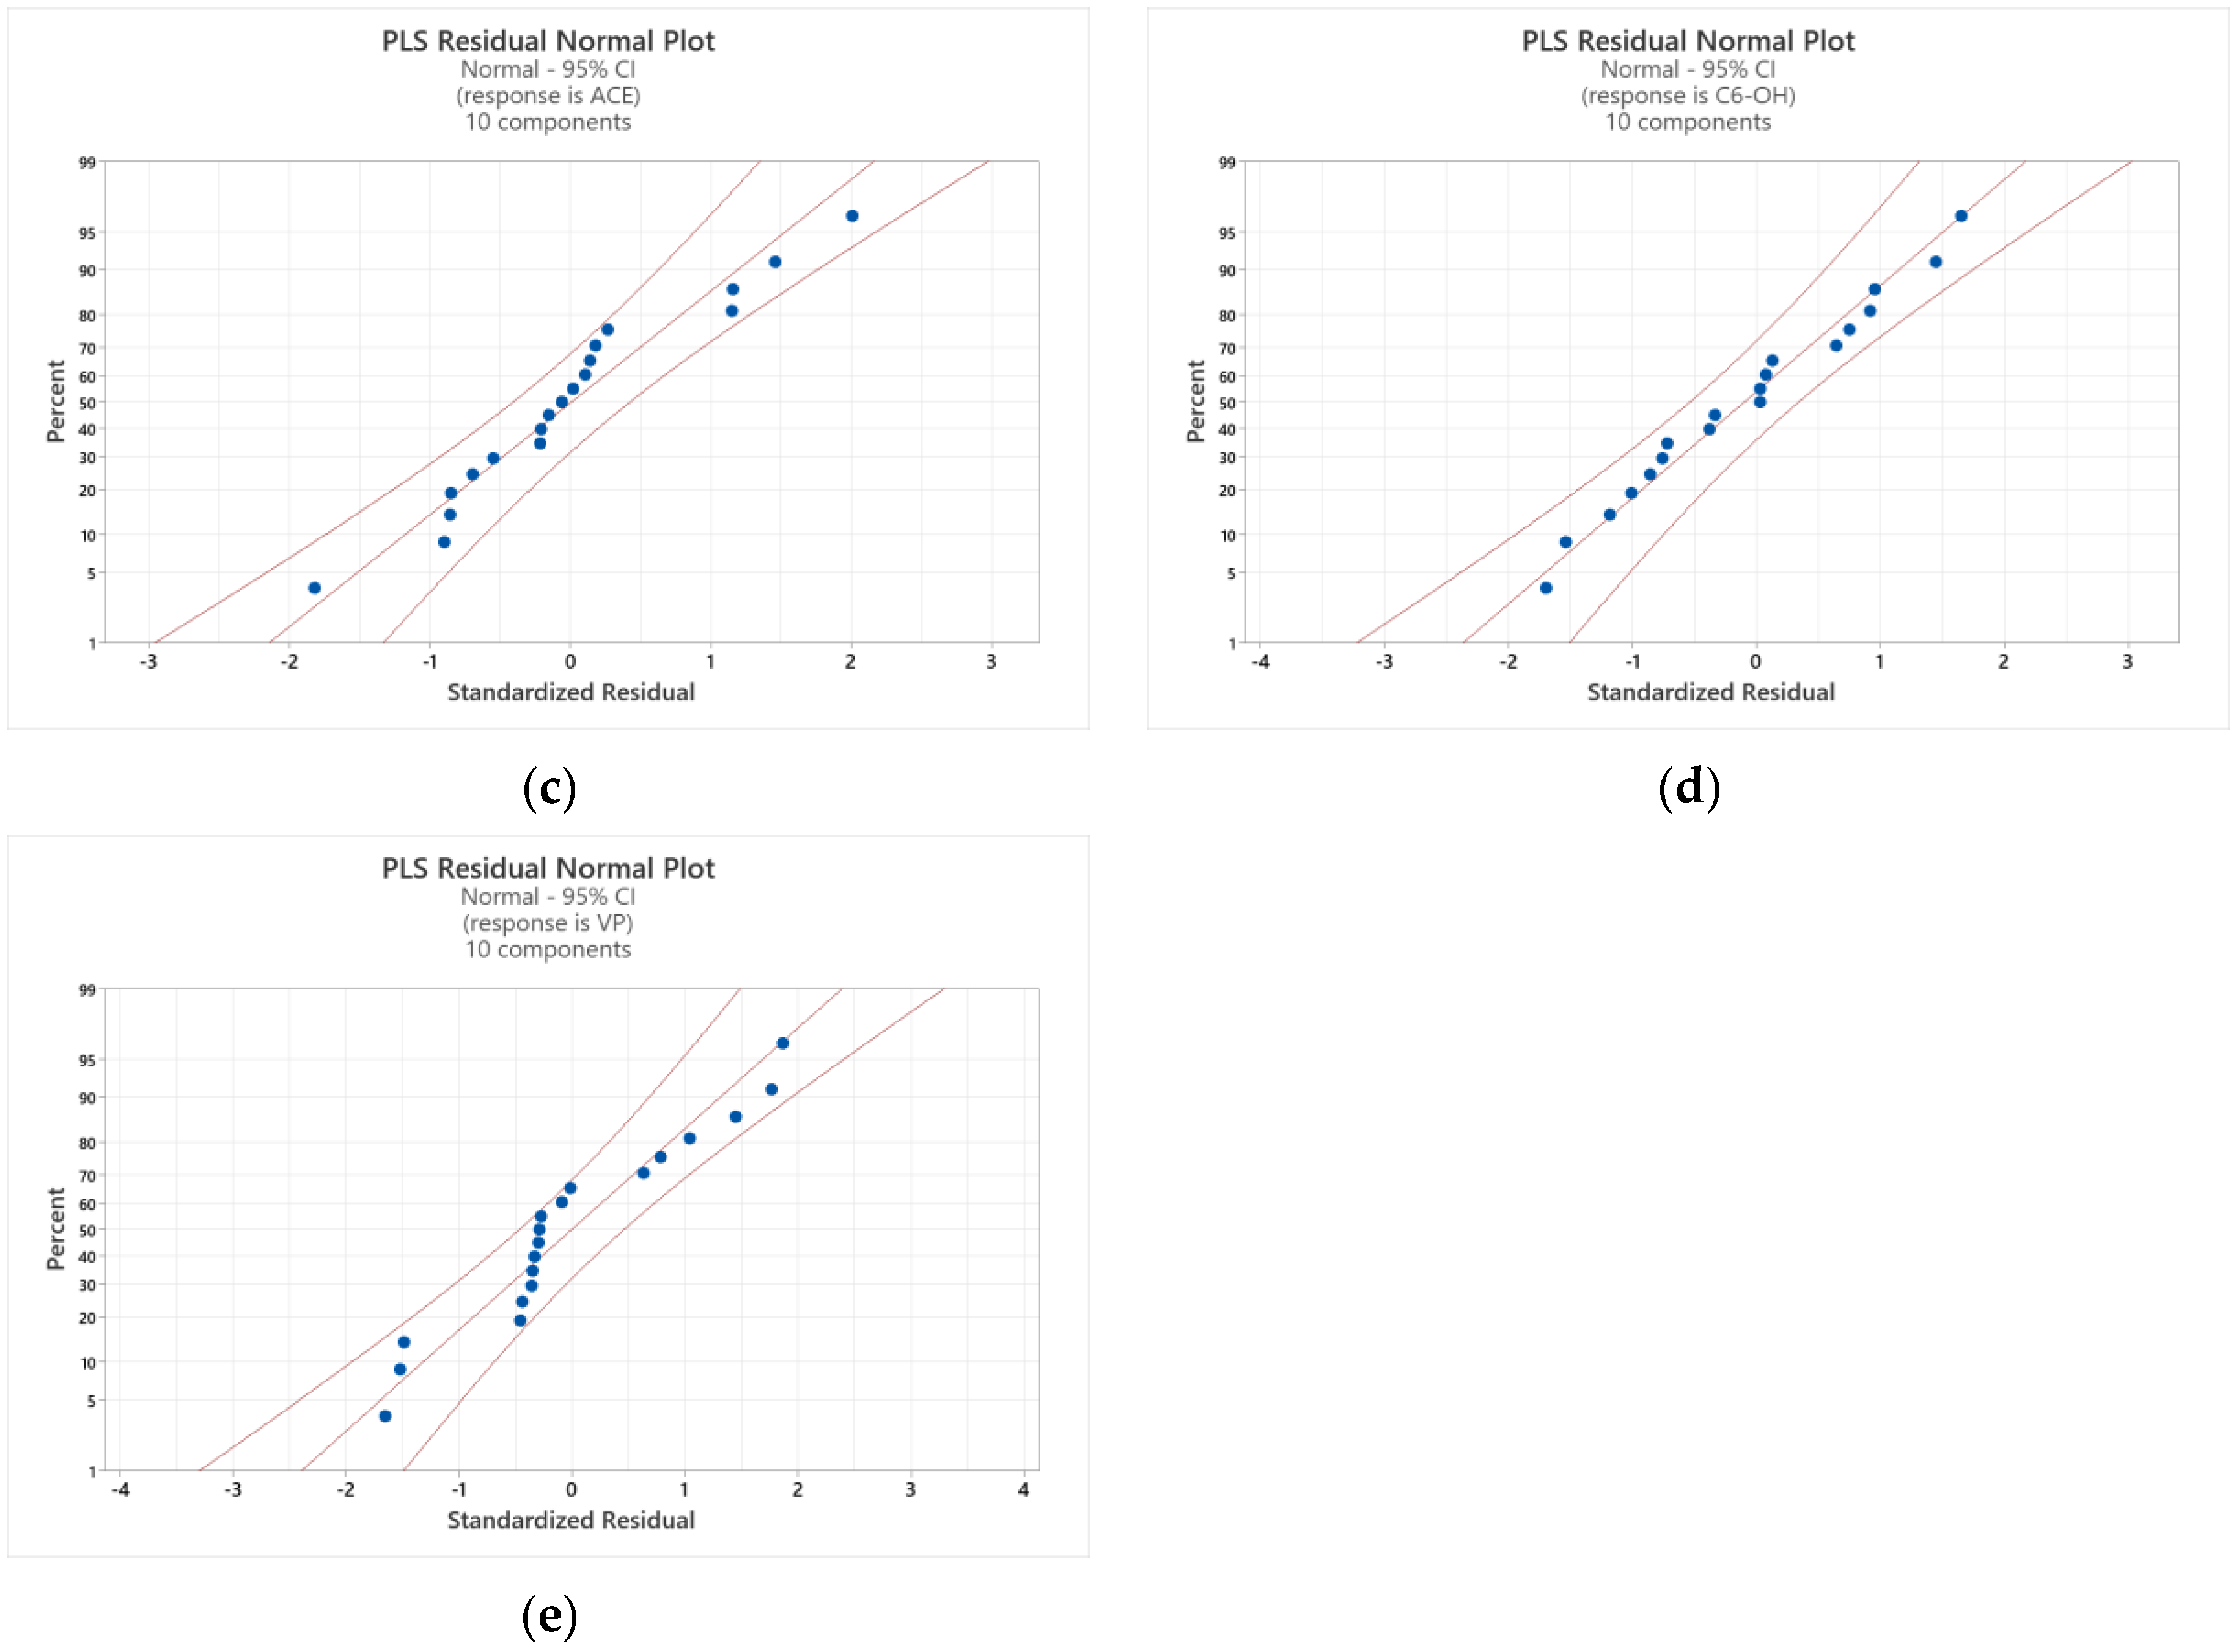
3.6.2. Partial Least Squares (PLS) Regression Analysis

In this section, the ferments/ciders produced with 19 different yeast strains were further analyzed. Since this is a high-dimensional data set, to further determine the associations between the aroma groups of attributes (y variables, n = 5) and the other physicochemical parameters (x variables, n = 28) in ciders from 19 tested strains, we used partial least squares (PLS) regression—a multivariate statistical analysis used for both regression and classification tasks. To prepare for the PLS regression, we first had to distinguish between the response variables (y variables) and the predictor variables (x variables). Therefore, the five chemical classes/groups of aroma compounds (ethyl esters of fatty acids, ethyl esters of branched acids, acetate esters, C6 alcohols, and volatile phenols) were considered as the response variables that formed the Y-block in the PLS regression. The amino acids, sugars, ethanol, organic acids, etc., were entered and considered as predictor variables used to develop the X-block.
Thus, the goal was to find out the relationship between two blocks, the Y-block and the X-block (i.e., the set of response variables and the predictor variables of interest). PLS regression was used to identify (1) the underlying factors responsible for the variation in the data; (2) the contributions of 28 traits/predictors, including amino acids, sugars, ethanol, acids, etc. (i.e., the variables forming the X-block) and to correlate and discover the five groups of cider aroma attributes (i.e., the variables forming the five groups in the Y-block) from 19 yeast strains used for fermentation (Table 3).
The method works by finding the linear combinations of the predictor variables X (also called latent variables (LVs)) that are most strongly related to the response variables Y. This is done by maximizing the covariance between the X-block and the Y-block while ensuring that the predictor variables are orthogonal (i.e., uncorrelated) to each other. Subsequently, the PLS regression analysis was used to determine which variables contributed most to the Y-block and the X-block contributed most to the variation in the data. Finally, PLS regression analysis indicated how the variables were correlated with each other and then lumped the variables into a new latent variable (LV). Our results show that our X-block variables mentioned above are strongly correlated with each of the groups of aroma compounds, for which large correlations were always found in different numbers of LVs (Table 3).
The results of our PLS regression model show how the amino acids, sugars, ethanol, acids, etc., contributed to the fermentations of the yeasts as well as to the chemical classes of the aroma compounds, and they also lead to some important findings. Table 3 summarizes the results of this analysis and shows that our PLS regression model (built with 10 LVs) includes 89% of the variation in the X-block data and 93% in the Y-block data. Although the optimal number of latent variables (LVs) was analytically set at ten by the PLS regression method, even with eight LVs, our PLS model can well explain the variation in the X-block and Y-block data, that is, 82% of the variation in the X-block and 88% in the Y-block. PLS regression analysis achieved a correlation coefficient of R2 ≥ 0.85 for all aroma classes of compounds and captured R2X ≥ 85% of the variation in the X-block data (i.e., predictor variables amino acids, sugars, ethanol, acids, etc.) and R2Y ≥ 85% of the variation in the Y-block data (i.e., aroma classes of compounds), implying a robust linear relationship between the measured aroma classes of compounds and the predictors in all 19 yeast strains we tested in this study.
Besides much useful information that Figure 6 can provide, it shows the correlation coefficients between each predictor variable and the response variable, as well as the loading weights that indicate the importance of each predictor variable in the model.
As can be seen in Figure 6, the aroma attributes of ethyl esters of fatty acids, ethyl esters of branched acids, volatile phenols, and C6 alcohols can be used to distinguish the aroma of ciders produced with yeast strains S. uvarum 2401, 2216, 2176, and others in the same cluster. Similarly, the aroma properties of acetate esters can be used to discriminate the aroma of ciders produced with yeast strains S. cerevisiae 2349, S. uvarum 2186, and others in the same cluster. At the same time, yeast strain 2349 was well associated not only with acetate esters but also with the amino acids glutamic acid and glycine, the biogenic amine putrescine, and the sugars fructose and glucose.
The ciders of S. uvarum 2046 and S. cerevisiae 2265 showed a high correlation with some attributes, such as the amino acids tyrosine, serine, and glutamine.
The analysis showed that the amino acids aspartic acid, tryptophan, and histidine were highly correlated, with tryptophan having greater importance in the model because it had greater (positive) loadings in the first component. It was also observed that for CO2 release, the amino acids asparagine and methionine were also strongly correlated, with asparagine being of greater importance in the model as it had greater (negative) loadings in the first component. In addition, glucose, tyramine, and malic acid were correlated, but only malic acid was important in the model. On the first component, predictors such as aspartic acid, malic acid, and serine had similar absolute loadings, suggesting that they were equally important. On the second component, H2S production, glutamic acid, valine, tartaric acid, and citric acid had similar absolute loadings, indicating that they were equally important (see Figure A4).
In addition, the values for the importance of the variables in the projection (VIP) were also obtained in the PLS regression model and shown in Figure 6. These values are a good measure of the importance of each predictor variable in our PLS regression model. They are calculated by considering both the amount of variation in the response variable (five chemical groups of aroma compounds) explained by each latent variable (LV) and the importance (i.e., loading) of each predictor variable in this LV. The VIP values for the 16 predictor variables were ≥1, including H2S production, phenylalanine, asparagine, aspartic acid, tryptophan, histidine, valine, methionine, malic acid, serine, tartaric acid, citric acid, glutamic acid, glutamine, CO2 release, and proline. These predictor variables with high VIP scores are more important to us than those with low VIP scores. Moreover, these VIP scores are also used for variable selection by selecting only the variables with the highest VIP scores for inclusion in the model (namely, those with VIP ≥ 1).
Finally, we proceeded with error analysis of our PLS model using the x-residual matrix plot. To this aim, we examined general patterns in the residuals and identified areas where problems exist. We then examined the x-residuals displayed in the output to determine which observations and predictors the model may be poorly describing. As can be seen in Figure 7, the PLS residual X-plot shows that the residuals are close to zero, indicating that our model does a good job of describing most of the variance in the predictors in our experimental analysis with cider made with 19 Saccharomyces strains. There is no specific line on the graph that deviates dramatically from the other lines; therefore, the model describes all observations/yeast strains (represented by lines) very well. At both points 16 and 28, which correspond to the two predictors lysine and H2S, respectively, the lines are far apart. At point 16, the lines are slightly apart at the same point on the x-axis. Therefore, the model can still be considered a good statistical tool to describe the predictor at this point (i.e., lysine). However, at point 28, most of the lines diverge at the same point on the x-axis, and this means that the model can poorly describe the corresponding predictor at this point (i.e., H2S). This could be related to the values obtained for H2S, a sparse vector where 63% of the elements had a value of zero.

4. Conclusions

A fermentation screening of six S. cerevisiae and fourteen S. uvarum strains isolated from ciders produced in Hardanger [4] provided information on metabolic capabilities with an emphasis on aroma production. This is a first selection small-scale fermentation experiment with chemical characterization and is a stepping stone for the selection process of indigenous yeasts from Hardanger with respect to their suitability for cider production.
Using the HPLC–UV/RI and HS–SPME/GC–MS methods for chemical characterization of cider produced with different strains tested, we determined seventeen AAs, two BAs, four organic acids, ethanol, glucose, fructose, and twenty-six volatile compounds, including eighteen esters (seven ethyl esters of fatty acids, two ethyl esters of branched acids, and nine acetate esters), three C6 alcohols, and five volatile phenols. In addition, in the current study, we also successfully implemented a new analytical approach for the simultaneous determination of AAs and BAs using the HPLC–UV system.
When statistical analyses were applied to the obtained chemical data, cluster analysis allowed us to divide the Saccharomyces strains into four main groups. The yeast groups differed in the production of aromatic components. Two groups produced few aromatic compounds. The other two groups, primarily consisting of S. uvarum strains, were good producers of aromatic components; one was characterized by the highest production of acetate esters, while the other exhibited the highest production of ethyl esters, volatile phenols, and C6 alcohols. Additionally, with PLS regression, we established a relationship between aroma compounds and predictor variables (AAs, BAs, organic acids, sugars, H2S production, and CO2 release), and the obtained VIP scores showed that the most important predictor variables affecting aroma compounds were 16, most of which belong to the following AAs: phenylalanine, asparagine, aspartic acid, tryptophan, histidine, valine, methionine, serine, glutamic acid, glutamine, and proline.
Further detailed studies on the representatives of the four yeast groups identified in our study during the fermentation process on larger scales, including sensory evaluation, are needed to find an alternative Saccharomyces yeast for potential cider production from Hardanger.

Supplementary Materials

The following supporting information can be downloaded at https://www.mdpi.com/article/10.3390/fermentation9090824/s1, Table S1: Yeast strains used in the study. Table S2: Calibration parameters for sugars, acids, and ethanol by HPLC–UV/RI method. Table S3: Gradient profile of HPLC-UV method for determination of amino acids and biogenic amines. Table S4: Calibration parameters for amino acids and biogenic amines detected by HPLC–UV method. Table S5: Physicochemical parameters of apple juice used in the study. Values represent the mean ± SD for three replicates. Table S6: Content of amino acids (mg/L) and biogenic amines (mg/L) in ciders produced from apple juice fermentation carried out by 19 Saccharomyces strains. Table S7: Content of organic acids, sugars, ethanol, and other measured parameters (CO2 release) in ciders produced from apple juice fermentation carried out by 19 Saccharomyces strains.

Author Contributions

Conceptualization, A.H., B.M.V. and L.B.; Data curation, U.Č., I.Ø., B.M.V. and L.B.; Formal analysis, U.Č., M.M., T.R.V. and A.H.; Funding acquisition, I.Ø.; Investigation, U.Č. and L.B.; Methodology, L.B.; Project administration, I.Ø., B.M.V. and L.B.; Resources, I.Ø., B.M.V. and L.B.; Supervision, B.M.V. and L.B.; Validation, U.Č., M.M., T.R.V., A.H. and L.B.; Visualization, A.H. and L.B.; Writing—original draft, U.Č., A.H., B.M.V. and L.B.; Writing—review and editing, M.M., I.Ø., A.H., B.M.V. and L.B. All authors have read and agreed to the published version of the manuscript.

Funding

This research was funded by Regionalt Forskningsfond Vestland (RFF Vestland), Norway, through the research project Sider—Smaken av Hardanger, grant number 299284.

Institutional Review Board Statement

Not applicable.

Informed Consent Statement

Not applicable.

Data Availability Statement

Data is contained within the article or supplementary material.

Acknowledgments

The HS-SPME/GC-MS methods were previously established within the project Uncorking rural heritage: indigenous production of fermented beverages for local cultural and environmental sustainability benefits from a 1,501,000.00 € grant from Iceland, Liechtenstein and Norway through the EEA and Norway Grants Fund for Regional Cooperation.

Conflicts of Interest

The authors declare no conflict of interest. The funders had no role in the design of the study, in the collection, analyses, or interpretation of data, in the writing of the manuscript, or in the decision to publish the results.

Appendix A

To study the relationship between aroma attributes, amino acids, and other features of interest and to display the pairwise Pearson correlation coefficients (with a significance level alpha = 0.05) between all our 54 continuous variables (including the response and predictor variables), we employ the correlation matrix which is visualized in Figure A1. The values range from −1 to 1, with −1 (light red) indicating a strong negative correlation, 1 (light green) indicating a strong positive correlation, and 0 (dark red or green) indicating no correlation. In this image, positive correlations (i.e., green color) indicate that variables tend to increase or decrease together, while negative correlations (i.e., red color) indicate that variables tend to move in opposite directions.
Knowing that outliers can have a strong influence on the correlation coefficients and may distort the overall pattern of the data, we appropriately handled the outliers in our data set using the Grubbs test in XLSTAT 2023 (with a significance level of alpha = 0.05) before calculating the correlation (image) matrix. To interpret a correlation image matrix, we look at the values/colors in the (image) matrix and use them to conclude the relationships between variables. Cells in light green or light red indicate a strong relationship between the two corresponding variables. Cells in dark green or dark red indicate a weak or no relationship. As seen in Figure A1, there are not many cells that are colored light green or red, and therefore, there should not exist many groups of variables that have high positive or negative correlations. This indicates that there may not be any underlying patterns in the data.
However, we remark that the Pearson correlation (image) matrix, although it provides valuable insights into the relationships between variables in the data set, can only measure and represent the possible linear relationships between the variables. Therefore, if the relationship between variables is not linear, the Pearson correlation matrix may not accurately capture the true relationship. On the other hand, just because of a light green/red cell, we cannot conclude that the two corresponding variables are highly correlated, and it does not mean that one causes the other (i.e., correlation does not imply causation). Therefore, it is important to consider other factors, interpret the results carefully, and consider the broader context of the data and further statistical (multivariate) analysis, such as PCA and PLS regression analysis.
Figure A1. Image of the correlation matrix of a total of 54 continuous variables: 26 aroma compounds (i.e., the variables which will make the 5 groups in Y-block in the PLS regression analysis) and 28 features/predictors including amino acids, sugars, ethanol, acids, etc. (i.e., the variables which will make the X-block in the PLS regression analysis) of 19 yeast strains fermented. The correlations are according to Pearson, and the significance level alpha is considered 0.05.
Fermentation 09 00824 g0a1
To display the pairwise Pearson coefficients of determination of our 54 continuous variables (including the response and predictor variables), we use the matrix of R-squared values that are visualized in Figure A2, implemented in XLSTAT 2023 (with a significance level alpha = 0.05). The R-squared (R-Sq or R2) value is a statistical measure that can be interpreted as the percentage of the variability in one variable that can be explained by the other variable. The matrix of coefficients of determination is similar to the correlation matrix, but instead of displaying the correlation coefficients between variables, it displays the R-squared values. The R-Sq values range from 0 to 1. An R-Sq value of 0 indicates that there is no relationship between the two variables, while an R-squared value of 1 indicates that all of the variability in one variable can be explained by the other variable.
Like the correlation matrix, each row and column of the matrix represents a different variable, and the values/color in the (image) matrix represent the R-Sq value between the two corresponding variables. The diagonal of the matrix represents the R-Sq value of each variable with itself, which is always equal to 1. Higher R-Sq values indicate a stronger relationship between variables, while lower R-squared values indicate a weaker relationship. However, it is important to note that the R-Sq value only measures the proportion of variance in one variable that can be explained by the other variable and does not provide information about the direction or causality of the relationship. As seen in Figure A2, there are not many cells that are colored in black/dark blue or dark brown, and hence, there do not seem to exist many groups of variables whose large proportion of their variance can be explained by the other groups of variables. Most of the cells are in the middle range (0.1, 0.3) and (−0.3, 0). This indicates that there may not be any underlying discoverable patterns in the data. However, we highlight that we will employ R-Sq values for model selection. More precisely, we exploit the R-Sq values to select the best model for our data set in the partial least squares (PLS) regression analysis. Models with higher R-Sq values are generally considered to be better at explaining the variation in the data (see Table 2).
Like the Pearson correlation (image) matrix, R-Sq values can be biased by outliers or other factors that affect the relationship between the variables. Therefore, before calculating the matrix of coefficients of determination, we aptly coped with the outliers in our data set using the Grubbs test in XLSTAT 2023 (with a significance level of alpha = 0.05). We remark that the (image) matrix of coefficients of determination, although it provides valuable insights into the factors that are driving variation in the data set, does not indicate causality. Like correlation coefficients, R-Sq values do not provide information about the direction or causality of the relationship between the variables. Therefore, it is important to consider other factors and conduct further (multivariate) analysis before making any conclusions.
Figure A2. Image of the matrix of coefficients of determination of a total of 54 continuous variables: 26 aroma compounds (i.e., the variables which will make the 5 groups in Y-block in the PLS regression analysis) and 28 features/predictors including amino acids, sugars, ethanol, acids, etc. (i.e., the variables which will make the X-block in the PLS regression analysis) of 19 yeast strains fermented. The correlations are according to Pearson, and the significance level alpha is considered 0.05.
Fermentation 09 00824 g0a2
The PCA loading plot depicted in Figure A3 displays the loadings/associations of the variables on the PCs. Loadings represent the correlation between each variable and the PCs and can be used to interpret the underlying patterns in the data set. The correlation monoplot plots vectors pointing away from the origin to represent the original variables. The angle between the vectors is an approximation of the correlation between the variables. A small angle indicates that the variables are positively correlated, an angle of 90 degrees indicates that the variables are not correlated, and an angle close to 180 degrees indicates that the variables are negatively correlated. The length of the line and its closeness to the circle indicate how well the plot represents the variable. It is, therefore, unwise to make inferences about relationships involving variables with poor representation.
Figure A3. The PCA loading plot: the graphical method for displaying the associations of the variables on the PCs. Legend: Ethyl esters from branched acids—EEBA; Ethyl esters from fatty acids—EEFA; Acetate esters—AE; Volatile phenols—VP; C6-alcohols—C6-OH.
Fermentation 09 00824 g0a3
Figure A4. The PLS loading plot: the graphical method for displaying the associations of the variables on the LVs.
Fermentation 09 00824 g0a4
The PLS normal probability plot of the residuals (Figure A5) displays the standardized residuals versus their expected values when the distribution is normal. We use the normal probability plot of the residuals to verify the assumption that the residuals are normally distributed. All our obtained points in the graph fall randomly on both sides of the normal line, with no recognizable patterns in the points. This is verified in our analysis and is demonstrated in the picture.
Figure A5. The PLS normal probability plot of the residuals with respect to each aroma group of compounds: (a)—ethyl esters from fatty acids; (b)—ethyl esters from branched acids; (c)—acetate esters; (d)—C6-alcohols; (e)—volatile phenols. The standardized residuals are on the x-axis, and the expected values are on the y-axis.
Fermentation 09 00824 g0a5aFermentation 09 00824 g0a5b

References

  1. Øvsthus, I.; Martenalc, M.; Radovanović Vukajlović, T.; Lesica, M.; Butinar, L.; Mozetič Vodopivec, B.; Antalick, G. Chemical Composition of Apple Cider: A Comparative Study of Norwegian and French Ciders. Acta Hortic. 2023; In press. [Google Scholar]
  2. Vangdal, E.; Kvamm-Lichtenfeld, K. Ciders Produced from Norwegian Fresh Consumption Apple Cultivars. Acta Hortic. 2018, 1205, 527–532. [Google Scholar] [CrossRef]
  3. Wicklund, T.; Skottheim, E.R.; Remberg, S.F. Various Factors Affect Product Properties in Apple Cider Production. Int. J. Food Stud. 2020, 9, SI84–SI96. [Google Scholar] [CrossRef]
  4. Česnik, U.; Øvsthus, I.; Martelanc, M.; Mozetič Vodopivec, B.; Butinar, L. Yeast Diversity from Ciders Produced in Hardanger. Foods, 2023; Article in preparation. [Google Scholar]
  5. Nguyen, H.; Gaillardin, C. Evolutionary Relationships between the Former Species Saccharomyces Uvarum and the Hybrids Saccharomyces Bayanus and Saccharomyces Pastorianus; Reinstatement of Saccharomyces Uvarum (Beijerinck) as a Distinct Species. FEMS Yeast Res. 2005, 5, 471–483. [Google Scholar] [CrossRef]
  6. Libkind, D.; Hittinger, C.T.; Valério, E.; Gonçalves, C.; Dover, J.; Johnston, M.; Gonçalves, P.; Sampaio, J.P. Microbe Domestication and the Identification of the Wild Genetic Stock of Lager-Brewing Yeast. Proc. Natl. Acad. Sci. USA 2011, 108, 14539–14544. [Google Scholar] [CrossRef]
  7. Almeida, P.; Gonçalves, C.; Teixeira, S.; Libkind, D.; Bontrager, M.; Masneuf-Pomarède, I.; Albertin, W.; Durrens, P.; Sherman, D.J.; Marullo, P.; et al. A Gondwanan Imprint on Global Diversity and Domestication of Wine and Cider Yeast Saccharomyces Uvarum. Nat. Commun. 2014, 5, 4044. [Google Scholar] [CrossRef]
  8. Marullo, P.; Dubourdieu, D. 12—Yeast Selection for Wine Flavor Modulation. In Managing Wine Quality, 2nd ed.; Reynolds, A.G., Ed.; Woodhead Publishing Series in Food Science, Technology and Nutrition; Woodhead Publishing: Sawston, UK, 2022; pp. 371–426. ISBN 978-0-08-102065-4. [Google Scholar]
  9. McCarthy, G.C.; Morgan, S.C.; Martiniuk, J.T.; Newman, B.L.; McCann, S.E.; Measday, V.; Durall, D.M. An Indigenous Saccharomyces Uvarum Population with High Genetic Diversity Dominates Uninoculated Chardonnay Fermentations at a Canadian Winery. PLoS ONE 2021, 16, e0225615. [Google Scholar] [CrossRef]
  10. Naumov, G.I.; Nguyen, H.-V.; Naumova, E.S.; Michel, A.; Aigle, M.; Gaillardin, C. Genetic Identification of Saccharomyces Bayanus Var. Uvarum, a Cider-Fermenting Yeast. Int. J. Food Microbiol. 2001, 65, 163–171. [Google Scholar] [CrossRef]
  11. Valles, B.; Bedrinana, R.; Tascon, N.; Simon, A.; Madrera, R. Yeast Species Associated with the Spontaneous Fermentation of Cider. Food Microbiol. 2007, 24, 25–31. [Google Scholar] [CrossRef]
  12. Blein-Nicolas, M.; Albertin, W.; Valot, B.; Marullo, P.; Sicard, D.; Giraud, C.; Huet, S.; Bourgais, A.; Dillmann, C.; De Vienne, D.; et al. Yeast Proteome Variations Reveal Different Adaptive Responses to Grape Must Fermentation. Mol. Biol. Evol. 2013, 30, 1368–1383. [Google Scholar] [CrossRef] [PubMed]
  13. McKay, M.; Buglass, A.J.; Gook Lee, C. Cider and Perry. In Handbook of Alcoholic Beverages; Buglass, A.J., Ed.; John Wiley & Sons, Ltd.: Chichester, UK, 2011; pp. 231–265. ISBN 978-0-470-97652-4. [Google Scholar]
  14. Wei, J.; Wang, S.; Zhang, Y.; Yuan, Y.; Yue, T. Characterization and Screening of Non-Saccharomyces Yeasts Used to Produce Fragrant Cider. LWT 2019, 107, 191–198. [Google Scholar] [CrossRef]
  15. Wei, J.; Zhang, Y.; Wang, Y.; Ju, H.; Niu, C.; Song, Z.; Yuan, Y.; Yue, T. Assessment of Chemical Composition and Sensorial Properties of Ciders Fermented with Different Non-Saccharomyces Yeasts in Pure and Mixed Fermentations. Int. J. Food Microbiol. 2020, 318, 108471. [Google Scholar] [CrossRef] [PubMed]
  16. Aung, M.T.; Lee, P.-R.; Yu, B.; Liu, S.-Q. Cider Fermentation with Three Williopsis Saturnus Yeast Strains and Volatile Changes. Ann. Microbiol. 2015, 65, 921–928. [Google Scholar] [CrossRef]
  17. Gutiérrez, A.; Boekhout, T.; Gojkovic, Z.; Katz, M. Evaluation of Non-Saccharomyces Yeasts in the Fermentation of Wine, Beer and Cider for the Development of New Beverages. J. Inst. Brew. 2018, 124, 389–402. [Google Scholar] [CrossRef]
  18. McKay, M.; Buglass, A.J.; Gook Lee, C. Fermented Beverages: Beers, Ciders, Wines and Related Drinks. In Handbook of Alcoholic Beverages: Technical, Analytical and Nutritional Aspects; John Wiley & Sons, Ltd.: Chichester, UK, 2010; ISBN 978-0-470-51202-9. [Google Scholar]
  19. Jiranek, V.; Langridge, P.; Henschke, P.A. Validation of Bismuth-Containing Indicator Media for Predicting H2S-Producing Potential of Saccharomyces Cerevisiae Wine Yeasts Under Enological Conditions. Am. J. Enol. Vitic. 1995, 46, 269–273. [Google Scholar] [CrossRef]
  20. Ugliano, M.; Henschke, P.A. Comparison of Three Methods for Accurate Quantification of Hydrogen Sulfide during Fermentation. Anal. Chim. Acta 2010, 660, 87–91. [Google Scholar] [CrossRef]
  21. Layne, J.; Lomas, S. Simple Sugars Analysis from Wine by LC-RI Using Luna® Omega SUGAR LC Columns; Phenomenex, Inc.: Torrance, CA, USA, 2018; p. 2. [Google Scholar]
  22. Martelanc, M. Simultaneous Determination of Chemical Parameters for Wine and Cider Quality Control Using HPLC-UV/RI System Based on Reverse-Phase Separation Capabilities. In Proceedings of the Analytical and Biomedical Applications, Kemomed, Kranj, Slovenia, 20 October 2022. [Google Scholar]
  23. Nguyen, N.; McGinley, M. Real-Time Response to Bacteria Infection of Bioethanol Fermentation Using a Short RezexTM ROA Column. Appl. Noteb. 2008, 1, 1–4. [Google Scholar]
  24. Topić Božič, J.; Butinar, L.; Bergant Marušič, M.; Korte, D.; Mozetič Vodopivec, B. Determination of Biogenic Amines Formation by Autochthonous Lactic Acid Bacteria from ‘Refošk’ Grapes Using Different Analytical Methods. LWT 2022, 156, 112908. [Google Scholar] [CrossRef]
  25. Antalick, G.; Perello, M.-C.; De Revel, G. Esters in Wines: New Insight through the Establishment of a Database of French Wines. Am. J. Enol. Vitic. 2014, 65, 293–304. [Google Scholar] [CrossRef]
  26. Gobert, A.; Tourdot-Maréchal, R.; Sparrow, C.; Morge, C.; Alexandre, H. Influence of Nitrogen Status in Wine Alcoholic Fermentation. Food Microbiol. 2019, 83, 71–85. [Google Scholar] [CrossRef]
  27. Ljungdahl, P.O.; Daignan-Fornier, B. Regulation of Amino Acid, Nucleotide, and Phosphate Metabolism in Saccharomyces Cerevisiae. Genetics 2012, 190, 885–929. [Google Scholar] [CrossRef] [PubMed]
  28. Liu, S.; Jiang, J.; Ma, Z.; Xiao, M.; Yang, L.; Tian, B.; Yu, Y.; Bi, C.; Fang, A.; Yang, Y. The Role of Hydroxycinnamic Acid Amide Pathway in Plant Immunity. Front. Plant Sci. 2022, 13, 922119. [Google Scholar] [CrossRef] [PubMed]
  29. Tronchoni, J.; Gamero, A.; Arroyo-López, F.N.; Barrio, E.; Querol, A. Differences in the Glucose and Fructose Consumption Profiles in Diverse Saccharomyces Wine Species and Their Hybrids during Grape Juice Fermentation. Int. J. Food Microbiol. 2009, 134, 237–243. [Google Scholar] [CrossRef] [PubMed]
  30. Schütz, M.; Gafner, J. Lower Fructose Uptake Capacity of Genetically Characterized Strains of Saccharomyces Bayanus Compared to Strains of Saccharomyces Cerevisiae: A Likely Cause of Reduced Alcoholic Fermentation Activity. Am. J. Enol. Vitic. 1995, 46, 175–180. [Google Scholar] [CrossRef]
  31. Wang, D.; Xu, Y.; Hu, J.; Zhao, G. Fermentation Kinetics of Different Sugars by Apple Wine Yeast Saccharomyces Cerevisiae. J. Inst. Brew. 2004, 110, 340–346. [Google Scholar] [CrossRef]
  32. Wicklund, T.; Guyot, S.; Le Quéré, J.-M. Chemical Composition of Apples Cultivated in Norway. Crops 2021, 1, 8–19. [Google Scholar] [CrossRef]
  33. Waterhouse, A.L.; Sacks, G.L.; Jeffery, D.W. Understanding Wine Chemistry; John Wiley & Sons, Ltd.: Chichester, UK, 2016; ISBN 978-1-118-62780-8. [Google Scholar]
  34. Qin, Z.; Petersen, M.A.; Bredie, W.L.P. Flavor Profiling of Apple Ciders from the UK and Scandinavian Region. Food Res. Int. 2018, 105, 713–723. [Google Scholar] [CrossRef]
  35. He, W.; Liu, S.; Heponiemi, P.; Heinonen, M.; Marsol-Vall, A.; Ma, X.; Yang, B.; Laaksonen, O. Effect of Saccharomyces Cerevisiae and Schizosaccharomyces Pombe Strains on Chemical Composition and Sensory Quality of Ciders Made from Finnish Apple Cultivars. Food Chem. 2021, 345, 128833. [Google Scholar] [CrossRef]
  36. Medina, S.; Perestrelo, R.; Pereira, R.; Câmara, J.S. Evaluation of Volatilomic Fingerprint from Apple Fruits to Ciders: A Useful Tool to Find Putative Biomarkers for Each Apple Variety. Foods 2020, 9, 1830. [Google Scholar] [CrossRef]
  37. Satora, P.; Sroka, P.; Duda-Chodak, A.; Tarko, T.; Tuszyński, T. The Profile of Volatile Compounds and Polyphenols in Wines Produced from Dessert Varieties of Apples. Food Chem. 2008, 111, 513–519. [Google Scholar] [CrossRef] [PubMed]
  38. Sousa, A.; Vareda, J.; Pereira, R.; Silva, C.; Câmara, J.S.; Perestrelo, R. Geographical Differentiation of Apple Ciders Based on Volatile Fingerprint. Food Res. Int. 2020, 137, 109550. [Google Scholar] [CrossRef] [PubMed]
  39. Peng, B.; Li, F.; Cui, L.; Guo, Y. Effects of Fermentation Temperature on Key Aroma Compounds and Sensory Properties of Apple Wine. J. Food Sci. 2015, 80, S2937–S2943. [Google Scholar] [CrossRef]
  40. Pour Nikfardjam, M.; May, B.; Tschiersch, C. 4-Ethylphenol and 4-Ethylguaiacol Contents in Bottled Wines from the German ‘Württemberg’ Region. Eur. Food Res. Technol. 2009, 230, 333–341. [Google Scholar] [CrossRef]
Figure 1. HPLC–UV chromatogram of simultaneously separated 19 AAs and 4 BAs (each at 25 mg/L con-centration level) with prior derivatization using dansyl chloride agent.
Fermentation 09 00824 g001
Figure 2. Boxplots showing the utilization pattern for AAs of 6 S. cerevisiae (cerevisiae, green box) and 14 S. uvarum strains (uvarum, blue box), compared to the initial concentration in apple juice (AJ, red box). On the left side, a pattern for all amino acids is shown, while on the right side, an enlarged plot for lower concentrations is presented. Asp-aspartic acid, Glu-glutamic acid, Asn-asparagine, Gln-glutamine, Ser-serine, Arg-arginine, Gly-glycine, Ala-Alanine, Pro-proline, Val-valine, Met-methionine, Trp-tryptophane, Phe-phenylalanine, Cys-cysteine, His-histidine, Lys-lysine, Tyr-tyrosine.
Fermentation 09 00824 g002
Figure 3. The heatmap and cluster analysis of a total of 54 continuous variables: 26 aroma compounds (i.e., the response variables grouped into 5 chemical classes/groups in Y-block data used in PLS regression) and 28 variables including amino acids, sugars, ethanol, organic acids, etc. (i.e., the predictor variables which made the X-block data used in PLS regression) of 19 Saccharomyces strains used in the fermentation trial.
Fermentation 09 00824 g003
Figure 4. The scree plot (a) and the component 3D plot in rotated space (b) allied with the PCA. The scree plot orders the eigenvalues from largest to smallest.
Fermentation 09 00824 g004
Figure 5. The Bootstrap hulls: the graphical method for assessing the significance of the yeast strains in the PCA method and observing the possible clusters in the fermented yeast strains in our dataset.
Fermentation 09 00824 g005
Figure 6. The 2D configuration, correlations, loading, clustering, and projection of observations (yeast strains) and all attributes and aroma groups of compounds (p < 0.05) of all 19 different yeasts on the first two components (top), and the VIP values associated with the 28 predictor variables from the PLS regression model with 10 LVs (bottom). Legend: Ethyl esters from branched acids—EEBA; Ethyl esters from fatty acids—EEFA; Acetate esters—AE; Volatile phenols—VP; C6-alcohols—C6-OH.
Fermentation 09 00824 g006
Figure 7. Error analysis using the Residual X-plot associated with our PLS regression model (#LV = 10). Each line in the graph represents an observation/yeast strain and has as many points as it has predictors.
Fermentation 09 00824 g007
Table 1. Results of color staining on BiGGY agar and measured H2S production during fermentation for 20 Saccharomyces strains tested.
Yeast Species and Strain CodeColony Color on
BiGGy Agar 1
H2S Detector Tubes 2
(ppm)
S. uvarum 2046white0 ± 0.00 E
S. uvarum 2071white35 ± 8.7 BC
S. uvarum 2120brown0 ± 0.00 E
S. uvarum 2186brown0 ± 0.00 E
S. uvarum 2401white13.3 ± 5.8 DE
S. cerevisiae 2003brown10 ± 0.00 DE
S. cerevisiae 2095brown0 ± 0.00 E
S. cerevisiae 2265white, light brown edge0 ± 0.00 E
S. cerevisiae 2273white0 ± 0.00 E
S. cerevisiae 2303brown0 ± 0.00 E
S. cerevisiae 2349brown0 ± 0.00 E
S. uvarum 2128brown36.7 ± 10.4 BC
S. uvarum 2204brown0 ± 0.00 E
S. uvarum 2216white23.3 ± 2.9 CD
S. uvarum 2376white0 ± 0.00 E
S. uvarum 2083white, light brown edge0 ± 0.00 E
S. uvarum 2104brown0 ± 0.00 E
S. uvarum 2176white58.3 ± 18.9 A
S. uvarum 2402brown48.3 ± 2.9 AB
S. uvarum 2061brown0 ± 0.00 E
1 White colony color = no H2S production; White colony color with light brown edge = moderate H2S production; Brown colony color = strong H2S production. 2 H2S was measured with gas detector tubes (120SF; Komyo Kitagawa, Kawasaki-City, Japan). Values are reported as mean ± SD of three replicates. Values not connected by the same letter are significantly different (ANOVA, Tukey’s method).
Table 2. Volatile compounds (µg/L) of ciders produced from apple juice fermentation carried out by 19 Saccharomyces strains. Values are reported as mean ± standard deviation of three replicates. Groups are indicated by letters. The values (i.e., the means) on the same column are significantly different according to Tukey’s method (and 95% confidence) if they do not share a letter.
Yeast
Species
Strain
no.
Acetate Esters(AE)
Propyl
Acetate
Isobutyl
Acetate
Butyl
Acetate
Isoamyl
Acetate
Z-3-Hexenyl
Acetate
E-2-Hexenyl
Acetate
Ethyl Phenyl AcetateHexyl
Acetate
OctylAcetate
S. uvarum21047.72 ± 0.47 ABC7.98 ± 1.19 AB145.97 ± 3.54 ABC69.99 ± 12.52 ABC3.71 ± 0.13 AB0.35 ± 0.07 ABCD1.45 ± 0.75 ABCD29.77 ± 0.89 ABC2.39 ± 0.29 BC
S. uvarum212010.90 ± 0.58 A11.11 ± 4.64 A220.86 ± 41.45 A103.57 ± 52.16 AB4.68 ± 0.98 AB0.51 ± 0.16 A1.03 ± 0.65 BCD38.47 ± 9.16 A2.76 ± 0.14 AB
S. uvarum21289.29 ± 1.32 ABC10.01 ± 1.20 ABC191.05 ± 25.9 AB91.34 ± 11.65 ABC4.09 ± 0.10 AB0.42 ± 0.07 AB1.17 ± 0.07 ABCD33.84 ± 1.79 AB3.18 ± 0.74 A
S. uvarum21769.46 ± 0.43 ABC5.28 ± 0.31 ABC196.73 ± 5.9 AB56.26 ± 9.23 ABC3.41 ± 0.02 ABC0.35 ± 0.04 ABCD2.48 ± 1.02 A29.86 ± 1.21 ABC2.10 ± 0.09 BCD
S. uvarum21869.62 ± 0.99 ABC10.07 ± 2.36 AB207.93 ± 31.8 AB80.29 ± 27.62 ABC3.94 ± 0.45 AB0.42 ± 0.08 AB1.22 ± 0.07 ABCD34.65 ± 3.52 AB2.15 ± 0.50 BC
S. uvarum220410.38 ± 0.63 AB9.283 ± 1.86 AB213.61 ± 22.2 AB90.32 ± 29.43 ABC3.84 ± 0.50 AB0.40 ± 0.05 ABC1.02 ± 0.07 BCD31.96 ± 5.61 AB2.07 ± 0.38 BCD
S. uvarum22169.29 ± 1.02 ABC4.84 ± 0.60 ABC194.17 ± 48.7 AB39.08 ± 8.34 ABC3.14 ± 0.60 ABCD0.36 ± 0.04 ABCD1.23 ± 0.06 ABCD23.87 ± 6.13 ABCD1.94 ± 0.37 CDE
S. cerevisiae23498.94 ± 1.36 ABC4.40 ± 0.61 BC161.28 ± 18.41 ABC99.41 ± 23.76 AB3.52 ± 0.41 AB0.27 ± 0.04 ABCD0.48 ± 0.05 CD33.91 ± 4.70 AB1.01 ± 0.0.3 F
S. uvarum23769.10 ± 2.46 ABC6.91 ± 2.59 ABC158.67 ± 61.76 ABC49.23 ± 24.20 ABC2.81 ± 0.84 ABCD0.32 ± 0.08 ABCD1.36 ± 1.00 ABCD22.91 ± 8.88 ABCD0.99 ± 0.0.6 F
S. uvarum24028.41 ± 1.47 ABC9.25 ± 2.37 AB166.11 ± 49.54 ABC65.48 ± 20.68 ABC3.09 ± 0.81 ABCD0.31 ± 0.11 ABCD1.81 ± 0.42 ABC24.66 ± 8.59 ABCD1.31 ± 0.0.5 DEF
S. uvarum24019.00 ± 1.94 ABC10.20 ± 3.26 ABC159.13 ± 43.61 ABC86.14 ± 28.94 ABC3.08 ± 0.92 ABCD0.28 ± 0.07 ABCD1.27 ± 0.24 ABCD22.25 ± 9.79 ABCD1.17 ± 0.08 EF
S. uvarum20715.82 ± 1.36 BC4.98 ± 1.71 ABC95.61 ± 39.4 BC29.48 ± 18.71 BC1.36 ± 0.69 D0.15 ± 0.07 D0.74 ± 0.16 CD8.48 ± 4.83 D0.87 ± 0.08 F
S. uvarum20615.63 ± 0.99 C9.60 ± 3.30 AB63.46 ± 53.23 C45.96 ± 20.88 ABC1.42 ± 0.68 CD0.16 ± 0.09 CD2.24 ± 0.56 AB9.25 ± 6.02 CD1.17 ± 0.09 EF
S. uvarum20467.29 ± 2.01 ABC6.17 ± 2.77 ABC124.13 ± 35.94 ABC50.56 ± 26.21 ABC2.17 ± 0.76 BCD0.20 ± 0.09 BCD1.21 ± 0.30 ABCD17.46 ± 8.16 BCD0.90 ± 0.09 F
S. cerevisiae226510.43 ± 2.05 AB5.82 ± 1.32 ABC170.95 ± 51.36 ABC88.59 ± 18.02 ABC3.66 ± 0.67 AB0.33 ± 0.10 ABCD1.15 ± 0.06 ABCD35.88 ± 8.79 AB1.11 ± 0.05 F
S. cerevisiae22736.73 ± 1.40 ABC2.36 ± 0.60 C105.34 ± 32.26 ABC12.01 ± 1.02 C1.23 ± 0.36 D0.21 ± 0.11 BCD0.29 ± 0.07 D8.98 ± 4.03 D1.12 ± 0.03 F
S. cerevisiae20039.12 ± 1.88 ABC6.94 ± 1.97 ABC171.20 ± 50.52 ABC118.73 ± 62.59 A3.89 ± 0.24 AB0.32 ± 0.08 ABCD0.68 ± 0.14 CD39.72 ± 12.89 A0.95 ± 0.01 F
S. cerevisiae20957.65 ± 1.14 ABC4.93 ± 0.56 ABC119.12 ± 21.09 ABC59.46 ± 3.74 ABC2.54 ± 0.29 BCD0.25 ± 0.03 ABCD0.66 ± 0.03 CD24.27 ± 2.46 ABCD1.06 ± 0.16 F
S. uvarum20835.99 ± 0.74 BC4.93 ± 1.12 ABC111.12 ± 30.50 ABC35.92 ± 13.09 ABC2.17 ± 0.46 BCD0.26 ± 0.08 ABCD1.20 ± 0.47 ABCD19.74 ± 5.42 ABCD0.95 ± 0.05 F
Yeast
Species
Strain
no.
Ethyl Esters from Fatty Acids(EEFA)
Ethyl propanoateEthyl butyrateEthyl hexanoateEthyl octanoateEthyl decanoateEthyl valerateEthyl dodecanoate
S. uvarum210457.36 ± 4.95 CDE45.16 ± 1.23 FG86.53 ± 3.80 EFGH291.56 ± 45.08 EFGHI247.30 ± 33.52 DEFG0.42 ± 0.03 CD258.68 ± 32.96 DEFG
S. uvarum212070.66 ± 16.71 BCD57.37 ± 7.25 CDEFG121.80 ± 21.89 DEFG373.86 ± 67.47 CDEFG392.82 ± 90.60 DEF0.59 ± 0.13 BCD401.77 ± 89.09 DEF
S. uvarum212853.38 ± 9.49 DE52.17 ± 3.14 EFG120.43 ± 7.44 DEFG425.35 ± 76.54 BCDEF488.00 ± 63.42 CD0.52 ± 0.7 BCD495.37 ± 62.37 CD
S. uvarum2176158.94 ± 10.53 A93.79 ± 5.46 AB191.53 ± 16.28 BCDEF606.22 ± 49.90 B887.72 ± 87.30 B1.39 ± 0.08 A888.43 ± 85.84 B
S. uvarum218669.13 ± 11.88 CD55.23 ± 5.87 DEFG123.36 ± 14.0 CDEFG359.55 ± 38.35 CDEFGH468.80 ± 103.79 CD0.82 ± 0.17 B476.49 ± 102.06 CD
S. uvarum2204100.91 ± 9.56 B59.85 ± 3.87 CDEFG110.91 ± 6.62 DEFGH452.85 ± 25.5 BCDE741.37 ± 50.63 BC0.82 ± 0.05 B744.51 ± 49.76 BC
S. uvarum2216172.37 ± 10.62 A74.33 ± 3.9 BCDE133.56 ± 8.04 BCDEF548.31 ± 6.95 BC463.66 ± 16.62 D1.18 ± 0.02 A471.43 ± 16.35 D
S. cerevisiae234941.54 ± 6.13 DEF104.21 ± 17.0 A256.10 ± 49.27 A339.71 ± 77.20 DEFGH141.68 ± 27.57 FG0.61 ± 0.12 BCD154.82 ± 27.11 FG
S. uvarum237688.12 ± 19.10 BC80.15 ± 16.9 ABCD185.19 ± 30.43 BC973.86 ± 40.27 A1905.93 ± 189.17 A0.73 ± 0.20 BC1889.66 ± 186.02 A
S. uvarum240245.20 ± 8.91 DEF49.15 ± 5.69 EFG106.44 ± 11.39 DEFGH293.59 ± 93.67 DEFGHI147.69 ± 57.34 FG0.50 ± 0.05 BCD160.72 ± 56.39 FG
S. uvarum240170.76 ± 12.89 BCD55.83 ± 7.83 CDEFG83.51 ± 18.44 FGH485.70 ± 60.40 BCD911.34 ± 145.23 B0.57 ± 0.07 BCD911.66 ± 142.80 B
S. uvarum207130.65 ± 7.57 EF40.60 ± 5.69 G56.81 ± 16.0 H320.02 ± 29.51 DEFGH434.32 ± 136.17 DE0.39 ± 0.03 D442.58 ± 133.90 DE
S. uvarum206131.84 ± 1.64 EF40.55 ± 6.28 G101.68 ± 25.6 DEFGH402.24 ± 151.09 CDEFG246.06 ± 90.58 DEFG0.45 ± 0.08 CD257.46 ± 89.07 DEFG
S. uvarum204643.61 ± 15.19 DEF47.99 ± 8.93 FG83.97 ± 21.60 FGH459.05 ± 92.84 BCDE813.25 ± 137.77 B0.46 ± 0.10 CD815.20 ± 135.47 B
S. cerevisiae226540.92 ± 5.91 DEF80.59 ± 8.62 ABC147.85 ± 16.34 BCDE247.14 ± 17.84 FGHI67.17 ± 13.19 FG0.69 ± 0.06 BCD81.55 ± 12.97 G
S. cerevisiae227330.44 ± 7.57 EF45.83 ± 7.78 FG63.54 ± 15.44 GH113.50 ± 23.76 I0.009 ± 0.01 G0.45 ± 0.08 CD15.50 ± 0.01 G
S. cerevisiae200321.63 ± 5.0 F68.59 ± 11.4 BCDEF153.89 ± 26.90 BCD345.91 ± 39.18 DEFGH168.46 ± 38.26 EFG0.73 ± 0.23 BC181.15 ± 37.63 EFG
S. cerevisiae209543.44 ± 10.08 DEF51.09 ± 4.62 EFG95.96 ± 10.40 DEFGH177.46 ± 18.36 HI21.61 ± 19.33 G0.61 ± 0.10 BCD36.75 ± 19.01 G
S. uvarum208325.70 ± 1.83 EF39.03 ± 4.13 G70.54 ± 13.79 GH223.80 ± 52.53 GHI269.30 ± 78.80 DEFG0.36 ± 0.07 D280.31 ± 77.48 DEFG
Yeast SpeciesStrain no.Ethyl Esters from Branched Acids(EEBA)C6-Alcohols(C6-OH)
Ethyl isobutyrateEthyl 2-methylbutyrateZ-3-HexenolE-3-HexenolHexanol
S. uvarum21042.56 ± 0.34 CDEF0.46 ± 0.04 A140.19 ± 6.51 ABCD4.39 ± 0.46 A1731.77 ± 89.15 BCDE
S. uvarum21204.92 ± 1.69 ABC0.64 ± 0.20 A176.86 ± 25.80 ABC5.00 ± 0.52 A2171.38 ± 229.22 ABC
S. uvarum21284.93 ± 0.76 ABC0.64 ± 0.09 A151.29 ± 15.1 ABCD3.94 ± 0.41 A1797.3 ± 218.7 BCDE
S. uvarum21766.69 ± 0.60 A0.74 ± 0.03 A148.12 ± 17.15 ABCDE4.58 ± 0.38 A1869.75 ± 83.91 ABCDE
S. uvarum21864.65 ± 0.58 ABCD0.57 ± 0.09 A154.85 ± 2.82 ABCD4.65 ± 0.36 A1967.90 ± 44.01 ABCD
S. uvarum22044.31 ± 0.21 ABCDE0.56 ± 0.05 A168.81 ± 12.2 ABC5.42 ± 0.40 A2208.67 ± 161.80 ABC
S. uvarum22165.05 ± 0.34 ABC0.66 ± 0.06 A181.20 ± 10.05 AB5.53 ± 0.92 A2234.25 ± 185.44 ABC
S. cerevisiae23492.81 ± 0.48 CDEF0.36 ± 0.09 A191.59 ± 7.24 A5.69 ± 0.30 A2539.14 ± 96.89 A
S. uvarum23764.28 ± 0.83 ABCDE0.54 ± 0.14 A158.60 ± 10.66 ABCD5.08 ± 0.45 A1803.84 ± 127.14 BCDE
S. uvarum24024.67 ± 1.13 ABCD0.52 ± 0.12 A187.92 ± 10.84 A5.86 ± 0.72 A2417.87 ± 172.85 AB
S. uvarum24016.58 ± 1.62 A0.62 ± 0.14 A181.73 ± 11.85 AB5.16 ± 0.94 A2242.75 ± 140.58 ABC
S. uvarum20715.53 ± 1.41 AB0.37 ± 0.12 A121.63 ± 22.1 CDE3.67 ± 0.54 A1626.81 ± 308.32 CDE
S. uvarum20615.14 ± 1.10 ABC0.44 ± 0.09 A148.37 ± 29.6 ABCD3.87 ± 0.44 A1841.51 ± 434.03 ABCDE
S. uvarum20464.09 ± 1.01 ABCDE0.43 ± 0.15 A108.39 ± 14.9 DE3.75 ± 0.78 A1353.55 ± 238.15 DE
S. cerevisiae22652.13 ± 0.24 DEF2.28 ± 0.38 A147.23 ± 9.61 ABCDE4.26 ± 0,97 A1883.32 ± 143.94 ABC
S. cerevisiae22731.20 ± 0.46 F2.17 ± 0.46 A129.62 ± 10.8 BCDE3.90 ± 0.35 A1749.91 ± 106.43 BCDE
S. cerevisiae20032.24 ± 0.60 DEF2.35 ± 0.31 A129.60 ± 28.17 BCDE4.02 ± 1.21 A1622.19 ± 377.31 CDE
S. cerevisiae20951.97 ± 0.51 EF2.28 ± 0.35 A128.68 ± 36.2 BCDE3.96 ± 0.28 A1655.67 ± 447.66 CDE
S. uvarum20833.23 ± 0.20 BCDEF2.26 ± 0.32 A92.40 ± 20.39 E6.43 ± 4.27 A1222.57 ± 292.76 E
Yeast
Species
Strain
no.
VolatilePhenols(VP)
4-Ethyl phenol4-Ethyl guaiacol4-Vinyl guaiacol4-Vinyl phenolGuaiacol
S. uvarum21045.74 ± 0.93 BCD0.36 ± 0.15 AB609.05 ± 116.3 ABCDE212.40 ± 37.09 ABCDE1.10 ± 0.09 A
S. uvarum21207.35 ± 1.12 ABCD0.29 ± 0.09 AB1087.30 ± 325.63 E29.27 ± 19.12 E1.45 ± 0.72 A
S. uvarum21286.83 ± 0.75 BCD0.29 ± 0.01 AB1456.3 ± 17.87 BCDE153.97 ± 198.2 BCDE2.40 ± 2.10 A
S. uvarum217612.91 ± 0.31 A0.30 ± 0.02 AB2001.80 ± 161.37 E39.46 ± 7.96 E3.42 ± 4.89 A
S. uvarum21865.75 ± 1.31 BCD0.23 ± 0.03 AB1175.05 ± 273.51 E39.72 ± 11.56 E2.09 ± 2.22 A
S. uvarum22047.29 ± 0.60 ABCD0.26 ± 0.02 AB1216.44 ± 149.23 DE47.71 ± 8.01 DE0.91 ± 0.24 A
S. uvarum22166.15 ± 0.30 BCD0.32 ± 0.01 AB2121.76 ± 107.63 ABCD413.98 ± 324 ABCD1.80 ± 1.32 A
S. cerevisiae23494.10 ± 0.96 CD0.29 ± 0.05 AB1632.24 ± 134.28 A561.04 ± 26.01 A0.89 ± 0.81 A
S. uvarum237612.92 ± 2.33 A0.29 ± 0.03 AB1199.19 ± 156.97 CDE81.33 ± 14.71 CDE11.91 ± 17.74 A
S. uvarum24025.07 ± 0.78 BCD0.34 ± 0.08 AB1599.26 ± 121.19 AB473.78 ± 33.05 AB0.60 ± 0.40 A
S. uvarum24017.56 ± 1.09 ABCD0.31 ± 0.03 AB1793.76 ± 158.55 BCDE187.33 ± 259.49 BCDE3.38 ± 0.13 A
S. uvarum20712.66 ± 0.90 D0.23 ± 0.04 AB884.52 ± 148.71 ABCDE327.35 ± 47.5 ABCDE8.99 ± 14.11 A
S. uvarum20619.06 ± 5.41 ABC0.22 ± 0.03 AB1085.67 ± 366.57 ABCDE274.44 ± 206 ABCDE3.35 ± 0.13 A
S. uvarum204610.82 ± 2.52 AB0.18 ± 0.03 B653.55 ± 113.66 CDE82.09 ± 35.37 CDE4.82 ± 4.44 A
S. cerevisiae22656.57 ± 1.83 BCD0.40 ± 0.04 A1608.44 ± 145.22 ABC418.23 ± 29.5 ABC1.08 ± 0.17 A
S. cerevisiae22736.46 ± 0.95 BCD0.17 ± 0.04 B 610.93 ± 127.20 ABCDE228.56 ± 43.8 ABCDE0.93 ± 0.18 A
S. cerevisiae20038.12 ± 1.82 ABCD0.24 ± 0.07 AB680.06 ± 196.04 ABCDE246.31 ± 78.99 ABCDE1.09 ± 0.48 A
S. cerevisiae20958.33 ± 2.80 ABCD0.28 ± 0.18 AB36.01 ± 10.53 E18.18 ± 2.88 E0.75 ± 0.02 A
S. uvarum20839.58 ± 1.53 ABC0.21 ± 0.06 AB357.71 ± 34.07 E26.92 ± 2.24 E6.30 ± 1.32 A
Table 3. Summary of results from the partial least squares (PLS) regression analysis.
PLS Regression: Model Selection and Validation for Different Families of Aroma Attributes.
Y-Block
(i.e., Aroma Groups of Attributes)
(y Variables, n = 5)
Number of Latent Variables (LVs)R-Sq
(R2)
Captured Cumulative
X-Block Variance
(R2X cum)
Captured Cumulative
Y-Block Variance
(R2Y cum)
Ethyl esters from fatty acids10 *0.960.890.93
Ethyl esters of branched acids0.92
Acetate esters0.95
C6-alcohols0.86
Volatile phenols0.94
Ethyl esters from fatty acids90.960.860.90
Ethyl esters of branched acids0.91
Acetate esters0.87
C6-alcohols0.86
Volatile phenols0.92
Ethyl esters from fatty acids80.870.820.88
Ethyl esters of branched acids0.91
Acetate esters0.86
C6-alcohols0.86
Volatile phenols0.92
* The optimal number of latent variables (LVs) was systematically chosen to 10 by the PLS regression method.
Disclaimer/Publisher’s Note: The statements, opinions and data contained in all publications are solely those of the individual author(s) and contributor(s) and not of MDPI and/or the editor(s). MDPI and/or the editor(s) disclaim responsibility for any injury to people or property resulting from any ideas, methods, instructions or products referred to in the content.

