Article

Anaerobic Digestion, Codigestion of Food Waste, and Chicken Dung: Correlation of Kinetic Parameters with Digester Performance and On-Farm Electrical Energy Generation Potential

by
Khairina Jaman
1,†,
Nurjannah Amir
1,†,
Mohammed Ali Musa
1,2,
Afifi Zainal
3,4,
Liyana Yahya
3,4,
Abdul Malek Abdul Wahab
5,
Sri Suhartini
6,
Tuan Nurfarhana Tuan Mohd Marzuki
1,
Razif Harun
4 and
Syazwani Idrus
1,*,†
1
Department of Civil Engineering, Faculty of Engineering, Universiti Putra Malaysia, Serdang 43400, Malaysia
2
Department of Civil and Water Resources Engineering, University of Maiduguri, Maiduguri 600104, Nigeria
3
Renewable Energy & Green Technology Unit, TNB Research Sdn. Bhd. Lorong Ayer Itam, Kawasan Institusi Penyelidikan, Kajang 43000, Malaysia
4
Department of Chemical and Environmental Engineering, Faculty of Engineering, Universiti Putra Malaysia, Serdang 43400, Malaysia
5
School of Mechanical Engineering, College of Engineering, Universiti Teknologi MARA, Shah Alam 40450, Malaysia
6
Department of Agro-Industrial Technology, Faculty of Agricultural Technology, Universitas Brawijaya, Malang 65145, Indonesia
*
Author to whom correspondence should be addressed.
These authors contributed equally to this work.
Fermentation 2022, 8(1), 28; https://doi.org/10.3390/fermentation8010028
Submission received: 29 November 2021 / Revised: 28 December 2021 / Accepted: 5 January 2022 / Published: 12 January 2022
(This article belongs to the Special Issue New Research on Anaerobic Digestion)

Abstract

:
Valorization of agro-food waste through anaerobic digestion (AD) is gaining prominence as alternative method of waste minimization and renewable energy production. The aim of this study was to identify the key parameters for digester performance subjected to kinetic study and semicontinuous operation. Biochemical methane potential (BMP) tests were conducted in two different operating conditions: without mixing (WM) and continuous mixing (CM). Three different substrates, including food waste (FW), chicken dung (CD), and codigestion of FW and CD (FWCD) were used. Further kinetic evaluation was performed to identify mixing’s effect on kinetic parameters and correlation of the kinetic parameters with digester performance (volatile solid removal (VS%) and specific methane production (SMP)). The four models applied were: modified Gompertz, logistic, first-order, and Monod. It was found that the CM mode revealed higher values of Rm and k as compared to the WM mode, and the trend was consistently observed in the modified Gompertz model. Nonetheless, the logistic model demonstrated good correlation of kinetic parameters with VS% and SMP. In the continuous systems, the optimum OLR was recorded at 4, 5, and 7 g VS/L/d for FW, CD, and FWCD respectively. Therefore, it was deduced that codigestion significantly improved digester performance. Electrical energy generation at the laboratory scale was 0.002, 0.003, and 0.006 kWh for the FW, CD, and FWCD substrates, respectively. Thus, projected electrical energy generation at the on-farm scale was 372 kWh, 382 kWh, and 518 kWh per day, respectively. Hence, the output could be used as a precursor for large-scale digester-system optimization.

Graphical Abstract

1. Introduction

Improper management, a series of landfill problems, and population growth have created an alarm regarding sustainable food waste (FW) management. FW generation in the United States has increased significantly with time. The FW production for commercial, residential, and institutional samples was reported to have no significant difference at 0.279 kg/capita/day. This is equivalent to 35.5 million tons of FW disposed annually [1]. Inadequate disposal or treatment of FW may lead to detrimental effects on human health and the environment (such as odor problems, pests, leachate, and pollution) [2]. Many studies have highlighted the potential of FW in energy generation using materials such as biogas, biofertilizers, etc. [3,4,5]. The valorisation of FW through anaerobic digestion (AD) for biogas production is at the forefront of the renewable energy discussions in recent times [6].
In addition, a lack of on-farm scale treatment applied to animal waste, including chicken dung (CD), can bring a risk of contamination of surface water bodies, groundwater, and soil. CD generated by 1000 birds per day was estimated at 80 kg for layers and 120 kg for broilers. This is equivalent to 0.1 kg per bird per day [7,8]. Furthermore, several studies have emphasised that animal waste (i.e., CD, cow manure, etc.) has gained attention in bioenergy production, include biodiesel, bioethanol, and biogas [9,10,11]. Specific to biogas production, CD has also been highlighted as potential feedstock either in a mono- or codigestion AD system [12,13]. Yet, as a single substrate, CD contains high levels of nitrogenous compounds, which can increase the production of free ammonia and ammonium ions, causing ammonia inhibition [14,15].
Several studies have addressed bioreactor enhancement and inhibition analysis of FW as a single substrate [16,17,18,19,20]. Monodigestion of FW can cause inhibition problems, leading to an acceleration in fermentation and a reduction in methane yields. This was due to high carbon content and low nitrogen content in FW [21]; imbalanced trace elements, lack of diversity in the microbial community, and the influence of operating factors [22]. To improve the AD performance using FW, codigestion of FW with another cosubstrate has been widely discussed. Previous studies have highlighted that the performance of the digester was increased using codigestion of FW with CD [21,23,24,25,26,27].
In addition to experimental work, kinetic evaluation studies on codigestion of FW and CD have also been studied and analyzed. The kinetic model is a useful predicting tool for large-scale anaerobic reactor design, because it aids in understanding the design, operation, and maximization of biogas output [28,29,30,31,32,33]. Studies on kinetic evaluation of FW and CD were also conducted by other researchers; Dhamodharan et al. investigated potential of FW, Zahan et al. utilized agro-industrial waste, Hassan et al. used CD and oxidative cleaved wheat straw, and Pečar et al. used CD with sawdust and miscanthus [27,34,35,36]. Li et al. [37] stated that a modified Gompertz model could better fit data from a monodigestion experiment using FW, while Sumantri et al. [38] found that the first-order model was the best fit for FW.
The effects of mixing and other operational conditions have also been widely evaluated in an AD system. Lindmark et al. [39] reported on the effect of mixing, which could enhance AD performance. High mixing intensity resulted in a negative effect on flocs formation. Low-intensity mixing is preferable, to allow proximity between microorganisms, and thus maintaining juxtaposition of microbes [40,41]. Lin and Pearce [42] reported enhancement of methane when the mixing speed was reduced from 45 min/h to 15 min/h. Singh et al. [43] revealed a 5–18% increment in biogas production at a higher mixing speed at 67 rpm. The effect of mixing is rarely addressed in kinetic model study.
Slobodkina et al. [24] demonstrated two-stage anaerobic codigestion of CD and FW. The first stage operated at 55 °C (hydrolysis stage) for 55 days, and was followed by a second-stage AD at 37 °C. Despite the role of CD as the cosubstrate in AD of FW to improve system performance, knowledge regarding the kinetic evaluation in mesophilic conditions without any pretreatment remains inadequate. Previous studies by Jijai and Siripatana [25] and Deepanraj et al. [26] demonstrated batch anaerobic codigestion of FWCD and evaluated the best-fit kinetic model among first-order, modified Gompertz, and logistic models by comparing between experimental results and predicted data. None of the previous studies on codigestion of FWCD focused on the effects of mixing on kinetic model parameters. Li et al. [37] investigated the correlation of kinetic parameters with bioreactor performance, including specific methane production (SMP) and volatile solid (VS) removal in AD of FW. To our best knowledge, no previous study has compared predicted data with measured data and extended the analysis by investigating the correlation of kinetic parameters with bioreactor performance in a single substrate of CD and codigestion of FWCD. Therefore, in this study, further kinetic evaluation was conducted on codigestion of FWCD, as well as on single substrates of FW and CD.
Furthermore, most of the previous work emphasised electrical energy generation during single-substrate AD of FW or CD [44,45,46,47,48,49]. Therefore, in this research, the electrical energy generated by a bioreactor at the laboratory scale (LS) and the estimated electrical energy generated by a bioreactor at the on-farm scale (OFS) were determined. Aiming at further evaluation of kinetic study of bioreactor performance and on-farm electrical energy generation potential, the objectives of this study were: (1) to identify the best-fit kinetic models applied in codigestion and monodigestion systems in dynamic conditions; (2) to investigate the effects of mixing on kinetic parameters, and to identify which was the best-fit model when the mixing process was applied; (3) to identify the correlation between kinetic parameters and bioreactor performance; and (4) to comparatively study the electrical energy generation at the LS and the predicted electrical energy at the OFS. At the OFS, the electrical energy was calculated based on the recorded SMP at the optimum organic loading rate (OLR) and the output from the LS bioreactor performance study. The study provided new perspectives for the prediction and improvement of a large-scale codigestion system, and served as a precursor for optimizing the operational conditions in the anaerobic digester.

2. Materials and Methods

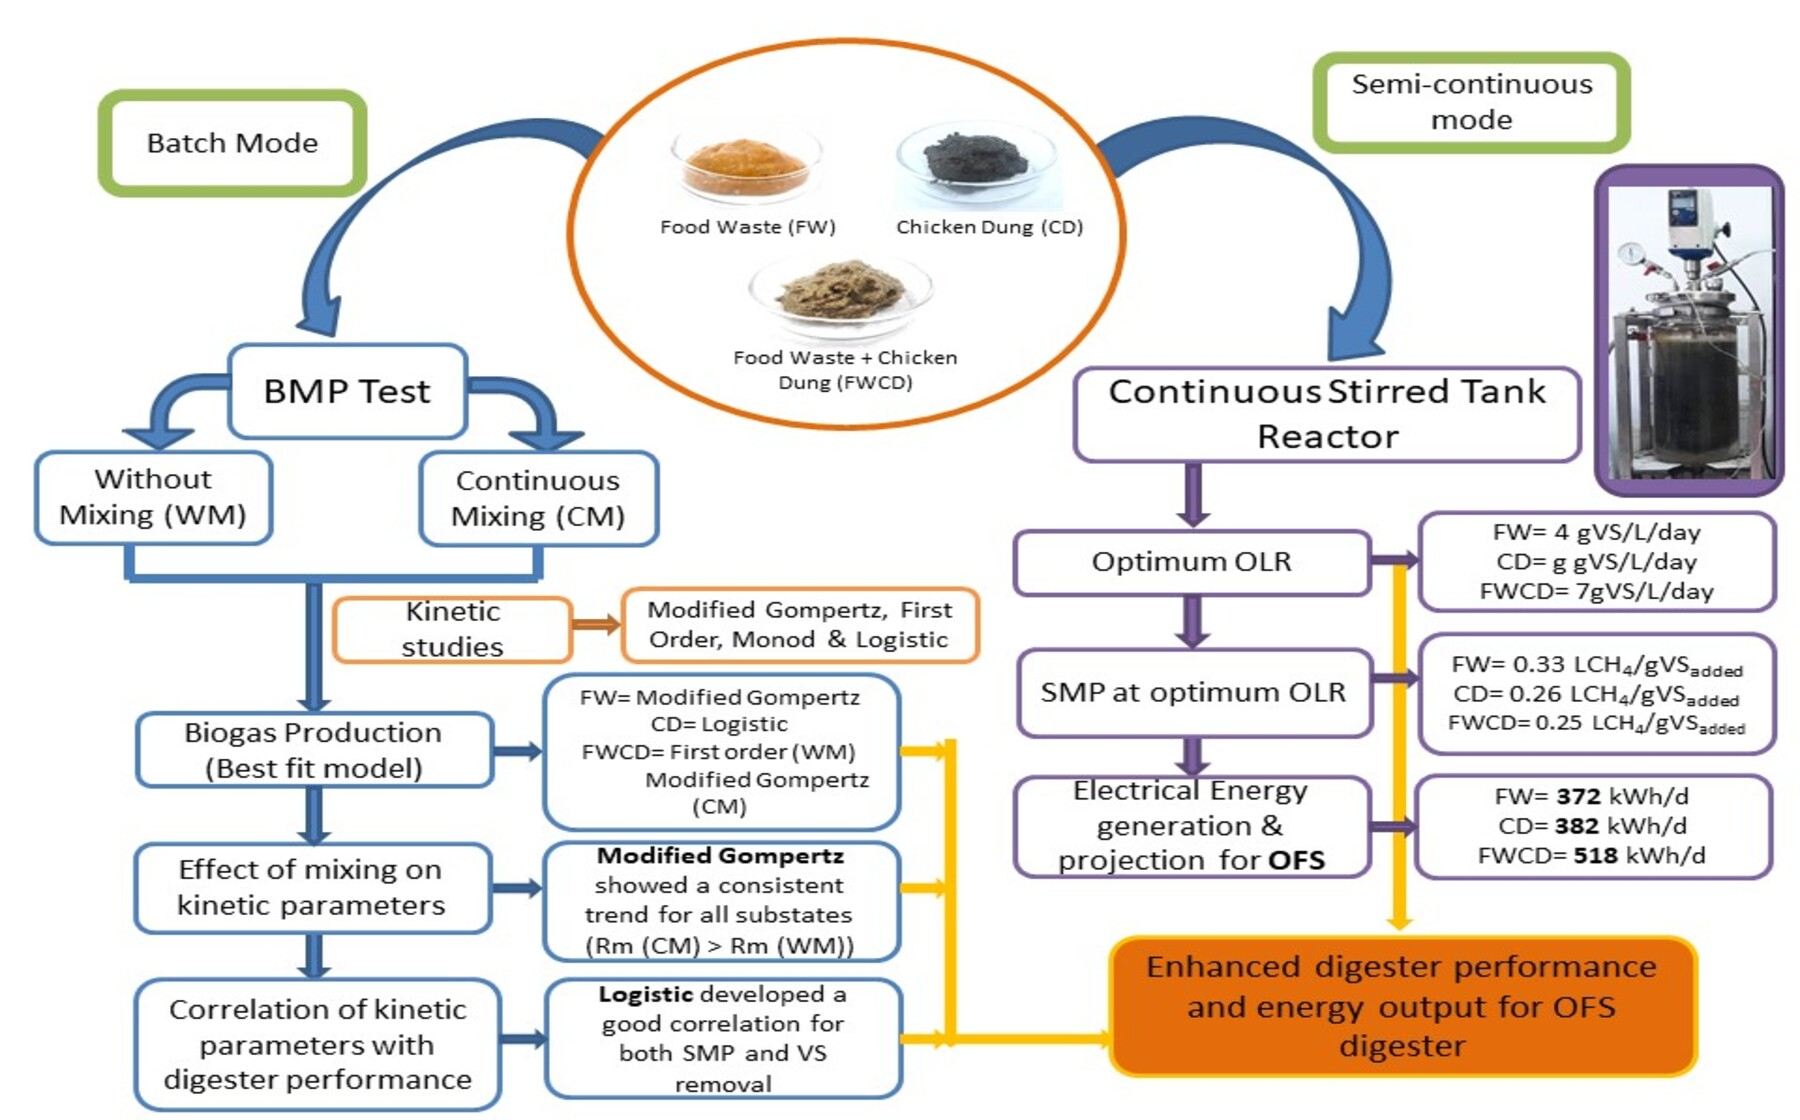
2.1. Physicochemical Characterization of FW, CD and Co-Digestion of FW with CD

The characteristic of substrates used for the BMP test and the continuous study are shown in Table 1 for FW, CD, and codigestion of FWCD. For the codigestion system, the substrate was prepared by adding 70% of FW with 30% of CD. This ratio was selected as suggested by Deepanraj et al. [26]. The FW sample was collected from a food court at the Faculty of Engineering, Universiti Putra Malaysia. The CD sample was transported from a chicken farm located in Kuala Kangsar Perak, Malaysia. The samples were then analyzed for chemical oxygen demand (COD), volatile solids (VS), oil and grease (O & G), total nitrogen, and carbon-to-nitrogen (C/N) ratio.

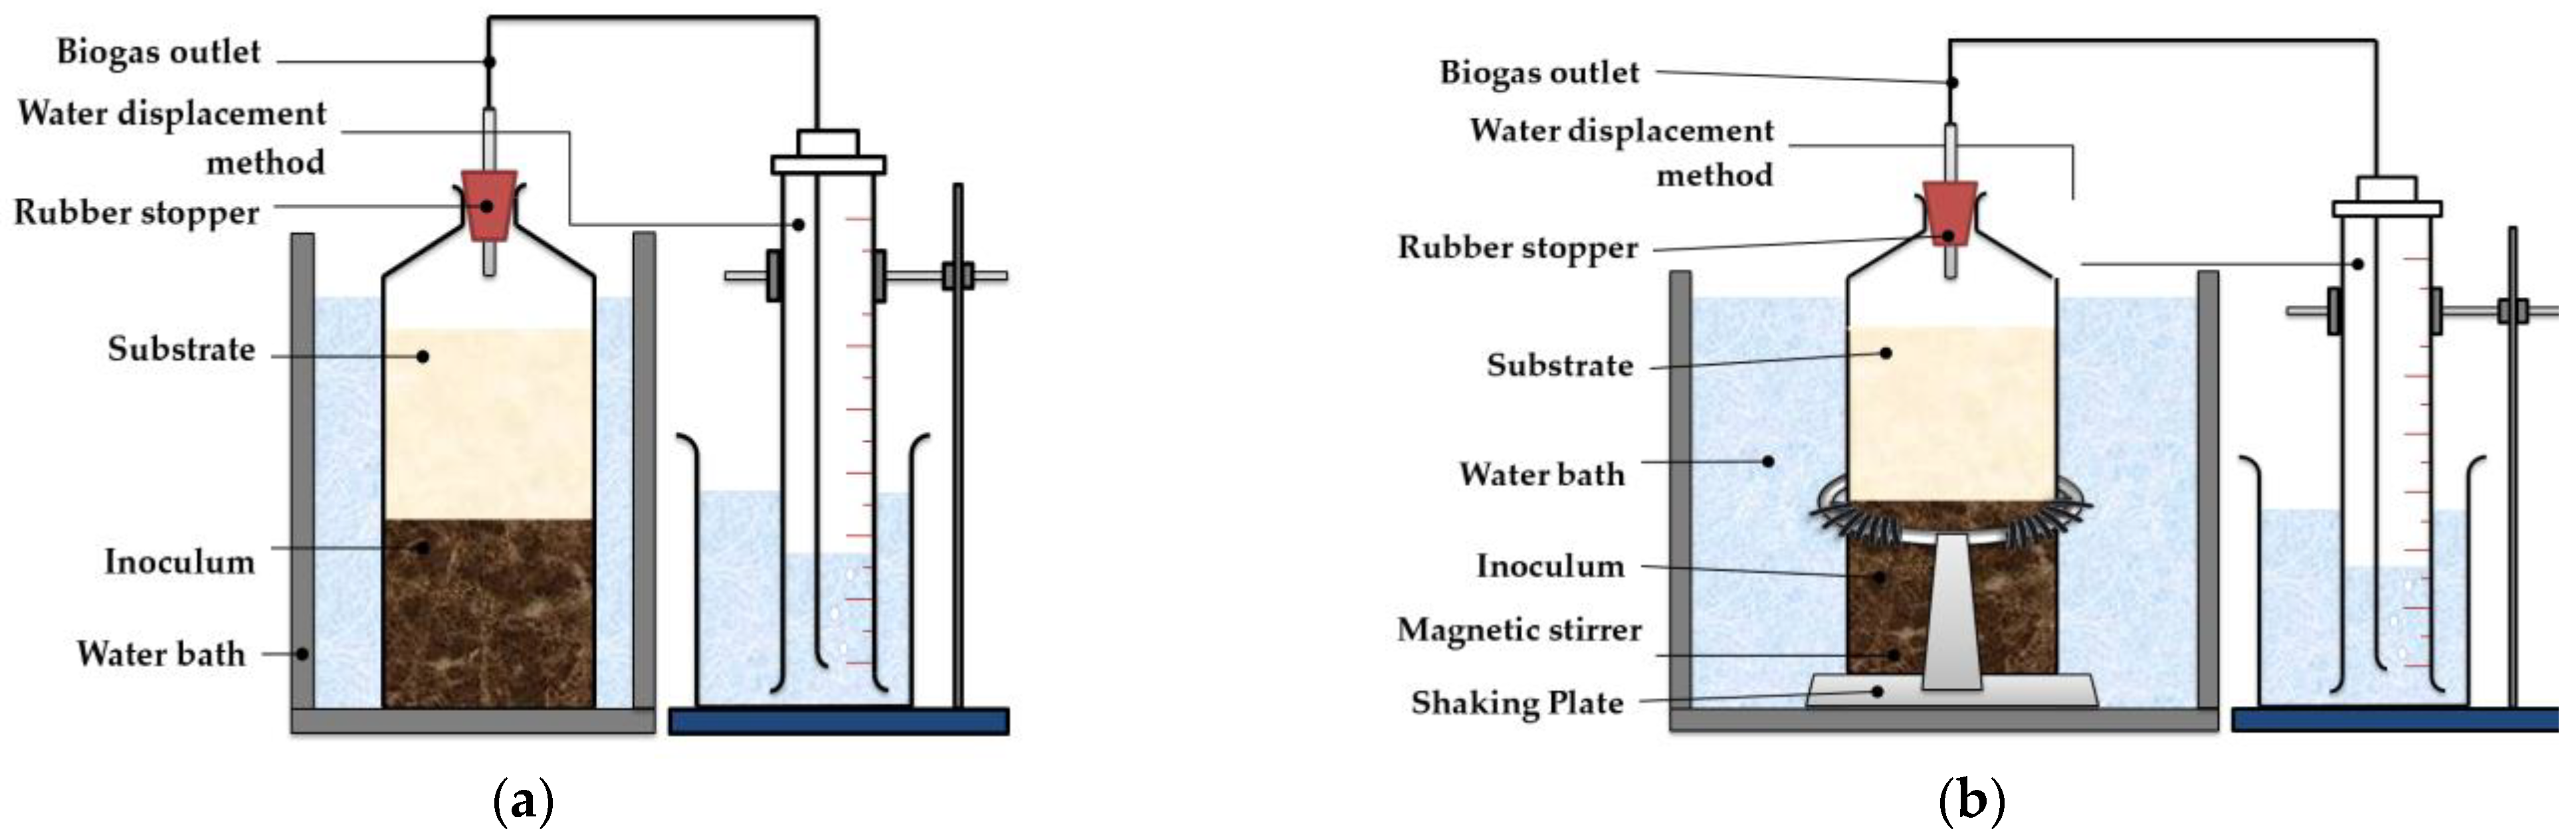
2.2. Biochemical Methane Potential (BMP) Test without Mixing (WM) and with Continuous Mixing (CM)

The BMP test was conducted in two different operating conditions, which included a static system without mixing (WM) and a system with continuous mixing (CM). In general, for both operating conditions, the BMP test was performed in accordance with the procedure described by Deepanraj et al. [26]. Three (3) 1 L batch digesters were used for BMP WM, which comprised FW only, CD only, and codigestion of FWCD in batch digesters labelled as 1, 2, and 3, respectively. Before closing with a rubber stopper, all digesters were purged with 100% nitrogen gas (N2) to eliminate the presence of air in the head space. Following that, the batch digesters were incubated at 38 °C. Similar experimental design was applied for BMP CM, where the setup for digesters included substrates of FW, CD, and FWCD for batch digesters 4, 5, and 6, respectively. Batch digesters for BMP CM were placed on a shaking plate at 60 rpm, and each digester was equipped with a magnetic stirrer as described in Lin and Pearce [42]. For the batch digesters with sample of FWCD, BMP WM (digester 3) and BMP CM (digester 6), a sample of CD was added with the FW to reach a ratio of 30% and 70%, respectively, as suggested by Deepanraj et al. [26], where at this ratio, the highest degradation efficiency was obtained. The volume of biogas produced was determined using the water-displacement method as described by Dhamodharan et al. [27], which was carried out using a graduated measuring cylinder. Additionally, as a control in this experimental setup, two batch digesters were prepared with each digester containing inoculum only. The inoculum was collected earlier from a sewage treatment plant located at Universiti Putra Malaysia, with a volatile suspended solid (VSS) concentration of 12,000 mg/L. The substrate-to-inoculum ratio for both operating conditions was 1:1 (on a VS% basis), as suggested by Orfanoudaki et al. [50] (g/gVS). The setup for BMP WM and BMP CM are shown in Figure 1a,b.

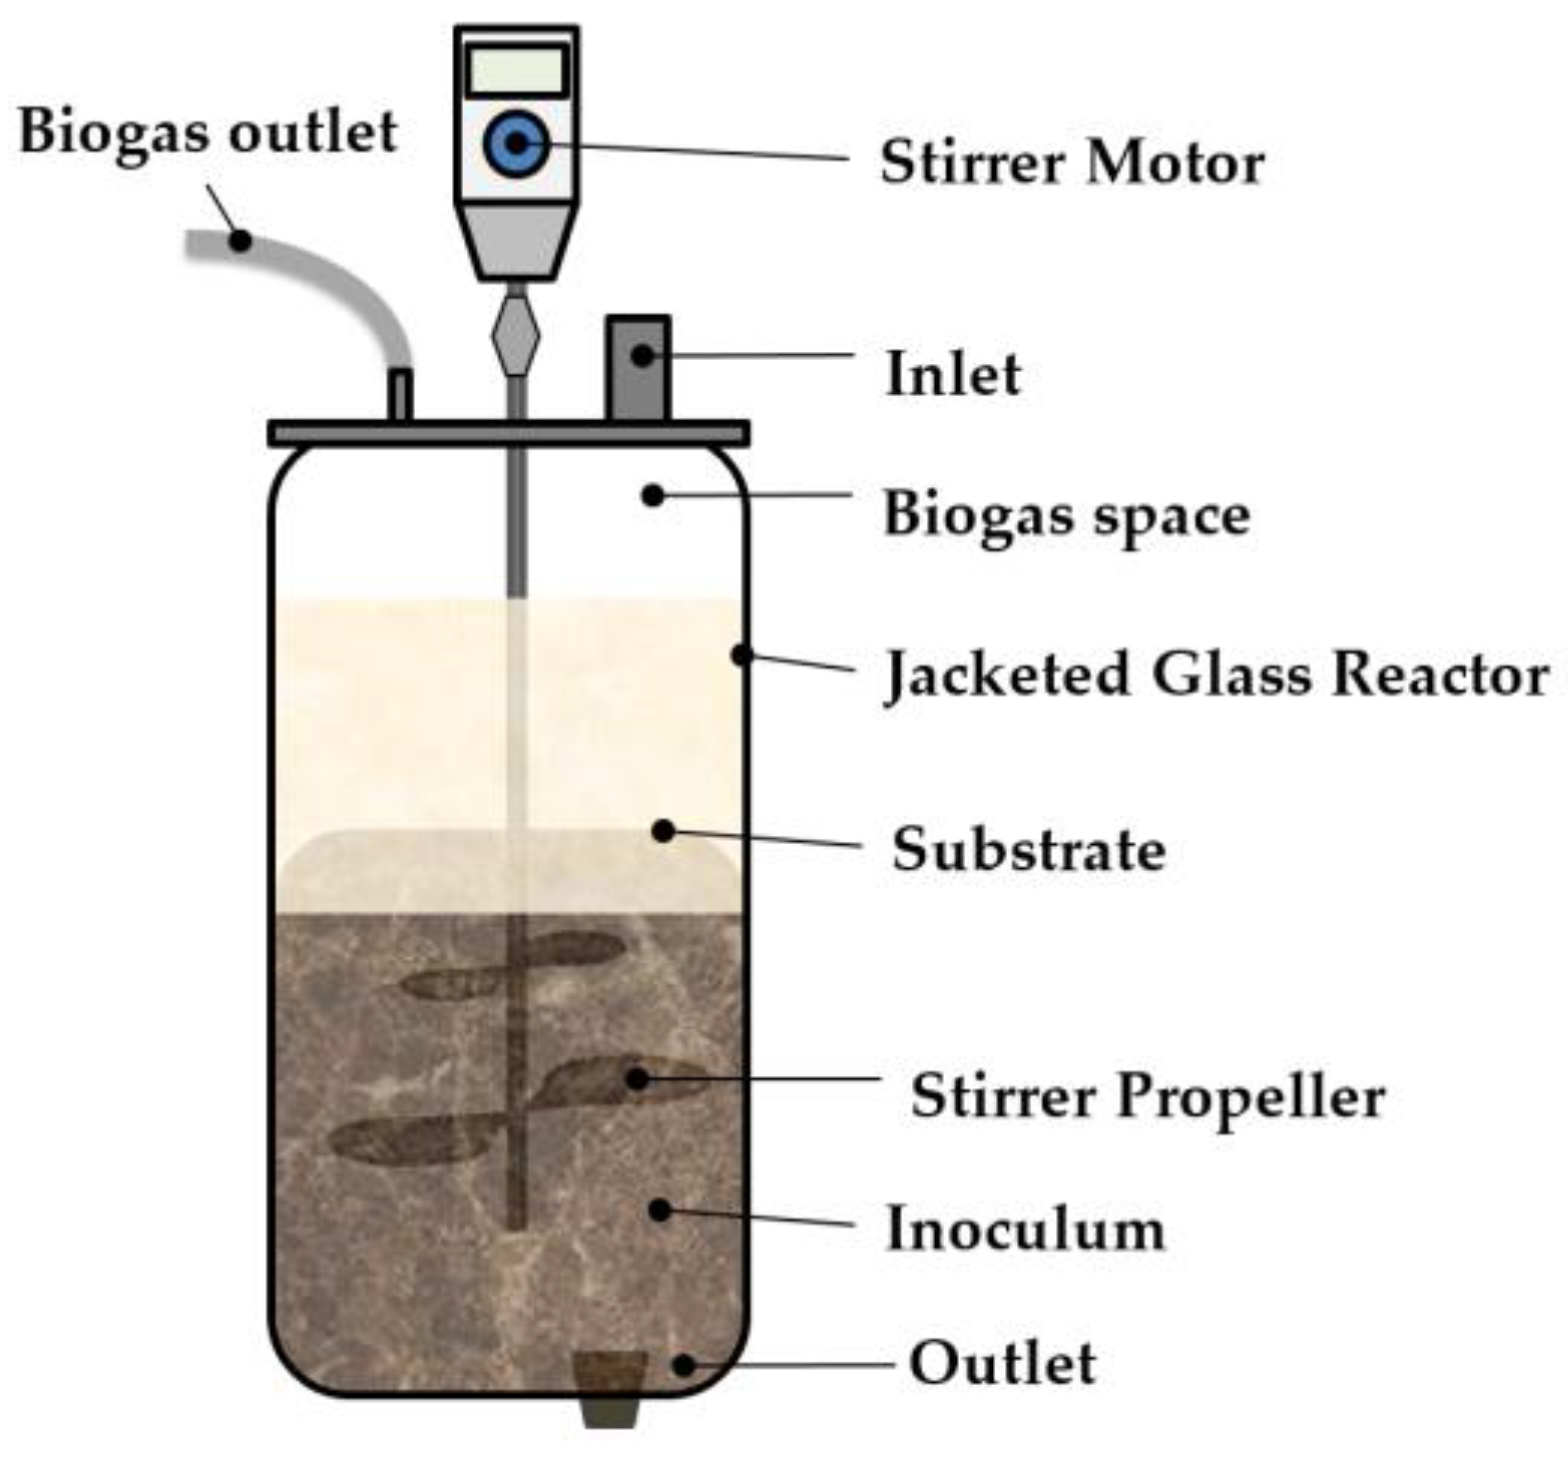
2.3. Continuous Study for Single Substrate of FW, CD and Codigestion of FWCD

Three (3) sets of 6 L continuous stirred tank reactors (CSTRs) were employed for a semicontinuous study, as shown in Figure 2. A similar experimental design was applied in this stage, in which CSTR 1, CSTR 2, and CSTR 3 were fed on FW, CD as a single substrate and a codigestion FWCD sample respectively. The ratio of FW to CD was maintained at 70% to 30%. Biogas production, SMP, COD removal, total ammonia nitrogen (TAN), and pH were measured for digester performance evaluation. All reactors were run in parallel at a mesophilic temperature of 38 °C, and with a mixing speed of 60 rpm. The OLRs for all reactors were kept similar throughout the monitoring period and increased gradually for each phase. Hydraulic retention time (HRT) was varied based on the applied OLR [51]. Initially, CSTR 1, 2, and 3 were seeded with inoculum, as described earlier in Section 2.2.

2.4. Analytical Method

The digestate from all reactors were collected and tested for pH and VS% on a daily basis. Additionally, the IA/PA ratio, TAN, and FOG were examined twice per week, as well as the biogas composition for methane concentration. The biogas volume was recorded daily using a water-displacement method as described earlier in Section 2.3. The pH of the reactors was monitored by Mettler-Toledo AG (Schwarzenbach, Switzerland). COD, VS%, and VSS were all determined using the Standard Method for the Examination of Water and Wastewater [52] and as described in Muhamad et al. [53]. The spectrophotometer (HACH 157 DR 900, Agilent, Santa Clara, CA, USA) and salicylate powder pillow technique 8155 were used to determine TAN. Meanwhile, a titrimetric method using 0.02 N sulphuric acid (H2SO4) was used to measure the total alkalinity (IA/PA). A gas chromatograph (Agilent HP 6890 N) equipped with a thermal conductivity detector (TCD) and a capillary column (30 mm × 0.5 mm × 40 μm) was used to quantify the composition of the biogas produced. Volatile fatty acids (VFAs) were analysed in a Shimadzu GC 2010 gas chromatograph with a FameWax capillary column (30 m × 0.32 mm × 0.25 µm) and a flame ionization detector (FID).

2.5. Kinetic Analysis: The Effect of Mixing on Kinetic Parameters and Correlation of Kinetic Parameters with Bioreactor Performance

In this section, Excel Solver was used to estimate the kinetic parameters of all models, which included the modified Gompertz, logistic, first-order, and Monod models. The modified Gompertz model described the lag phase and the highest specific methane production rate, whereas the first-order kinetic model provided information on the hydrolysis rate constant [20].
The modified Gompertz (Equation (1)), logistic (Equation (2)) and Monod models were designed to reflect the microbial growth curve [54]; in the modified Gompertz model, the rate of methane production in batch reactors is estimated to be parallel to the specific growth of methanogenic bacteria. Meanwhile, in the logistic model, methane production is assumed to be proportional to its maximum rate. In both equations (modified Gompertz (Equation (1)) and logistic model (Equation (2)), λ represents the time for the microbes to adapt to the new environment before beginning their microbial activities, where a shortened lag phase was shown to improve system stability and the digestion efficiency. The mathematical equations are presented in Table 2.
Where Rm is maximum biogas production rate (l/d); λ is the lag phase (day) (modified Gompertz and logistic models); S(t) is the cumulative biogas production at digestion time “t” days; S is the biogas potential of the substrate (expressed in L); k is the first-order biogas production rate constant (first order, Monod); and t is the time in days. The biogas potential of the substrate was calculated using the Excel Solver. The root-mean-square error (RMSE) was used to signify the accuracy of the model fit for experimental data, which was calculated using the following Equation (5). The smaller the RMSE value, the better the fit.
RMSE = i = 1 N ( S exp , i S mod , i ) 2 N  
where Sexp,i is the average production of biogas from the experiment, Smod,i is the biogas produced by the model, and N is the observed data points [55].
Finally, the correlation coefficient (R2) value was determined to indicate how close the predicted line was to the measured data. When the R2 number approached 1, it meant that the measured and predicted data had a satisfactory correlation.

2.6. Electrical Energy Generation Conversion

The analysis for energy generation was calculated using SMP data obtained at the optimum OLR for each of the semicontinuous systems (CSTR). The optimum OLR was selected based on the highest SMP obtained and before any sign of inhibition. The SMP was obtained in the unit of L CH4/VSadded into m3/kgVS and kJ/kgVS, as explained in Khanal et al. [56] and Equations (6) and (7). Therefore, electrical energy generation in kWh was calculated using Equation (8):
Energy   in   E   ( kJ kgVS ) = SMP   ( m 3 kgVS ) × 35846   ( kJ m 3 )
Energy   in   P ( kWh kgVS ) = E   ( kJ kgVS ) × 0.00028   ( kWh kJ )
Energy   in   P e   ( kWh ) = P ( kWh kgVS ) × VS added ( kgVS )
where VSadded is the volatile solids of the substrate (kgVS per day).

3. Results and Discussion

3.1. Summary of BMP Test of AD for FW, CD, and Codigestion of FWCD

The BMP tests of single substrates of FW and CD and codigestion of FWCD were carried out to investigate the potential for biogas production in two operational conditions. Table 3 shows the performance of the BMP test for samples without mixing (WM) and continuous mixing (CM). The highest SMP and VS% were obtained in the batch digester treating FW in operational CM mode (SMP 0.64 L CH4/VS and VS% of 83%). For all BMP digesters, the pH value maintained at the lowest was recorded at 6.55 (in codigestion FWCD CM), and the highest was found to be 7.02 (in single-substrate CD WM). This result was in agreement with the IA/PA ratio. The batch mode digester fed on codigestion system FWCD WM recorded the highest IA/PA ratio of 0.19. Likewise, in all batch digesters, SMP and VS% were higher when mixing was introduced; whereas the IA/PA ratio, pH, and TAN decreased when mixing was conducted. These findings suggested that mixing had a positive effect on the output of the anaerobic digestion.

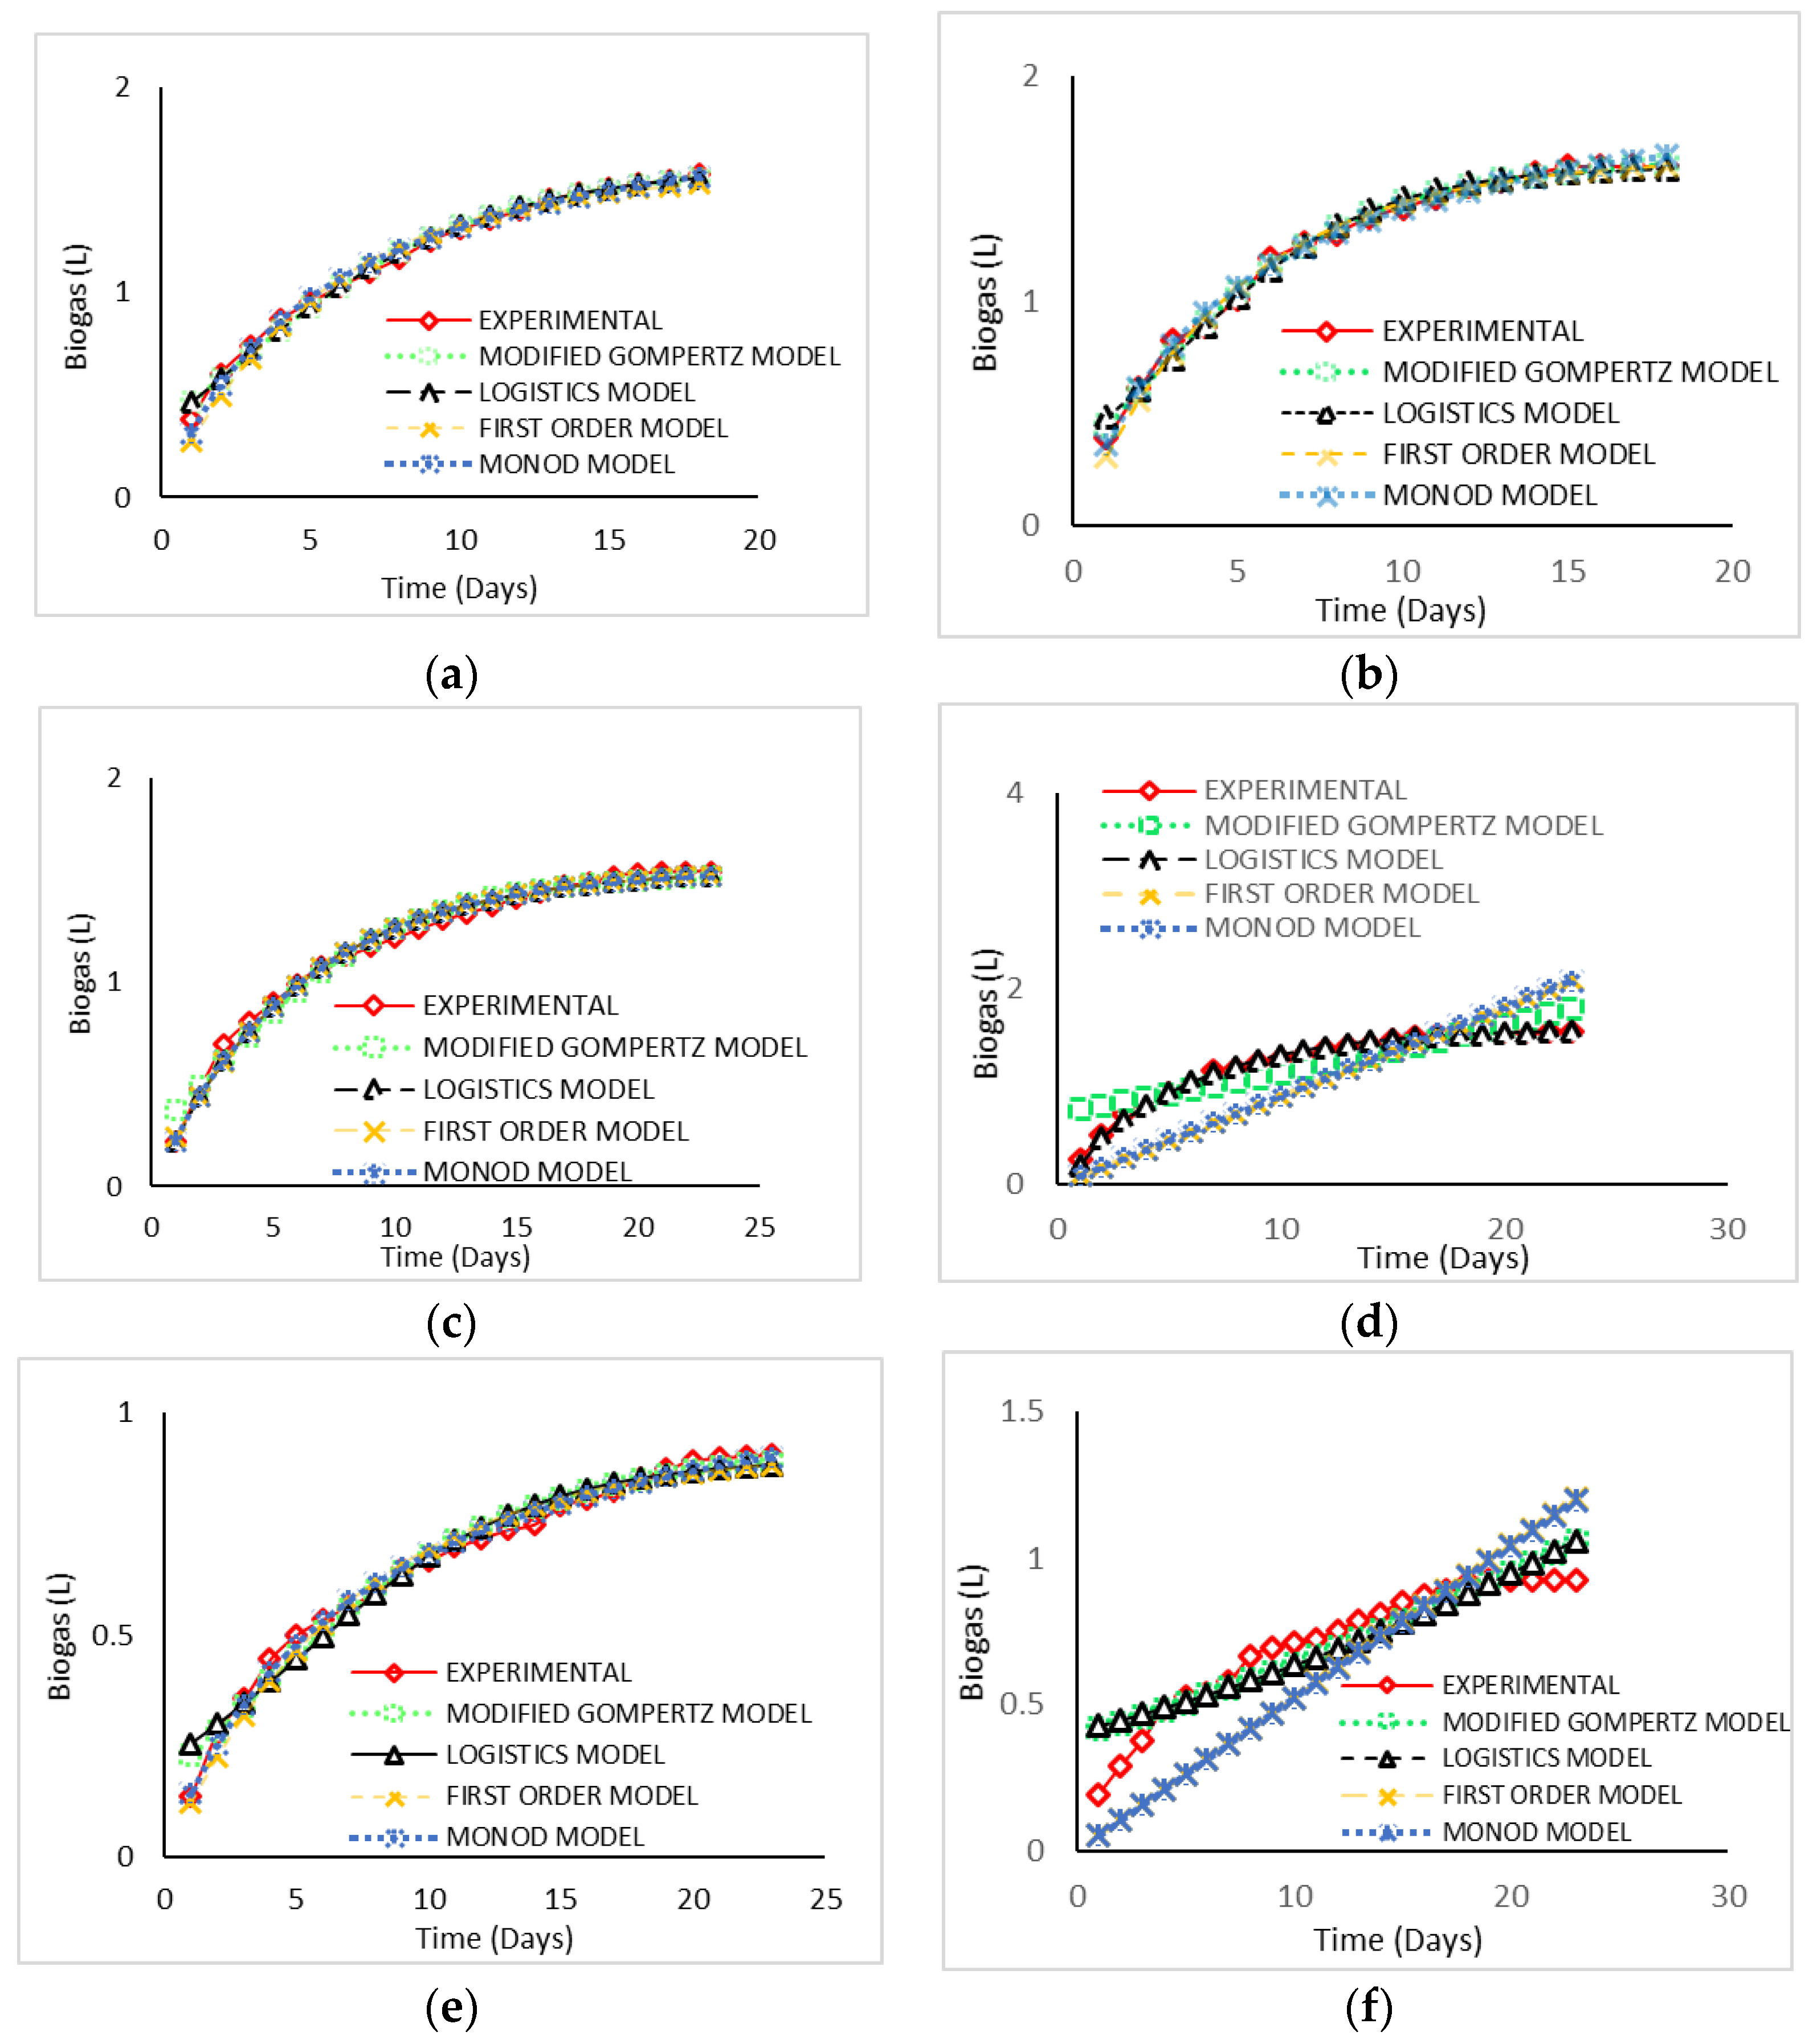
3.2. Kinetic Analysis of Biogas Production from BMP Test

Table 4 summarised the kinetic parameters calculated for all substrates using the modified Gompertz, logistic, first-order kinetic, and Monod models. The first-order and Monod kinetic models were used to calculate the biogas production rate constant (k). Meanwhile, Rm was determined using the modified Gompertz and logistic models. Additionally, Table 4 shows R2, RSME, percentage difference between predicted and measured biogas production, and percentage biogas difference between operating condition of WM and CM. For FW, the modified Gompertz model showed better performance compared to the other models in terms of predicted biogas output for both FW CM and FW WM, with the lowest RSME of 0.0007. This finding was proved by the highest R2 value obtained in the modified Gompertz model, which was 0.9208 for FW WM and 0.8588 for FW CM. This finding matched the reports by Li et al. [37] and Deepenraj et al. [55]. Furthermore, there were low percentage differences between the predicted and measured biogas production for both FW CM and the FW WM these were less than 2%. The least-applicable model in predicting biogas production for FW was the logistic model, since it revealed the highest values of RMSE, which were 0.0317 for FW WM and 0.0515 FW CM. The predicted biogas production using the four models and measured biogas production under operating conditions of WM and CM are presented in Figure 3.
For single-substrate CD, the logistic model was the most applicable model for both CD WM and CM, because the RMSE recorded was the lowest (0.0011 for WM and 0.0330 for CM), and the R2 value obtained was greater than 0.8 (close to 1), indicating that there was a minor difference between the experimental and predicted data. A small percentage difference was also found for biogas prediction using the logistic model (2.49%) compared with the experimental data. The least-applicable model for the CD WM substrate was recorded by the modified Gompertz model, which recorded the highest value of the RMSE (0.0025). Meanwhile, the first-order model was the least-applicable model for CD CM, since it had the highest value for the RMSE of 0.350, where the percentage difference between the predicted and measured data was 23.06%. Nonetheless, for the codigested sample of FWCD, the best-fitted model was the first-order model for codigestion substrate FWCD WM, and the modified Gompertz model for FWCD CM. Both models revealed the lowest value of the RMSE (0.0003 and 0.0810, respectively); the percentage differences between the predicted and measured data for FWCD WM and FWCD CM were 1.44% and 12.98%, respectively. Most previous studies found the modified Gompertz model as the best-fit model [25,26]. The least percentage difference in biogas between experiment and model was FW CM for the modified Gompertz model, followed by the logistic model, at 0.16% and 0.18%, respectively. All models for CD had percentage difference higher than 12%, while for codigested FWCD, only the logistic model had percentage difference below 1%, and the other model had percentages up to 25%. Overall, FW CM recorded the least overall percentage differences for experiments and models of 0.66%, while CD CM had the highest overall average percentage differences for all models, at 17.82%.
In addition, when comparing the biogas production between the operating conditions; i.e., WM and CM, the sample that had highest percentage differences between WM and CM was FW, which was 2.35% for experimental value, followed by CD, which has a percentage difference of 1.90%. The least percentage difference between WM and CM was codigestion of FWCD, which had a value of 1.70%. For the kinetic model, the highest value of percentage difference between WM and CM was 56.7%, which resulted from the first-order model for codigested FWCD, followed by the Monod model, which reported a percentage difference of 55.7%. The least percentage difference between WM and CM resulted from the logistic model of the codigested FWCD sample, which had a value of 4.2%, followed by the modified Gompertz model of the FW sample, which had a percentage difference of 4.5%. Overall, the most applicable model for the FW sample was the modified Gompertz model, and for the CD sample was the logistic model. Meanwhile, for FWCD WM, the most applicable model was the first-order model, and for FWCD CM, the modified Gompertz model. The result for codigestion was also in agreement with the findings by Li et al. [37] and Deepanraj et al. [26].

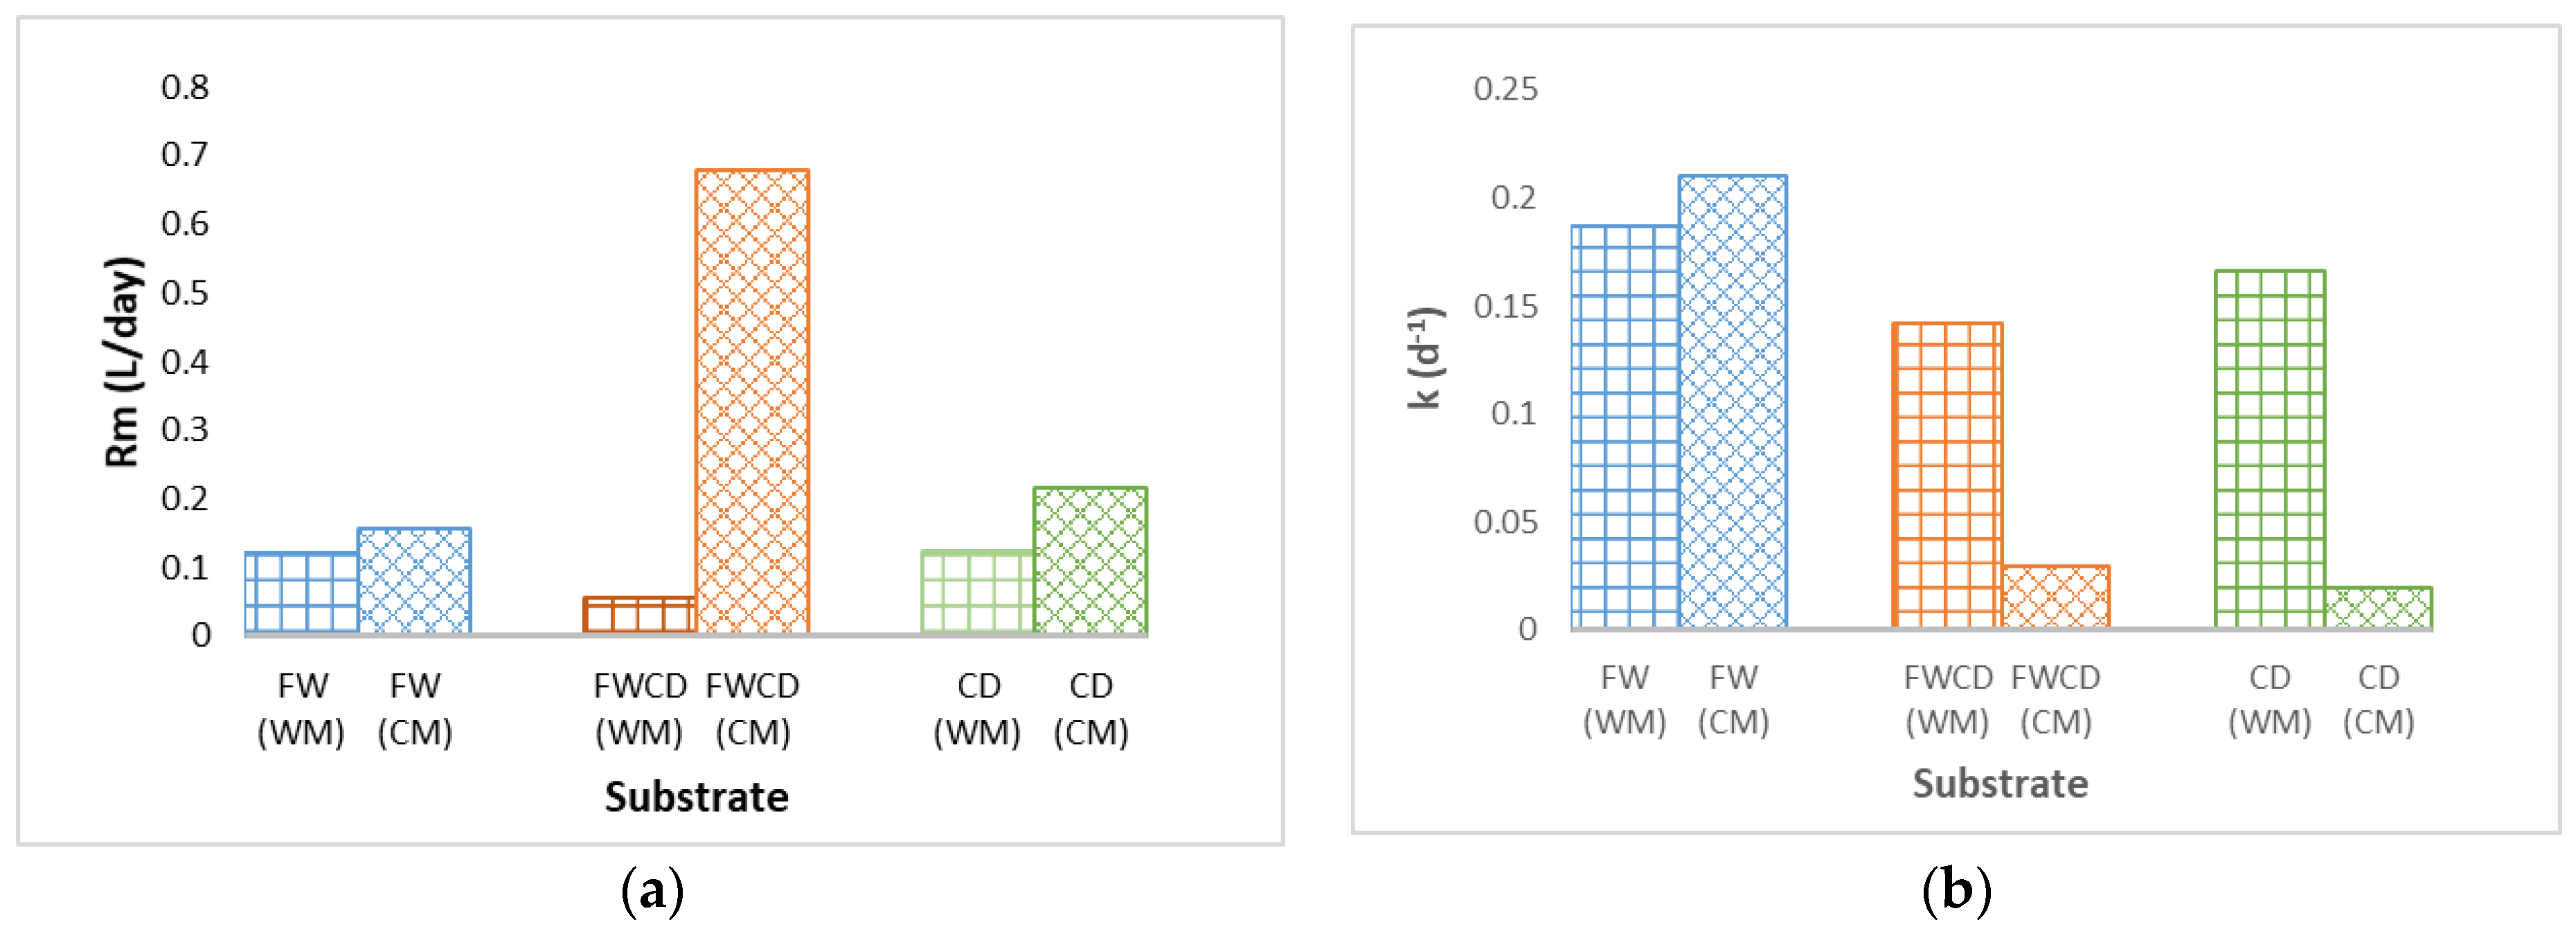
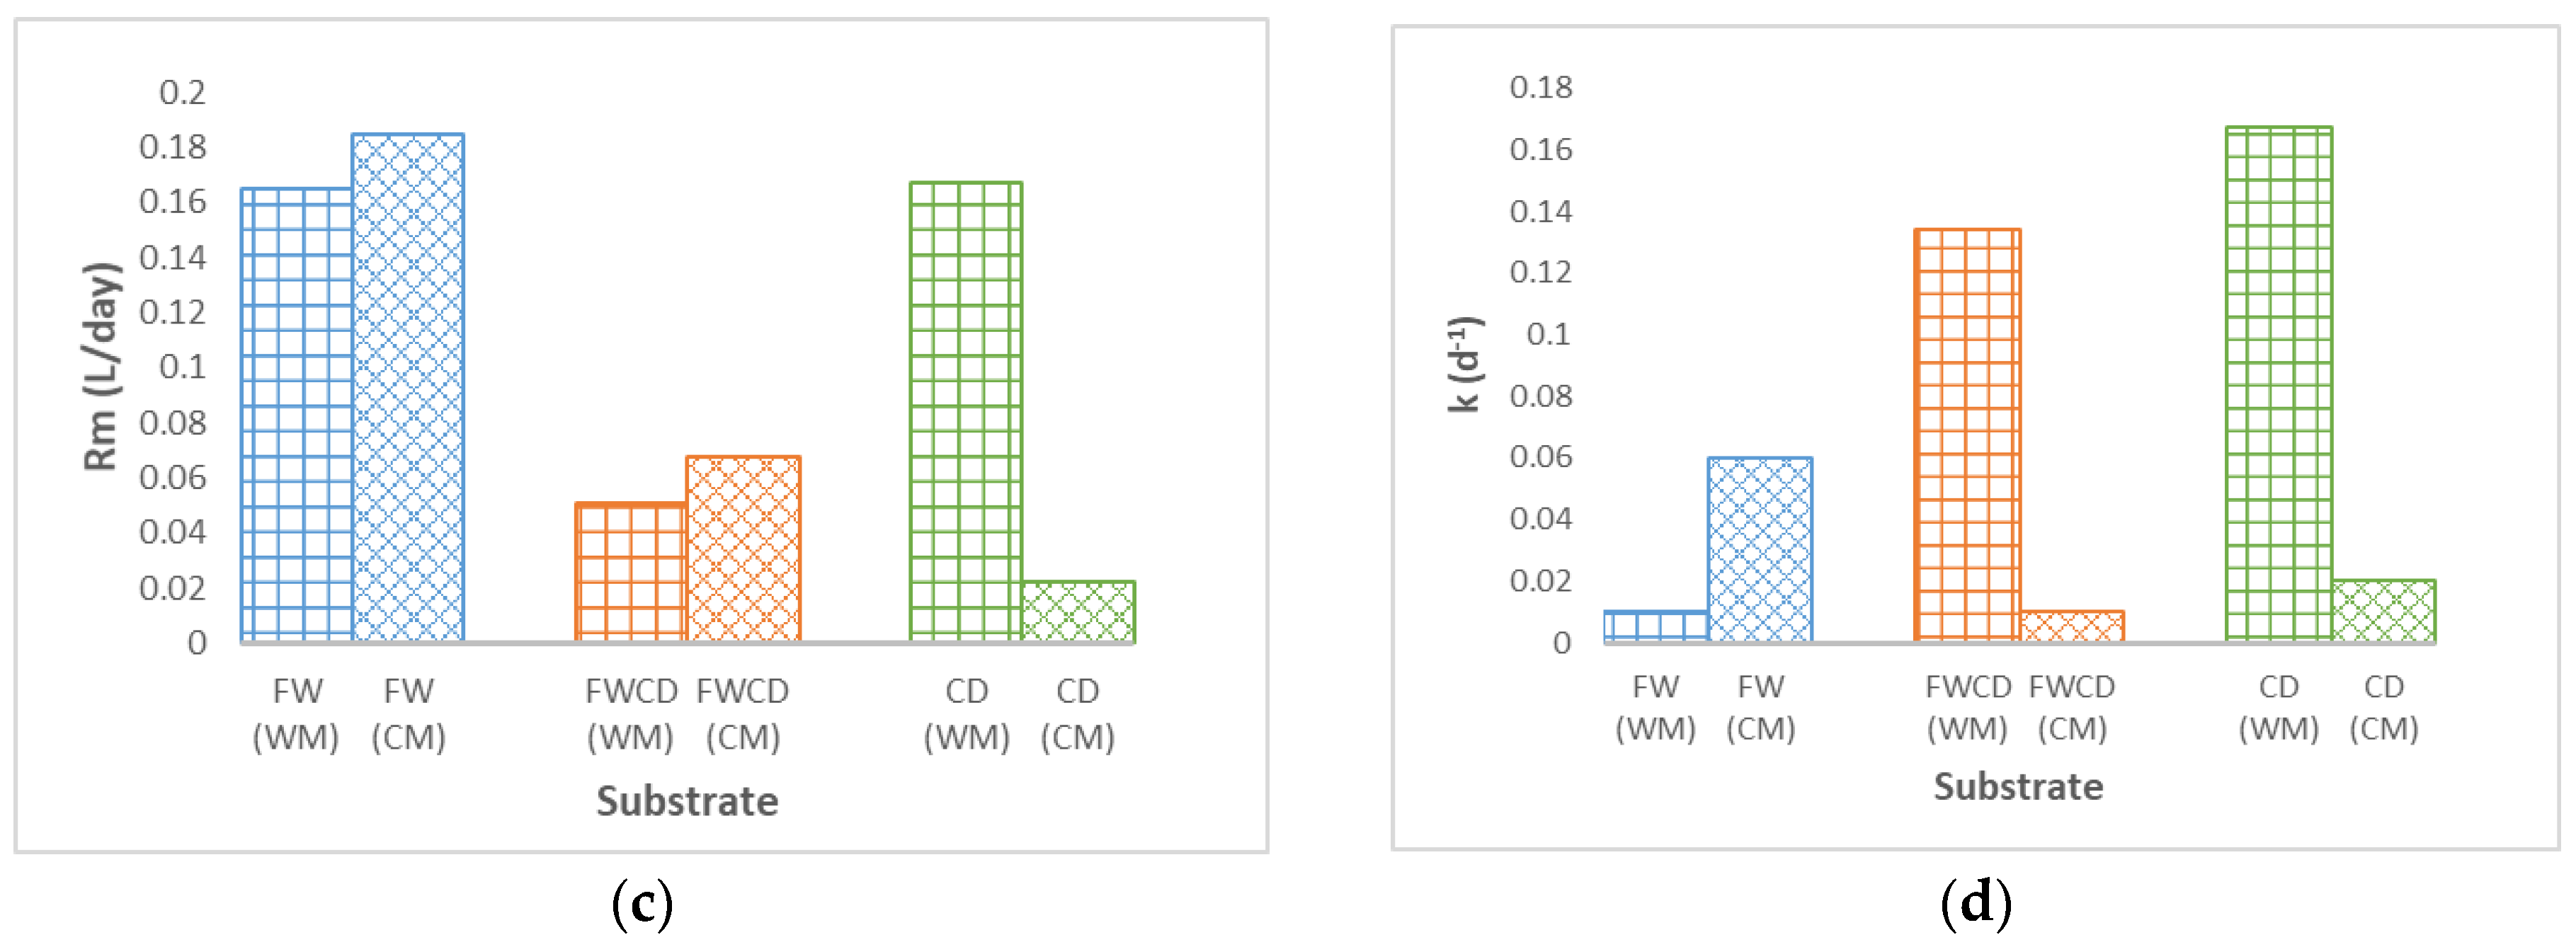
3.3. Effect of Mixing on Kinetic Parameters

In this study, there was average increment of 1.47% for FW, 2.06% for CD, and 1.09% for FWCD in terms of biogas production in the BMP test with a CM system, as presented in earlier section. Therefore, in this section, the effects of continuous mixing on kinetic parameters are discussed. Evaluation on the effects of operational condition, WM and CM, revealed that only the modified Gompertz model showed a good trend and a substantial effect on the system for both BMP WM and BMP CM, for all kinetic models applied. For single-substrate FW, CD, and codigestion FWCD, CM had a significant effect on the Rm value, which was found to be higher than WM, as demonstrated in Figure 4a. These findings were also observed by other researchers during mixing periods: gas emission from the liquid digestate in continuously mixed digesters can increase by up to 70% [57,58,59].
In this research, it was reported in the logistic model (Figure 4c), FW and FWCD exhibited an increment in the Rm value, as demonstrated in the modified Gompertz model. Nonetheless, in the BMP of single-substrate CD, a different trend was observed; Rm (0.145 L/d) was greater in WM as compared to CM. Likewise, the k value in Figure 4b, first-order model, single-substrate digestion FW showed similar trend to that observed in the modified Gompertz model. In contrast, for single-substrate digestion CD and co-digestion FWCD, an opposite pattern was observed, with the k value higher in the WM system. The k value reported for the WM and CM systems for CD was 0.02 and 0.166, respectively; whereas the k value observed in the codigestion system was 0.03 and 0.142 for the WM and CM systems, respectively. The Monod model (Figure 4d) demonstrated a similar trend to the first-order model for CD and FWCD, with a lower k value when mixing was applied. Meanwhile, for FW, the k value for the batch without mixing and the batch with continuous mixing showed no significant difference.
Interestingly, modified Gompertz was the only model that displayed a consistent trend in the operational systems, WM and CM. Additionally, for single-substrate digestion FW and codigestion FWCD, the logistic model and the modified Gompertz model demonstrated a similar trend. However, in the first-order and Monod models, they reflected an opposite trend. When unmixed samples performed better than mixed samples, it was usually attributed to natural mixing during low OLR, thus mixing had relatively little effect [40].

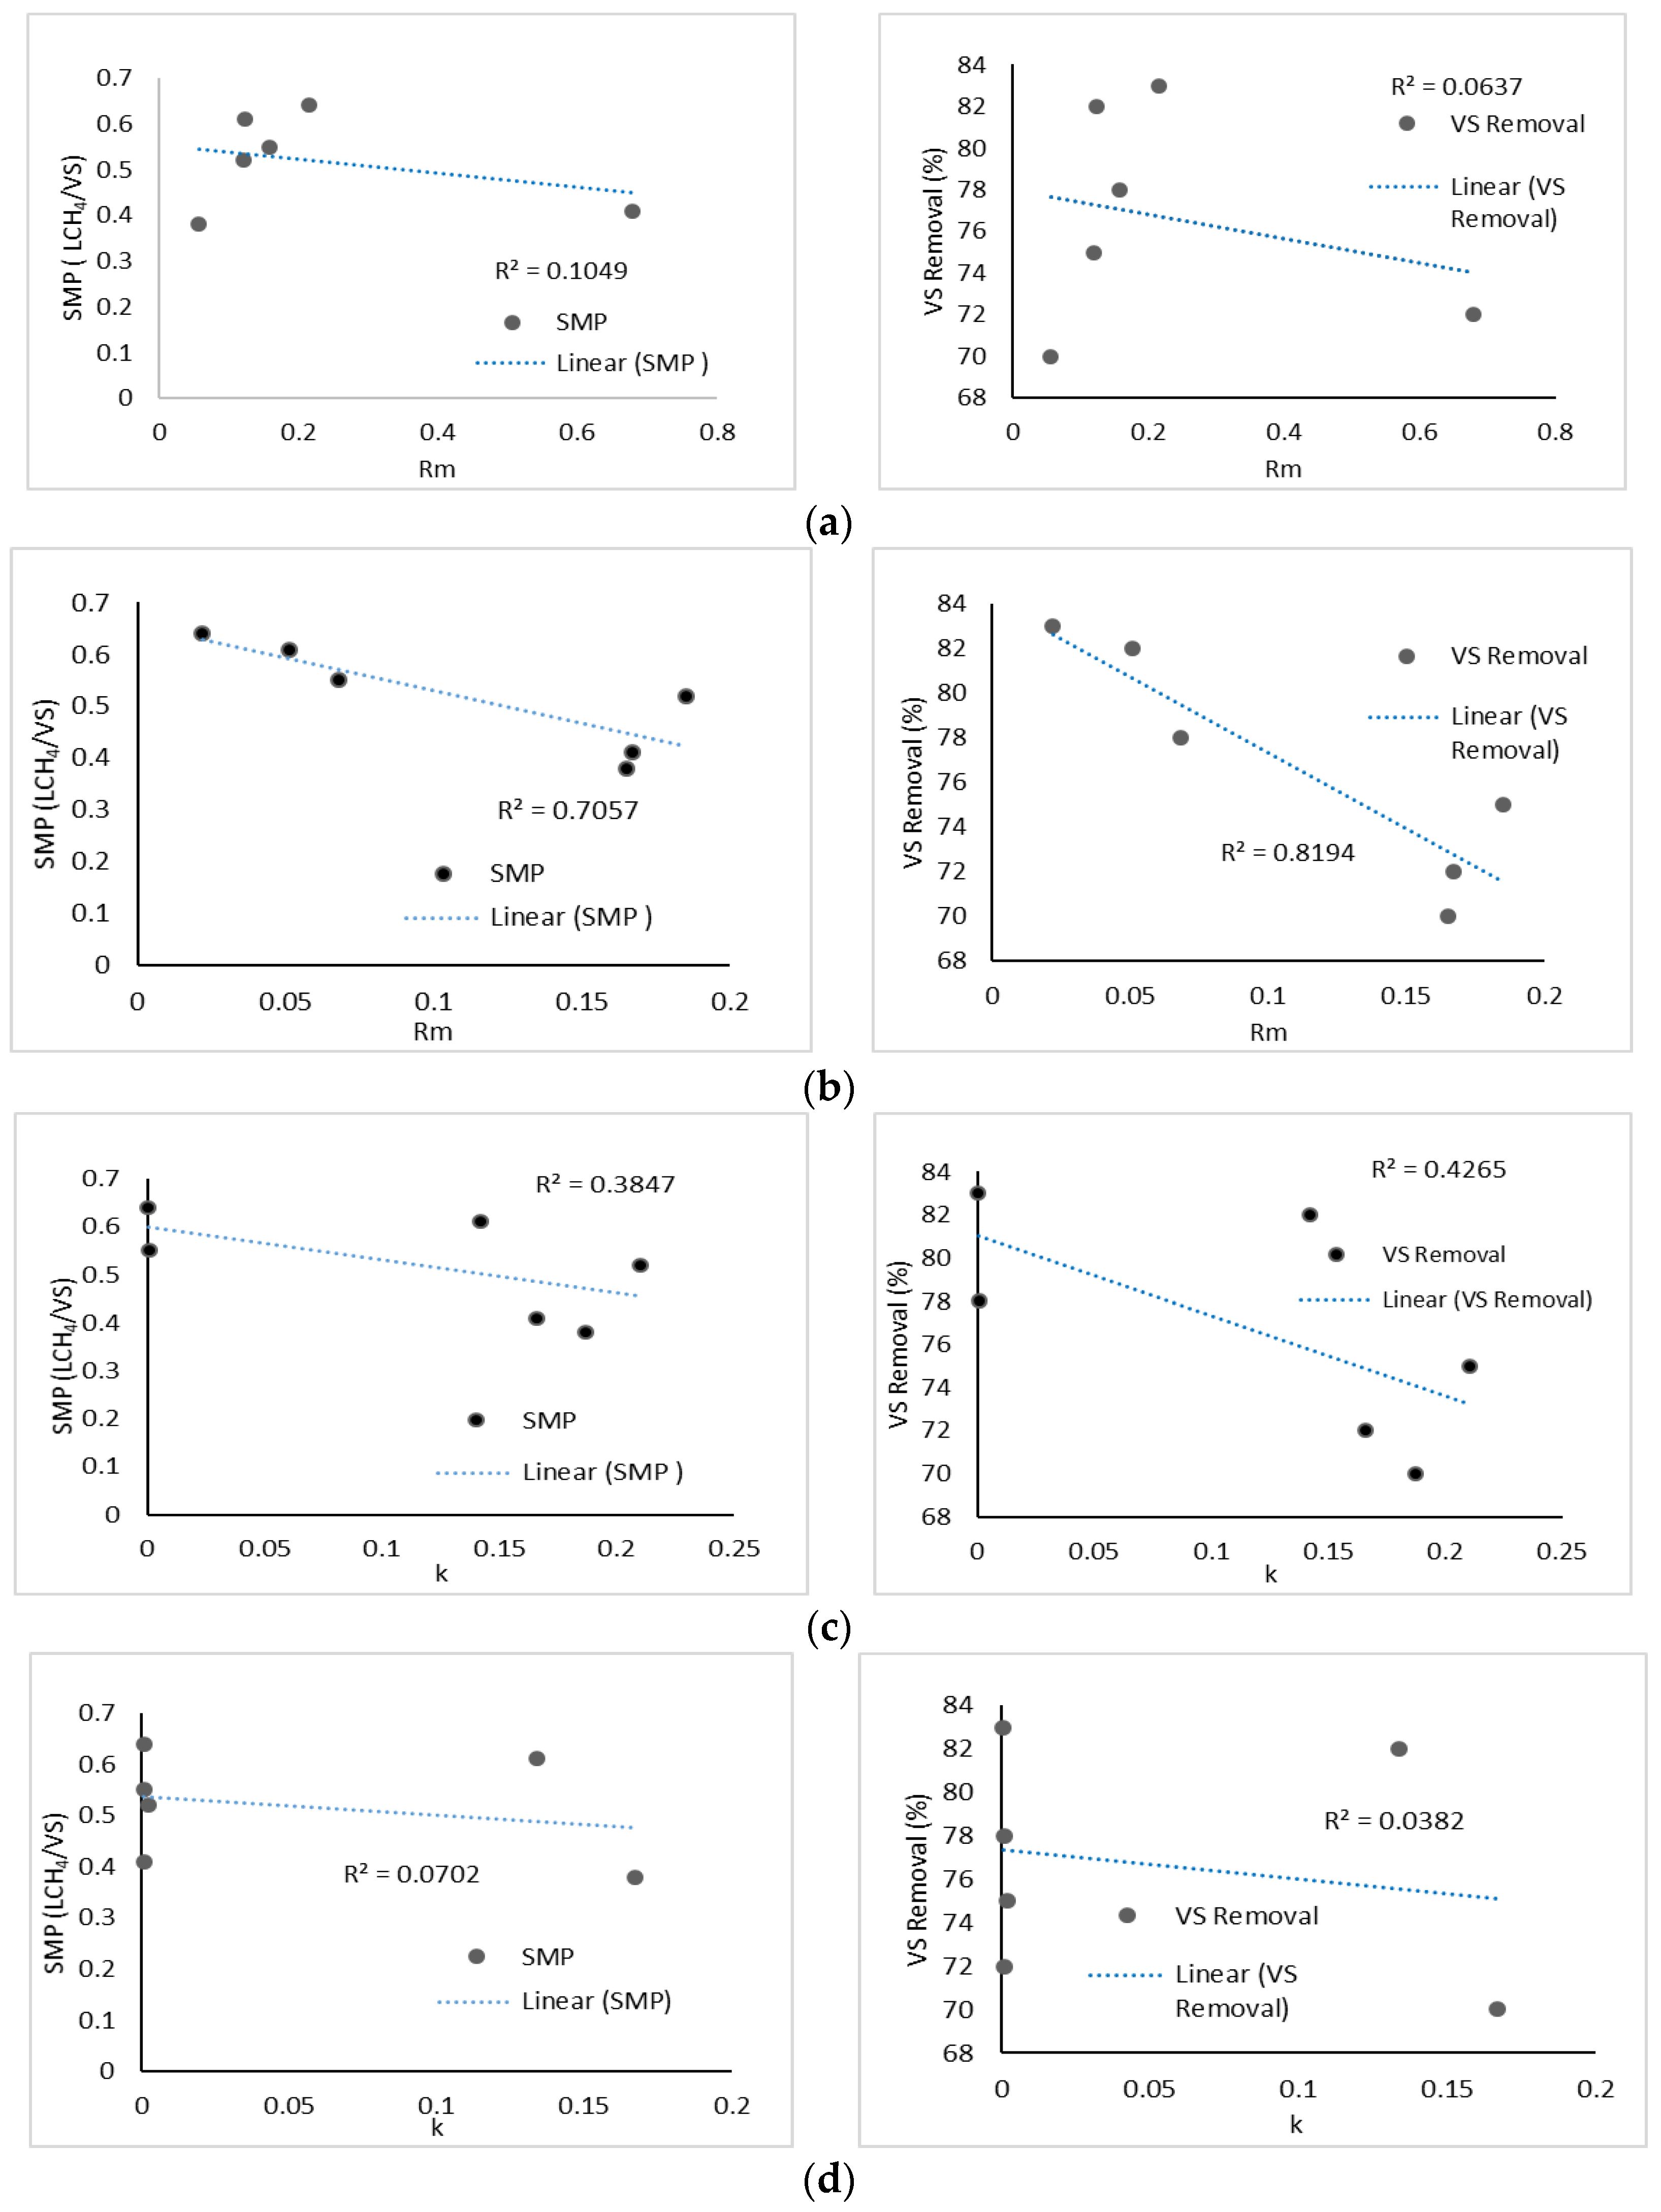
3.4. Effect of Kinetic Parameters on Process Performances

In this section, SMP and VS% were selected as the indicators of digester performance. Overall, Figure 5a–d show that kinetic parameters of all models were negatively correlated with VS% and SMP. The three models, modified Gompertz, first order, and Monod, demonstrated a weak correlation with digester performance. It was observed that only the logistic model demonstrated a significant relation between kinetic parameters and digester performance, as shown in Figure 5b. For SMP vs. Rm, it showed a moderate negative correlation, as the R2 obtained was 0.7057. Meanwhile, a strong negative correlation (R2 = 0.8194) was found between VS% and Rm. A negative correlation indicated that as SMP and VS% increased, the Rm value decreased. This finding matched well with the results reported by Li et al. [37]. There was a strong indication here that an efficient digestion system was one that had a lower reaction rate [20]. For the logistic model, single-substrate digestion FW and codigestion system FWCD developed good performance, and thus demonstrated a lower Rm value. Additionally, due to the stability of the digester (codigestion FWCD), the kinetic parameter Rm could be easily correlated with the SMP as well as VS% values. Overall, there was no correlation derived from the three other models, except for the logistic model, which showed a negative correlation between the estimated parameters and digester performance. This could be due to the basis of the logistic model’s development, which reflects the microbial growth rate, and methane production is assumed to be proportional to its maximum rate [20]. Digestion kinetic data can also be used to create correlations between process efficiency and kinetic characteristics, as well as to reveal the kinetic mechanisms that cause process instability [38]. Therefore, the values of Rm and k revealed by the logistic model can be used as a precursor for a good performance digester, and can optimise the operating conditions in large-scale digester and predict the biogas production efficiently.

3.5. Continuous Study of FW, CD, and Codigestion of FWCD at Increasing OLRs

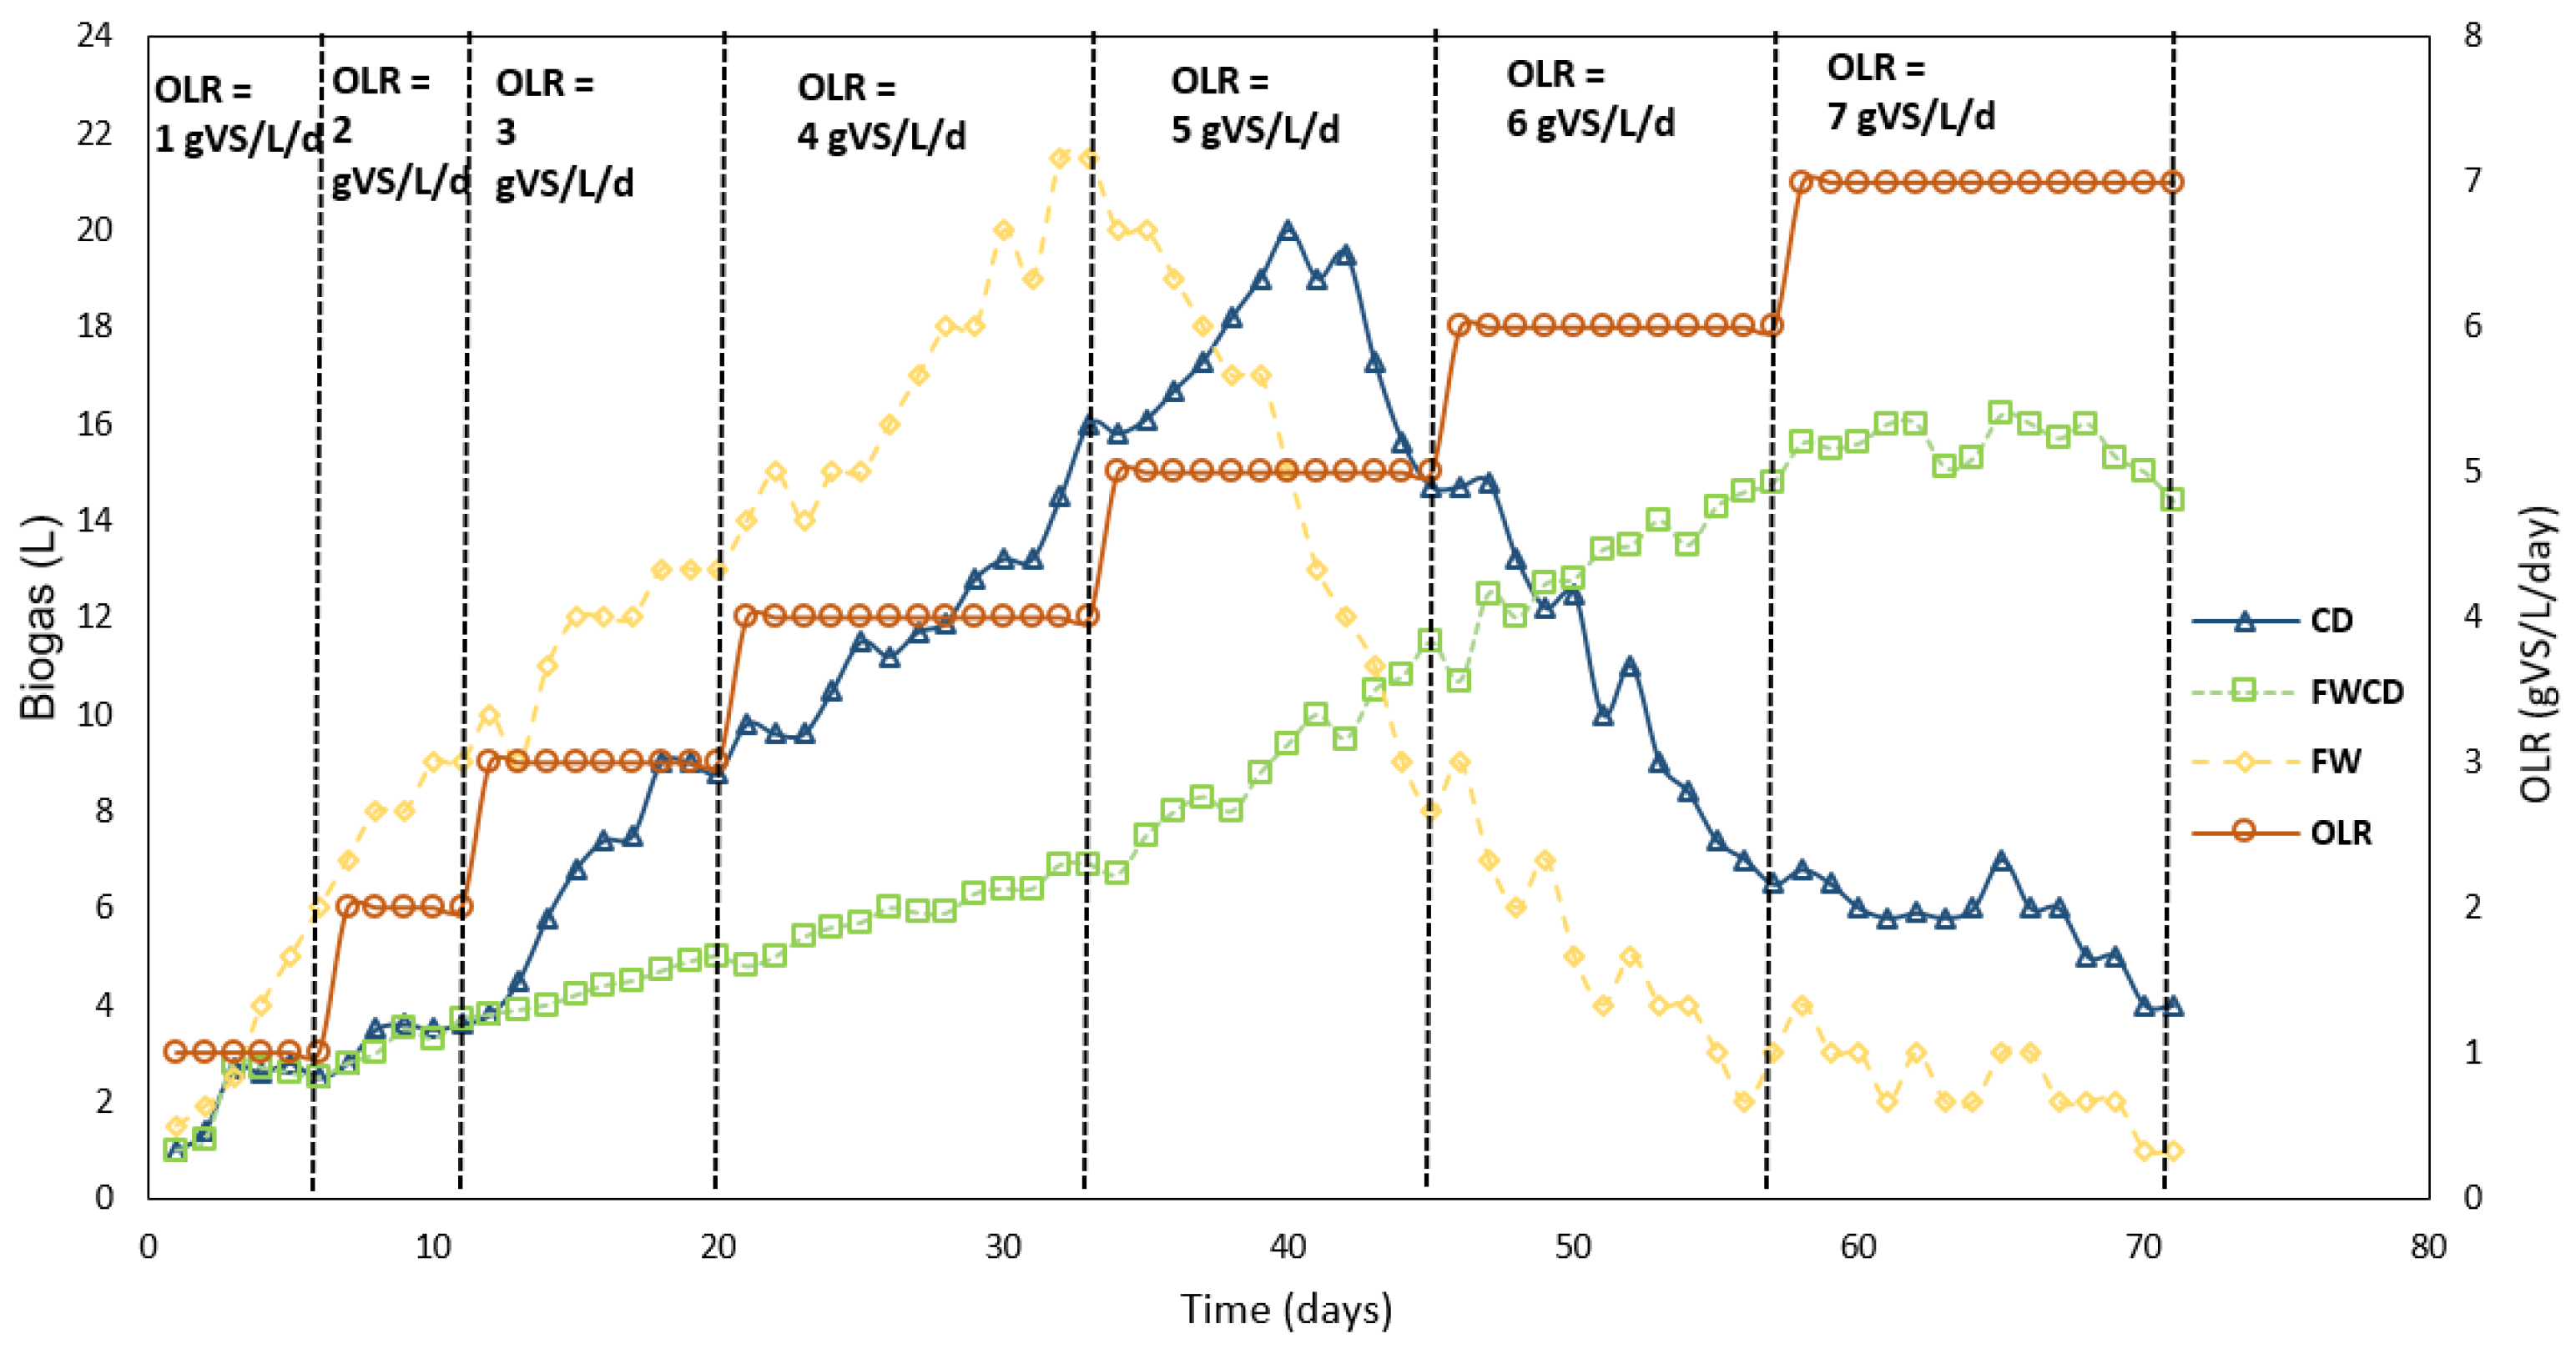
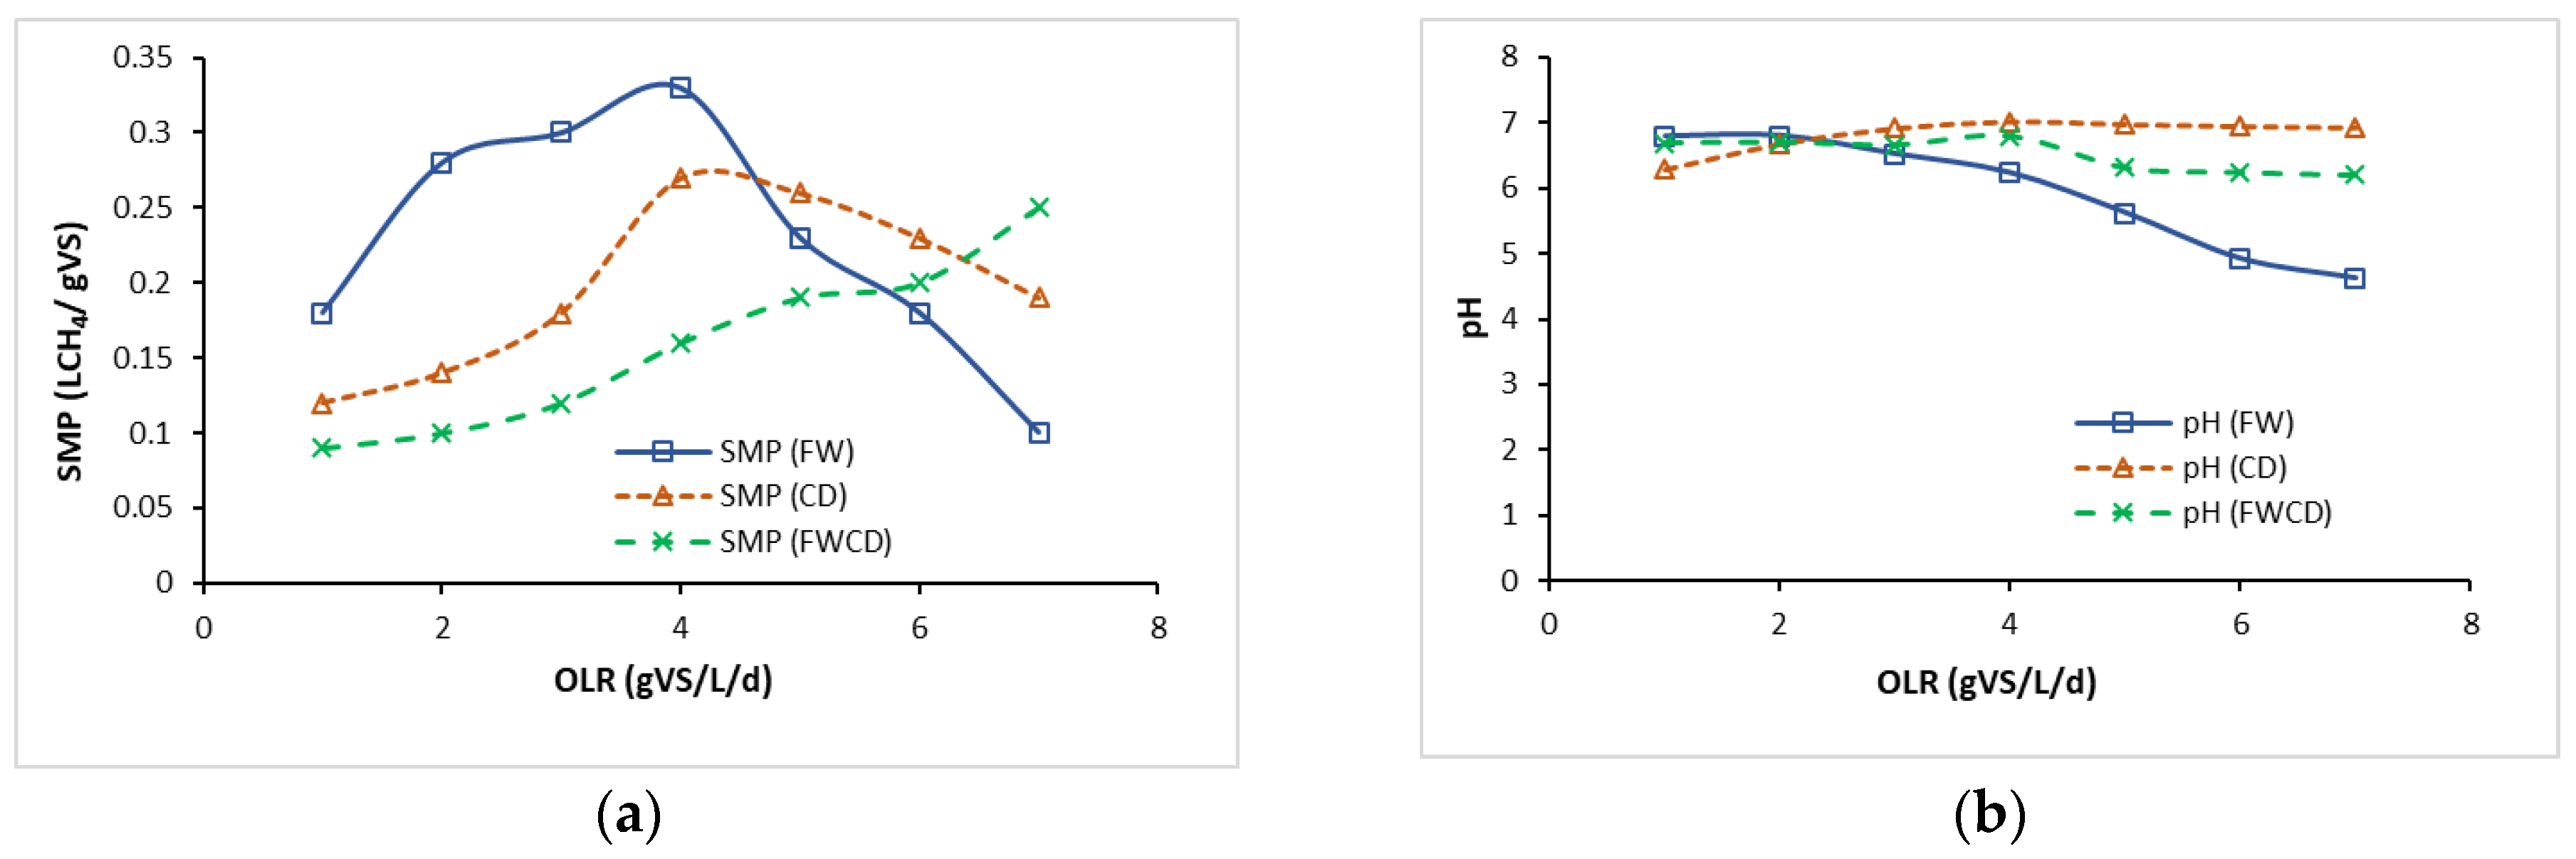
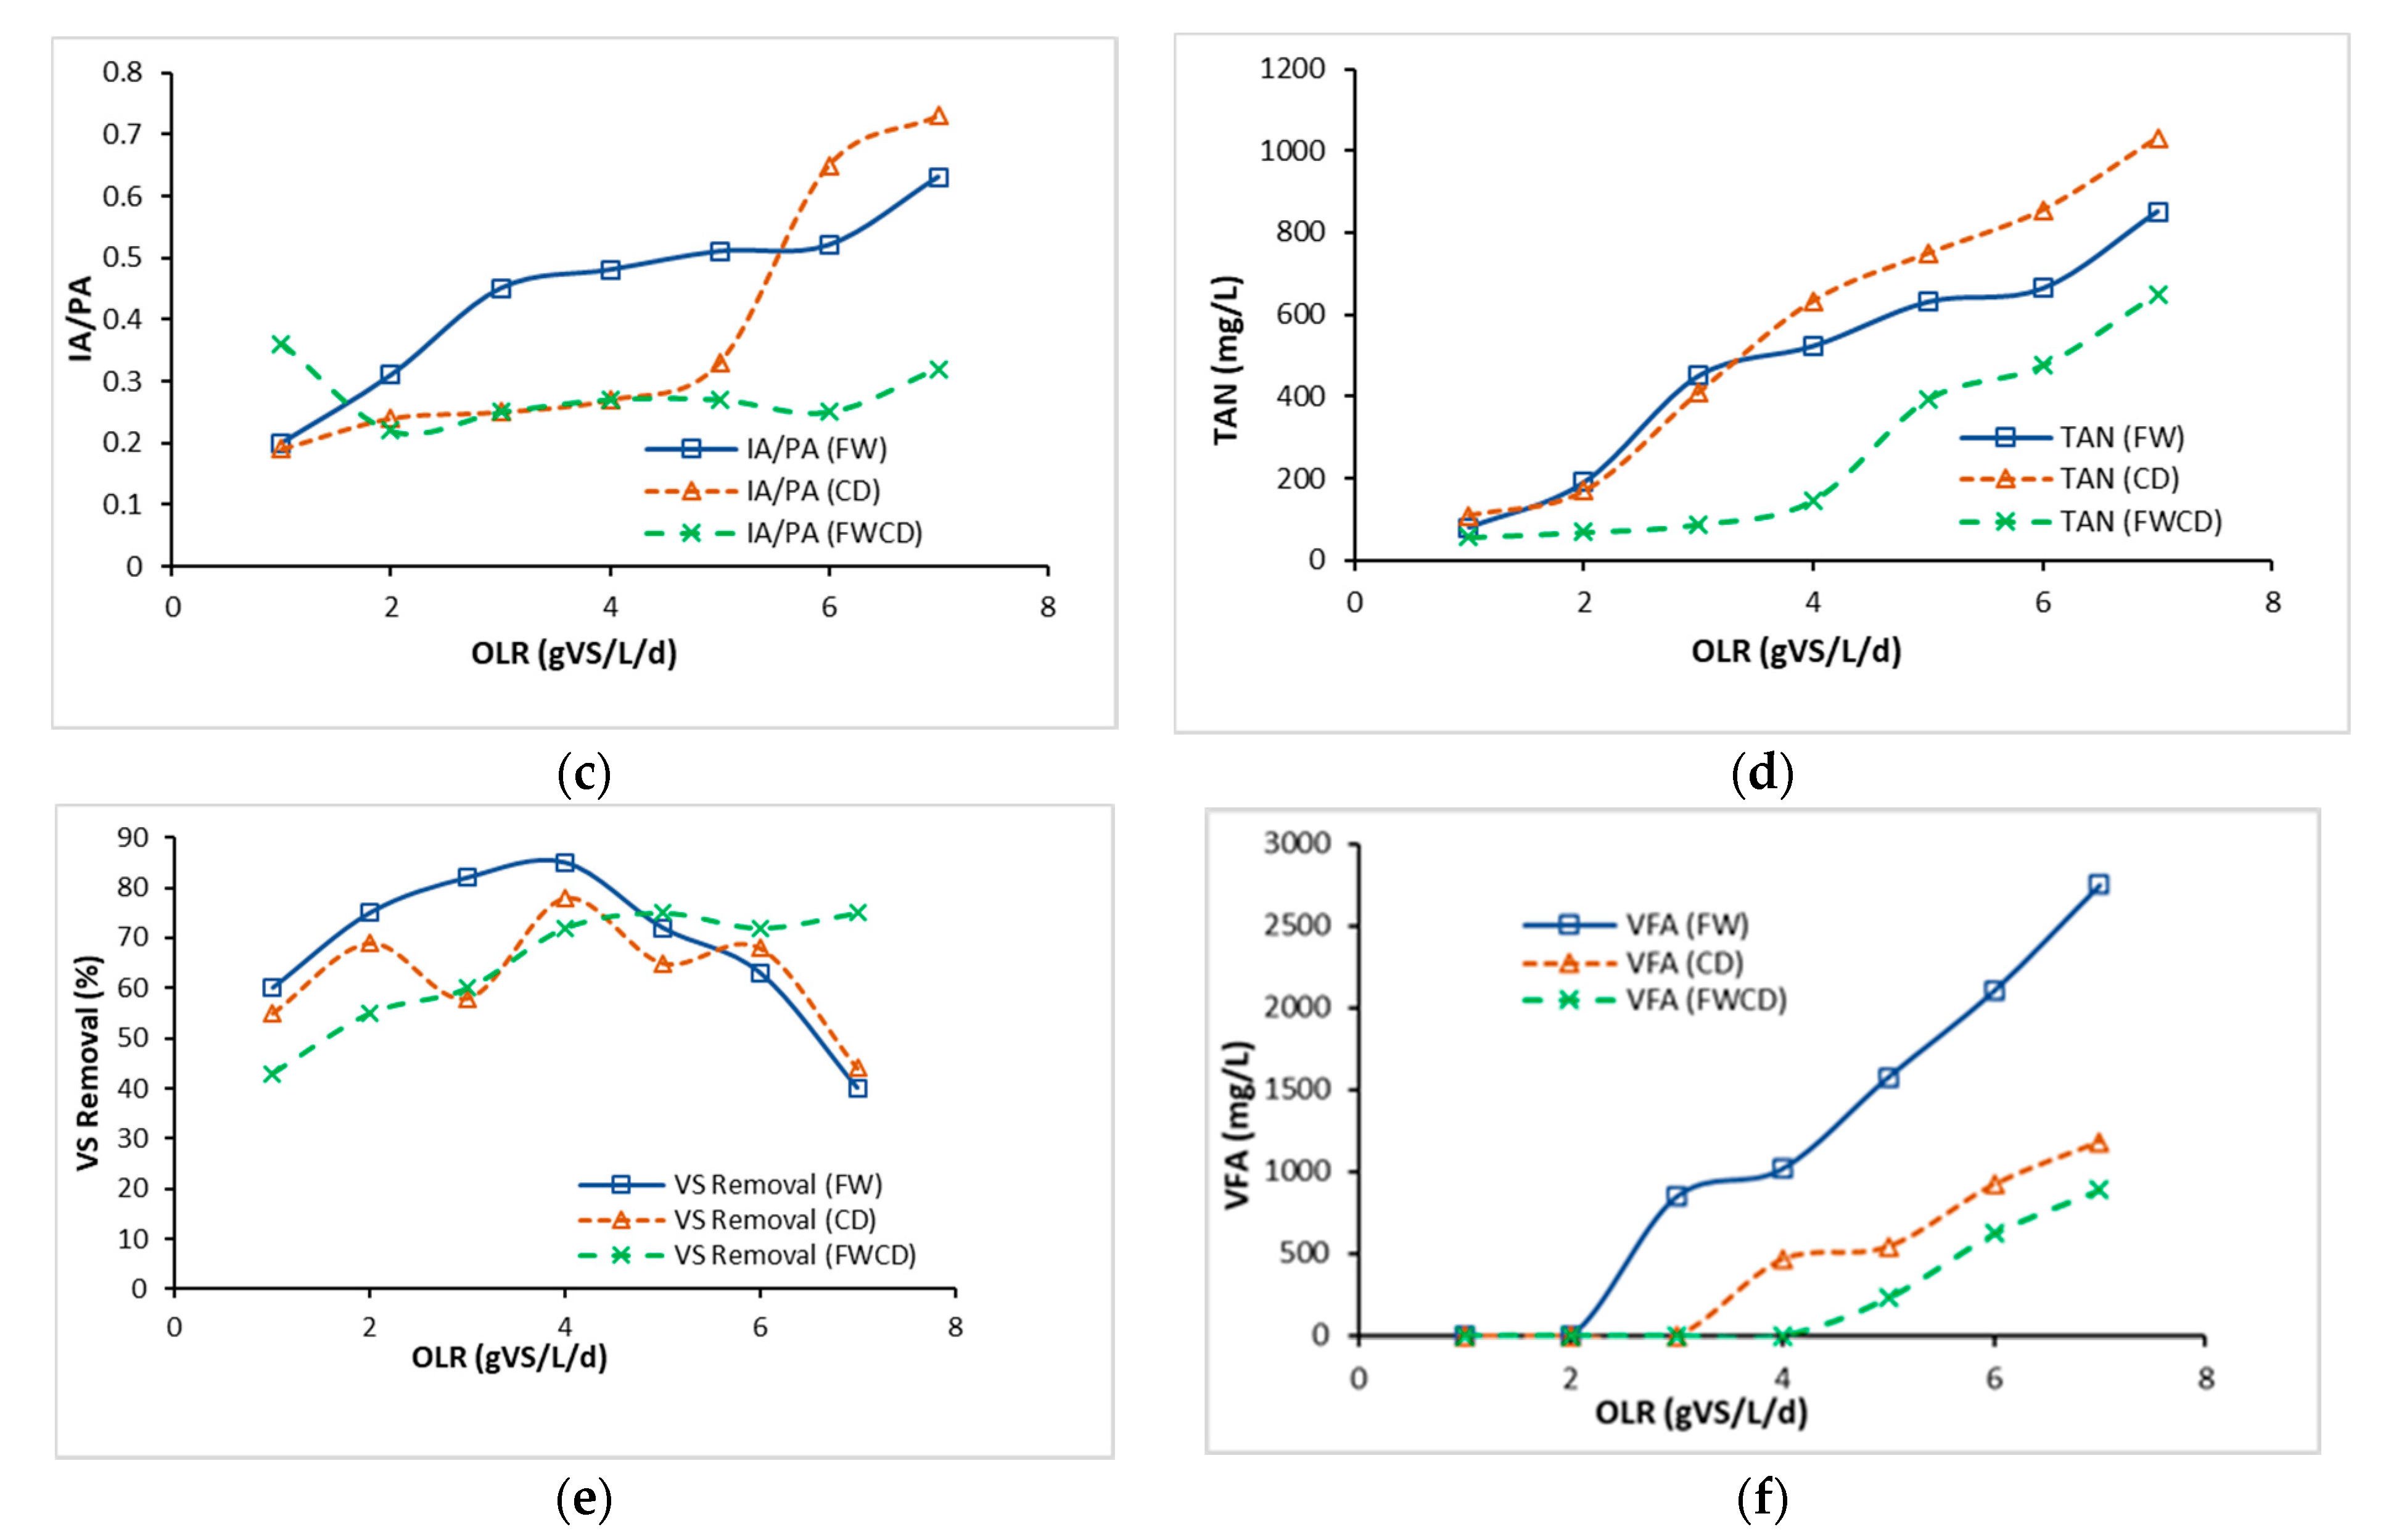
3.5.1. Biogas Production at Different OLRs

The process performance of continuous study using CSTR for biogas production is illustrated in Figure 6. The three reactors continuously operated for 71 days with monodigestion of FW, CD, and codigestion of FWCD at different OLRs. In CSTR 1 (FW), biogas output continued to rise up to 21.5 L as OLR increased at 4 gVS/L/d. Deepanraj et al. [55] revealed FW had high potential for biodegradability, and contained a balanced nutrient for anaerobic microorganisms. Nevertheless, the performance of CSTR (FW) drastically dropped when the OLR increased to 5 gVS/L/d, indicative of inhibition in AD in the system. This resulted from acetogenesis becoming the limiting step in monodigestion of FW. The findings of this study were also similar to those of Zhang et al. [22], who reported that a digester treating FW was unstable at OLR 4gVS/L/d.
Likewise, the increment of OLR of 5 gVS/L/d to CSTR 2 (CD) further deteriorated the digester performance. Biogas production gradually increased with OLR before plummeting after peak biogas of 20 L in an operational period of 44 days. Monodigestion of CD resulted in the production of a high amount of free ammonia and ammonium ions that inhibited the AD system, since it had a significantly high amount of nitrogen compounds, which were uric acid and undigested proteins [14,15,23]. Inhibition in FW and the CD sample could have been due to an insufficient C/N ratio and the FW having high acidity [60]. The optimal C/N ratio for anaerobic degradation of organic waste is between 20 and 35 [61]. Conversely, it can be seen that C/N ratio of FW and CD did not fall in the optimum range, which were reported (Section 2.1) to be 60 (FW) and 8 (CD). Furthermore, FW contains lipids; therefore, during the digestion of lipids in FW, long-chain fatty acids (LCFAs) are produced [62]. The presence of LCFAs caused inhibition in the AD system and obstructed the production of biogas [63].
Whereas, in CSTR 3 (FWCD), the trend of the biogas production rate gradually increased until OLR 7gVS/L/d for codigestion of FW and CD. The codigestion system proved to be resistive to shock load and was efficient, under the same conditions of loading with CSTR1 (FW) and CSTR 2 (CD). The results indicated the biogas yield increased with the OLRs within the appropriate range [64]. Additionally, the C/N ratio for the codigesting system was 21, which was within the recommended range for an optimal AD system. Animal manure is one of the most suitable cosubstrates due to its high nitrogen content, higher buffering capacity, and contained higher macro/micronutrients required by methanogens [22]. In contrast, biogas production in a codigestion system at optimum conditions was recorded at 20–22% lower as compared to single digestion. Selection of the ratio plays in important role in producing the synergistic effect in a codigestion system [65]. Lower biogas production might contribute to a lower ratio of CD as compared to FW at 1:2.33, which affected the synergistic effect for higher biogas production. Nevertheless, a selected ratio proven to develop a more robust system without any sign of inhibition up to OLR 7 gVS/L/d will thus allow more FW and CD to be treated.
Hence, this study revealed the optimum OLR for CSTR1 (FW) as 4 gVS/L/d, CSTR 2 (CD) as 5 gVS/L/d, and CSTR 3 (FWCD) as 7 gVS/L/d. These findings were supported by Mao et al. [66], who found that the optimum OLR for FWCD was 7 gVS/L/d. Meanwhile, Chuenchart et al. [21] stated that the optimum OLR for monodigestion of FW was 3 gVS/L/d, which was lower than in this study. For a single substrate of CD, Bi et al. [67] observed that CD gave an acceptable methane yield when the OLR was below 3 gVS/L/d, and increasing it further made the AD of CD more difficult. In contrast, the optimum OLR achieved in this study for single-substrate CD was almost 5 gVS/L/d, which was slightly higher compared to similar study.

3.5.2. Summary of the Performance for Semicontinuous System

Figure 7 illustrates the findings for semicontinuous systems with continuous mixing at increasing OLR from 1 gVS/L/d to 7 gVS/L/d. As observed in Figure 7a, CSTR 1 (FW) achieved the highest SMP at OLR 4 gVS/L/d, equivalent to 0.33 LCH4/gVS. However, as the OLR began to rise (5 gVS/L/d), the SMP value dramatically declined to the lowest SMP of 0.10 LCH4/gVS when the OLR increased to 7 gVS/L/d, indicative of inhibition in the AD system. A similar trend was observed in SMP, as reported in CSTR 2 (CD); an optimum OLR was recorded at 5 gVS/L/d, equivalent to 0.26 LCH4/gVS. The SMP as demonstrated in CSTR 2 (CD) was slightly above 0.22 LCH4/gVS from OLR 6 to 7 gVS/L/d, while SMPs of CSTR 1(FW) were below 0.19 LCH4/gVS. At OLR 5 and 5.5 gVS/L/d, CSTR 1 (FW) and CSTR 2 (CD) began to inhibit, which could be attributed to an inhibition of methanogens, where the system was shocked due to changes in the OLR that affected the methanogenic activities [68,69,70]. This meant that the OLR was increased too suddenly from 5 gVS/L/d to 6 gVS/L/d, and it caused overfeeding of the microorganisms in the reactor, causing the reaction to be slower. On the other hand, increasing OLR to 7 gVS/L/d showed a gradual increment in the SMPs produced by CSTR 3 (FWCD) to the maximum of 0.25 LCH4/gVS. This study revealed that changing feed regimes could stabilise bioreactor performance and improve SMP, which was through codigestion of the substrate.
The optimal pH for the AD system was reported to be within the pH range of 6.5 to 7.5 [64]. Figure 7b illustrates that the pH of FW fell dramatically after the optimum OLR. The lowest pH of 4.62 was recorded at 7 gVS/L/d. This was due to the fact that FW as a substrate potentially acidified the AD system. Comparing between pH in CSTR 1 (FW) and CSTR 3 (FWCD), both digesters recorded a lowering in the pH value due to FW being the dominant substrate. However, the pH value in CSTR 3 (FWCD) was maintained >6.2. Moreover, this circumstance could be due to LCFAs accumulating in the solid biomass with a low pH. In the AD process, the working range for microorganisms was reported to be between 6.5 and 7.5 [48]. Fermentative bacteria thrived around pH 4 to 8.5, while methanogenic bacteria performed well around 6.5 and 7, as suggested by Morales-Polo et al. [71],
The IA/PA ratio is a measure of alkalinity and which indicates the system’s ability to buffer acids and neutralise them. Tangkathitipong et al. [72] described the that IA/PA ratio of an AD system should be maintained within a range of 0.1 to 0.3. If this ratio exceeds 0.4, the system is in transition to an unstable state. The substrates used are classified by high protein and lipid content, thus maintaining the digester’s stability is the most crucial challenge. In this study (Figure 7c), the IA/PA ratio for CSTR 1 (FW) and CSTR 2 (CD) ranged from 0.2 to 0.63 and 0.19 to 0.73, respectively. In the final OLR for CSTR 1 (FW) and CSTR 2 (CD), the IA/PA ratios recorded were 0.63 and 0.73, respectively. This signified abnormal function of the system. Nonetheless, the IA/PA ratio for CSTR 3 (FWCD), was <0.33 until the highest OLR 7 gVS/L/d. The ratio showed a stable digester with sufficient alkalinity, and that was substantially below the inhibitory level.
TAN is another important indicator in AD of FW and CD; Zhang et al. [22] reported that a high C/N ratio was strongly correlated with nitrogen deficiency, and a low C/N ratio could lead to TAN inhibition. A low C/N ratio (8) in CSTR 2 (CD) as compared to CSTR 1 (FW) and CSTR 2 (FWCD) thus resulted in the highest TAN level at final OLR (1032 mg/L), which can be seen in Figure 7d. This result matched well with the reported literature. In contrast, CSTR 3 (FWCD) showed the lowest TAN, <700 mg/L, which was slightly lower than CSTR 1 (FW). Previous studies revealed the inhibitory thresholds at TAN concentrations of 1500–2500 mg/L [73,74]. TAN for FW in this study was found to be within the optimal range for an AD system. As reported earlier, the C/N ratio for FW was 60. Hence, it was likely that the improvement in CSTR 3 (FWCD) was due to introduction of an extra nitrogen source from CD. TAN is usually produced in the reaction of protein hydrolysis. Consequently, there was no significant differences in the three CSTRs, because all reactors depicted that protein hydrolysis was occurring, therefore indicating that microorganisms (acetogens and methanogens) were growing [75]. CSTR 3 (FWCD) demonstrated stable and higher degradation of the substrate, indicating that the codigestion system was more efficient than a single-substrate system at converting organic matter. The VS% at OLR 7 g/VSL/d was more than 70% for CSTR 3 (FWCD), as shown in Figure 7e. Conversely, in CSTR 1(FW) and CSTR 2 (CD), the increment in VS% was maintained up to the optimum OLR, then drastically declined to <45% removal, indicating abnormal function of the AD system.
Based on Figure 7f, the rise in total VFA in CSTR 1 (FW) when the OLR was further increased to 3, 4, 5, 6, and 7 g/VSL/d could have been due to the accumulation of VFA and a drop in pH, which caused the system to despair. Furthermore, the investigation by Zhang et al. [22] revealed that an increase in OLR of FW could cause pressure in the digester, which usually showed a drop in pH and VFAs accumulation. Conversely, it was observed that after increasing OLR in CSTR 3 (FWCD), total VFAs were still relatively less than 1000 mg/L. This result suggested some substances were limiting in FW, and this limitation was corrected by codigestion with CD.

3.6. Energy Generation by Laboratory-Scale (LS) and On-Farm-Scale (OFS) Anaerobic Reactors

In this study, energy generation for LS and OFS were evaluated to identify the potential of electrical energy yield. The energy generation both in LS and OFS was determined and projected based on SMP achieved in LS at optimum conditions, as described in [75]; 4, 5, and 7 gVS/L/d were the optimum OLRs for CSTR fed on a single substrate of FW, CD, and codigestion of FWCD, respectively. Table 5 shows the SMP obtained at the optimum OLR for CSTR fed on FW, CD, and FWCD was 0.33, 0.26, and 0.25 LCH4/gVS. At optimum OLR, the wet weight for the LS bioreactor used was 0.06 kg (FW), 0.12 kg (CD), and 0.14 kg (FWCD). The working volume for LS in this study was 0.005 m3, Considering a proposed design of an OFS bioreactor yielding a total volume of 30 m3. Using the same ratio of substrate to working volume, the projected volume of substrate for OFS was 360 kg (FW) and 720 kg (CD); and for the codigestion OFS bioreactor, the volume of FW and CD required was 588 kg and 252 kg, respectively. Energy generation from LS and OFS are also presented in Table 5. The results indicated that the application of codigestion significantly improved energy generation, producing about 518 kWh, which was 28% and 26% higher than energy generated in bioreactors using a single substrate of FW and CD. Furthermore, we achieved the optimum OLR at higher loading, allowing a higher volume of FW and CD to be treated as compared to a monodigestion system.
In a large system, Wresta et al. [76] suggested only 2 kWh of a total of 6 kWh generated can be converted into electricity, due to treatment deficiency and energy losses during the conversion process. This indicated that only 33% of the electrical energy can be utilised as electricity. Therefore, the energy yield for OFS for a single substrate of FW, CD, and codigestion of FWCD was 122.96 kWh, 126.10 kWh, and 171.13 kWh, respectively. Krista et al. [1] reported FW produced was 0.279 kg/person/d. Furthermore, based on the volume of FW required to run a bioreactor in optimum conditions, FW generated by 1300 persons can be treated in a monodigestion system. On the other hand, for a codgestion OFS system, FW generated by 2130 people can be treated daily. These findings revealed a clear advantage in the application of codigestion with CD from the aspect of electrical energy generated, and that FW can be treated in a stable and robust digestion system.

4. Conclusions

The performance of the single substrate digestion of FW, CD, and a codigestion FWCD in terms of biogas production from a batch study; kinetic evaluation of operating conditions and digester performance; as well as potential electrical energy from a continuous system, were studied. The best-fit model for biogas prediction was demonstrated by the modified Gompertz for substrate FW WM, FW CM, and codigestion of FWCD CM. However, the logistic model was well fitted to single substrate digestion of CD in both operational conditions. The first-order model performed well in codigestion of FWCD WM. However, among all the models evaluated, the modified Gompertz was the model that showed a consistent trend and indicated a significant effect on the operating condition of the systems, with a higher Rm value for CM compared to WM. The correlation of kinetic parameters with bioreactor performance revealed that only the logistic model developed a moderate and strong correlation. These correlations produced an R2 of 0.7057 and 0.8194 for SMP and VS%, respectively. The projected electrical energy in OFS for single-substrate digestion of FW, CD, and codigestion of FWCD were 122.96 kWh/d, 126.10 kWh/d, and 171.13 kWh/d, respectively. The findings from this study could be used to improve large-scale digester designs under two different operational conditions, thereby optimizing biogas production and digester performance, and thus benefitting techno-economic feasibility for the overall AD system.

Author Contributions

Conceptualisation, K.J., N.A. and A.M.A.W.; methodology, S.I. and M.A.M.; validation, M.A.M. and A.Z.; formal analysis, K.J., N.A. and T.N.T.M.M.; investigation, R.H., A.Z., L.Y. and A.M.A.W.; resources, A.M.A.W. and T.N.T.M.M.; data curation, M.A.M., L.Y. and S.S.; writing—original draft preparation, K.J. and N.A.; writing—review and editing, S.I., S.S. and R.H.; visualisation, A.Z., L.Y. and T.N.T.M.M.; supervision, S.I., R.H. and S.S. All authors have read and agreed to the published version of the manuscript.

Funding

This research was financially supported by TNB Research Sdn. Bhd. (TNBR/Biogas/2019/UPM/6380035). Additionally, the Research Management Centre, UPM funded the preparation, writing, and publication of this article.

Institutional Review Board Statement

Not applicable.

Informed Consent Statement

Not applicable.

Data Availability Statement

Not applicable.

Acknowledgments

The authors acknowledge the support received from TNB Research Sdn. Bhd. and Universiti Putra Malaysia. Additionally, the authors would like to express their gratitude to assistant engineers in the Department of Civil Engineering and the Department of Chemical and Environmental Engineering, Faculty of Engineering, Universiti Putra Malaysia, for the success of this study.

Conflicts of Interest

The authors declare no conflict of interest.

References

  1. Krista, L.T.; David, J.T.; Jessica, G. Quantification of Food Waste Disposal in the United States: A Meta-Analysis. Environ. Sci. Technol. 2015, 49, 13946–13953. [Google Scholar]
  2. Slorach, P.C.; Jeswani, H.K.; Cuéllar-Franca, R.; Azapagic, A. Environmental sustainability of anaerobic digestion of household food waste. J. Environ. Manag. 2019, 236, 798–814. [Google Scholar] [CrossRef]
  3. Lin, C.S.K.; Pfaltzgraff, L.A.; Herrero-Davila, L.; Mubofu, E.B.; Abderrahim, S.; Clark, J.H.; Koutinas, A.A.; Kopsahelis, N.; Stamatelatou, K.; Dickson, F.; et al. Food waste as a valuable resource for the production of chemicals, materials and fuels. Current situation and global perspective. Energy Environ. Sci. 2013, 6, 426–464. [Google Scholar] [CrossRef]
  4. Kiran, E.U.; Trzcinski, A.P.; Ng, W.J.; Liu, Y. Bioconversion of food waste to energy: A review. Fuel 2014, 134, 389–399. [Google Scholar] [CrossRef]
  5. Karmee, S.K. Liquid biofuels from food waste: Current trends, prospect and limitation. Renew. Sustain. Energy 2016, 53, 945–953. [Google Scholar] [CrossRef]
  6. Lytras, G.; Lytras, C.; Mathioudakis, D.; Papadopoulou, K.; Lyberatos, G. Food waste valorization based on anaerobic digestion. Waste Biomass Valoriz. 2021, 12, 1677–1697. [Google Scholar] [CrossRef]
  7. Wiliams, C.M.; Barker, J.C.; Sims, J.T. Management and utilization of poultry wastes. In Reviews of Environmental Contamination and Toxicology; Springer: Berlin/Heidelberg, Germany, 1999; pp. 105–157. [Google Scholar]
  8. Nsubuga, D.; Banadda, N.; Kiggundu, N. Innovations in Value-Addition of Agricultural By-Products in Uganda. J. Environ. Prot. 2019, 10, 1493–1506. [Google Scholar] [CrossRef] [Green Version]
  9. Tsai, W.T. Regulatory Promotion and Benefit Analysis of Biogas-Power and Biogas-Digestate from Anaerobic Digestion in Taiwan’s Livestock Industry. Fermentation 2018, 4, 57. [Google Scholar] [CrossRef] [Green Version]
  10. Lee, Y.R.; Tsai, W.T. Valorization of Value-Added Resources from the Anaerobic Digestion of Swine-Raising Manure for Circular Economy in Taiwan. Fermentation 2020, 6, 81. [Google Scholar] [CrossRef]
  11. Ozturk, M.; Saba, N.; Altay, V.; Iqbal, R.; Hakeem, K.R.; Jawaid, M.; Ibrahim, F.H. Biomass and bioenergy: An overview of the development potential in Turkey and Malaysia. Renew. Sustain. Energy Rev. 2017, 79, 1285–1302. [Google Scholar] [CrossRef]
  12. Jurgutis, L.; Slepetiene, A.; Volungevicius, J.; Amaleviciute-Volunge, K. Biogas production from chicken manure at different organic loading rates in a mesophilic full scale anaerobic digestion plant. Biomass Bioenergy 2020, 141, 105693. [Google Scholar] [CrossRef]
  13. Sun, C.; Cao, W.; Banks, C.J.; Heaven, S.; Liu, R. Biogas production from undiluted chicken manure and maize silage: A study of ammonia inhibition in high solids anaerobic digestion. Bioresour. Technol. 2016, 218, 1215–1223. [Google Scholar] [CrossRef] [Green Version]
  14. Chen, Y.; Cheng, J.J.; Creamer, K.S. Inhibition of anaerobic digestion process: A review. Bioresour. Technol. 2008, 99, 4044–4064. [Google Scholar] [CrossRef] [PubMed]
  15. Yenigün, O.; Demirel, B. Ammonia inhibition in anaerobic digestion: A review. Process Biochem. 2013, 48, 901–911. [Google Scholar] [CrossRef]
  16. Jarunglumlert, T.; Bampenrat, A.; Sukkathanyawat, H.; Prommuak, C. Enhanced Energy Recovery from Food Waste by Co-Production of Bioethanol and Biomethane Process. Fermentation 2021, 7, 265. [Google Scholar] [CrossRef]
  17. Zhao, D.; Yan, B.; Liu, C.; Yao, B.; Luo, L.; Yang, Y.; Liu, L.; Wu, F.; Zhou, Y. Mitigation of acidogenic product inhibition and elevated mass transfer by biochar during anaerobic digestion of food waste. Bioresour. Technol. 2021, 338, 125531. [Google Scholar] [CrossRef]
  18. Hou, T.; Zhao, J.; Lei, Z.; Shimizu, K.; Zhang, Z. Enhanced energy recovery via separate hydrogen and methane production from two-stage anaerobic digestion of food waste with nanobubble water supplementation. Sci. Total Environ. 2021, 761, 143234. [Google Scholar] [CrossRef] [PubMed]
  19. Zhang, W.; Li, L.; Wang, X.; Xing, W.; Li, R.; Yang, T.; Lv, D. Role of trace elements in anaerobic digestion of food waste: Process stability, recovery from volatile fatty acid inhibition and microbial community dynamics. Bioresour. Technol. 2020, 315, 123796. [Google Scholar] [CrossRef] [PubMed]
  20. Blasius, J.P.; Contrera, R.C.; Maintinguer, S.I.; de Castro, M.C.A.A. Effects of temperature, proportion and organic loading rate on the performance of anaerobic digestion of food waste. Biotechnol. Rep. 2020, 27, e00503. [Google Scholar] [CrossRef]
  21. Chuenchart, W.; Logan, M.; Leelayouthayotin, C.; Visvanathan, C. Enhancement of food waste thermophilic anaerobic digestion through synergistic effect with chicken manure. Biomass Bioenergy 2020, 136, 105541. [Google Scholar] [CrossRef]
  22. Zhang, L.; Lee, Y.W.; Jahng, D. Anaerobic co-digestion of food waste and piggery wastewater: Focusing on the role of trace elements. Bioresour. Technol. 2011, 102, 5048–5059. [Google Scholar] [CrossRef] [PubMed]
  23. Wang, M.; Sun, X.; Li, P.; Yin, L.; Liu, D.; Zhang, Y.; Li, W.; Zheng, G. A novel alternate feeding mode for semi-continuous anaerobic co-digestion of food waste with chicken manure. Bioresour. Technol. 2014, 164, 309–314. [Google Scholar] [CrossRef]
  24. Slobodkina, L.A.; Akinshina, N.G.; Azizov, A.A. Anaerobic co-digestion of food wastes and chicken dung in lab-scale two-stage system. Issues Biol. Sci. Pharm. Res. 2021, 9, 12–18. [Google Scholar]
  25. Jijai, S.; Siripatana, C. Kinetic model of biogas production from co-digestion of thai rice noodle wastewater (Khanomjeen) with chicken manure. Energy Procedia 2017, 138, 386–392. [Google Scholar] [CrossRef]
  26. Deepanraj, B.; Sivasubramanian, V.; Jayaraj, S. Experimental and kinetic study on anaerobic co-digestion of poultry manure and food waste. Desalin. Water Treat. 2016, 59, 72–76. [Google Scholar] [CrossRef]
  27. Dhamodharan, K.; Kumar, V.; Kalamdhad, A.S. Effect of different livestock Dungs as inoculum on food waste anaerobic digestion and its kinetics. Bioresour. Technol. 2015, 180, 237–241. [Google Scholar] [CrossRef] [PubMed]
  28. Kalyuzhnyi, S.; Fedorovich, V.; Lens, P.; Pol, L.H.; Lettinga, G. Mathematical modelling as a tool to study population dynamics between sulfate reducing and methanogenic bacteria. Biodegradation 1998, 9, 187–199. [Google Scholar] [CrossRef] [PubMed]
  29. Verma, A.K.; Bhunia, P.; Dash, R.R. Carbonaceous organics removal kinetics in an upflow anaerobic sludge blanket (UASB) reactor treating physico-chemically pre-treated textile wastewater. Desalin. Water Treat. 2015, 54, 1577–1588. [Google Scholar] [CrossRef]
  30. Borja, R.; Rincón, B.; Raposo, F. Anaerobic biodegradation of two-phase olive mill solid wastes and liquid effluents: Kinetic studies and process performance. J. Chem. Technol. Biotechnol. 2006, 81, 1450–1462. [Google Scholar] [CrossRef]
  31. Andrews, J.F. Dynamic models and control strategies for wastewater treatment processes. Water Resour. 1974, 8, 261–289. [Google Scholar] [CrossRef]
  32. Monod, J.; Wyman, J.; Changeux, J.P. On the nature of allosteric transitions: A plausible model. J. Mol. Biol. 1965, 12, 88–118. [Google Scholar] [CrossRef]
  33. McCarty, P.L.; Mosey, F.E. Modelling of anaerobic digestion processes (a discussion of concepts). Water Sci. Technol. 1991, 24, 17–33. [Google Scholar] [CrossRef]
  34. Zahan, Z.; Othman, M.Z.; Muster, T.H. Anaerobic digestion/co-digestion kinetic potentials of different agro-industrial wastes: A comparative batch study for C/N optimisation. Waste Manag. 2018, 71, 663–674. [Google Scholar] [CrossRef] [PubMed]
  35. Hassan, M.; Umar, M.; Ding, W.; Mehryar, E.; Zhao, C. Methane enhancement through co-digestion of chicken manure and oxidative cleaved wheat straw: Stability performance and kinetic modeling perspectives. Energy 2017, 141, 2314–2320. [Google Scholar] [CrossRef]
  36. Pečar, D.; Goršek, A. Kinetics of methane production during anaerobic digestion of chicken manure with sawdust and miscanthus. Biomass Bioenergy 2020, 143, 105820. [Google Scholar] [CrossRef]
  37. Li, L.; He, Q.; Zhao, X.; Wu, D.; Wang, X.; Peng, X. Anaerobic digestion of food waste: Correlation of kinetic parameters with operational conditions and process performance. Biochem. Eng. J. 2018, 130, 1–9. [Google Scholar] [CrossRef]
  38. Sumantri, I.; Budiyono, B.; Purwanto, P. Kinetic Study of Anaerobic Digestion of Ketchup Industry Wastewater in a Three-stages Anaerobic Baffled Reactor (ABR). Bull. Chem. React. Eng. Catal. 2019, 14, 326. [Google Scholar] [CrossRef] [Green Version]
  39. Lindmark, J.; Eriksson, P.; Thorin, E. The effects of different mixing intensities during anaerobic digestion of the organic fraction of municipal solid waste. Waste Manag. 2014, 34, 1391–1397. [Google Scholar] [CrossRef] [PubMed]
  40. Sulaiman, A.; Hassan, M.A.; Shirai, Y.; Abd-Aziz, S.; Tabatabaei, M.; Busu, Z.; Yacob, S. The effect of mixing on methane production in a semi-commercial closed digester tank treating palm oil mill effluent. Aust. J. Basic Appl. Sci. 2009, 3, 1577–1583. [Google Scholar]
  41. Rojas, C.; Fang, S.; Uhlenhut, F.; Borchert, A.; Stein, I.; Schlaak, M. Stirring and biomass starter influences the anaerobic digestion of different substrates for biogas production. Eng. Life Sci. 2010, 10, 339–347. [Google Scholar] [CrossRef]
  42. Lin, K.C.; Pearce, M.E. Effects of mixing on anaerobic treatment of potato-processing wastewater. Can. J. Civ. Eng. 1991, 18, 504–514. [Google Scholar] [CrossRef]
  43. Singh, B.; Kovács, K.L.; Bagi, Z.; Nyári, J.; Szepesi, G.L.; Petrik, M.; Siménfalvi, Z.; Szamosi, Z. Enhancing Efficiency of Anaerobic Digestion by Optimization of Mixing Regimes Using Helical Ribbon Impeller. Fermentation 2021, 7, 251. [Google Scholar] [CrossRef]
  44. De Oliveira Paranhos, A.G.; Adarme, O.F.H.; Barreto, G.F.; de Queiroz Silva, S.; de Aquino, S.F. Methane production by co-digestion of poultry manure and lignocellulosic biomass: Kinetic and energy assessment. Bioresour. Technol. 2020, 300, 122588. [Google Scholar] [CrossRef] [PubMed]
  45. Safley Jr, L.M.; Vetter, R.L.; Smith, D. Operating a full-scale poultry manure anaerobic digester. Biol. Wastes 1987, 19, 79–90. [Google Scholar] [CrossRef]
  46. Chen, J.; Li, J.; Ye, B.; Zhang, X.; Tyagi, R.D.; Gao, X. Energy balance assessment on chicken manure for biogas production in Rabat-Salé-Zemmour-Zaïr of Morocco. J. Environ. Manag. 2021, 299, 113656. [Google Scholar] [CrossRef] [PubMed]
  47. Curry, N.; Pillay, P. Biogas prediction and design of a food waste to energy system for the urban environment. Renew. Energy 2012, 41, 200–209. [Google Scholar] [CrossRef]
  48. Xin, X.; Ma, Y.; Liu, Y. Electric energy production from food waste: Microbial fuel cells versus anaerobic digestion. Bioresour. Technol. 2018, 255, 281–287. [Google Scholar] [CrossRef] [PubMed]
  49. Fei, X.; Jia, W.; Chen, T.; Ling, Y. Life-cycle assessment of two food waste disposal processes based on anaerobic digestion in China. J. Clean. Prod. 2021, 293, 126113. [Google Scholar] [CrossRef]
  50. Orfanoudaki, A.; Makridakis, G.; Maragkaki, A.; Fountoulakis, M.S.; Kallithrakas-Kontos, N.G.; Manios, T. Anaerobic co-digestion of pig manure and spent coffee grounds for enhanced biogas production. Waste Biomass Valoriz. 2019, 11, 4613–4620. [Google Scholar] [CrossRef]
  51. Idrus, S.; Banks, C.J.; Heaven, S. Assessment of the potential for biogas production from wheat straw leachate in upflow anaerobic sludge blanket digesters. Water Sci. Technol. 2012, 66, 2737–2744. [Google Scholar] [CrossRef] [PubMed]
  52. Rodger, B.; Bridgewater, L. Standard Methods for the Examination of Water and Wastewater, 23th ed.; American Public Health Association: Washington, DC, USA, 2017.
  53. Muhamad Ng, S.N.; Idrus, S.; Ahsan, A.; Tuan Mohd Marzuki, T.N.; Mahat, S.B. Treatment of Wastewater from a Food and Beverage Industry Using Conventional Wastewater Treatment Integrated with Membrane Bioreactor System: A Pilot-Scale Case Study. Membranes 2021, 11, 456. [Google Scholar] [CrossRef] [PubMed]
  54. Dinh, P.V.; Fujiwara, T.; Phu, S.T.P.; Hoang, M.G. Kinetic of Biogas Production in Co-Digestion of Vegetable waste, horse Dung, and Sludge by Batch Reactors. IOP Conf. Ser. Earth Environ. Sci. 2018, 159, 012041. [Google Scholar] [CrossRef]
  55. Deepanraj, B.; Sivasubramanian, V.; Jayaraj, S. Experimental and kinetic study on anaerobic digestion of food waste: The effect of total solids and pH. J. Renew. Sustain. Energy 2015, 7, 063104. [Google Scholar] [CrossRef]
  56. Khanal, S.K.; Li, Y. Biogas Production and Application. In Bioenergy: Principles and Applications, 1st ed.; Wiley Blackwell: Hoboken, NJ, USA, 2017; pp. 338–360. [Google Scholar]
  57. Ong, H.; Greenfield, P.; Pullammanappallil, P. Effect of Mixing on Biomethanation of Cattle-Manure Slurry. Environ. Technol. 2002, 23, 1081–1090. [Google Scholar] [CrossRef] [PubMed]
  58. Mills, P. Minimisation of energy input requirements of an anaerobic digester. Agric. Wastes 1979, 1, 57–66. [Google Scholar] [CrossRef]
  59. Sung, S.; Dague, R. Laboratory studies on the anaerobic sequencing batch reactor. Water Environ. Res. 1995, 67, 294–301. [Google Scholar] [CrossRef] [Green Version]
  60. Zhang, J.; Loh, K.; Lee, J.; Wang, C.; Dai, Y.; Wah, T.Y. Three-stage anaerobic co-digestion of food waste and horse manure. Sci. Rep. 2017, 7, 1269. [Google Scholar] [CrossRef] [PubMed]
  61. Ceron-Vivas, A.; Cáceres-Cáceres, K.; Rincón-Pérez, A.; Cajigas, A. Influence of pH and the C/N ratio on the biogas production of wastewater. Rev. Fac. Ing. Univ. Antioq. 2019, 92, 70–79. [Google Scholar] [CrossRef]
  62. Hu, Y.; Kobayashi, T.; Zhen, G.; Shi, C.; Xu, K. Effects of lipid concentration on thermophilic anaerobic co-digestion of food waste and grease waste in a siphon-driven self-agitated anaerobic reactor. Biotechnol. Rep. 2018, 19, e00269. [Google Scholar] [CrossRef] [PubMed]
  63. Dasa, K.; Westman, S.; Millati, R.; Cahyanto, M.; Taherzadeh, M.; Niklasson, C. Inhibitory Effect of Long-Chain Fatty Acids on Biogas Production and the Protective Effect of Membrane Bioreactor. Biomed Res. Int. 2016, 2016, 1–9. [Google Scholar]
  64. Li, K.; Liu, R.; Sun, C. Comparison of anaerobic digestion characteristics and kinetics of four livestock manures with different substrate concentrations. Bioresour. Technol. 2015, 198, 133–140. [Google Scholar] [CrossRef] [PubMed]
  65. Kafulla, S. Anaerobic Digestion of Dairy Manure Wastewater, Food and Fruit Waste, a Sustainable Source of Bio-Energy and Waste Management. Master’s Thesis, Stellenbosch University, Stellenbosch, South Africa, 2016. [Google Scholar]
  66. Mao, L.; Zhang, J.; Dai, Y.; Tong, Y.W. Effects of mixing time on methane production from anaerobic co-digestion of food waste and chicken manure: Experimental studies and CFD analysis. Bioresour. Technol. 2019, 294, 122177. [Google Scholar] [CrossRef]
  67. Bi, S.; Hong, X.; Yang, H.; Yu, X.; Fang, S.; Bai, Y.; Wang, Y. Effect of hydraulic retention time on anaerobic co-digestion of cattle manure and food waste. Renew. Energy 2020, 150, 213–220. [Google Scholar] [CrossRef]
  68. Rincón, B.; Borja, R.; González, J.; Portillo, M.; Sáiz-Jiménez, C. Influence of organic loading rate and hydraulic retention time on the performance, stability and microbial communities of one-stage anaerobic digestion of two-phase olive mill solid residue. Biochem. Eng. J. 2008, 40, 253–261. [Google Scholar] [CrossRef]
  69. Musa, M.; Idrus, S.; Hasfalina, C.; Daud, N. Effect of Organic Loading Rate on Anaerobic Digestion Performance of Mesophilic (UASB) Reactor Using Cattle Slaughterhouse Wastewater as Substrate. Int. J. Environ. Res. Public Health 2018, 15, 2220. [Google Scholar] [CrossRef] [PubMed] [Green Version]
  70. Jiang, J.; He, S.; Kang, X.; Sun, Y.; Yuan, Z.; Xing, T. Effect of Organic Loading Rate and Temperature on the Anaerobic Digestion of Municipal Solid Waste: Process Performance and Energy Recovery. Front. Energy Res. 2020, 8, 89. [Google Scholar] [CrossRef]
  71. Morales-Polo, C.; Del Mar Cledera-Castro, M.; Moratilla Soria, B.Y. Reviewing the anaerobic digestion of food waste: From waste generation and anaerobic process to its perspectives. Appl. Sci. 2018, 8, 1804. [Google Scholar] [CrossRef] [Green Version]
  72. Tangkathitipong, P.; Intanoo, P.; Butpan, J.; Chavadej, S. Separate production of hydrogen and methane from biodiesel wastewater with added glycerin by two-stage anaerobic sequencing batch reactors (ASBR). Renew. Energy 2017, 113, 1077–1085. [Google Scholar] [CrossRef]
  73. Kleiner, D. NH4+ transport systems. In Alkali Cation Transport Systems in Prokaryotes; Bakker, E., Ed.; CRC Press: Boca Raton, FL, USA, 1993. [Google Scholar]
  74. Wiegant, W.M.; Zeeman, G. The mechanism of ammonia inhibition in the thermophilic digestion of livestock wastes. Agric. Wastes 1986, 16, 243–253. [Google Scholar] [CrossRef]
  75. Marzuki, T.N.T.M.; Idrus, S.; Musa, M.A.; Wahab, A.M.A.; Jamali, N.S.; Man, H.C.; Ng, S.N.M. Enhancement of Bioreactor Performance Using Acclimatised Seed Sludge in Anaerobic Treatment of Chicken Slaughterhouse Wastewater: Laboratory Achievement, Energy Recovery, and Its Commercial-Scale Potential. Animals 2021, 11, 3313. [Google Scholar] [CrossRef] [PubMed]
  76. Wresta, A.; Andriani, D.; Saepudin, A.; Sudibyo, H. Economic analysis of cow manure biogas as energy source for electricity power generation in small scale ranch. Energy Procedia 2015, 68, 122–131. [Google Scholar] [CrossRef] [Green Version]
Figure 1. Schematic diagram for: (a) BMP WM test; (b) BMP CM test.
Fermentation 08 00028 g001
Figure 2. Schematic diagram of CSTR.
Fermentation 08 00028 g002
Figure 3. Kinetic analysis of biogas yield for different substrates. (a) Measured and predicted biogas production for FW WM. (b) Measured and predicted biogas production for FW CM. (c) Measured and predicted biogas production for CD WM. (d) Measured and predicted biogas production for CD CM. (e) Measured and predicted biogas production for FWCD WM. (f) Measured and predicted biogas production for FWCD CM.
Fermentation 08 00028 g003
Figure 4. Rm and k values for WM and CM modes using different models. (a) Rm value for WM and CM modes using modified Gompertz model. (b) The k value for WM and CM modes using first-order model. (c) Rm value for WM and CM modes using logistic model. (d) The k value for WM and CM modes using the Monod model.
Fermentation 08 00028 g004aFermentation 08 00028 g004b
Figure 5. Correlations between Rm/k for different models. (a) Correlations between Rm and bioreactor performance parameters (SMP and VS%) for modified Gompertz model. (b) Correlations between k and bioreactor performance parameters (SMP and VS%) for logistic model. (c) Correlations between Rm and bioreactor performance parameters (SMP and VS%) for first-order model. (d) Correlations between k and bioreactor performance parameters (SMP and VS%) for Monod model.
Fermentation 08 00028 g005
Figure 6. Biogas production for FW, CD, and FWCD.
Fermentation 08 00028 g006
Figure 7. Performance comparison between continuous study of FW, CD, and FWCD. OLR: organic loading rate; SMP: specific methane production; IA/PA: alkalinity ratio; TAN: total ammonia nitrogen; VS: volatile solids, VFA: volatile fatty acid. (a) CSTR performance (SMP) at different OLRs. (b) CSTR performance (pH) at different OLRs. (c) CSTR performance (IA/PA ratio) at different OLRs. (d) CSTR performance (TAN) at different OLRs. (e) CSTR performance (VS removal) at different OLRs. (f) CSTR performance (VFA) at different OLRs.
Fermentation 08 00028 g007aFermentation 08 00028 g007b
Table 1. Characteristics of raw FW, CD, and FWCD.
ParametersUnitFWCDFWCD
CODmg/L315,000 ± 350205,000 ± 170198,000 ± 240
O & Gmg/L211 ± 28015 ± 5038 ± 140
TNmg/L5200 ± 32023,000 ± 3009300 ± 300
VSmg/L284 ± 220182 ± 150264 ± 190
C/N ratio-60.588.9121.29
FW: food waste; CD: chicken dung; FWCD: food waste and chicken dung.
Table 2. Kinetic model for AD.
ModelMathematical Definition Source
Modified
Gompertz
S ( t ) = Sexp   { exp [ R m S exp ( λ t ) + 1 ] } (1)[37]
Logistic S ( t ) = S 1 + exp [ 4 Rm   ( λ t S ) + 2 ] (2)[36]
First Order S   ( t ) = S   [   1 exp ( kt ) } (3)[36,37]
Monod S ( t ) = S ( kt 1 + kt ) (4)[36,37]
Table 3. BMP performance for operating conditions WM and CM for all substrates.
FWCDFWCD
WMCMWMCMWMCM
IA/PA ratio0.156 ± 0.120.149 ± 0.120.188 ± 0.050.174 ± 0.050.13 ± 0.020.19 ± 0.02
pH6.69 ± 0.256.73 ± 0.257.02 ± 0.056.85 ± 0.056.65 ± 0.106.55 ± 0.10
TAN (mg/L)130 ± 50126 ± 50183 ± 70198 ± 7073 ± 4068 ± 40
SMP (L CH4/VS)0.610.640.520.550.380.41
VS Removal (%)828375787072
FW: food waste; CD: chicken dung; FWCD: food waste and chicken dung; WM: without mixing; CM: continuous mixing.
Table 4. Summary of kinetic analysis using different models.
ModelsParameter UnitsSample
FW WMFW CMCD WMCD CMCDFW WMCDFW CM
R2 0.92080.85880.84630.77500.91280.8570
RMSE 0.00070.00070.00250.17100.00090.0810
Modified
Gompertz Difference a%1.220.161.8012.671.8512.98
Difference bModel2.81 15.97 15.49
Difference cExperimental1.47 2.06 1.09
R2 0.92080.89870.81600.99420.91620.8411
RMSE 0.03170.05150.00110.03300.00130.0860
Logistic Difference a%1.740.1802.4912.751.440.19
Difference bModel3.43 16.62 2.68
Difference cExperimental1.47 2.06 1.09
R2 0.85250.82390.81990.82240.85960.8995
RMSE 0.00250.00120.00120.35000.00080.1780
First Difference a%2.870.3002.7223.061.3825.30
Order Difference bModel4.55 26.64 27.12
Difference cExperimental1.47 2.06 1.09
R2 1.00001.00000.81650.82360.88700.9001
RMSE 0.14680.21870.00110.34900.00140.1770
Monod Difference a%0.451.960.5622.801.4424.90
Difference bModel0.01 24.81 26.78
Difference cExperimental1.47 2.06 1.09
Difference a: percentage biogas difference between experimental data and predicted data from models. Difference b: percentage biogas difference between WM and CM for models. Difference c: percentage biogas difference between WM and CM for experiment.
Table 5. Energy generation from the treatment of FW, CD, and FW+CD in both LS and OFS.
SubstrateOptimum OLR (gVS/L/d)SMP (LCH4/gVS)Volume of Substrate Used (kg)Energy (kJ/kgVS)Electrical Energy
Generation (kWh)
Electrical Energy Yield (kWh)
FW (LS)40.330.0611,829.180.002090.0007
FW (OFS)40.3336011,829.18372.62122.96
CD (LS)50.260.129319.960.003940.0013
CD (OFS)50.267209319.96382.12126.10
FW + CD (LS)70.250.1 (FW) and 0.04 (CD)8961.500.006150.0020
FW + CD (OFS)70.25588 (FW) and 252 (CD)8961.50518.57171.13
LS: laboratory scale; OFS: on-farm scale (predicted value based on SMP in LS).
Publisher’s Note: MDPI stays neutral with regard to jurisdictional claims in published maps and institutional affiliations.

