Article

Variation in the Growth Traits and Wood Properties of Chinese Fir from Six Provinces of Southern China

1
National Engineering Laboratory for Tree Breeding, Key Laboratory of Genetics and Breeding in Forest Trees and Ornamental Plants, Ministry of Education, College of Biological Sciences and Technology, Beijing Forestry University, Beijing 100083, China
2
Guangdong Provincial Key Laboratory of Bio-control for the Forest Disease and Pest, Guangdong Academy of Forestry, Guangzhou 510520, Guangdong, China
3
The ex situ gene bank of Longshan State Forest Farm, Lechang 512221, Guangdong, China
4
Jiangle National Forest Farm, Sanming 353300, Fujian, China
*
Author to whom correspondence should be addressed.
Forests 2016, 7(9), 192; https://doi.org/10.3390/f7090192
Submission received: 24 June 2016 / Revised: 19 August 2016 / Accepted: 25 August 2016 / Published: 31 August 2016

Abstract

:
To determine the phenotypic variation in 700 ten-year grafted Chinese fir collected from six provinces in southern China, 10 phenotypic traits were investigated: tree height, diameter at breast height, bark thickness, volume of timber, heartwood ratio, density of wood, hygroscopicity, tracheid length, tracheid diameter, and ratio of tracheid length to tracheid diameter. Abundant phenotypic variation was found among the six populations; the phenotypic variation coefficients all exceeded 10%, and the largest was for volume of timber. Significant variation (p < 0.01 or 0.05) in traits was found among the populations, except for diameter at breast height, heartwood ratio, and tracheid diameter, while all traits differed significantly (p < 0.01) within populations. The high value of repeatability (broad-sense heritability) suggested moderate genetic control of the traits. The 10 traits were strongly correlated within the entire population; strong positive correlations (p < 0.01) were observed between growth traits, and significant negative correlations (p < 0.01 or 0.05) were found between the density of wood and most other characteristics, except for heartwood ratio and ratio of tracheid length to tracheid diameter. Using diameter at breast height and density of wood as criteria, 98 relatively fast-growing genotypes with relatively high wood basic density were identified.

1. Introduction

The forest ecosystems on Earth provide about 82% of the continental biomass and more than 50% of terrestrial biodiversity [1,2], the economic and commercial values of which are affected directly by wood quality. The abundant variation in the traits of trees strengthens their ability to adapt to different environmental conditions and provides the potential for the selection of trees with desirable traits [3,4,5]. An important reason to breed trees is to increase the quantity and quality of wood. Wood properties are closely related to the complex biological processes of wood formation under cambial activity [6,7,8], and most traits are complex, quantitative, and associated and regulated by multiple genes [9,10]. A better understanding of the variation in these traits of trees can enhance the use of germplasm collection and elucidate the genetic basis of phenotypic variation [11]. In addition, to maximize the genetic gain in important traits, variation in and correlations between growth and wood quality must be assessed.
Chinese fir (Cunninghamia lanceolata (Lamb.) Hook) is an economically valuable conifer with high yield, good wood quality, and multiple uses. It is a principal indigenous tree species that occupies approximately 25% of plantations in subtropical areas of southern China. Similar to other trees in breeding programs, provenance tests of Chinese fir have been performed since 1957, and a set of activities has been carried out mainly to improve its growth and adaptability. Presently, the Chinese fir breeding program has reached the third generation, and fine germplasm resources have been obtained [12]. In 2004, a set of 700 Chinese fir plus trees from six provinces in southern China was conserved in the ex situ gene bank of Longshan State Forest, Guangdong Province, China (25°11′ N, 113°28′ E, 285–296 m above sea level). To reveal phenotypic variation and identify individuals with superior wood quality in this genetic resource, 10 phenotypic traits were investigated in 2014. Our results will improve the application of this germplasm resource and provide a starting point for further association analyses in Chinese fir.

2. Materials and Methods

In 2004, 700 Chinese fir plus individuals were collected from six provinces in China: 105, 113, 33, 49, 71, and 329 from the provinces of Guangxi, Jiangxi, Hunan, Guizhou, Fujian, and Guangdong, respectively. The scions of these trees were synchronously grafted onto two-year-old rootstocks in the ex situ gene bank of Longshan State Forest Farm, Guangdong Province, China (25°11′ N, 113°28′ E, 285–296 m above sea level), which is located in a subtropical region with a moderate climate throughout the year and receiving ample rainfall. Each clone had at least four ramets and random distribution with a plant spacing of 3 m × 3 m.
In 2014, 10 growth and wood traits were measured in all 700 clones, with at least three randomly selected ramets per clone. The growth traits included tree height (H), diameter at breast height (DBH), bark thickness (T), and stem volume (V). H, DBH, and T were measured during field surveys using methods described by Duan et al. [13]. V was calculated according to the formula V = 0.000 058 777 042 × D1.9699831 × H0.89646157. The wood traits were the percentage of heartwood (P), wood basic density (WBD), hygroscopicity (Hy), tracheid length (L), tracheid diameter (D), and ratio of L to D (L/D). A 5.02 mm core was drilled from each tree at breast height using a tree growth cone and then placed in a plastic tube that was not completely sealed, to prevent wet rot. P was measured using the formula P = r2/R2 × 100%, where r and R represent the length of the heartwood and the sapwood, respectively [13]. WBD and Hy were measured using the formulae WBD = 1/(W1/W2 − 0.346) and Hy = (W1 − W2)/W2, where W1 and W2 represent the water-saturated weight and the oven-dry weight, respectively [14]. L and D were measured using the methods described by Huang et al. [15]. Each sample was dissociated in a Franklin solution consisting of glacial acetic acid and 30% hydrogen peroxide at a 1:1 ratio for 16 h at 100 °C. Then, the remaining tracheid material was washed with deionized water until it was neutralized. Next, a tracheid smear was made to measure the lengths and widths of tracheids under a color closed-circuit television (CCTV) video camera (Panasonic SDII, Osaka, Japan). Three smears were made for each sample, and no fewer than 30 values were obtained in total.
Microsoft Excel 2010 and SAS ver. 8.1 (SAS Institute, Cary, NC, USA) were used to examine the variation in phenotypic traits, including the mean value, standard error, amplitude, and coefficient of variation (CV). Differences in phenotypic variables among and within populations were determined using analysis of variance (ANOVA) with Duncan’s multiple range tests for multiple comparisons. A p-value for the ANOVA F tests ≤ 0.05 was considered significant. Pearson’s correlation coefficients for all phenotypic traits—which can guide multiple-trait selective breeding—were analyzed at the levels of the individual, clone, and population. Correlations between phenotypic traits and geographical factors (longitude and latitude) were also tested at the population level. Repeatability for all traits in each population and the overall population was calculated using the formula: R = 1 − 1/F. A linear model (yij = u + ai +bj + eij) was used to generate the components of variance of all traits in this resource by restricted maximum likelihood (REML) in the open source statistical package R [16], where yij is the dependent variable, u is the overall mean, ai is the random effect of population i (i = 1, ..., m ), N(0, бa2), bj is the random effect of clone j (j = 1, ..., n), N(0, бb2), and eijk is the residual (N(0, бe2)). All models assumed that the random effects were distributed normally with expectation zero and corresponding variances. VE = бa2, where VE is the estimated environment variance, VG = бb2, where VG is the estimated genetic variance, and бe2 is the residual. Realized gain (G) was estimated by the formula G = (XiX)/X × 100%, where Xi and X are the mean values of the selected elite clones and the overall trait, respectively.

3. Results

3.1. Variation in Growth Traits

Table 1 shows the differences in all of the studied growth traits. In addition to the lowest T, the lowest H, DBH, and V were found in the Jiangxi population, but ANOVA for the six populations in Table 1 revealed no significant difference in T between Jiangxi and the minimum of Hunan. Guizhou had the largest DBH and V, and there were no significant differences in H and T between Guizhou and the maximum value of Guangdong and Guangxi, respectively. The differences in H, DBH, T, and V between Guizhou and Jiangxi were 14.12%, 13.02%, 6.59%, and 38.95%, respectively. Aside from Jiangxi, all growth traits of Fujian were also lower than the mean values of all samples. The amplitudes and coefficients of variation in the growth traits in each population were also recorded (Table 1). The amplitude of H across the six populations was 1.50–15.25 m. Of the six populations, Fujian had the highest amplitude, where the ratio of the maximum to the minimum was 8.33. The amplitudes of DBH and V of all clones were 3.40–24.27 cm and 0.0015–0.3235 m3, respectively. Guizhou showed the highest amplitude of these traits with maximum to minimum ratios of 6.33 and 169, respectively. The amplitude of T of all clones was 2.33–9.00 mm. Guangdong showed the highest amplitude, with a maximum-to-minimum ratio of 3.15. The lowest amplitudes of H, DBH, T, and V were those for Hunan, with maximum-to-minimum ratios of 2.83, 2.87, 1.48, and 21.90, respectively. All of the trees from the different populations showed substantial variation in growth traits, with all mean coefficients of variation in growth traits being higher than 15%. Among these, V showed the largest coefficient of variation—more than twice the variation of the other growth traits (H, DBH, and T). Hunan had the lowest coefficient of variation for all growth traits, corresponding with the minimum amplitude. Within the populations, the value of CV for each trait demonstrated that stem volume also had the highest value (77.63%), followed by H (30.06%) and DBH (29.31%), with T having the lowest CV (20.25%) (Table 1).
Figure 1 shows the percentages of the growth traits in the different populations that were greater than the overall mean. Jiangxi, Hunan, and Fujian had small percentages of values greater than the averages. Close to or more than half of the values for Guangxi, Guizhou, and Guangdong were higher than the averages. Overall, trees from Guangxi, Guizhou, and Guangdong had better growth performance.

3.2. Variation in Wood Properties

Table 2 shows the differences in the wood properties, including P, WBD, and Hy, of all clones. There were different degrees of variation. The amplitude of P among all clones was 6.43%–45.55%. Fujian displayed the largest P among the six populations, but P did not differ significantly among the populations. The amplitude of WBD among all clones was 0.2286–0.5102 g·cm−3. Jiangxi displayed the largest WBD but the minimum Hy, and there were significant differences for both WBD and Hy among the populations. All trees displayed substantial variation in these three traits. WBD showed the lowest coefficient of variation, but it was larger than 10%.
Table 3 and Figure 2 show the differences in the tracheid traits. All of the coefficients of variation, including those for L, D, and L/D, were greater than 10%. The amplitude of L among all clones was 1863.26–3580.89 μm. Guizhou had the largest average L, 5.79% longer than the shortest average L of Guangxi. The mean D ranged from 44.75 ± 0.70 μm for Fujian to 46.57 ± 0.64 μm for Guangxi, but there was no marked difference between them. The mean L/D of all trees ranged from 59.24 ± 1.00 to 64.15 ± 1.19. Fujian had the largest average L/D, whereas Guangxi had the lowest, 8.29% lower than that of Fujian. The greatest difference in L/D was between Fujian and Guangxi, but there were no significant differences between Fujian and the other populations.

3.3. Variance Analysis in Traits within Populations and Estimation of Genetic Parameters

The analysis of variance in growth traits and wood properties within populations (Table 4) showed extremely significant differences in all of the measured traits among the clones. Further ANOVA within each population (data not listed) showed that most of the growth traits and wood properties were extremely significantly different, except for DBH, T, and V in Hunan and P in Guizhou. Table 5 shows the repeatability of the growth traits and wood properties of Chinese fir within each population and in all populations. In each population, the tracheid traits had greater repeatability than the other traits, with a mean of 0.9436 for L, 0.9347 for D, and 0.9233 for L/D. Of the 10 measured traits, P had the lowest value of 0.3542, while the others all exceeded 0.6, and were close to or less than the values in all populations, indicating that the character performance is relatively stable.
To elucidate the variation in this resource, the components of variance in all measured traits were estimated. The results in Table 6 show that the genetic variance in each trait exceeded that of the environmental variance, suggesting that environmental effects are small for these traits.

3.4. Correlations between Pairs of Traits

The phenotypic correlations between growth traits (H, DBH, T, and V) and wood properties (P, WBD, Hy, L, D, and L/D) for all of the clones are shown in Table 7. There were 40 significant phenotypic correlations (p < 0.05, Table 7). Strong positive correlations (p < 0.01) were observed between the growth traits, and significant (p < 0.01 or 0.05) positive correlations were observed between P, Hy, L, and L/D and the growth traits. However, all of the growth traits had negative correlations (p < 0.01 or 0.05) with WBD and L/D. Notably, WBD had significant negative correlations (p < 0.01 or 0.05) with most of the characters, except for P and L/D. Among these, the highest degree of negative correlation was between WBD and Hy, and the lowest degree of negative correlation was between WBD and L. Hy had significant positive correlations (p < 0.01) with L and D, in addition to those with the growth traits. L had significant positive correlations (p < 0.01) with D, and there was a significant positive correlation (p < 0.01) between L and L/D and a negative correlation (p < 0.01) between D and L/D. Moreover, L/D had significant or insignificant negative correlations with other characters.
For all individuals, 41 genetic correlations were estimated (Table 7). Comparing all correlations between both sets, we found that most of the significant correlations had similar magnitudes and trajectories (Table 7). For instance, there were significant positive genetic correlations between the growth traits. All of the growth traits also had significant negative genetic correlations (p < 0.01 or 0.05) with WBD. Although there was no significant phenotypic correlation between H and P, there was a significant positive correlation at the genetic level; only six phenotypic correlations were seen at the population level (Table 8), perhaps due to the limited populations studied. There were significant positive correlations between DBH and T, V, and Hy, but a significant negative correlation between DBH and WBD, as well as the phenotypic correlations and genetic correlations. For the trait-geographical factor correlations at the population level, only D had a strong negative correlation (p < 0.05, Table 8) with longitude.

3.5. Reselection of Chinese Fir Plus Trees

All of the 10 important traits showed significant variation, which not only provides raw material for further marker-assisted selective breeding, but also provides an opportunity to select faster-growing clones with higher wood density. Considering selection for growth and WBD of these resources, a total of 326 clones had DBH values higher than the overall mean (13.23 ± 0.14 cm), and 98 of these (Table S1) had WBD values higher than the overall mean (0.3148 ± 0.0015 g·cm−3). Of these clones, 17, 12, 4, 5, 10, and 50 clones were from Guangxi, Jiangxi, Hunan, Guizhou, Fujian, and Guangdong, respectively. Constraining selection to DBH and WBD, the 98 plus trees provided an average realized gain (G) in all growth traits and wood properties except for Hy and D, which had lower values (G = −10.77%, G = −0.26%, respectively, Table 9). DBH had the largest gain of 14.80% and dramatically increased the WBD, which had a gain of 8.82%. Moreover, there were moderate increases in L and L/D (G = 1.26%, G = 1.06%, respectively).

4. Discussion

In 2004, Chinese fir from six provinces in southern China were grafted in Longshan State Forest Farm, and all were grown under the same environmental conditions. As it can maintain a recurring tree phenotype, grafting has long been used to produce elite tree clones for conservation and breeding, as well as provide evidence for a genetic effect in traits [14,17]. Compatibility is vitally important in grafting, and sometimes a species grafts more successfully on stock of the same species [18]. In this study, all of the stock was two-year-old root segments of Chinese fir, and high grafting success (>90%) was seen, with no graft incompatibility. Moreover, most of the ramets remained vigorous throughout the study, as in a previous study [14]. The high repeatability of all measured traits in this study indicated that the population was under moderate genetic control and that the selection was effective, which is also supported by the average repeatability estimations of 0.65 in wood properties in trees [13,14,17]. Studies of other Chinese fir in Longshan State Forest Farm have also shown that the local environment has little effect on them [13,14]. Thus, the phenotypic variation observed in this study may reflect a larger degree of genotypic variation [13,17].
Growth traits and wood properties reflect the performance of wood. In this study, V revealed the yields of wood production, illustrating the superiority of the clones. The high CV (77.63%) for V revealed abundant phenotypic diversity in V among all individuals from different populations (Table 1). One of the most important wood properties is WBD, which represents the degree of wood compactness and affects the quality of nearly all wood end-products [19,20]. P, which also plays a critical role in the improvement of wood material, was positively associated with WBD. Hy [
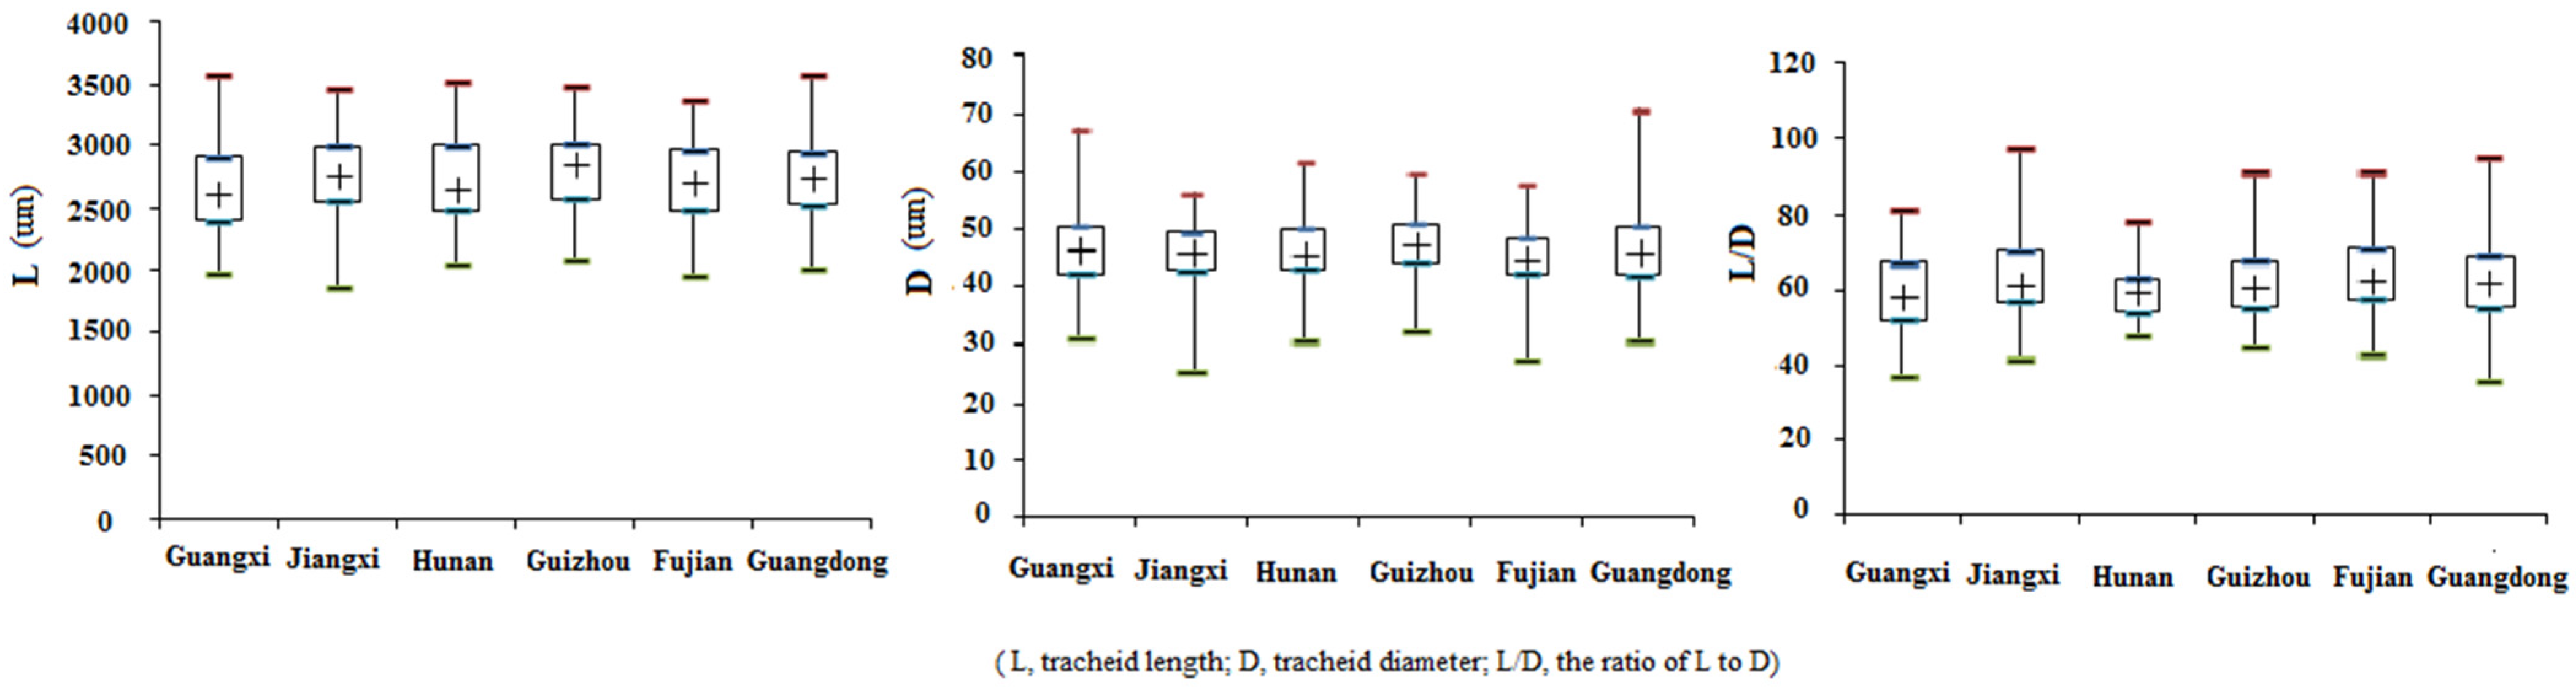
14], another wood trait that has multiple effects on end-products, was also tested in this experiment. Tracheids are the most abundant conducting structures in the xylem of conifers, and the morphology of tracheids significantly influences the properties of paper. Wood with a greater L/D is better for making paper [21,22]. There were similar high D values among the populations, but differences in L, resulting in L/D differences among the populations (Table 3). Among the populations, Fujian had the largest average L/D. In addition, an ANOVA analysis indicated that most other traits showed moderately significant variation and that genetic parameters varied with different populations (Table 1, Table 2 and Table 3). Further ANOVA analysis within populations showed that there was abundant variation among the clones, which provides potential opportunities for genetic improvement of Chinese fir with large potential for selection. Chinese fir is indigenous to southern China. The trees investigated in this study were all from subtropical climate zones, which may weaken their genetic structure to an extent. Further analysis of the trait-geographical factor correlations at the population level (Table 8) showed that most traits had no significant correlation with longitude or latitude. However, it is important to characterize the variation in these traits in response to geographical environmental gradients in order to understand the evolutionary adaption of Chinese fir. Much more study of greater scope is needed.
The most important traits of trees are quantitative traits, and either strong linkage disequilibrium of related genes or pleiotropy effects explain the common correlation between two quantitative traits in a natural population. The correlations among growth and wood properties of Chinese fir are important for its genetic improvement. The correlation analysis of all 10 phenotypic traits in this study showed that there were strong correlations for each trait at both the clone and individual levels. All of the growth traits showed significant positive correlations with each other, as well as with P, Hy, L, and L/D, showing that they may have similar genetic bases and may be biologically related [17]. There were negative correlations between WBD and all of the growth traits (which is consistent with the results of previous investigations [13,14]), and DBH showed the highest degree of negative correlation. At the population level, WBD also had a significant negative correlation with DBH. Although WBD had significant negative correlations with most of the traits, it is one of the important indicators of wood quality. Rapid growth with relatively high WBD increases the value of the output [23], and seems to represent the correlated response of traits to selection. Thus, considering the DBH and WBD among all clones, 98 relatively fast-growing clones with relatively high WBD were identified. The gain in DBH was 14.80% and that in WBD was 8.82%. In addition, there was a 6.65% gain in V. There was a positive correlation between Hy and growth, and a strong negative relationship between Hy and WBD, resulting in reductions (−10.77%) in Hy. Therefore, it is desirable to use only a few traits as a selection index in a selective breeding program [24]. The traits of Chinese fir can be predicted early [25], as the juvenile wood and mature material properties are closely related. A previous study showed that it was feasible to predict WBD and L of mature wood using a density of around 10 in juvenile wood [26]. These results suggest that our selection is reliable and that it provides a basis for the prediction of mature wood material.

5. Conclusions

Variation is essential for the adaptability of a population and is the basis for the evolutionary potential of a species. In our study, 10 phenotypic traits were investigated and abundant variation was found with the phenotypic variation coefficients all exceeded 10%. The variation in most growth traits was significantly different among the populations. Trees from Guangxi, Guizhou, and Guangdong had better growth performance. All traits differed significantly within populations and had high value of repeatability, providing possibility to choose plus trees. The correlation between characters is important in the selective breeding program and the correlation analysis of all 10 phenotypic traits in this study showed that there were strong correlations for each trait at both the clone and individual levels. All of the growth traits showed significant positive correlations with each other but negative correlation with WBD, and DBH showed the highest degree of negative correlation. However, rapid growth with relatively high WBD can increase the value of the output. Thus, using DBH and WBD as criteria, 98 relatively fast-growing genotypes with relatively high WBD were identified. And the gain in DBH was 14.80% and that in WBD was 8.82%. Overall, the results will improve the application of this germplasm resource.

Supplementary Materials

The following are available online at www.mdpi.com/1999-4907/7/9/192/s1, Table S1: The plus trees of Chinese fir which have greater values than the overall means of DBH and WBD.

Acknowledgments

This research was supported by the Key Projects of the State Forestry Administration (2012-06), National ‘863’ Project in the 12th Five-Year Plan in China (2011AA100203), and the Forestry Science and Technology Projects of Guangxi province (2014-01), Innovation Team Development Program of the Ministry of Education (IRT13047), and the Special Fund for Forest Scientific Research in the Public Welfare (No. 201404127).

Author Contributions

Yun Li designed the experiments, coordinated and supervised the research. Hongjing Duan conducted most of the field trial work and statistical analyses and drafted the manuscript. Sen Cao, Huazhong Lin, Ruiyang Hu, and Yuhan Sun participated in the investigation of the trees. Huiquan Zheng, Dehuo Hu, and Jun Lin contributed materials. All authors read and approved the final manuscript.

Conflicts of Interest

The authors declare no conflict of interest.

References

  1. Petit, R.J.; Hampe, A. Some evolutionary consequences of being a tree. Annu. Rev. Ecol. Evol. Syst. 2006, 37, 187–214. [Google Scholar] [CrossRef]
  2. Neale, D.B.; Kremer, A. Forest tree genomics: Growing resources and applications. Nat. Rev. Genet. 2011, 12, 111–122. [Google Scholar] [CrossRef] [PubMed]
  3. Hoffmann, A.A.; Sgrò, C.M. Climate change and evolutionary adaptation. Nature 2011, 470, 479–485. [Google Scholar] [CrossRef] [PubMed]
  4. Matuszewski, S.; Hermisson, J.; Kopp, M. Catch me if you can: Adaptation from standing genetic variation to a moving phenotypic optimum. Genetics 2015, 115, 178574. [Google Scholar] [CrossRef] [PubMed]
  5. Lopes, M.S.; El-Basyoni, I.; Baenziger, P.S.; Singh, S.; Royo, C.; Ozbek, K.; Aktas, H.; Ozer, E.; Ozdemir, F.; Manickavelu, A.; et al. Exploiting genetic diversity from landraces in wheat breeding for adaptation to climate change. J. Exp. Bot. 2015. [Google Scholar] [CrossRef] [PubMed]
  6. Schrader, J.; Moyle, R.; Bhalerao, R.; Hertzberg, M.; Lundeberg, J.; Nilsson, P.; Bhalerao, R.P. Cambial meristem dormancy in trees involves extensive remodelling of the transcriptome. Plant J. 2004, 40, 173–187. [Google Scholar] [CrossRef] [PubMed]
  7. Wang, G.F.; Gao, Y.; Yang, L.W.; Shi, J.S. Identification and analysis of differentially expressed genes in differentiating xylem of Chinese fir (Cunninghamia. lanceolata) by suppression subtractive hybridization. Genome 2007, 50, 1141–1155. [Google Scholar] [PubMed]
  8. Qiu, Z.B.; Wan, L.C.; Chen, T.; Wan, Y.L.; He, X.Q.; Lu, S.F.; Wang, Y.W.; Lin, J.X. The regulation of cambial activity in Chinese fir (Cunninghamia. lanceolata) involves extensive transcriptome remodeling. New Phytol. 2013, 199, 708–719. [Google Scholar] [CrossRef] [PubMed]
  9. Wang, K.; Li, M.Y.; Hakonarson, H. Analysing biological pathways in genome-wide association studies. Nat. Rev. Genet. 2010, 11, 843–854. [Google Scholar] [CrossRef] [PubMed]
  10. Bradshaw, H.D.; Ceulemans, R.; Davis, J.; Stettler, R. Emerging model systems in plant biology: Poplar (Populus.) as a model forest tree. J. Plant Growth Regul. 2000, 19, 306–313. [Google Scholar] [CrossRef]
  11. Sexton, T.R.; Henry, R.J.; Harwood, C.E.; Thomas, D.S.; McManus, L.J.; Raymond, C.; Henson, M.; Shepherd, M. Pectin Methylesterase genes influence solid wood properties of Eucalyptus pilularis. Plant Physiol. 2012, 158, 531–541. [Google Scholar] [CrossRef] [PubMed]
  12. Zheng, H.Q.; Hu, D.H.; Wang, R.H.; Wei, R.P.; Yan, S.; Zhu, H.S.; Liang, R.Y.; Lai, X.E. Plus tree resource survey and genebank construction for Cunninghamia. lanceolata. J. Southwest For. Univ. 2013, 1, 22–26. (In Chinese) [Google Scholar]
  13. Duan, H.J.; Cao, S.; Zheng, H.Q.; Hu, D.H.; Lin, J.; Zhang, X.W.; Zhang, X.Y.; Chen, P.; Sun, Y.H.; Li, Y. Variation analysis on the main economic characters of Chinese fir clones. J. Southwest For. Univ. 2016, 2, 78–83. (In Chinese) [Google Scholar]
  14. Zheng, H.Q.; Hu, D.H.; Wang, R.H.; Wei, R.P.; Yan, S. Assessing 62 Chinese Fir (Cunninghamia. lanceolata) Breeding Parents in a 12-Year Grafted Clone Test. Forests 2015, 6, 3799–3808. [Google Scholar] [CrossRef]
  15. Huang, S.X.; Zhou, C.M.; Zhu, L.Q.; Wei, L.Q.; Shi, J.S.; Liu, M.R. Study on the genetic variation of growth traits and wood properties for Chinese Fir half-sib families. Guihaia 2004, 24, 535–539. (In Chinese) [Google Scholar]
  16. Bates, D.M. Lme4: Mixed-Effects Modeling with R. 2010. Available online: http://lme4.0.r-forge.r-project.org/lMMwR/lrgprt.pdf (accessed on 27 August 2016).
  17. Du, Q.Z.; Xu, B.H.; Gong, C.R.; Yang, X.H.; Pan, W.; Tian, J.X.; Li, B.L.; Zhang, D.Q. Variation in growth, leaf, and wood property traits of Chinese white poplar (Populus. tomentosa), a major industrial tree species in Northern China. Can. J. For. Res. 2014, 44, 326–339. [Google Scholar] [CrossRef]
  18. Jayawickrama, K.J.S.; Jett, J.B.; McKeand, S.E. Rootstock effects in grafted conifers: A review. New For. 1991, 5, 157–173. [Google Scholar] [CrossRef]
  19. Hylen, G. Genetic variation of wood density and its relationship with growth traits in young Norway spruce. Silvae Genet. 1997, 46, 55–60. [Google Scholar]
  20. Ma, H.D.; Dong, Y.N.; Chen, Z.; Liao, W.H.; Lei, B.Q.; Gao, K.; Li, S.W.; An, X.M. Variation in the Growth Traits and Wood Properties of Hybrid White Poplar Clones. Forests 2015, 6, 1107–1120. [Google Scholar] [CrossRef]
  21. Mansfield, S.D.; Kibblewhite, R.P.; Riddell, M.J.C. Characterisation of the reinforcement potential of different softwood Kraft fibres in softwood/hardwood pulp mixtures. Wood Fiber Sci. 2004, 36, 344–358. [Google Scholar]
  22. Kord, B.; Samdaliri, M. The impact of site index on wood density and fiber biometry of Populus deltoides clones. World Appl. Sci. J. 2011, 12, 716–719. [Google Scholar]
  23. Kha, L.D.; Harwood, C.E.; Kien, N.D.; Baltunis, B.S.; Hai, N.D.; Thinh, H.H. Growth and wood basic density of acacia hybrid clones at three locations in Vietnam. New For. 2012, 43, 13–29. [Google Scholar]
  24. Gapare, W.J.; Baltunis, B.S.; Ivkovic, M.; Wu, H.X. Genetic correlations among juvenile wood quality and growth traits and implications for selection strategy in Pinus radiata D. Don. Ann. For. Sci. 2009, 66, 606–614. [Google Scholar] [CrossRef]
  25. Ye, P.Z.; Chen, Y.W.; Ruan, Y.C.; Chen, S.B.; Liu, D.L.; Guo, M.C.; Lin, Q.Y. Earlier research of choice on Chinese fir. J. Nanjing Technol. Coll. For. Pro. 1981, 5, 106–116. (In Chinese) [Google Scholar]
  26. Shi, J.S.; Ye, Z.H.; Chen, Y.W.; Zhang, J.Y. Heredity and Variation Analysis On wood material of Chinese fir. J. Nanjing For. Univ. 1987, 11, 15–24. (In Chinese) [Google Scholar]
Figure 1. The percentages of various sources with growth traits greater than the average.
Forests 07 00192 g001
Figure 2. Boxplots of tracheid traits of Chinese fir from the six populations. (Maximum–minimum values; the top and bottom of each box indicate the 75th and 25th percentiles respectively.)
Forests 07 00192 g002
Table 1. Differences in growth traits of Chinese fir.
PopulationH/m DBH/cm T/mmV/m3
MeanAmplitudeCV/%MeanAmplitudeCV/%MeanAmplitudeCV/%MeanAmplitudeCV/%
Guangxi7.85 ± 0.21 b1.50~14.2527.6713.43 ± 0.35 a,b4.80~24.2726.504.79 ± 0.07 c3.00~7.6715.650.0769 ± 0.0054 a,b0.0029~0.323572.46
Jiangxi6.87 ± 0.19 a2.25~13.0029.2512.37 ± 0.30 a5.75~22.0825.944.40 ± 0.07 a,b2.50~6.2316.410.0593 ± 0.0041 a0.0045~0.261473.46
Huan7.74 ± 0.29 b4.00~11.3321.7812.63 ± 0.45 a6.10~17.4820.344.23 ± 0.07 a3.50~5.1710.070.0648 ± 0.0060 a,b0.0072~0.157753.29
Guizhou7.84 ± 0.29 b2.50~11.5025.9013.98 ± 0.50 b3.40~21.5325.274.69 ± 0.13b c3.33~9.0019.170.0824 ± 0.0070 b0.0015~0.253559.44
Fujian7.40 ± 0.27 a,b1.50~12.5031.2613.18 ± 0.40 a,b6.10~20.7025.414.56 ± 0.10b c3.13~8.0018.640.0704 ± 0.0058 a,b0.0065~0.216869.34
Guangdong8.00 ± 0.12 b2.50~15.2527.1913.42 ± 0.21 a,b4.50~22.6027.804.64 ± 0.04b c2.33~7.3317.090.0780 ± 0.0030 a,b0.0026~0.318970.59
Total7.71 ± 0.081.50~16.5030.0613.23 ± 0.143.4~22.6029.314.60 ± 0.032.00~11.0020.250.0737 ± 0.00200.0015~0.479177.63
Mean square22.757 27.236 2.636 0.007
F-value5.009 2.203 4.377 2.776
p-value0.000 0.052 0.001 0.017
H, tree height; DBH, diameter at breast height; T, bark thickness; V, stem volume; CV, coefficient of variation. a The first homogeneous group at 95% confidence for each trait (Duncan’s multiple range test). b The second homogeneous group at 95% confidence for each trait (Duncan’s multiple range test). c The third homogeneous group at 95% confidence for each trait (Duncan’s multiple range test).
Table 2. Differences in wood properties of Chinese fir.
PopulationPWBDHy
Mean/%Amplitude %CV/%Mean/g·cm−3Amplitude/g·cm−3CV/%Mean/%Amplitude/%CV/%
Guangxi21.51 ± 0.68 a6.55~41.9632.200.3167 ± 0.0040 b0.2286~0.448012.93257.10 ± 4.05 a158.12~372.2716.15
Jiangxi20.94 ± 0.59 a8.11~45.5529.750.3248 ± 0.0041 b0.2345~0.510213.39248.83 ± 3.75 a130.61~362.3516.01
Huan19.99 ± 0.93 a11.34~34.1626.760.3169 ± 0.0062 b0.2439~0.421911.17257.26 ± 5.65 a186.76~345.8412.61
Guizhou21.15 ± 0.81 a13.89~37.4426.730.2986 ± 0.0045 a0.2412~0.381210.54275.77 ± 4.91 b199.15~363.6612.45
Fujian22.11 ± 0.68 a8.33~34.4525.960.3115 ± 0.0047 a,b0.2395~0.440512.75263.38 ± 4.68 a,b162.92~353.8314.96
Guangdong22.01 ± 0.36 a6.43~41.4229.950.3141 ± 0.0022 b0.2308~0.478312.54260.36 ± 2.18 a152.98~438.1115.18
Mean square0.004 0.004 0.482
F-value0.974 2.845 3.134
p-value0.433 0.015 0.008
P, the percentage of heartwood; WBD, wood basic density; Hy, hygroscopicity; CV, coefficient of variation. a The first homogeneous group at 95% confidence for each trait (Duncan’s multiple range test). b The second homogeneous group at 95% confidence for each trait (Duncan’s multiple range test).
Table 3. Differences in tracheid traits of Chinese fir.
PopulationL D L/D
Mean/µmAmplitude/µmCV/%Mean/µmAmplitude/µmCV/%MeanAmplitudeCV/%
Guangxi2624.60 ± 35.44 a1981.38~3571.5013.8446.57 ± 0.64 a31.10~67.2014.0759.24 ± 1.00 a37.05~81.5417.31
Jiangxi2754.08 ± 32.92 b1863.26~3467.9612.7145.63 ± 0.56 a25.25~56.0613.0963.48 ± 1.07 b41.13~97.5017.93
Huan2676.82 ± 62.66 a,b2042.19~3525.2813.4546.55 ± 1.14 a30.53~61.8314.1160.16 ± 1.37 a,b47.72~78.2013.09
Guizhou2776.51 ± 46.23 b2080.75~3478.8411.6547.22 ± 0.86 a32.26~59.8012.7261.78 ± 1.41 a,b44.62~91.2215.93
Fujian2711.18 ± 36.49 a,b1948.54~3385.3211.3444.75 ± 0.70 a27.26~57.5713.1864.15 ± 1.19 b42.95~91.2115.61
Guangdong2737.25 ± 16.34 a,b2019.10~3580.8910.8346.28 ± 0.35 a30.52~70.6413.7962.44 ± 0.58 a,b35.68~94.7316.83
Mean square233703.075 43.359 259.548
F-value 2.264 1.097 2.372
p-value 0.047 2.372 0.038
L, tracheid length; D, tracheid diameter; L/D, the ratio of L to D; CV, coefficient of variation. a The first homogeneous group at 95% confidence for each trait (Duncan’s multiple range test). b The second homogeneous group at 95% confidence for each trait (Duncan’s multiple range test).
Table 4. Analysis of variance within populations.
TraitSum of SquaresdfMean SquareFSig.
H8231.16363412.9835.9810.000
DBH22,029.79063334.8024.9120.000
T1150.1916151.8704.6430.000
V5.2156300.0085.1560.000
P9.1556100.0151.7550.000
WBD2.8435880.0053.2070.000
HY272.1766290.4333.0610.000
L2.104 × 1095853,595,961.69617.0470.000
D798,564.4035851365.06715.8470.000
L/D2,257,241.7625853858.53314.3760.000
H, tree height; DBH, diameter at breast height; T, bark thickness; V, stem volume; P, percentage of heartwood; WBD, wood basic density; Hy, hygroscopicity; L, tracheid length; D, tracheid diameter; L/D, the ratio of L to D.
Table 5. The repeatability in traits of Chinese fir within each population and among all populations.
RepeatabilityGuangxiJiangxiHunanGuizhouFujianGuangdongMeanAll Populations
H0.83900.76310.62770.70300.85900.85780.77490.8328
DBH0.80040.72270.28520.69810.79760.84300.69120.7968
T0.73550.70420.09830.86050.80870.80280.66830.7846
V0.82590.78740.27540.64130.82800.83660.69910.8061
P0.47970.39610.38840.26040.10710.49520.35450.4302
WBD0.67160.73790.45530.55440.75190.68230.64220.6882
HY0.66820.70540.48590.59250.69030.67530.63630.6733
L0.94970.94950.95570.94170.93480.93030.94360.9407
D0.93820.93600.94230.92730.92510.93920.93470.9369
L/D0.93300.94180.90290.92180.91010.93010.92330.9302
H, tree height; DBH, diameter at breast height; T, bark thickness; V, stem volume; P, the percentage of heartwood; WBD, wood basic density; Hy, hygroscopicity; L, tracheid length; D, tracheid diameter; L/D, the ratio of L to D.
Table 6. Genetic components in traits of Chinese fir.
Variance ComponentsHDBHTVPWBDHyLDL/D
VG3.4879.24740.455172.15 × 10−31.73 × 10−31.10 × 10−30.1003139413734.07100.317
VE0.17320.19240.025095.00 × 10−51.58 × 10−54.42 × 10−50.00373319860.002.054
Residual2.17837.10620.401281.60 × 10−38.51 × 10−31.51 × 10−30.1411724663719.8869.668
H, tree height; DBH, diameter at breast height; T, bark thickness; V, stem volume; P, the percentage of heartwood; WBD, wood basic density; Hy, hygroscopicity; L, tracheid length; D, tracheid diameter; L/D, the ratio of L to D; VG, genetic variance; VE, environmental variance.
Table 7. The correlation between traits in the whole clones (below left) and the whole individuals (above right) of Chinese fir.
CorrelationHDBHTVPWBDHyLDL/D
H1.0000.804 **0.419 **0.856 **0.048 *−0.354 **0.360 **0.095 **0.180 **−0.080 **
DBH0.841 **1.0000.570 **0.928 **0.113 **−0.340 **0.352 **0.085 **0.224 **−0.128 **
T0.453 **0.617 **1.0000.512 **0.131 **−0.156 **0.157 **0.0020.108 **−0.090 **
V0.884 **0.935 **0.561 **1.0000.107 **−0.340 **0.352 **0.073 **0.205 **−0.118 **
P0.0650.135 **0.148 **0.141 **1.0000.086 **−0.075 **−0.0210.007−0.018
WBD−0.441 **−0.443 **−0.179 **−0.437 **0.101 *1.000−0.952 **−0.092 **−0.222 **0.120 **
Hy0.454 **0.450 **0.174 **0.455 **−0.102 *−0.965 **1.0000.091 **0.214 **−0.113 **
L0.138 **0.137 **0.0180.101 *−0.062−0.106 *0.119 **1.0000.212 **0.489 **
D0.244 **0.313 **0.131 **0.284 **0.008−0.289 **0.311 **0.251 **1.000−0.694 **
L/D−0.107 **−0.170 **−0.100 *−0.166 **−0.0470.162 **−0.169 **0.475 **−0.704 **1.000
H, tree height; DBH, diameter at breast height; T, bark thickness; V, stem volume; P, the percentage of heartwood; WBD, wood basic density; Hy, hygroscopicity; L, tracheid length; D, tracheid diameter; L/D, the ratio of L to D. NS: not significant; * Significant at α = 0.05; ** Significant at α = 0.01.
Table 8. The correlation between the traits at the level of population (n = 6).
CorrelationHDBHTVPWBDHyLDL/DLongitude (°E)Latitude (°N)
H1.0000.7050.4590.8040.130−0.5490.546−0.2780.630−0.592−0.4690.166
DBH 1.0000.817 *0.982 **0.485−0.865 *0.861 *0.1280.471−0.172−0.4630.111
T 1.0000.821 *0.711−0.4500.443−0.0950.232−0.149−0.340−0.390
V 1.0000.477−0.7910.7860.0460.528−0.268−0.4850.025
P 1.000−0.200−0.2190.093−0.4280.4550.404−0.420
WBD 1.000−0.999 **−0.360−0.4330.0140.389−0.529
Hy 1.0000.3620.4040.010−0.3540.537
L 1.0000.0010.6920.0850.029
D 1.000−0.714−0.942 **0.097
L/D 1.0000.734−0.075
Longitude (°E) 1.000−0.039
Latitude (°N) 1.000
H, tree height; DBH, diameter at breast height; T, bark thickness; V, stem volume; P, the percentage of heartwood; WBD, wood basic density; Hy, hygroscopicity; L, tracheid length; D, tracheid diameter; L/D, the ratio of L to D. NS: not significant; * Significant at α = 0.05; ** Significant at α = 0.01.
Table 9. The realized gain in all traits when selection was carried out with the 700 Chinese fir clones using the overall means of DBH and WBD as a threshold.
TraitsMean
All the individuals (n = 700)Selection for both DBH and WBD (n = 98)G%
H (m)7.71 ± 0.088.38 ± 1.448.78
DBH (cm)13.23 ± 0.1415.18 ± 1.7614.80
T (cm)4.60 ± 0.034.96 ± 0.667.85
V (m3)0.0737 ± 0.00200.0908 ± 0.03136.65
P (%)21.61 ± 0.2423.05 ± 6.266.65
WBD (g·cm3)0.3148 ± 0.00150.3426 ± 0.02608.82
Hy (%)259.46 ± 1.50231.50 ± 19.33−10.77
L (um)2720.09 ± 12.212754.25 ± 321.181.26
D (um)46.15 ± 0.2446.04 ± 5.82−0.26
L/D62.13 ± 0.4062.80 ± 8.871.06
H, tree height; DBH, diameter at breast height; T, bark thickness; V, stem volume; P, the percentage of heartwood; WBD, wood basic density; Hy, hygroscopicity; L, tracheid length; D, tracheid diameter; L/D, the ratio of L to D.

