Article

Eliminating Illegal Timber Consumption or Production: Which Is the More Economical Means to Reduce Illegal Logging?

1
College of Economics and Management, Nanjing Forestry University, Nanjing 210037, China
2
Research Center for Economics and Trade in Forest Products of the State Forestry Administration, Nanjing 210037, China
3
Research Institute of Forestry Policy and Information, China Academy of Forestry, Beijing 100091, China
*
Authors to whom correspondence should be addressed.
Forests 2016, 7(9), 191; https://doi.org/10.3390/f7090191
Submission received: 26 April 2016 / Revised: 29 July 2016 / Accepted: 24 August 2016 / Published: 29 August 2016

Abstract

:
Illegal logging, with its related trade of illegally harvested timber, is one of the main environmental and economic problems worldwide. Eliminating illegal timber consumption and production are two practical means to reduce illegal logging. However, the problem of determining which of the two means is more economical remains to be analyzed. In this study, an input–output analysis was conducted to evaluate the consumption and production of illegal timber in different countries. The Global Forest Products Model (GFPM) was employed to analyze the effects of eliminating illegal timber consumption and production on the added value of the forest sector at global and national levels. Results indicated that eliminating illegal timber production is more economical than eliminating consumption at the global level. The former is estimated to decrease the added value of the global forest sector only by 3.37% compared to 7.31% by the latter in 2030. Eliminating the production of illegal timber will result in uneven distribution of social wealth in the forest sector, and will pass the cost of reducing illegal logging onto developing countries. Developed countries would gain more added value and market scale than the global average, whereas developing countries would suffer a loss if illegal timber production is eliminated. Hence, developed countries are encouraged to provide financial support to help developing countries reduce illegal logging.

1. Introduction

Illegal logging is one of the main contributors to deforestation and forest degradation [1], and is one of the key problems to be addressed in the REDD+ (Reducing Emissions from Deforestation and Degradation) program [2]. Illegal logging undermines forest ecology and the environmental services of forests [3,4], and has become the main barrier to sustainable forest management [5]. Apart from its environmental effects, illegal logging also leads to various socioeconomic problems. Trade of illegally harvested timber disrupts the global market [6] and often coexists with corruption [7], which results in reduced incentive to manage forests sustainably and efficiently [8].
The trade of illegal timber is the main purpose of and the incentive for illegal logging [6]. Governments, intergovernmental organizations, and non-governmental organizations have established a series of policies to reduce the trade of illegal timber; these policies include FLEGT (Forest Law Enforcement, Governance, and Trade) [9], Lacey Act [10], and forest certification schemes [11,12,13]. These policies aim to combat illegal logging by preventing the export (or production) of illegally harvested timber or stopping the import (or consumption) of illegal wood products. However, most of the current empirical studies on the illegal timber trade mainly focus on the economic effects of eliminating the production of illegally harvested timber [10,14,15]. Other studies focus on estimating the extent of the trade [16] and the distribution of the use of illegal timber through trade [1,17].
The key factor that limits the empirical study of illegal logging is statistics of the quantities of consumption and production of illegal timber in different countries. Accurate statistics of illegally harvested timber is a global problem [18], and the definition of illegal timber varies by each country and organization [17]. As a result, estimations of illegally harvested timber vary by reports of countries and organizations, and most of the estimations are merely at the global level or focus on particular countries [16,17,18]. The most recent and comprehensive data on the proportion of illegally harvested timber in national timber production were provided by Li et al. [14]; these data were derived from an estimation by Seneca Creek Associates [19] and supplemented with data provided by Miller et al. [20] and Contreras-Hermosilla et al. [21]. These data are still adopted fully or partly in the latest reports of organizations [22,23,24] and scholars [1,10,25]. In addition, Li et al. provided high and low estimations of the share of illegally harvested timber [14]. Among them, the high estimation (13% at the global level in 2008) [17] matches the estimation by UNEP (10%–30% at the global level) [24]. Therefore, the high estimations of Li et al. were utilized as the data source of illegal timber production of each country in the present study [14].
Meanwhile, the data have some limitations. Seneca Creek Associates indicates that the high estimation of the illegal timber share is up to 50% of production in China [20], a result that might have been overestimated because the strict logging quota policy [26] and National Forest Protection Program [27] effectively reduced illegal logging. The latest WWF report indicates that the share of illegal timber is 30% of production in China (low estimation by Seneca Creek Associates) [20]. Although this could still be an overestimation, this finding appears to be closer to reality than the high estimation. Hence, we adopted the estimation of China by WWF in this study. In addition, although the data on the national shares of illegal timber production are the most comprehensive and recent, they are essentially out of date. The limitations of the data source would affect the reliability of this study.
In the value chain of the global forest sector, the consumers and producers of illegal timber share common responsibilities in combating illegal logging [28]. Various policies attempt to reduce illegal logging by controlling the consumption or production of illegal timber. However, given that both means could reduce the social welfare of the global forest sector compared with free trade, the issue of which of the two means is more economical remains to be discussed. This problem is addressed in this study by evaluating the respective effects of eliminating the consumption and production of illegal timber on the added value of the global forest sector.

2. Materials and Methods

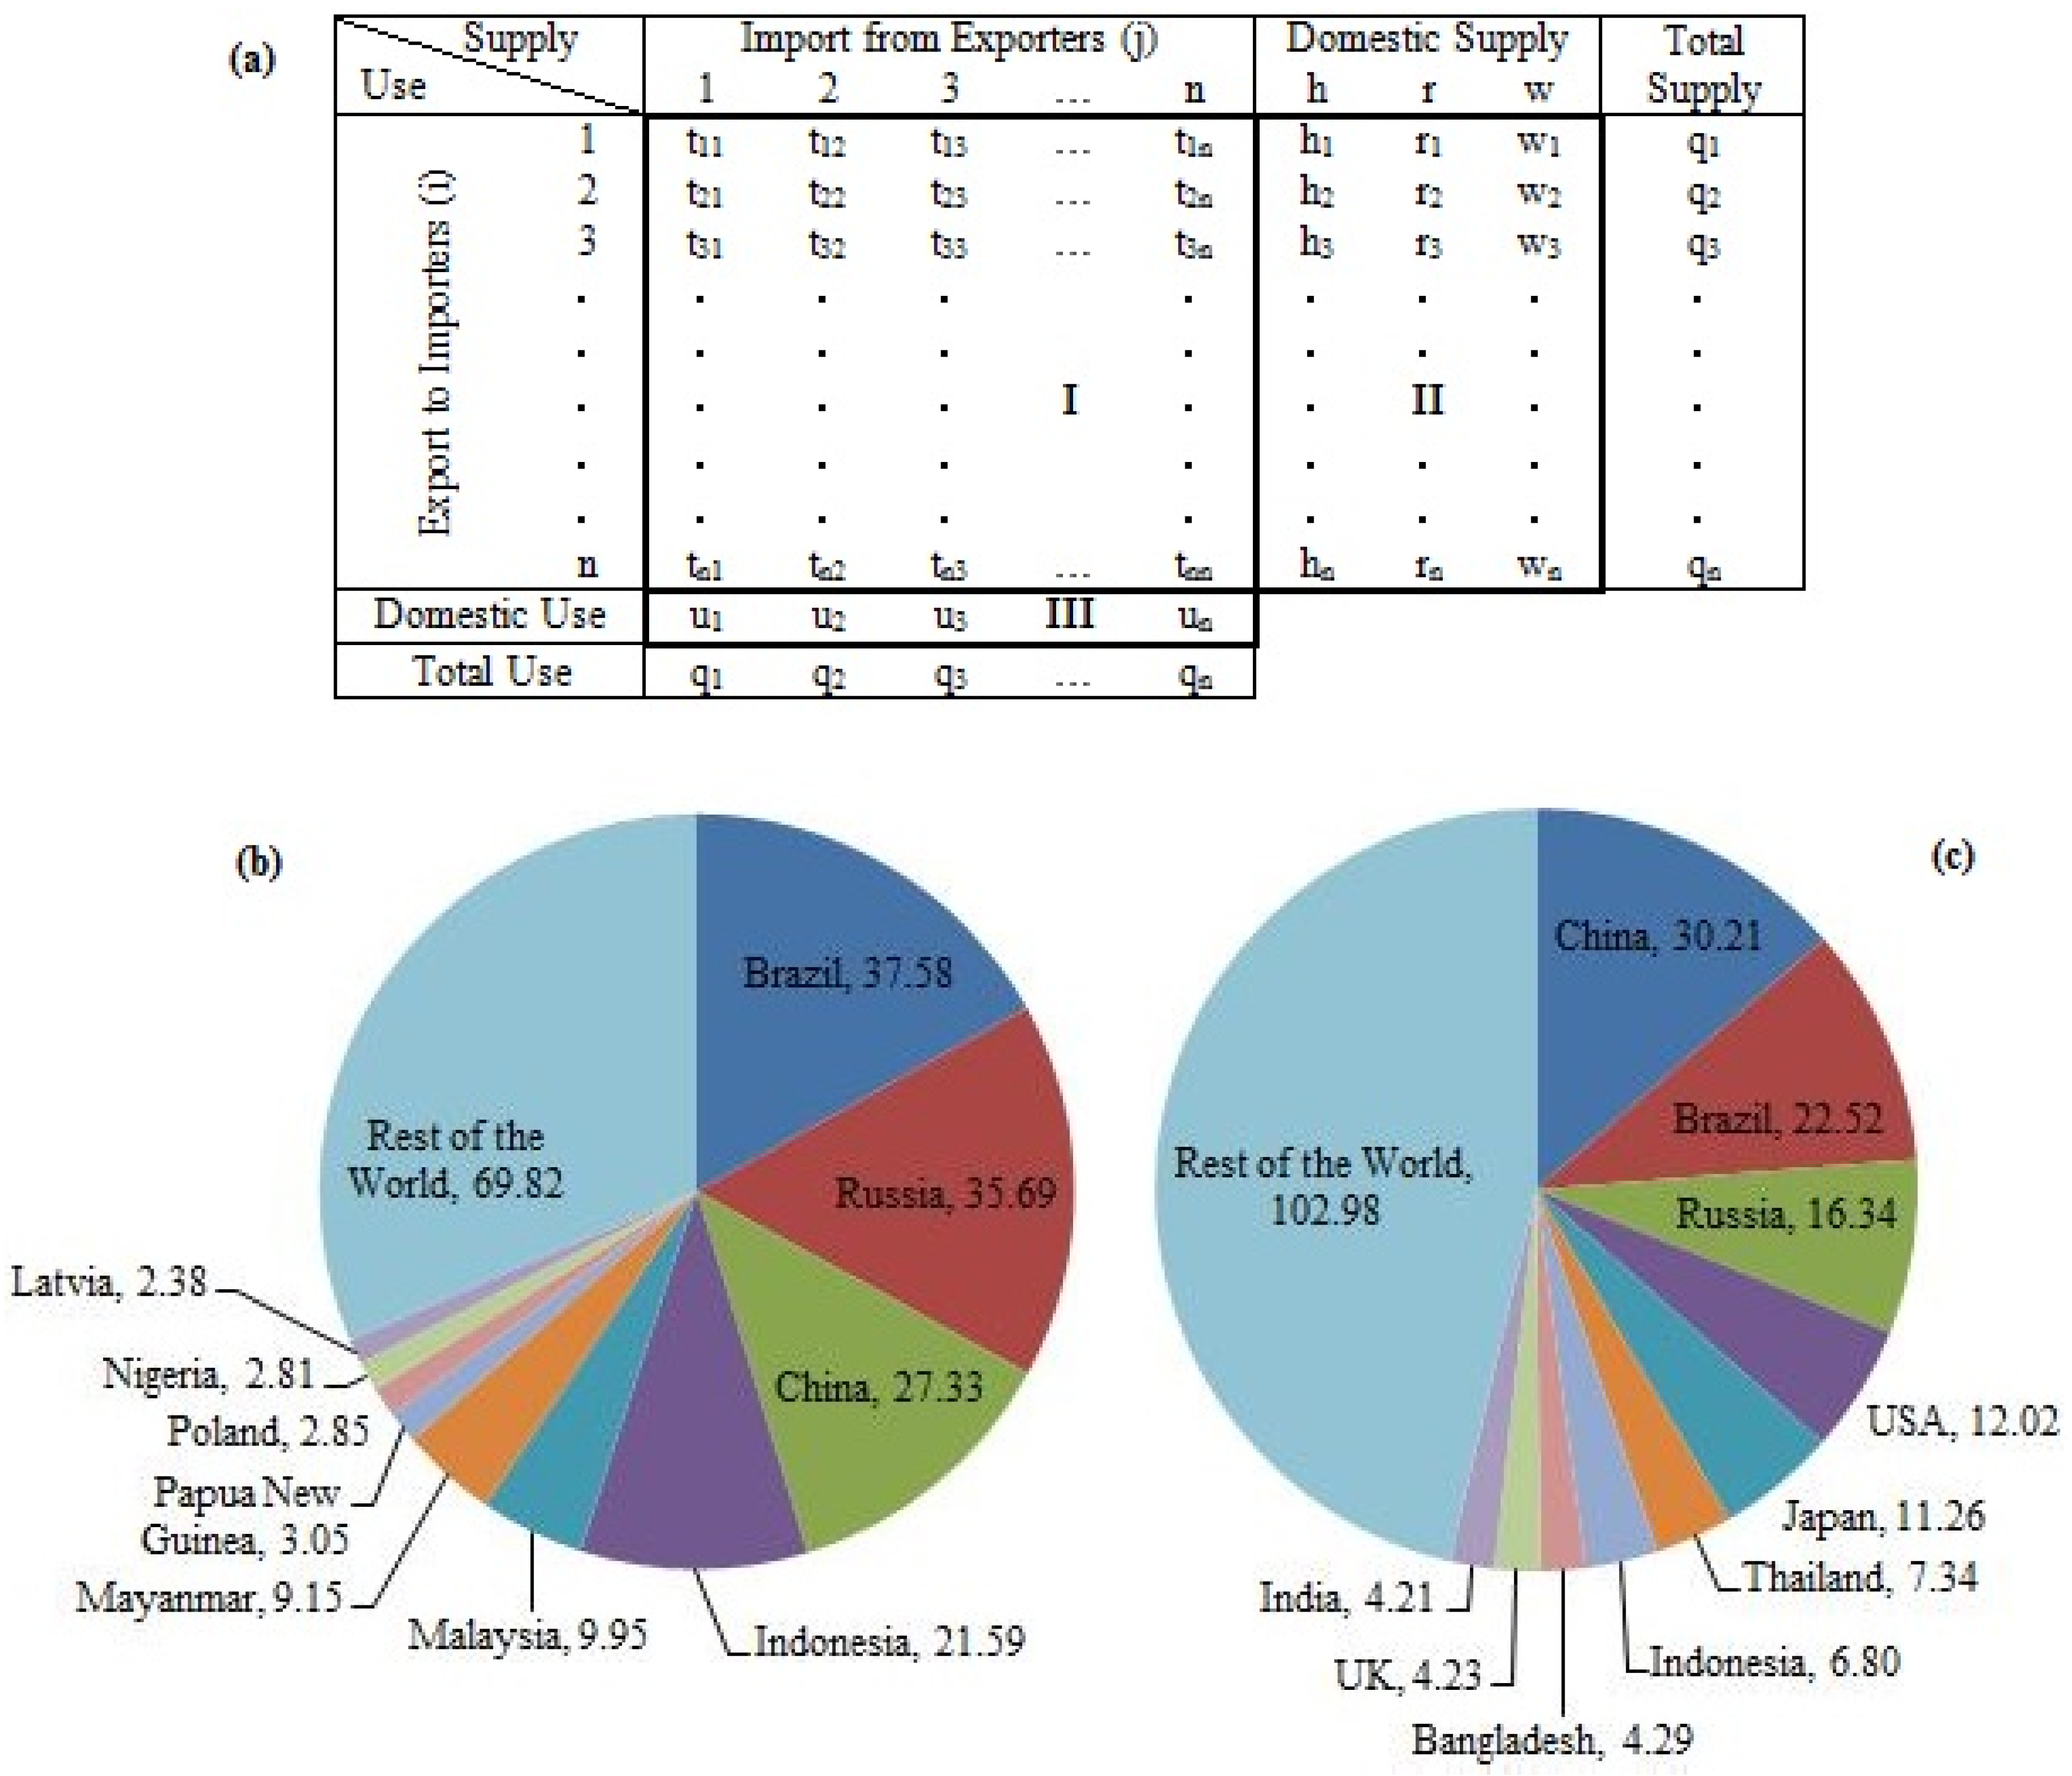
2.1. Estimating National Consumption of Illegal Timber

Determining the consumption of illegal timber in a country is highly complex, because it is increasingly affected by intensive trade [17]. On one hand, apart from the use of domestic illegal timber, trade is another source of consumption. On the other hand, with the development of intra-industry trade, the consumption of imported wood products made from illegal timber should also be included. The model developed by Dieter is based on input–output analysis, and can thus be utilized to estimate the consumption distribution among countries through intensive intra-industry trade [17]. The adjusted input–output table established by Dieter [17] is shown in Figure 1.
Figure 1a is an input–output table, which shows the material balance at global and national levels. Material balance is described as total supply being equal to total use. Quadrant I denotes the trade of timber and wood products. Quadrant II denotes the domestic production of wood fiber, including harvested wood, recovered paper, and waste wood. Quadrant III denotes the domestic consumption of wood fiber. For a particular country i, the total supply or total use (qi) is equal to the sum of imported wood fiber ( j = 1 n t i j ) plus the sum of the domestic supply of wood fiber ( h i + r i + w i ), or equals to the sum of exported wood fiber ( j = 1 n t j i ) plus domestic use ( u i ). Illegal timber and wood products made from illegal timber are contained in Quadrants I–III. With inverse export coefficients and the domestic use share of each country, the input–output table can be utilized to compute the distribution of the consumption of illegally harvested timber in each country. The detailed mathematical explanation of the inverse export coefficients and domestic use share was elaborated in the study of Dieter [17]. The estimation by Dieter [17] indicated that the global scale of illegal wood fiber is up to 222.20 rwe m3, accounting for 13% of total production (consumption). The top 10 producing countries of illegal timber are Brazil, China, the Russia, Indonesia, Malaysia, Myanmar, Papua New Guinea, Poland, Nigeria, and Latvia, accounting for almost two-thirds of global production of illegal timber; among them, the top five countries account for almost 60%. The top 10 consuming countries of illegal timber are China, Brazil, the Russia, the USA, Japan, Thailand, Indonesia, Bangladesh, the UK, and India, accounting for 54% of the global consumption of illegal timber. The top five consuming countries only account for about 40% of the total illegal timber consumption. Meanwhile, Dieter [17] indicated that the per capita consumption of illegal timber varied in countries—i.e., although China is the largest consuming country of illegal timber, its per capita consumption is very small compared to other countries.

2.2. Global Forest Products Model

Another fundamental problem in this study is the evaluation of the potential economic effects of eliminating the production and consumption of illegal timber. The global forest products model (GFPM) [29] is an effective tool to simulate future changes in the global forest sector [30]. The GFPM is a spatial dynamic model that simulates the market equilibrium of 14 forest products in 180 countries [31]. The GFPM has been widely applied in studies of the socioeconomic effects of environmental factors on the forest sector [32]. Thus, the GFPM was used in present study as the analytical tool to evaluate the future effects of eliminating the consumption and production of illegal timber on the added value of the global forest sector. The equilibrium of the global forest sector in the GFPM is described by Equation (1).
max Z = i k 0 D i k P i k ( D i k ) d D i k i k 0 S i k P i k ( S i k ) d S i k   i k 0 Y i k m i k ( Y i k ) i j k c i j k T i j k
where Z is social welfare, i and j are any two countries, k is a type of final product, P is price, D is the demand of final products, S is the supply of primary products, Y is the quantity of processed products, m is the manufacturing cost, T is trade volume, and c is the transport cost per unit, including customs duty and other taxes. The balance of the sum of the value of all final products of all countries to consumers minus the cost of all primary products, the cost of manufacturing, and the cost of transport reaches a maximum when the forest product market reaches equilibrium. This constraint follows the principle that the equilibrium of the global market is determined by the maximum social surplus [33].
In addition, the equilibrium should satisfy resource and technical constraints, including material balance restriction (Equation 2) and the processing chain of forest products (Figure 2).
j T i j k + S i k + Y i k = D i k + n a i k n Y i k n + j T i j k
where a i k n is the quantity of product k to be used to produce each unit of product n in country i. Equation (2) indicates that the sum of import and supply is equal to the sum of consumption and export in any type of product in any country; thus, resource balance and market clearing are obtained. The processing chain of forest products describes the conversion from forest resources to final products. In Figure 2, primary products are processed into final products along the direction of the solid arrow. As indicated by the dotted arrow, industrial roundwood can be utilized to produce fuelwood when the fuelwood price increases to a certain extent.

2.3. Scenarios and Data Source

A base scenario was established as a reference in this study. This scenario describes the future changes in the global forest sector from 2012 to 2030. All the parameters were kept at the default values found in GFPM2015. Two alternative scenarios—namely, consumption and production—were also established to evaluate the economic effects of eliminating the consumption and production of illegal timber. Compared with the base scenario, the alternative scenarios eliminate the consumption or production of illegal timber at a linearly decreasing rate between 2016 and 2020, with all other parameters being equal.
In the GFPM, the mathematical description of demand and supply curves is as Equation (3) and Equations (4) and (5).
D i k = D i k * ( P i k P i k , 1 ) δ i k
S i k = S i k * ( P i k P i k , 1 ) λ i k
S i = ( S i r + S i n + θ i S i f ) μ I ,   and   S i I i
where D * is current consumption at the last period’s price P 1 , δ is price elasticity of demand, S * is the current supply at the last period’s price, λ is price elasticity of supply, r is industrial roundwood, n is other industrial roundwood, f is fuelwood, 0 θ 1 is the fraction of fuelwood that comes from the forest, μ 1 is the ratio of drain to harvest, and I is forest stock.
Shifts of demand and supply curves are the dynamic part of GFPM, which describe impacts of exogenous or endogenous variables. The mathematical description of shifts of demand and supply curves is as in Equation (6) and Equations (7) and (8).
D * = D 1 ( 1 + α y g y + α 0 )
S * = S 1 ( 1 + β I g I + β a g a ) ,   for   k = r , n , f
otherwise    S * = S 1 ( 1 + β y g y )
where g y is GDP periodic growth rate, α y is elasticity with respect to GDP, α 0 is a periodic trend, g I is the periodic rate of change of forest stock, g a is the periodic rate of change of forest area, and β is elasticity. Equation (7) is for the shifts of supply curves of industrial roundwood, other industrial roundwood, and fuelwood, while Equation (8) is for the shifts of supply curves of waste paper and other fiber pulp. Meanwhile, g I and g a are either endogenously determined (including impacts of GDP per capita) or exogenously given.
Equations (3)–(8) indicate that demand depends on last period’s demand and the growth of GDP in the country, while supply depends on last period’s supply and on exogenous or endogenous supply shifters. Apart from the shifter variables defined in the Equations (6)–(8), other shifters and respective elasticities can also be introduced into the GFPM.
The data on the production, import, and export of the 14 forest products (excluding fuelwood), wood chips, and wood residues in the GFPM were obtained from the FAOSTAT database. Given that the base year in GFPM2015 is 2012, the production and consumption of illegal timber in each country were computed in present study with the data in 2012. To ensure the uniformity of the different units (i.e., m3, kg) of the data, the raw wood equivalent (rwe, in m3) was used as the universal unit. The conversion factor for the rwe of each product was elaborated by UNECE (2010) [34]. Considering that the raw data are highly complex, software based on JAVA and Microsoft Access was developed to convert the disordered data into a matrix used to calculate the input–output table. The detailed source code of the software, the raw data, and processed data can be found in the Supplementary Materials.
The default values for shifter variables that describe the future outlook of macroeconomics under the base, consumption, and production scenarios are shown in Table 1. Meanwhile, Table 1 also illustrates the annual eliminating rates of illegal wood fiber consumption and production under the consumption and production scenarios. However, limited by the length of the article, only the data of 20 consuming and producing countries in Figure 1 are given in Table 1. The data of the rest of the countries can be found in the Supplementary Materials.

3. Results

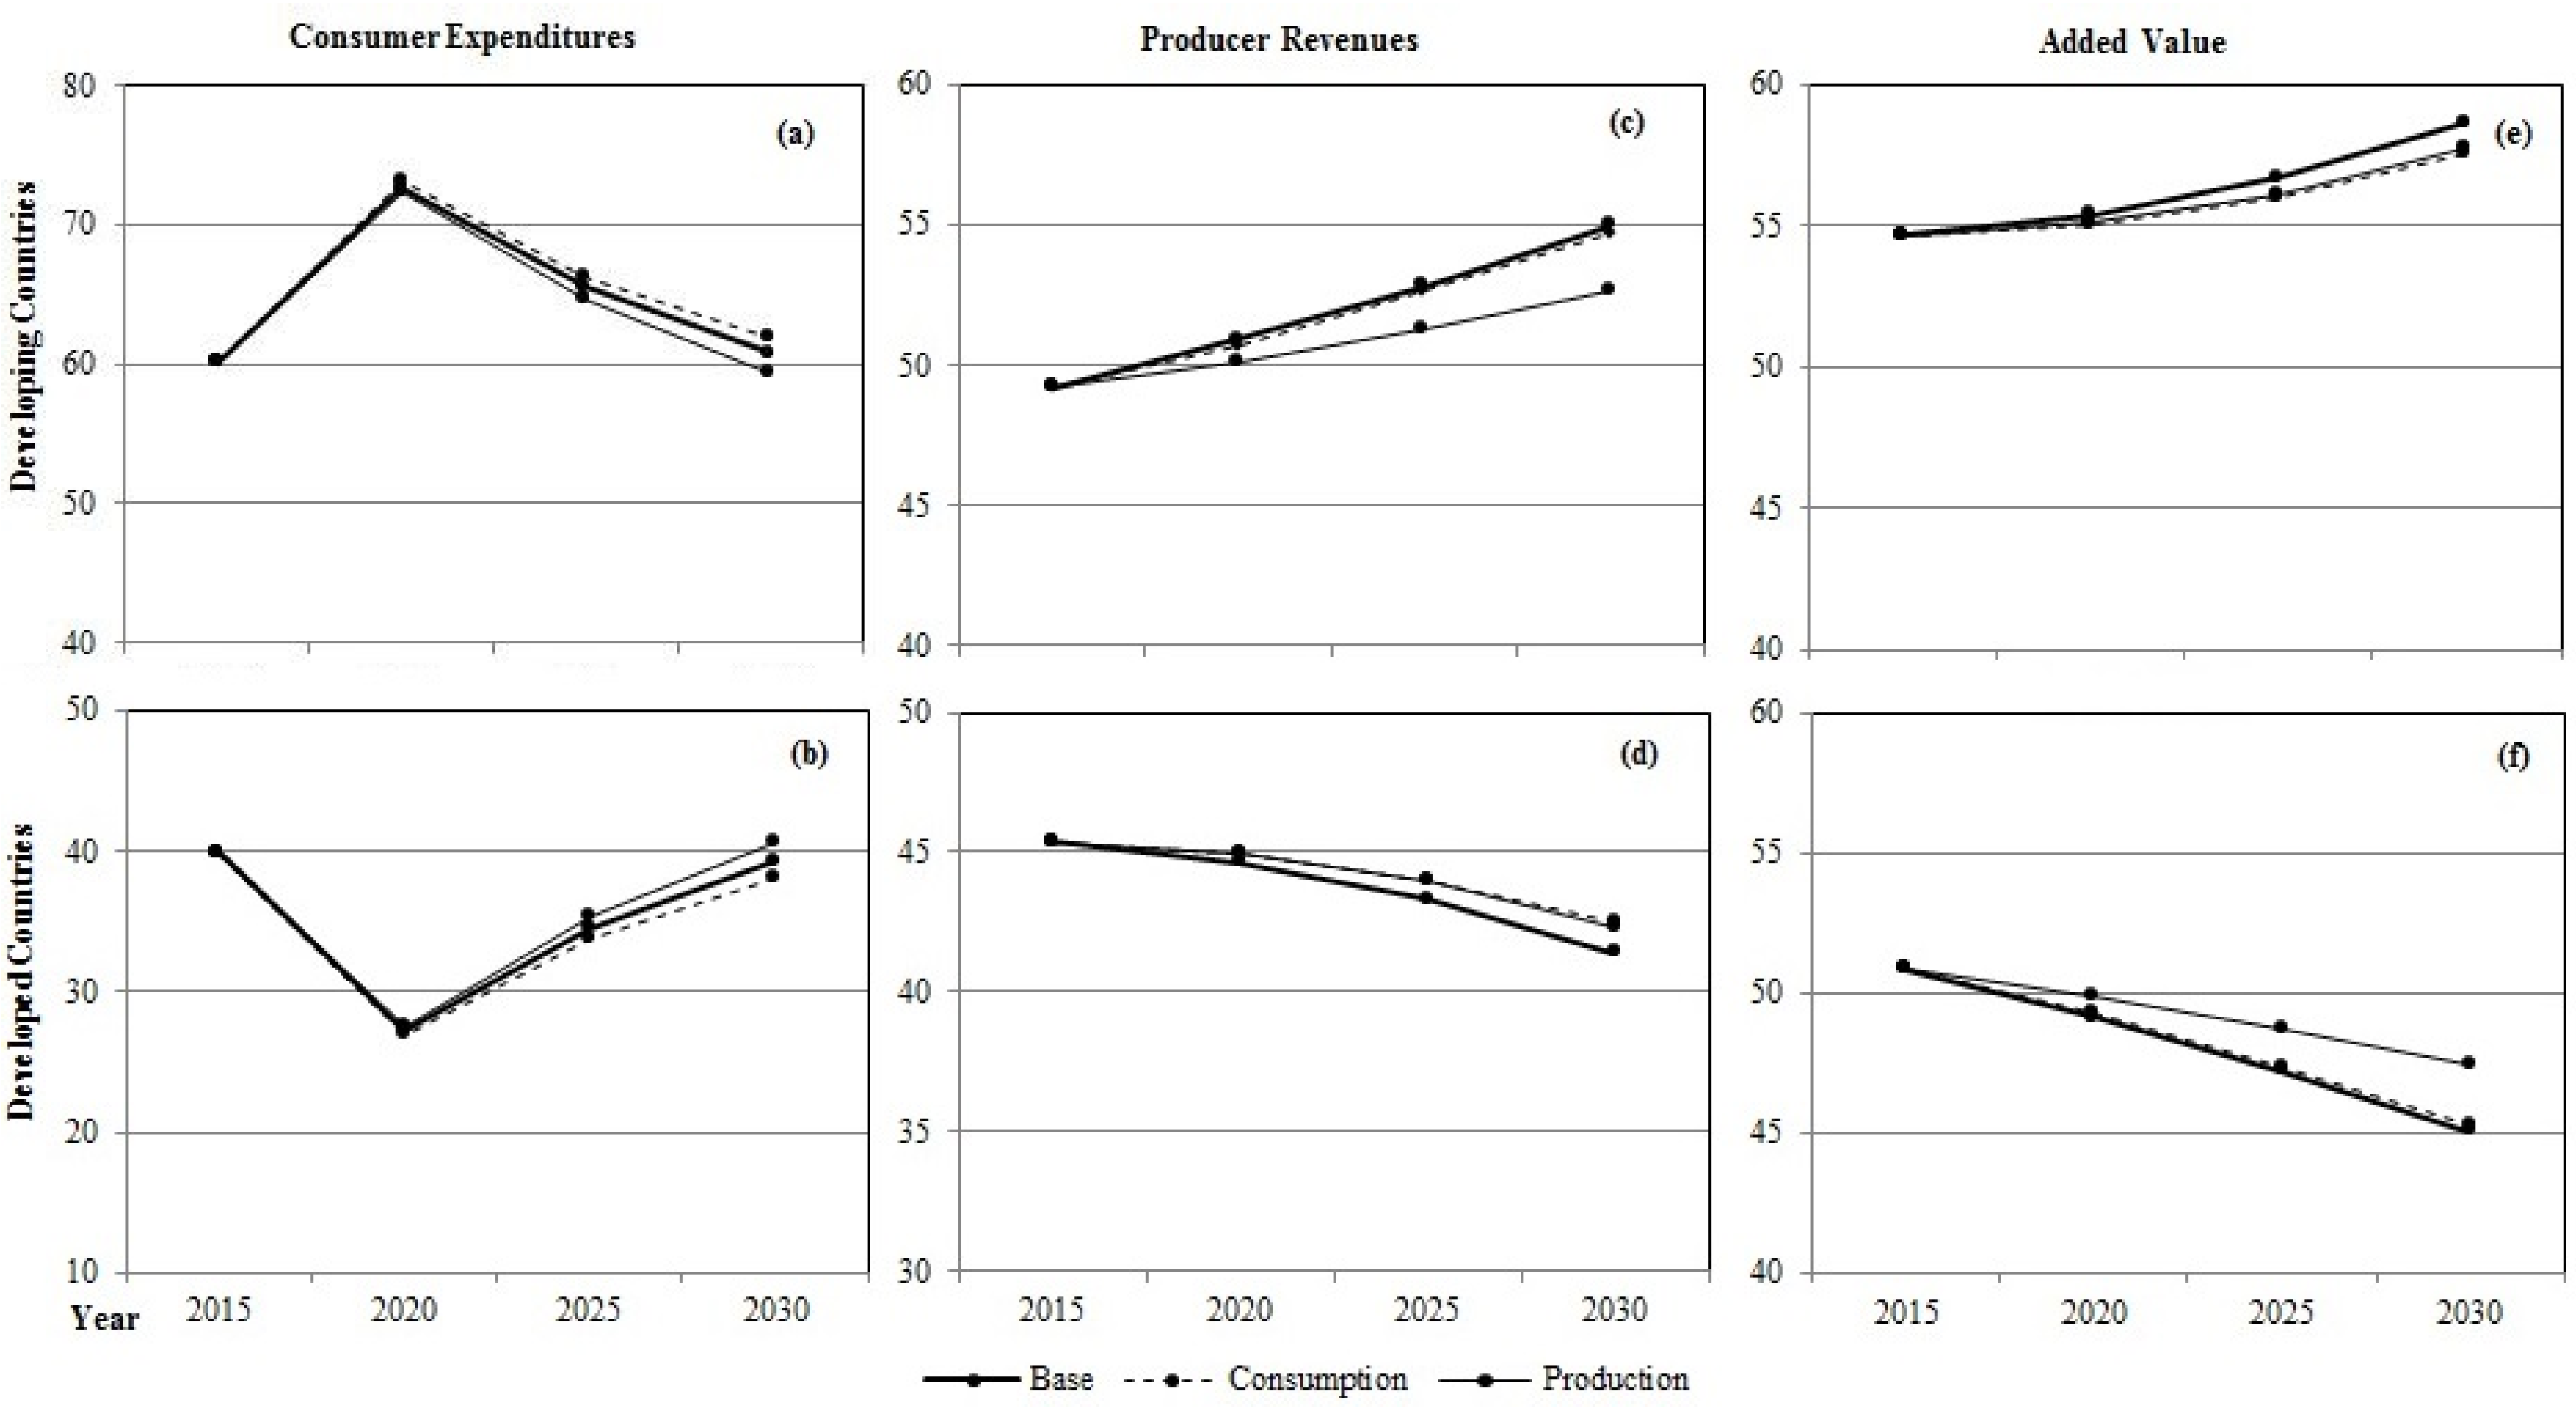
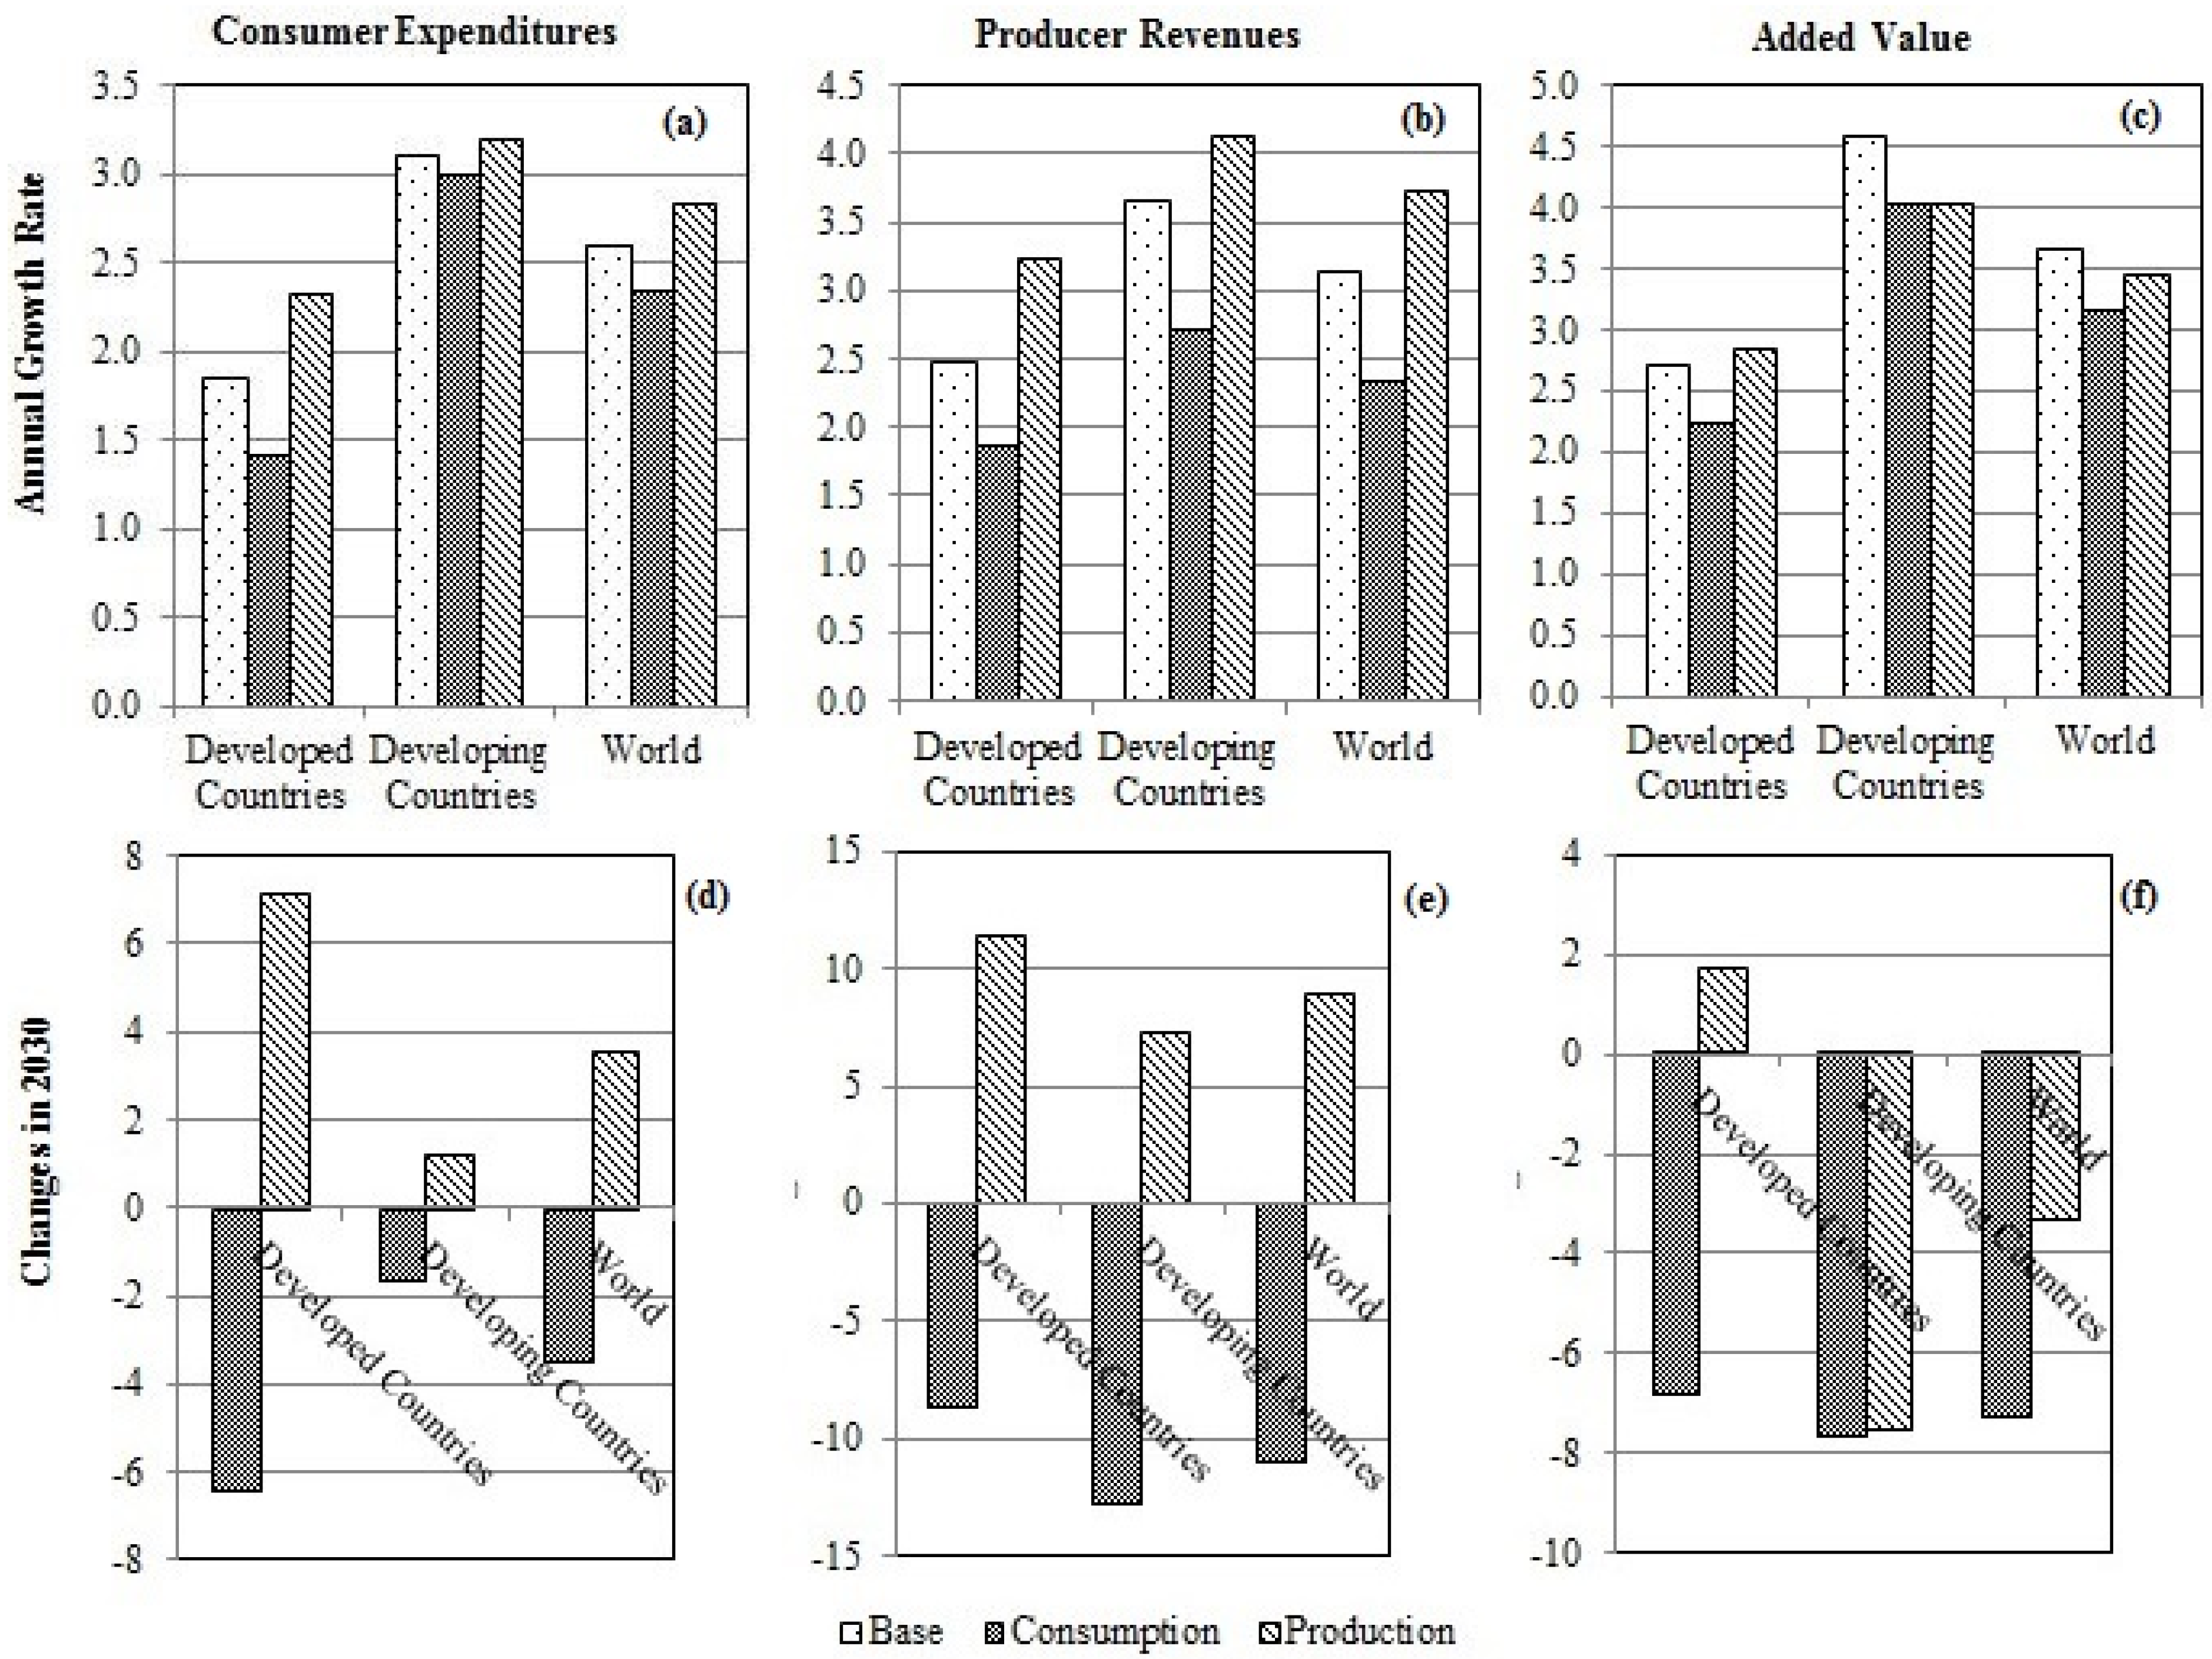
3.1. Global Economic Effects of Eliminating Illegal Timber Consumption and Production

Figure 3 and Figure 4 show the global economic effects of eliminating the production and consumption of illegal timber. Apart from the added value of the global forest sector, the effects on consumer expenditures and producer revenues are also provided in this section to evaluate the impacts on the market scale of the forest sector. In the GFPM, added value is the value of all products minus the cost of wood or fiber input; producer revenues are the sum of the value of production of all the 14 forest products at local prices, whereas consumer expenditures are the sum of the value of production plus imports minus exports for the same products and prices [28]. All the prices and values are in constant US dollars with the purchasing power of 2012.
The added value of the global forest sector would generally decrease by 7.31% in 2030 if illegal timber consumption was eliminated, whereas it would slightly decrease (3.37%) if illegal timber production was eliminated. Hence, eliminating illegal timber production is more economical than eliminating illegal timber consumption at the global level. The base scenario indicates that the added value in developing countries would increase faster than that in developed countries from 2015 to 2030. As a result, the proportion of the added value of the forest sector in developing countries would increase from 48.25% to 54.96% from 2015 to 2030. An increase in the wealth of the forest sector in developing countries would help to decrease illegal logging, because 81.80% of illegal timber production in 2012 was in developing countries, and the alternative scenarios show a similar trend. However, compared with the base scenario, eliminating both consumption and production would slow down the trend. Developed countries would obtain a decrease of 6.84% and even an increase of 1.72% added value in their forest sector in 2030 under the consumption and production scenarios, respectively. On the contrary, developing countries would lose up to 7.70% of added value under the production scenario and 7.54% under the consumption scenario.
The two alternative scenarios show increases in consumer expenditures and producer revenues compared to the base scenario at the global level. Eliminating illegal timber production would lead to additional gains in consumer expenditures and producer revenues (up to 3.55% and 7.23% at the global level in 2030, respectively). Meanwhile, the proportion of producer revenues in developing countries keeps increasing from 2015 to 2030, while the proportion of consumer expenditures undergoes an inverse U-shape, remaining almost unchanged in 2030 compared to that in 2015. Increase in market scale would help to mitigate illegal logging in developing countries. However, except for the consumer expenditures under the consumption scenario, developed countries would suffer a smaller loss or obtain more gains in consumer expenditures and producer revenues compared to those in developing countries under the two alternative scenarios. This trend would limit the long-term reduction of illegal logging.

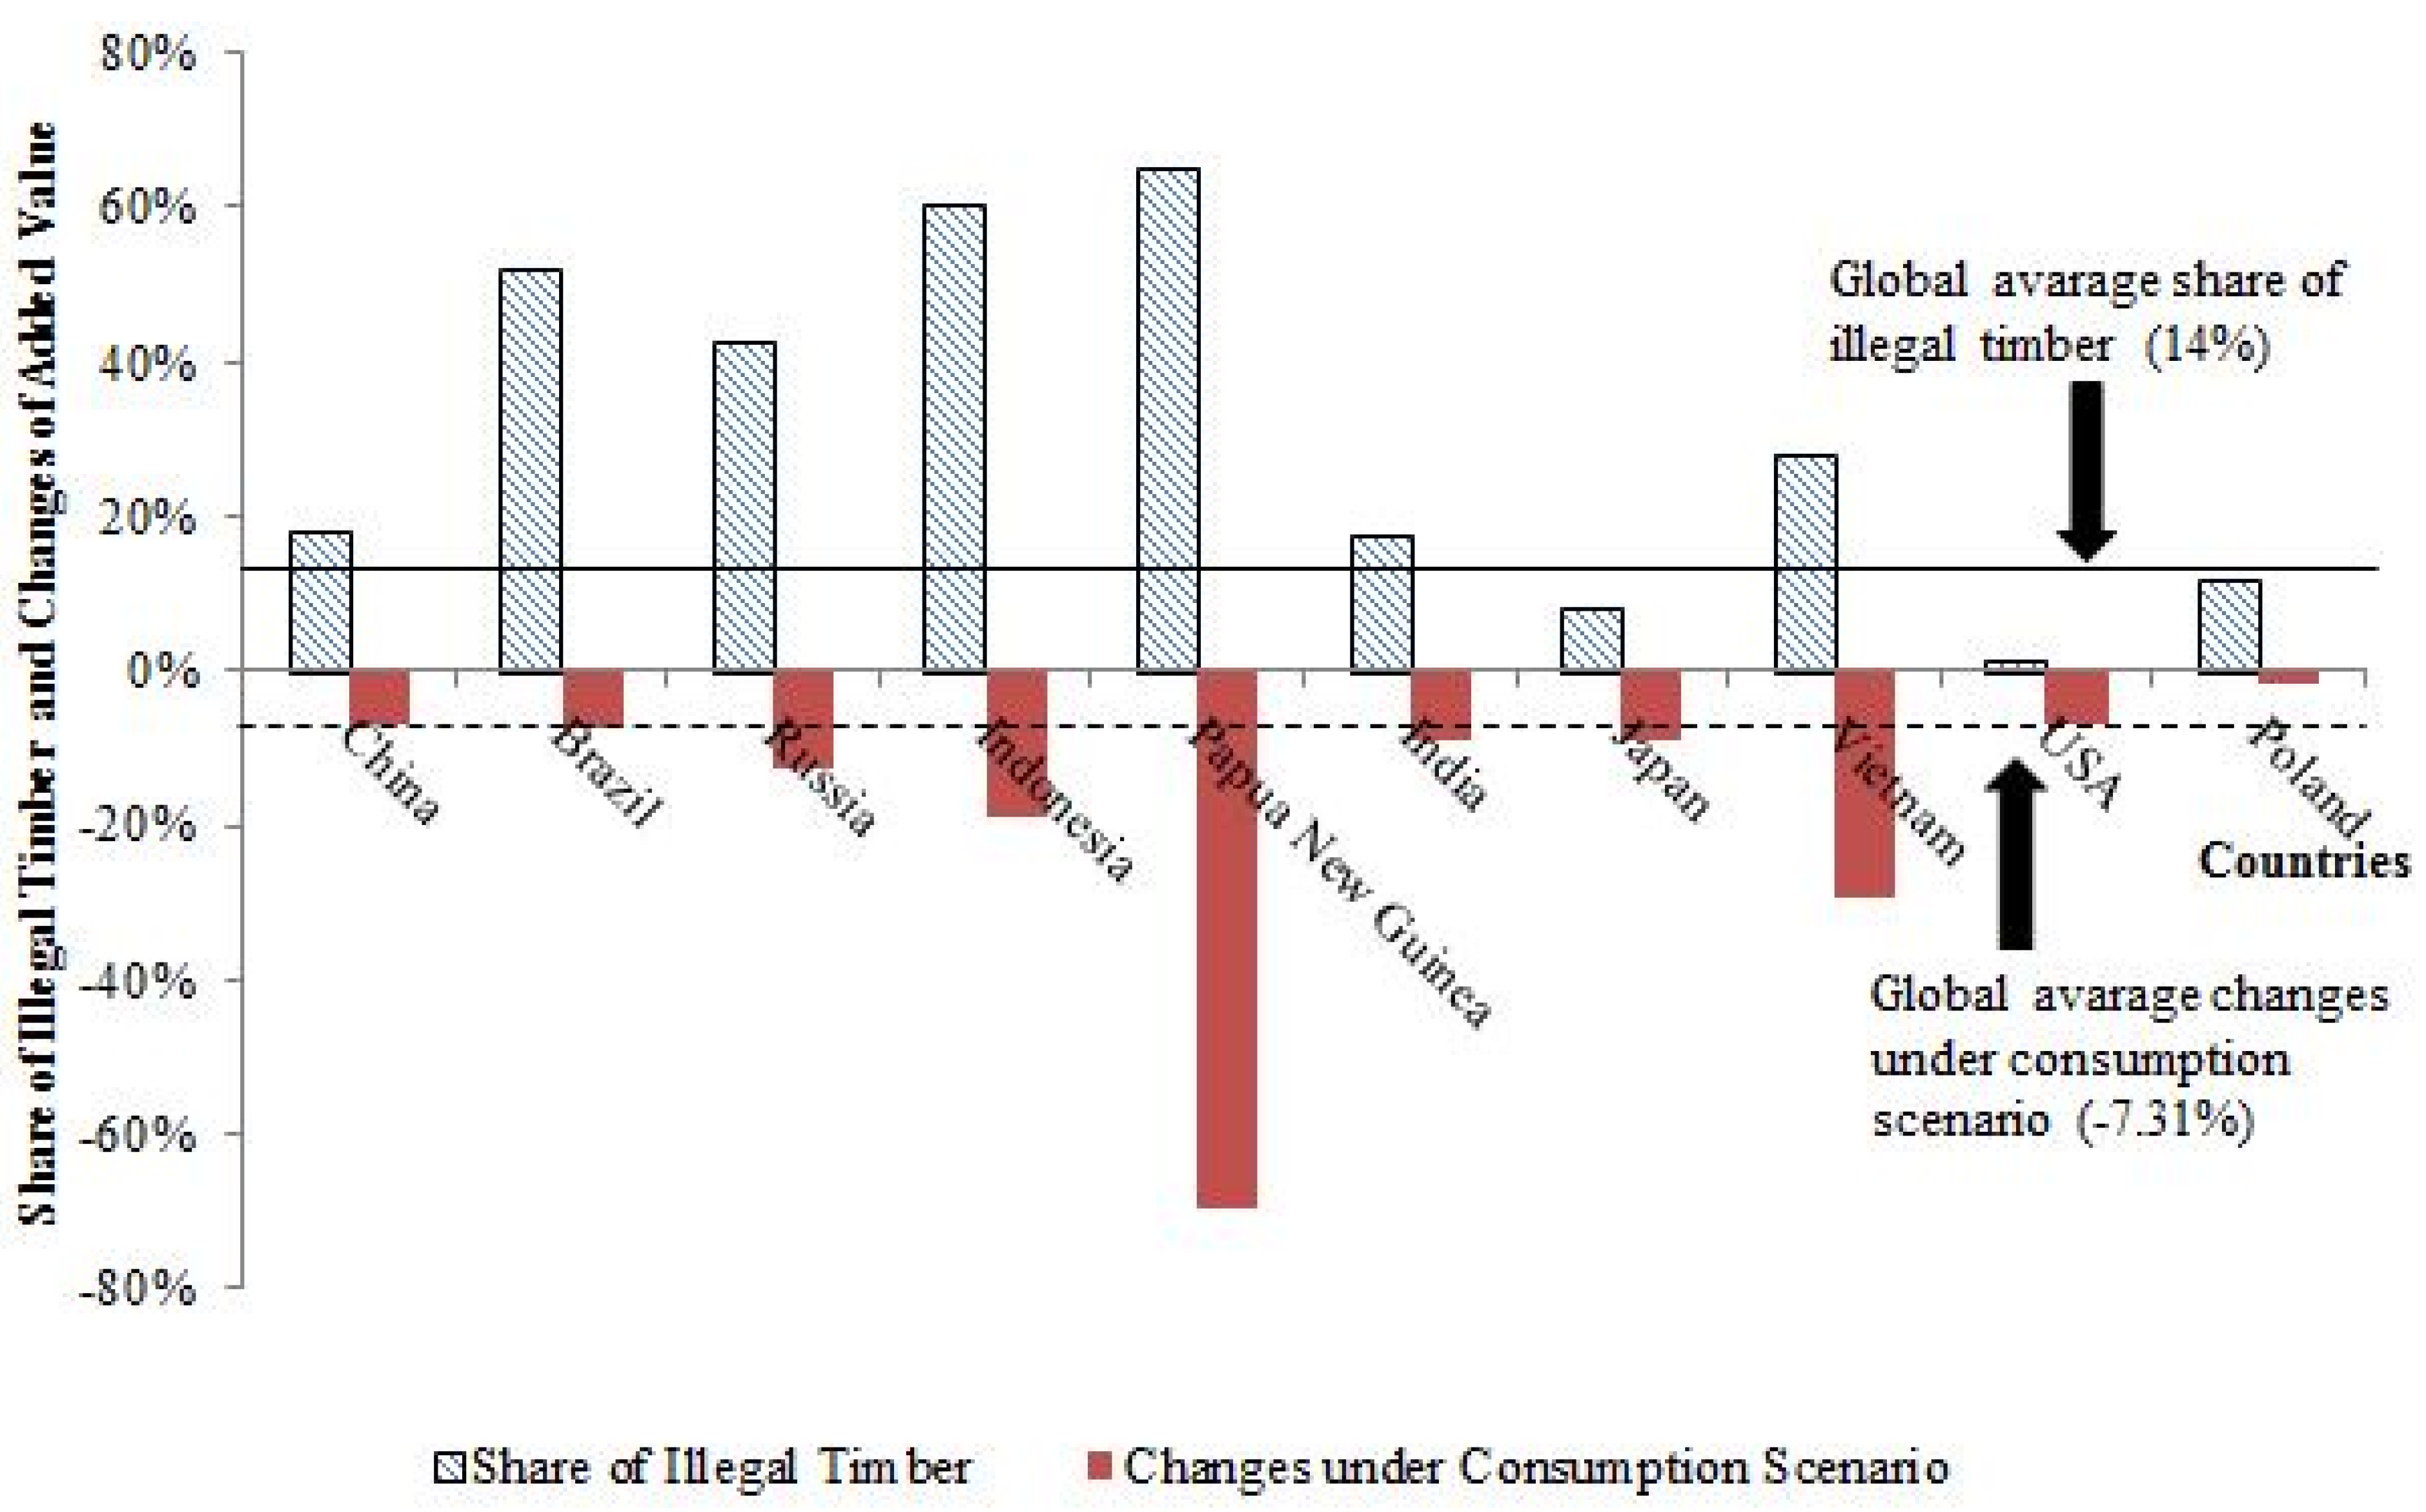
3.2. Economic Effects of Eliminating Illegal Timber Consumption on the Main Consuming Countries

The results of the input–output analysis indicate that the top 10 countries that consume illegal timber are China, Brazil, the Russia, Indonesia, Papua New Guinea, India, Japan, Vietnam, the USA, and Poland; they account for 66.86% of the global illegal timber consumption. The economic effects on the added value of the forest sector in each country are shown in Figure 5.
All of the top 10 consuming countries would face a loss in added value in 2030, ranging from 1.85% to 69.39%. Moreover, Poland, the USA, and China would experience relatively smaller losses (below the global average) compared with the other seven developing countries. Figure 5 also shows that when the share of illegal timber consumption in the domestic demand of final products is large, the loss of added value would be significant. Papua New Guinea, in particular—with illegal wood fiber shares of over 60%—would suffer a loss of up to 69.39% of added value in its forest sector. Generally, the eight developing countries except for China—especially those with the highest shares of illegal timber consumption—would encounter a relatively large cost in their forestry economy if the consumption of illegal timber was eliminated.

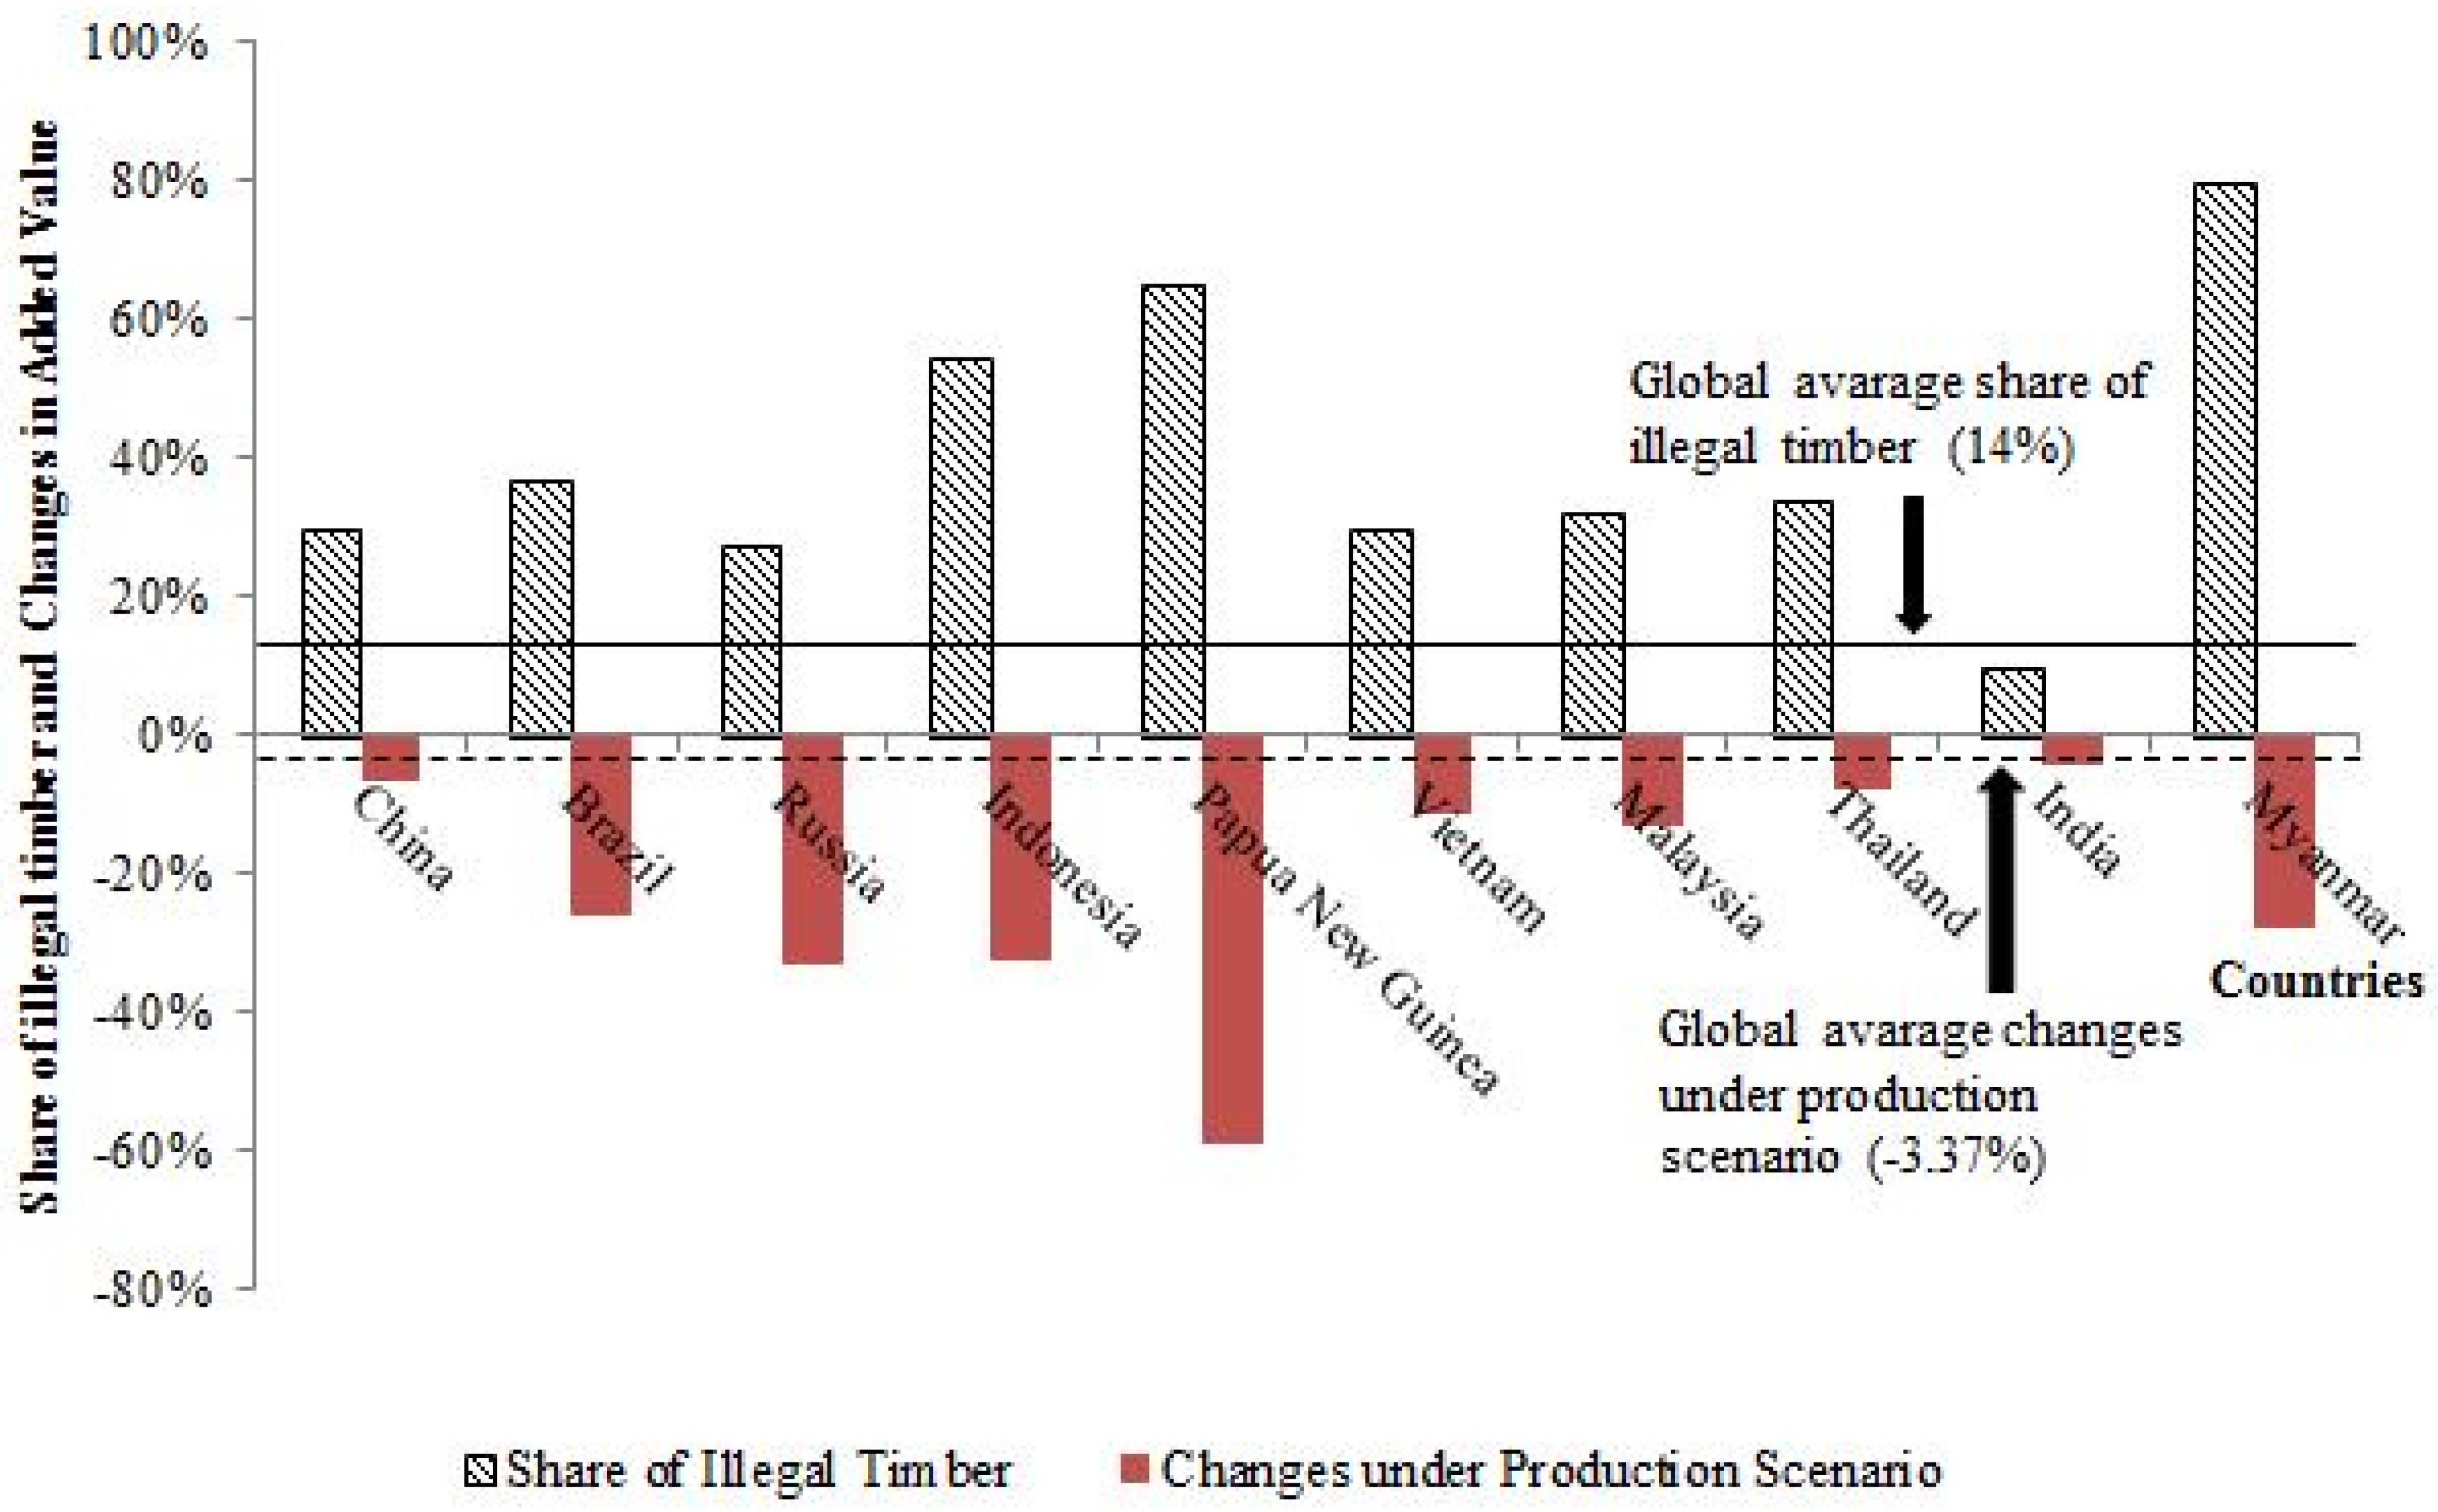
3.3. Economic Effects of Eliminating Illegal Timber Production on the Main Producing Countries

As shown in Figure 4, eliminating illegal timber production is a more economical means of reducing illegal logging than eliminating illegal timber consumption. The economic effects on the main producing countries under the production scenario are analyzed in this section. The top 10 producing countries—namely, China, Brazil, the Russia, Indonesia, Papua New Guinea, Vietnam, Malaysia, Thailand, India, and Myanmar—account for 70.20% of the global production of illegal timber.
As shown in Figure 6, all 10 producing countries would experience a loss of added value ranging from 3.98% to 59.16% in their forest sector. Particularly, Papua New Guinea, the Russia, Indonesia, Myanmar, and Brazil would have a loss of more than one-fourth of added value in their forest sector, and the five other countries would encounter losses less than 13%. Compared with the slight decreases in added value at the global level, the top 10 producing countries would encounter a greater cost in their forestry economy under the production scenario. Compared with those in the consumption scenario, the losses in added value under the production scenario vary by seven of the main producing countries, which are also consuming countries. Brazil, the Russia, and Indonesia would encounter a greater cost in their forestry economy under the production scenario, while China, Papua New Guinea, Vietnam, and India would suffer a greater loss in the added value under the consumption scenario.

4. Discussion

According to Figure 3, Figure 4, Figure 5 and Figure 6, developed countries would encounter a relatively small cost in their forestry economy if illegal timber consumption or production were eliminated, and would even see a larger expansion than the global average in their added value and market scale under the production scenario. In the detailed outputs of this study (see Supplementary Materials), the USA—which is one of the most developed countries and top consuming countries—would even obtain up to a 5.86% increase of added value in its forest sector. Eliminating the production of illegal timber—the more economical means of reducing illegal logging at the global level—will result in uneven distribution of social wealth in the forest sector, and will pass the cost of reducing illegal logging onto developing countries. However, most of the illegal timber is harvested in developing countries, and needs to be motivated by economic incentives, including alternative income-generating options to reduce illegal logging [35]. Thus, developed countries are encouraged to provide financial supports to developing countries to reduce illegal logging.
The results of the input–output analysis in this study are not consistent with those by Dieter [17] in terms of the list of the top 10 consuming and producing countries and the proportions of their shares. One possible reason is the application of more recent data on the production and trade of timber and wood products, and the conversion factor of rwe for each product. In addition, to keep in line with the GFPM, the classification of wood products only covers part of those in Dieter [17], and the end products, including wood furniture [36], are excluded in this study. As a result, the consumption of illegal wood fiber in developed countries is underestimated, while that in developing countries is overestimated. Moreover, the input–output method is on the basis of two assumptions: (1) the illegal wood fiber is a perfect substitute for legal wood fiber; (2) the illegal wood fiber is evenly distributed among products used for domestic consumption and export. Such assumptions would limit the accuracy of the results estimated.
The results also show that eliminating the consumption of illegal timber is more disastrous than eliminating production. One possible reason from a microeconomic standpoint is that consumers will be demotivated to buy wood products because these products get a bad image as environmentally harmful products (illegal logging damaging forest ecosystems). Instead, consumers would switch to buying non-wood products, which causes disaster in the added value of the forest sector.

5. Conclusions

The main contribution of this study is the empirical analysis of the economic cost of eliminating the consumption and production of illegal timber. Eliminating production to reduce illegal logging could be more economical because it would only decrease the added value of the global forest sector by 3.37% compared to what can be expected by eliminating consumption. However, developed countries would gain a greater increase in added value and market scale than the global average in their forest sector if the production of illegal timber was eliminated. Although eliminating illegal timber consumption would lead to a 7.31% loss of added value at the global level, developed countries would suffer less than developing ones. Developing countries would encounter a loss of added value, regardless of whether the consumption or production of illegal timber is eliminated. This trend would be evident especially in Brazil, the Russia, Indonesia, and Papua New Guinea, which are 5 of the top 10 consuming and producing countries. Developed countries are encouraged to provide essential financial support to help developing countries reduce the production of illegally harvested timber.

Supplementary Materials

The following are available online at www.mdpi.com/1999-4907/7/9/191/s1, Annual elimination rate of illegal timber consumption and production.xlsx; Annual elimination rate of illegal timber consumption.xlsx; Data on trade flows of forest products.xlsx; Input data of base scenario in GFPM.xlsx; Input data of consumption scenario in GFPM.xls; Input data of production scenario in GFPM.xls; Input–output Table.xlsx; National population data.xls; National share of illegal timber production.xlsx; Output Analysis.xlsx, Source code of the software.docx.

Acknowledgments

This study was supported by the Key Program of the National Social Science Foundation of China (Grant No. 14AJY014), the China Ministry of Education (MOE) Project of Humanities and Social Sciences (Project No. 13YJAZH114), the China Post-doctoral Science Foundation (Grant No. 2012M521058), and the Jiangsu Province Qinglan Project of China (Grant No. 2012JSQLP). Authors especially thank Mathias Dieter for his detailed explanation for our questions about input–output analysis on the consumption of illegal timber. Authors also thank Joseph Buongiorno for his advice in the operation of GFPM2015 in eliminating illegal timber consumption and production.

Author Contributions

The paper represents the efforts of all the authors. Xiaobiao Zhang drafted this manuscript, established the research paper design and paper methodology, and collected and processed the data. Bin Xu gave review suggestions for the manuscript on the whole writing process. Lei Wang developed the software based on JAVA and Microsoft Access, and help process raw data. Aijun Yang gave suggestions for the input–output analysis. Hongqiang Yang analyzed the data and checked results and manuscript. All the authors have read and approved the final manuscript.

Conflicts of Interest

The authors declare no conflict of interest.

Abbreviations

The following abbreviations are used in this manuscript:
GFPMGlobal Forest Products Model
REDD+Reducing Emissions from Deforestation and Degradation
UNEPUnited Nations Environmental Programme
WWFWorld Wildlife Fundation
UNECEUnited Nations Economic Commission for Europe
FLEGTForest Law Enforcements, Governance, and Trade

References

  1. Dieter, M.; Englert, H.; Weimar, H. Wood from illegal harvesting in EU markets: Estimations and open issues. Landbauforsch. Appl. Agric. For. Res. 2012, 62, 247–254. [Google Scholar]
  2. Cavanagh, C.J.; Vedeld, P.O.; Trædal, L. Securitizing REDD+? Problematizing the emerging illegal timber trade and forest carbon interface in East Africa. Geoforum 2015, 60, 72–82. [Google Scholar] [CrossRef]
  3. Jepson, P.; Jarvie, J.K.; MacKinnon, K.; Monk, K.A. The end for Indonesia’s lowland forests? Science 2001, 292, 859–861. [Google Scholar] [CrossRef] [PubMed]
  4. Kinnaird, M.F.; Sanderson, E.W.; O’Brien, T.G.; Wibisono, H.T.; Woolmer, G. Deforestation trends in a tropical landscape and implications for endangered large mammals. Conserv. Biol. 2003, 17, 245–257. [Google Scholar] [CrossRef]
  5. Alemagi, D.; Kozak, R.A. Illegal logging in Cameroon: Causes and the path forward. For. Policy Econ. 2010, 12, 554–561. [Google Scholar] [CrossRef]
  6. Turner, J.A.; Katz, A.; Buongiorno, J.; Zhu, S.; Li, R. Economie incentives exist to support measures to reduce illegal logging. Int. For. Rev. 2008, 10, 74–80. [Google Scholar]
  7. Lee, J.; Sigmund, K.; Dieckmann, U.; Iwasa, Y. Games of corruption: How to suppress illegal logging. J. Theor. Biol. 2015, 367, 1–13. [Google Scholar] [CrossRef] [PubMed]
  8. Gutierrez-Velez, V.H.; MacDicken, K. Quantifying the direct social and governmental costs of illegal logging in the Bolivian, Brazilian, and Peruvian Amazon. For. Policy Econ. 2008, 10, 248–256. [Google Scholar] [CrossRef]
  9. Carodenuto, S.; Cerutti, P.O. Forest Law Enforcement, Governance and Trade (FLEGT) in Cameroon: Perceived private sector benefits from VPA implementation. For. Policy Econ. 2014, 48, 55–62. [Google Scholar] [CrossRef]
  10. Prestemon, P.J. The impacts of the Lacey Act Amendment of 2008 on U.S. hardwood lumber and hardwood plywood imports. For. Policy Econ. 2015, 50, 31–34. [Google Scholar] [CrossRef]
  11. Ghazoul, J. Barriers to biodiversity conservation in forest certification. Conserv. Biol. 2001, 15, 315–317. [Google Scholar] [CrossRef]
  12. Cerutti, P.; Tacconi, L.; Nasi, R.; Lescuyer, G. Legal vs. certified timber: Preliminary impacts of forest certification in Cameroon. For. Policy Econ. 2011, 13, 184–190. [Google Scholar] [CrossRef]
  13. Lewis, R.A.; Davis, S.R. Forest certification, institutional capacity, and learning: An analysis of the impacts of the Malaysian Timber Certification Scheme. For. Policy Econ. 2015, 52, 18–26. [Google Scholar] [CrossRef]
  14. Li, R.; Buongiorno, J.; Turner, J.A.; Zhu, S.; Prestemon, J. Long-term effects of eliminating illegal logging on the world forest industries, trade and inventory. For. Policy Econ. 2008, 10, 480–490. [Google Scholar] [CrossRef]
  15. Moiseyev, A.; Solberg, B.; Michie, B.; Kallio, A.M.I. Modeling the impacts of policy measures to prevent import of illegal wood and wood products. For. Policy Econ. 2010, 12, 24–30. [Google Scholar] [CrossRef]
  16. Johnson, S. Estimating the extent of illegal trade of tropical forest products. Int. For. Rev. 2003, 5, 247–252. [Google Scholar] [CrossRef]
  17. Dieter, M. Analysis of trade in illegally harvested timber: Accounting for trade via third party countries. For. Policy Econ. 2009, 11, 600–607. [Google Scholar] [CrossRef]
  18. Vézina, P.L. Illegal trade in natural resources: Evidence from missing exports. Int. Econ. 2015, 142, 152–160. [Google Scholar] [CrossRef]
  19. Seneca Creek Associates. Illegal Logging and Global Wood Markets: The Competitive Impacts on the US Wood Products Industry; Seneca Creek Associates: Poolesville, MD, USA, 2004. [Google Scholar]
  20. Miller, F.; Taylor, R.; White, G. Keep It Legal: Best Practices for Keeping Illegally Harvested Timber out of Your Supply Chain. Available online: assets.panda.org/downloads/keep_it_legal_final_no_fsc.pdf (accessed on 30 January 2016).
  21. Contreras-Hermosilla, A.; Doornbosch, R.; Lodge, M. The Economics of Illegal Logging and Associate Trade. In Proceedings of the Round Table on Sustainable Development, Paris, France, 8–9 January 2007.
  22. International Criminal Police Organization (INTERPOL); World Bank. Chainsaw Project an Interpol Perspective on Law Enforcement in Illegal Logging; INTERPOL General Secretariat: Lyon, France, 2009. [Google Scholar]
  23. United Nations Environment Programme (UNEP); INTERPOL. Green Carbon, Black Trade: Illegal Logging, Tax Fraud and Laundering in the Worlds Tropical Forests; United Nations Environment Programme: Arendal, Norway, 2012. [Google Scholar]
  24. United Nations Environment Programme (UNEP). Illicit Wildlife Tracking: An Environmental, Economic and Social Issue. Available online: http://www.unep.org/civil-society/Portals/24105/documents/perspectives/ENVIRONMENT%20PAPERS%20DISCUSSION%20No.14%20LATEST(1).pdf (accessed on 30 January 2016).
  25. Bosello, F.; Parrado, R.; Rosa, R. The economic and environmental effects of an EU ban on illegal logging imports. Insights from a CGE assessment. Environ. Dev. Econ. 2013, 18, 184–206. [Google Scholar] [CrossRef]
  26. Xu, J.; Tao, R.; Amacher, G.S. An empirical analysis of China’s state-owned forests. For. Policy Econ. 2004, 6, 379–390. [Google Scholar] [CrossRef]
  27. Yang, H.; Nie, Y.; Ji, C. Study on China’s timber resource shortage and import structure: National Forest Protection Program outlook, 1998 to 2008. For. Prod. J. 2010, 60, 408–414. [Google Scholar] [CrossRef] [Green Version]
  28. Kaplinsky, R.; Terheggen, A.; Tijaja, J. China as a final market: The Gabon timber and Thai cassava value chains. World Dev. 2011, 39, 1177–1190. [Google Scholar] [CrossRef]
  29. Buongiorno, J.; Zhu, S.; Zhang, D.; Turner, J.A.; Tomerlin, D. The Global Forest Products Model: Structure, Estimation and Applications; Academic Press: San Diego, CA, USA, 2003. [Google Scholar]
  30. Zhang, X.; Yang, H.; Zhang, X.; Hong, Y. Projection of global long-term carbon flow in the forest products trade from a climate negotiation perspective: 2010–2030. Fresenius Environ. Bull. 2015, 24, 3679–3685. [Google Scholar]
  31. Buongiorno, J.; Raunikar, R.; Zhu, S. Consequences of increasing bioenergy demand on wood and forests: An application of the Global Forest Products Model. J. For. Econ. 2011, 17, 214–229. [Google Scholar] [CrossRef]
  32. Latta, G.S.; Sjølie, H.K.; Solberg, B. A review of recent developments and applications of partial equilibrium models of the forest sector. J. For. Econ. 2013, 19, 350–360. [Google Scholar] [CrossRef]
  33. Samuelson, P.A. Spatial price equilibrium and linear programming. Am. Econ. Rev. 1952, 42, 283–303. [Google Scholar]
  34. United Nations Economic Commission for Europe (UNECE). Forest Product Conversion Factors for the UNECE Region. Available online: https://www.unece.org/fileadmin/DAM/timber/publications/DP-49.pdf (accessed on 30 January 2016).
  35. Mukul, S.A.; Herbohn, J.; Bashid, A.Z.M.M.; Uddin, M.B. Comparing the effectiveness of forest law enforcement and economic incentives to prevent illegal logging in Bangladesh. Int. For. Rev. 2014, 16, 363–375. [Google Scholar] [CrossRef]
  36. Yang, H.; Ji, C.; Nie, Y.; Hong, Y. China’s wood furniture manufacturing industry: Industrial cluster and export competitiveness. For. Prod. J. 2012, 62, 214–221. [Google Scholar]
Figure 1. (a) Global production, trade, and consumption of timber and wood products illustrated in an input–output table, reprinted from Dieter [17]. t is bilateral trade, h is domestic harvested wood, r is domestic recovered paper, w is domestic waste wood, u is domestic use, and q is total use (supply); (b) Production of illegal timber in the top 10 producing countries; (c) Consumption of illegal timber in the top 10 consuming countries. Note: all data are in the unit of m3 raw wood equivalent; the data source of (b,c) is Dieter [17]; except for China, all the data is based on high estimation.
Forests 07 00191 g001
Figure 2. Processing chain of the 14 forest products in the global forest products model (GFPM) (adapted from Buongiorno et al. [29]).
Forests 07 00191 g002
Figure 3. Changes of shares of consumer expenditures in (a) developing countries; (b) developed countries under each scenario. Changes of shares of producer revenues in (c) developing countries; (d) developed countries under each scenario. Changes of shares of added value in (e) developing countries; (f) developed countries under each scenario. Note: all values are reported as percentages.
Forests 07 00191 g003
Figure 4. Annual growth rates of (a) consumer expenditures; (b) producer revenues; (c) added value under each scenario. Changes in (d) consumer expenditures; (e) producer revenues; (f) added value in 2030 under each scenario. Note: all the values are reported as percentages.
Forests 07 00191 g004
Figure 5. Shares of illegal wood fiber consumption in the domestic demand of final products and changes in added value under the consumption scenario in the top 10 consuming countries in 2030.
Forests 07 00191 g005
Figure 6. Shares of illegal timber production in the domestic harvested timber and changes in added value under the production scenario in the top 10 producing countries.
Forests 07 00191 g006
Table 1. Macroeconomics and eliminating rate of illegal wood fiber in the main consuming and producing countries under each scenario.
CountriesAnnual Growth Rate of GDP (2016–2030)Annual Growth Rate of GDP Per Capita (2016–2030)Annual Eliminating Rate of Illegal Wood Fiber (Average of All Categories of Products)
Consumption ScenarioProduction Scenario
Brazil5.07%2.77%1.36%2.07%
China7.34%5.03%0.45%1.56%
Russia5.67%3.38%1.10%1.50%
Indonesia8.06%5.22%1.60%3.16%
Malaysia6.40%3.99%0.47%1.72%
Myanmar9.65%7.26%1.20%5.05%
Papua New Guinea8.30%5.25%1.87%4.73%
Poland6.31%5.20%0.29%0.51%
Nigeria8.55%7.33%0.94%1.61%
Latvia5.42%3.23%0.22%1.07%
USA2.19%1.19%0.03%0.00%
Japan1.37%0.32%0.19%0.00%
Thailand6.40%3.66%0.32%1.78%
Bangladesh9.53%6.86%0.43%1.61%
UK2.04%1.04%0.12%0.00%
India8.63%6.28%0.44%0.51%
Note: the second and third columns are used in all the scenarios, while the fourth and the fifth are used in consumption and production scenarios, respectively.

