Article

Quantifying Fire Cycle from Dendroecological Records Using Survival Analyses

1
Canadian Forest Service-Laurentian Forestry Centre, Quebec, QC G1V 4C7, Canada
2
Forest Research Institute, Industrial Chair NSERC-UQAT-UQAM in Sustainable Forest Management, Université du Québec en Abitibi-Témiscamingue, Rouyn-Noranda, QC J9X 5E4, Canada
*
Author to whom correspondence should be addressed.
Forests 2016, 7(7), 131; https://doi.org/10.3390/f7070131
Submission received: 12 May 2016 / Accepted: 16 June 2016 / Published: 28 June 2016

Abstract

:
Quantifying fire regimes in the boreal forest ecosystem is crucial for understanding the past and present dynamics, as well as for predicting its future dynamics. Survival analyses have often been used to estimate the fire cycle in eastern Canada because they make it possible to take into account the censored information that is made prevalent by the typically long fire return intervals and the limited scope of the dendroecological methods that are used to quantify them. Here, we assess how the true length of the fire cycle, the short-term temporal variations in fire activity, and the sampling effort affect the accuracy and precision of estimates obtained from two types of parametric survival models, the Weibull and the exponential models, and one non-parametric model obtained with the Cox regression. Then, we apply those results in a case area located in eastern Canada. Our simulation experiment confirms some documented concerns regarding the detrimental effects of temporal variations in fire activity on parametric estimation of the fire cycle. Cox regressions appear to provide the most accurate and robust estimator, being by far the least affected by temporal variations in fire activity. The Cox-based estimate of the fire cycle for the last 300 years in the case study area is 229 years (CI95: 162–407), compared with the likely overestimated 319 years obtained with the commonly used exponential model.

1. Introduction

Fire is a fundamental process in the natural dynamics of the boreal forest of North America. Quantifying fire regime characteristics is therefore crucial to the understanding of past and present dynamics of the boreal ecosystem as well as for predicting its future dynamics. It has also become a necessary step for many important forest management planning issues. Over the last few decades, there has been a shift from a commodity production-oriented approach to an ecosystem-based approach in forest management that aims to maintain ecological integrity of the boreal forest [1,2]. Fire regimes are central to this paradigm shift as new management strategies are being developed that are better aligned with the characteristics and relative importance of stand-initiating disturbances (fire) and other types of natural disturbances that usually occur at finer spatial scales or that are more selective in nature (e.g., wind and insects). In addition, a total exclusion of fire and replacement by harvesting is economically unrealistic and ecologically questionable [3]. Consequently, there is a growing interest in incorporating fire a priori in strategic forest management planning to prevent eventual shortage in timber supplies caused by fire [4,5,6]. Furthermore, fire is a key element of the carbon cycle in the boreal forest, which makes the quantification of the fire regime necessary to the assessment of the carbon budget of countries and industrial sectors related to the boreal forest [7]. Such assessments can directly affect the effort and levels of mitigation needed to reach atmospheric CO2 stabilization targets in a carbon economy.
An important characteristic of the fire regime is the fire cycle (FC), defined as the number of years required to burn an area equal to the total area surveyed. The FC is equivalent to the mean fire return interval when used from a point-based perspective, and both concepts are also reciprocal to the mean burn rate or fire frequency, depending on whether the term is used from an area-based or point-based perspective [8]. In this study, we will mainly use the term fire cycle.
The FC is generally difficult to accurately and precisely quantify in eastern Canada for several reasons: First, typical fire return intervals are relatively long [9,10,11,12,13,14,15] compared with the maximum longevity of most tree species (generally between 100 and 300 years). In addition, the area burned annually is associated with a large interannual and interdecadal variability as well as subject to observed or suspected long-term trends. Those difficulties are exacerbated by the fact that burned areas only started to be identified, delineated and organized in provincial or national databases in the last few decades [16]. Moreover, aging and “overburning” of the forest gradually erase traces of past fire events. In eastern Canada, most fires typically are stand-replacing, and multiple fire scars are only exceptionally encountered The most reliable estimates of FC currently available for the eastern boreal forests of Canada are those obtained from dendroecological reconstructions, in which the age of the first post-fire tree cohort (most commonly) or fire scars (seldom) are sought to infer the time elapsed since the last fire (TSF) and are then processed in survival analyses (SA). Representative surveys of large landscapes are also sometimes made difficult because of limited road access, which reduces the number of points that can be visited for random or systematic sampling. Aside from allowing us to quantify the FC and relate it to environmental covariates that create spatiotemporal heterogeneity, SA allows us to consider the fire intervals that are known only to a limited extent. That happens when no trace of past fire events can be detected or dated with a sufficient level of confidence, in which case only a minimum amount of TSF can be attributed to the site. The probability of observing such a minimum interval increases with TSF and, consequently, the proportion of such stands across the landscape increases with the length of the FC. They usually become dominant in the landscape when FC reaches or exceeds 200–300 years. It has been shown that those minimum intervals, which are referred to as censored observations in SA literature [17,18,19], represent incomplete but meaningful information that cannot be dismissed as missing observations without introducing major biases [20]. However, an important proportion of censored observations decreases the precision of FC estimates in a way that is similar to decreasing the sampling effort [19], and it may affect accuracy if censoring does not occur in all stands in the same fashion.
Several analytical approaches involving SA have previously been described and used to quantify FC or other closely related metrics [8,21] without necessarily yielding the same results. The general objective of this paper is to assess and compare the accuracy and precision of three different SA-based methods for estimating FC from dendroecological reconstructions of fire history by means of a modeling experiment designed to simulate a range of conditions that are representative of what is typically encountered in such studies [10,11,14,22,23,24]. More specifically, we compare the robustness of three methods in the face of three sources of uncertainty that interfere or limit the estimation of historical FCs: (1) the length of the FC, which, when put in relationship with longevity of the main three species, directly affects the proportion of censored observations; (2) the sampling effort, which is a ubiquitous constraint in empirical field studies; and (3) past variation in fire activity, which has been recognized as a potential bias and source of assumption violation for some analytical approaches [25,26,27,28]. Most of these criticisms are related to the assumption that the disturbance process is stationary, which has been suggested to be unrealistic. We try to assess the extent to which this affects the validity of FC estimation in eastern Canada. The first two methods assessed consist in fitting the negative exponential [29] and the Weibull [30] distributions to the TSF distribution obtained from a representative sample of an area of interest. The third one consists in using the baseline, non-parametric hazard function of a Cox regression model [31] to quantify the length of the FC. Although we provide a brief description of these three methods, the interested reader is invited to refer to specialized literature for a more complete description of the mathematical grounds as well as a wider spectrum of applications of these methods [17,18,19]. Here, our main focus is on the practical implications of using these methods to estimate FC from dendroecological studies. The second objective is to apply the resulting outcomes of this modeling experiment to a case study of a 1.5 Mha boreal landscape of eastern North America.
Before presenting the modeling approach used in this study, we first present some general aspects of SA applied to fire ecology, and the three SA-based methods used to estimate FC. Then, we present the modeling approach and a case study in the Côte-Nord region of Quebec, in eastern Canada.

2. Materials and Methods

2.1. Theoretical Background

2.1.1. Time Intervals, Censoring and Truncation in the Context of FC Estimation Based on the TSF Dataset

Generally, SA involves the modeling of time to event data. Ideally, the date of “birth” and “death” of a subject are both known, in which case the lifespan is unambiguous. However, it is relatively common in survival data to know the length of the lifespan only to a limited extent, i.e., it is at least a certain duration (when the birth is known but not the death, or the reverse situation). This is called a censored observation. The most common type of censoring is right-censoring, and it typically occurs when an experiment is terminated before the event of interest could be observed (the time axis is represented from left to right). Left-censoring is also possible, and it occurs when the lifespan of an individual began prior to the beginning of the experiment with no way of retrospectively determining the moment at which it began. In the present situation, the event of interest is a stand-replacing fire and, in an ideal dataset, two successive fire events would have to be known to observe a closed interval, i.e., uncensored information, e.g., [28,32]. Most of the time, however, it is not possible to obtain such complete information with landscape-scale dendroecologically reconstructed fire history data, especially in regions where fire-free intervals are long. In fact, in a stand-replacing fire context, only one past fire event can usually be dated on each site using archives or dendroecological methods. Fire history is reconstructed by conducting a cross-sectional field survey, sometimes combined with archival data, to obtain a “snapshot” or static image at the time of sampling based on a representative sample or a complete fire map. This approach is mostly applicable to fire regimes that are dominated by stand-replacing fires. A TSF distribution is then obtained and used as survival data.
In eastern Canada, it has been shown that, in the absence of fire for more than 100–150 years, the post-fire cohort is gradually replaced by new trees in the canopy [33,34], a process that erases all traces of the initial post-fire cohort whose age is used to infer TSF. This causes left censoring because the beginning of the lifespan is unknown except for the fact that it occurred prior to the age of the oldest trees, assuming they did not survive the last fire. In the case of cross-sectional field surveys, the entire TSF distribution can also be considered to be censored at the time of sampling because no other fire event has yet to occur. This right-censoring affects all observations. With the type of datasets that are available for the boreal forest of North America, where there is already a relatively high percentage of left-censored observations because of the typically long fire-free intervals and rare complete intervals, we usually consider the time of sampling as time t = 0 to avoid the issue of right censoring, mainly because of the lack of alternatives. In fact, at least one complete time-to-event observation is needed for survival function fitting. Then, we work in reverse time [35,36] to transform cases of left censoring into right censored observations, which is relatively straightforward using standard SA, but it may have important repercussions as it will be discussed below.

2.1.2. Survival Analyses

Survival datasets can be described using several interrelated functions. In statistical terms, the three most important are the cumulative density function, the probability density function and the hazard function. Following the terminology used by Johnson and Gutsell [8], who put these functions in the context of stand-replacing fire regimes, the cumulative density function corresponds to the survivorship distribution function A(t), which is the probability of having gone without fire (survived) longer than time t, that is:
A ( t ) = P ( T < t ) , t 0
The probability density function corresponds to the fire interval distribution f(t), which is the probability of having a fire in the interval t to t + Δt:
f ( t ) = d A ( t ) d t
Finally, the hazard function, or hazard of burning function, is the chance that each element survived to time t and burned in the interval t to t + Δt:
λ ( t ) = f ( t ) A ( t )

2.1.3. Estimating FC Using Parametric Survival Models

Survival data can be fit using parametric models based on many distributions, upon which the most commonly used for FC estimations are the negative exponential and the two-parameter Weibull distribution, the former being a special case of the latter. When fit to the more general Weibull distribution, the survivorship distribution is:
A ( t ) = e ( t b ) c
where e is the Napierian base, t is time, b is dimensioned in time and is the scale parameter, and c is dimensionless and is known as the shape parameter. The negative exponential is a special case of the Weibull distribution where c = 1. Modeled using a Weibull distribution (or negative exponential). The fire interval (probability density) distribution is:
f ( t ) = c   t c 1 b c e ( t b ) c
and the hazard of burning function is:
λ ( t ) = c   t c 1 b c
Here, we can easily see the special case of the negative exponential where c = 1 makes the hazard constant through time (1/b).
From these distributions, it is possible to estimate FC (area-based), or the average fire interval (element-based), which is:
F C = b Γ ( 1 c + 1 )
where Γ is the gamma function. Then again, the equation is considerably simplified when c = 1 as FC equals b. When not fixed to 1, the shape parameter c is adjusted in order to allow the hazard of burning to change over time. The hazard increases with time when c > 1, and decreases with time when c < 1.
In this study, we use the survreg function in R package “survival” [37], which provides maximum likelihood estimates of Weibull and negative exponential parameters.

2.1.4. Estimating FC Using Non-Parametric Models

The Cox regression [31] is the most widely used type of survival regression in general, but it is only recently that it has been more broadly applied to forest fire studies [13,14,24,25,38,39]. The Cox regression is a semi-parametric survival model. One interesting feature of the Cox regression that explains its enormous popularity in other fields is that it does not require that we choose some particular probability distribution to represent survival times. In other words, the underlying hazard function is left unspecified at first, except that it cannot be negative, and it can take any form depending on the empirical observations [19]. The hazard function is the non-parametric portion of the model. Although the baseline hazard (null model) is unspecified, the covariates’ influence, which is the parametric portion of the model, can still be estimated by the method of partial likelihood developed by Cox [31] and presented in the same paper in which he introduced the Cox regression model. Even though the resulting estimates are not as efficient as maximum-likelihood estimates for a correctly specified parametric hazard regression model, not having to make arbitrary (and possibly incorrect) assumptions about the form of the baseline hazard is a compensating feature of Cox’s specification. It is also relatively straightforward to fit a Cox model using the coxph function in R package ”survival” and extract the baseline hazard function using the basehaz function, also part of the R package ”survival” [37]. By default, basehaz yields Nelson–Aalen cumulative hazard estimates [37]. To estimate FC, we simply identify the time t at which the cumulative hazard reaches its maximum value, which makes the calculation of FC quite simple:
F C = Λ ( t ) t
where t is the time at which the cumulative hazard reaches its maximum value and Λ(t) is the corresponding cumulative hazard.

2.2. Modeling Approach

To assess and compare the three above-mentioned SA-based methods for estimating FC, we simulated the aging and burning of a virtual landscape. This allowed us to record a “true” fire history and the associated FC. At the end of each simulation, we simulated the censoring process that naturally occurs around the stand break-up of a post-fire cohort, sampled it, and conducted SA to estimate FC in conditions similar to those that prevail in a real field sampling. Then, we analyzed the differences between SA-based estimates of FC and true FC statistics as a function of the length of the simulated FC, the sampling effort and long-term trends in fire activity.

2.2.1. Aging and Burning

In this study, we simulated a forest landscape as a two-dimensional grid of square pixels that aged at a yearly time step. All pixels (stands) were considered equally susceptible to burn as long as they were at least 1 year old, i.e., they could not burn twice during a single time step. Fires were simulated using simple cellular automata that “ignited” randomly within the simulated landscape and that could spread following queen’s case (eight adjacent unburned neighbors of each ignited cells) until a predefined fire size was reached. We paid no particular attention to the realism of the fire shape, although we set the probability of fire spreading from an ignited cell to an adjacent unburned one to 0.32 to produce irregular shapes that are typical of forest fires.
Virtual landscapes were initiated by randomly assigning to each pixel an age (time since fire; TSF) drawn from an exponential distribution of mean equal to the length of the simulated FC. Simulations ran for 300 years, and TSF values were reset to zero in pixels affected by fire.
The virtual landscape was 2.1025 Mha in size (145 km × 145 km) with a 1-km resolution (100-ha pixels). A 10-cells (10 km) band was cropped out at the end of simulations on the periphery to avoid edge effects that make marginal cells less susceptible to burning if ignition is made random. Consequently, only the 1.5625 Mha central portion of the landscape was considered in downstream sampling and analyses, which roughly corresponds to the size of our case example.
The size of individual fire events was modeled as a serially independent draw from a log-normal probability distribution. The log-normal distribution that we used to approximate burned area size distribution [40] has the following probability density function:
f ( x ; μ , σ ) = 1 x σ 2 π e [ ( ln ( x ) μ ) 2 2 σ 2 ] , x > 0
where x is the fire size, μ is the mean of the natural logarithm of the fire size, and σ is the standard deviation of the natural logarithm of the fire size. The parameters were estimated from the empirical size distribution of all fires ignited by lightning within a 100-km distance from the outermost boundaries of the case study area (n = 123) during 1959–1999 obtained from the Large Fire Database [16].
We modeled different FCs to assess their influence on subsequent survival-based estimators. FC can be calculated as:
F C = T A S ¯ N
where A is the size of the study area, T is the length of the simulation (years), S is the mean fire size, and N is the number of fires. Isolating N allowed us to determine the number of fire events that must be drawn from the log-normal fit of the fire size distribution in order to stimulate each FC scenario.
The fire series was then distributed in time following different temporal patterns, random or structured, allowing for multiple fires in the same years, in which case individual fire sizes were summed up to obtain the annual area burned.
More details about the different fire regimes simulated can be found below, in the Experimental Design section, while additional details about the implementation of the experiment in R can be found in the in the online repository [41].

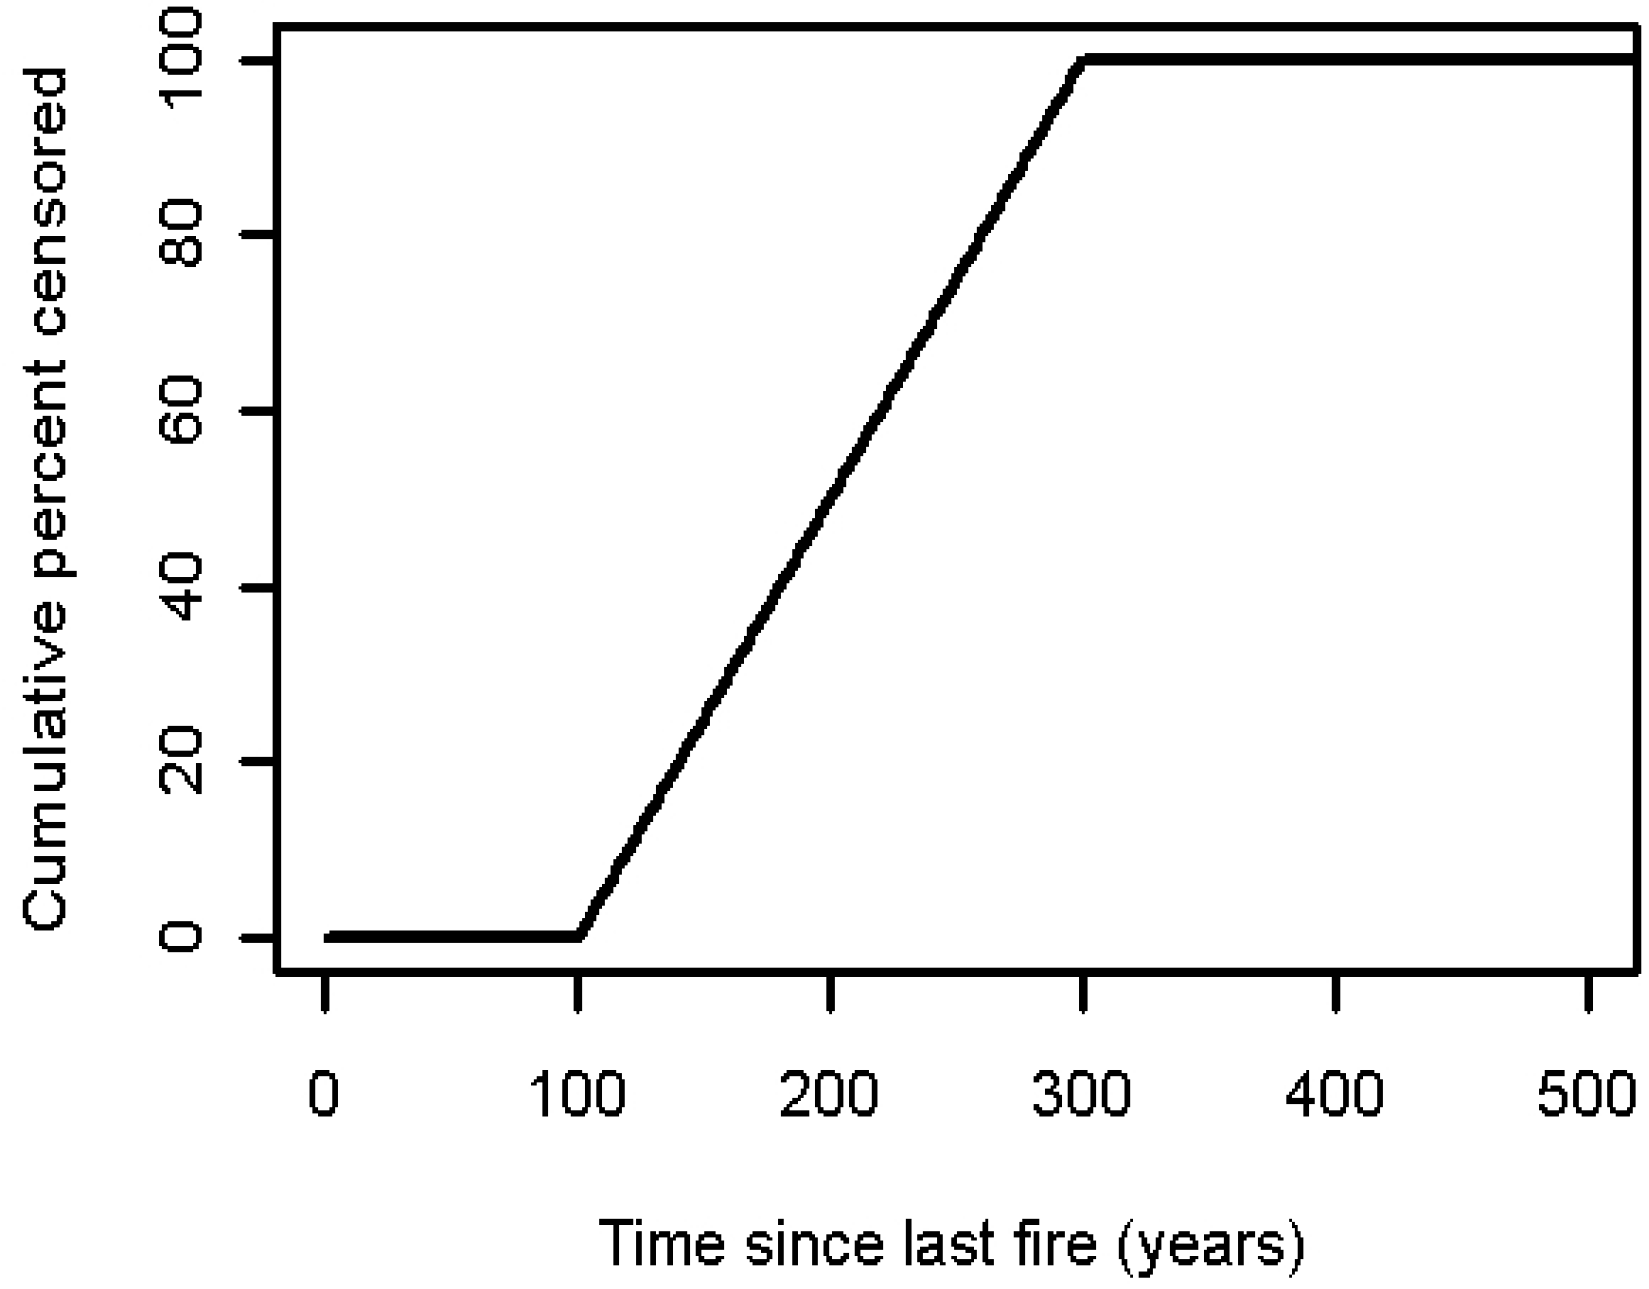
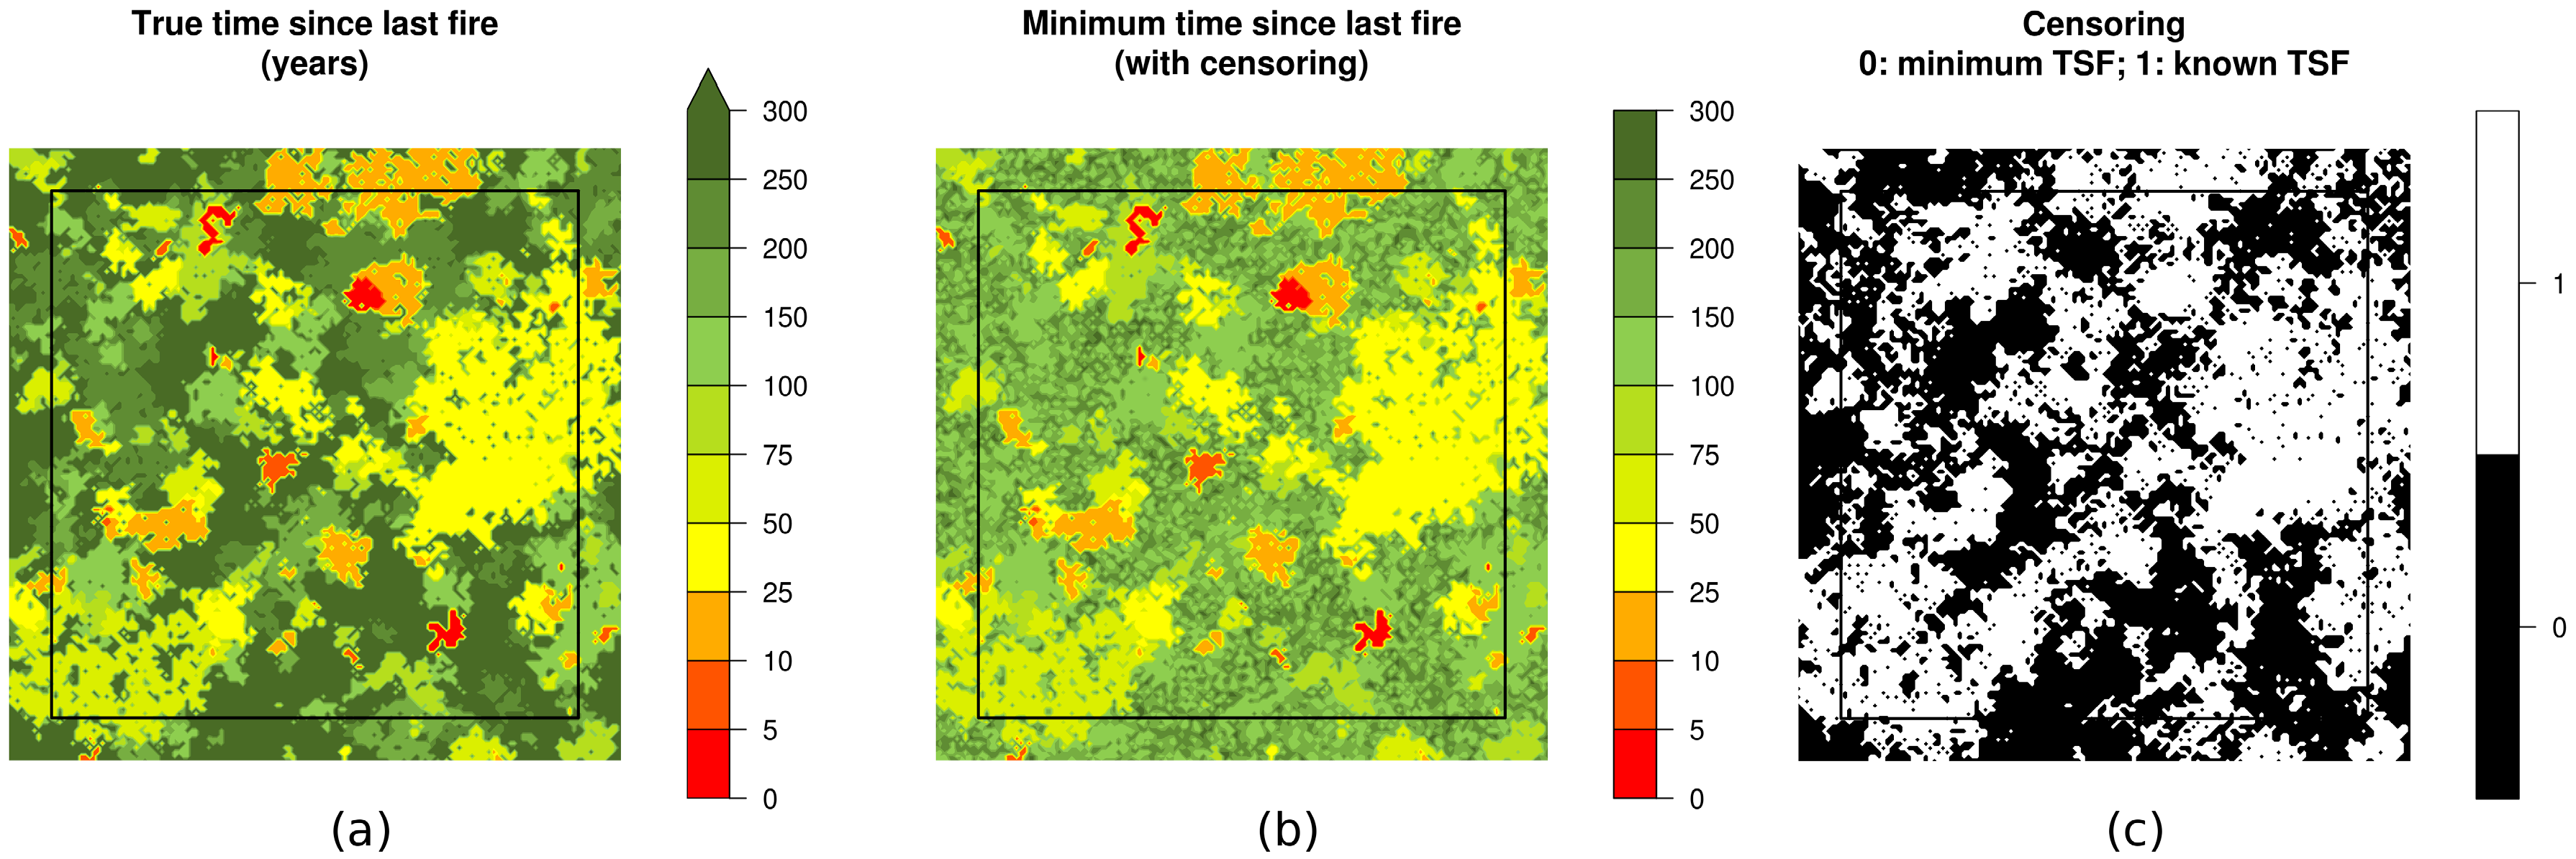
2.2.2. Censoring and Sampling

At the end of each simulation, the virtual landscape was randomly sampled with varying efforts in order to assess the impact of the sampling effort on survival-based estimates of the FC. To model the loss of information that is caused by the aging of the forest, when traces of the initial post-fire cohort gradually disappear, thus making it impossible to date the last fire event from the within-stand age structure, we applied a linear censoring function (Figure 1). This function determines the probability that a sample of particular TSF will be censored. It was decided from the authors’ personal experience in reconstructing fire history in eastern North America that a linearly increasing probability of censorship between TSF = 100 and TSF = 300 was a valid approximation of what is generally observed in the boreal forest of eastern North America. Stand break-up usually occurs between 100 and 150 years, depending on the species [34], but a successful determination of TSF is often possible for several decades after the initial post-fire cohort breaks up as veteran stems are targeted in dendroecological sampling. Fires that occurred over 250 to 300 years earlier are almost never dated as this period of time roughly corresponds to the longevity of the longest-living and most common species in the area covered by our case study, i.e., black spruce (Picea mariana Mill. BSP).
The implementation of the censoring function is straightforward: for each TSF observation between 100 and 300 years, one value is drawn from a uniform set ranging between the same values, indicating the time at which TSF would become censored. If the true TSF value is lower than the drawn value, it remains unchanged and uncensored. On the contrary, if the drawn value is equal or lower than the true TSF, it replaces it as the minimum measurable TSF (censored observations).

2.2.3. Experimental Design

We simulated FCs of four different lengths (62.5, 125, 250 and 500 years) to assess their influence on subsequent survival-based estimators. The range of FCs covered was partly based on the range of conditions that can be found in fire-driven North American boreal forests, but also on the range within which SA can actually be useful considering the inherent limits of dendroecological fire history reconstruction methods in those systems.
Because considerable temporal variations in fire activity have been documented in most regions, we also wanted to assess the impacts of such patterns on the survival-based estimation of FC. Thus, for each FC length, we simulated three different fire regimes that followed distinct temporal trends in fire activity. First, constant fire regimes were simulated for each FC, i.e., the fire series drawn from the log-normal fire size distribution were distributed randomly during the course of the 300-year simulations. We also generated fire series that were correlated with the simulated years, i.e., some simulations were subject to increasing fire activity, while others were subject to decreasing fire activity, although they presented the same fire activity when averaged over the entire simulation. To implement that, we imposed a 0.5 and a −0.5 correlation coefficient between annual area burned and simulated years for regimes with increasing and decreasing fire activity, respectively.
A total of 12 distinct fire regimes were thus simulated (4 distinct FCs × 3 distinct temporal patterns).
For each of those treatments, we conducted 100 independent simulations, at the end of which we drew 100 independent samples for each predefined sample size (Table 1).

2.3. Analysis

2.3.1. Assessment of Accuracy and Precision of the Estimated FC

To assess the accuracy of each survival-based method of estimation, we first recorded the exact true FC over the course of the entire 300 years, which varied around the target FC because of the stochasticity of the fire series drawn. Then, we computed the three survival-based estimates (Cox, Weibull and Exponential) with varying sampling efforts. By analyzing how the residuals (estimated minus true value) were distributed as a function of the fire regimes simulated and the sampling effort, we produced a first general assessment of the accuracy and precision of each method and its relative sensitivity to the conditions under which estimates were obtained.
We also wanted to assess whether it was possible to report valid quantification of the uncertainty associated with the estimated FC. Thus, we computed 95% confidence intervals (CI95) by bootstrapping (10,000 resamplings). The CI95 were computed using the “boot.ci” function of the R package “boot” [42], which implements various types of non-parametric confidence interval. Here, we present four of those: Basic bootstrap intervals (basic), first-order normal approximations (norm), bootstrap percentile intervals (perc), and adjusted bootstrap percentiles (BCa). More details about each method can be found in the package documentation, and the formulae on which the calculations are based on can be found in Davison and Hinkley [43]. We used those CI95 and verified whether they achieved the advertised nominal level of coverage of 95%, i.e., whether the reported CI95 indeed included the true FC 95% for the time period. Higher coverage (> 95%) would indicate that the reported CI95 are too wide (conservative), and inversely.

2.3.2. Case Study

We also aimed to quantify FC in a coniferous boreal landscape of eastern Canada in light of the information that was sought about the accuracy and precision of the three above-mentioned SA-based methods. The case study area covers 15,961 km2 (1.5961 Mha) of boreal forest in eastern Quebec, specifically in the Côte-Nord region, between longitudes 67.00° W and 69.00° W and between latitudes 49.00° N and 50.25° N (Figure 2). This region has a cold, maritime climate with an average annual temperature of 1.7 °C and average precipitation of 1001 mm, measured in Baie-Comeau, in the southwest corner of the study area. Precipitation is evenly distributed during the year, and is about 70% rain [44]. The topography is moderately uneven with high hills with rounded summits and many rocky escarpments. The highest hills, located in the northeastern part of the area, are just over 700 m high, while other sparsely distributed hills are above 500 m high. The average elevation ranges within landscape subunits vary between 150 m and 200 m. Three of these landscape subunits, as described by Robitaille and Saucier [45], make up for almost the totality of the case study area. The average slope is 15%. The hydrography is complex with numerous small lakes and rivers of varying sizes, some of them very large. The configuration of the topography produces a drainage system with a mainly north–south orientation [45]. There are rocky outcrops on slightly more than a third of the total land area, while the rest of the land area consists mainly of shallow tills on sloping areas and deep tills at the bottom of slopes. To a lesser extent, there are glaciofluvial deposits on valley floors [45].
Black spruce and balsam fir (Abies balsamea (L.) Mill.) are the dominant species, making up a very well connected coniferous matrix, along with white spruce (Picea glauca (Moench) Voss) and white birch (Betula papyrifera Marsh.). Also found in the region, but more sporadically, are trembling aspen (Populus tremuloides Michx.) and jack pine (Pinus banksiana Lamb.), mainly in recently burned areas. Tamarack (Larix laricina (Du Roi) K. Koch) can also be found along with black spruce in a few rare hydric stations in the region.
Information from various sources has been used to compile the fire history of this area. All fires affecting a surface area of one or more hectares that have occurred since 1941 are listed in Quebec’s Ministère des Forêts, de la Faune et des Parcs’s archives (MFFPQ-Direction de l'environnement et de la protection des forêts), and aerial photographs dating back to 1931–1932 were interpreted in order to map two older fires (1923 and 1896). In some areas, dendroecological surveys conducted for decadal forest inventories of the MFFPQ were used to assess the amount of time elapsed since the most recent fires. In order to take full advantage of these available data and focus our efforts on ground sampling in areas where the fire history was less known, a preliminary TSF map of the area was created. This rough demarcation included recently mapped fires and sections of the study area covered mainly by even-aged forests of black spruce, which were determined with the help of dendroecological surveys carried out during the MFFPQ’s forest inventory campaigns.
A total of 94 points made up the final sample. The MFFPQ map archives were used to directly assign a fire date to some recent fires, i.e., 12.8% of cases. Dendroecological analyses were used to estimate the time interval elapsed since the most recent fires for the rest of the sample, based on data gathered in the MFFPQ’s decadal inventories (37.2%) and during the sample-gathering campaign carried out for this study (50%). The time intervals since the most recent fires, estimated with the help of the dendroecological surveys, were inferred based on the conventional methods of Arno and Sneck [46]. At each site, between 10 and 15 dominant trees were cut at the root collar and dated. Fire dates were deemed sufficiently reliable if they concerned even-aged stands of a pioneer species that commonly establishes itself after fire. A minimum age (censored data) was assigned to uneven-aged stands, i.e., where a 20-year interval included less than 60% of the sampled dominant trees. However, a visual examination of each stand’s age structure suggested that this 20-year interval was too restrictive in the case of some of the older stands that seemed in fact even-aged, probably because of an increasing imprecision of dating with stand age, and we thus chose to extend it to 30 years for stands older than 200 years. A minimum age was also assigned to stands consisting primarily of one species that usually does not establish itself after fire, such as balsam fir, independently of their age structure.
In that data set, no points where two distinct fire dates are known were present. Thus, there were no closed fire intervals.
The median fire-free interval was estimated at 191 years in a previous study [47], and a preliminary estimate of FC based on a negative exponential fitting of the survival data was 295 years, with 53.2% of the observed TSF censored.
Fire behavior in the study area is known to be characterized by large, intense, stand-replacing fires. The largest fire that occurred in the area in recorded history was a little over 200,000 ha in size and partly affected the southwestern portion of the case study area [16]. Some exceptional sites show multiple-scarred jack pines that suggest an alternative, more frequent and less severe fire regime. However, this possible alternative fire regime will be ignored in the present study because the scarcity of evidence suggests that it does not play a major role in structuring the landscape in general. However, it might explain in part the distribution of fire-dependent jack pine in that area, which is otherwise characterized by generally long fire-free intervals.

2.3.3. Estimation of FC in the Case Study Area

The empirical survival data obtained from the field survey in the case study area was submitted to the three above-mentioned methods to estimate FC (negative exponential fitting, Weibull fitting, and Cox regression). Associated CI95 were computed by means of bootstrapping consisting of 10,000 resamplings of the original empirical sample using the same methods as those assessed in the simulation experiment presented here, i.e., basic, normal approximations, percentiles, and adjusted percentiles.

3. Results

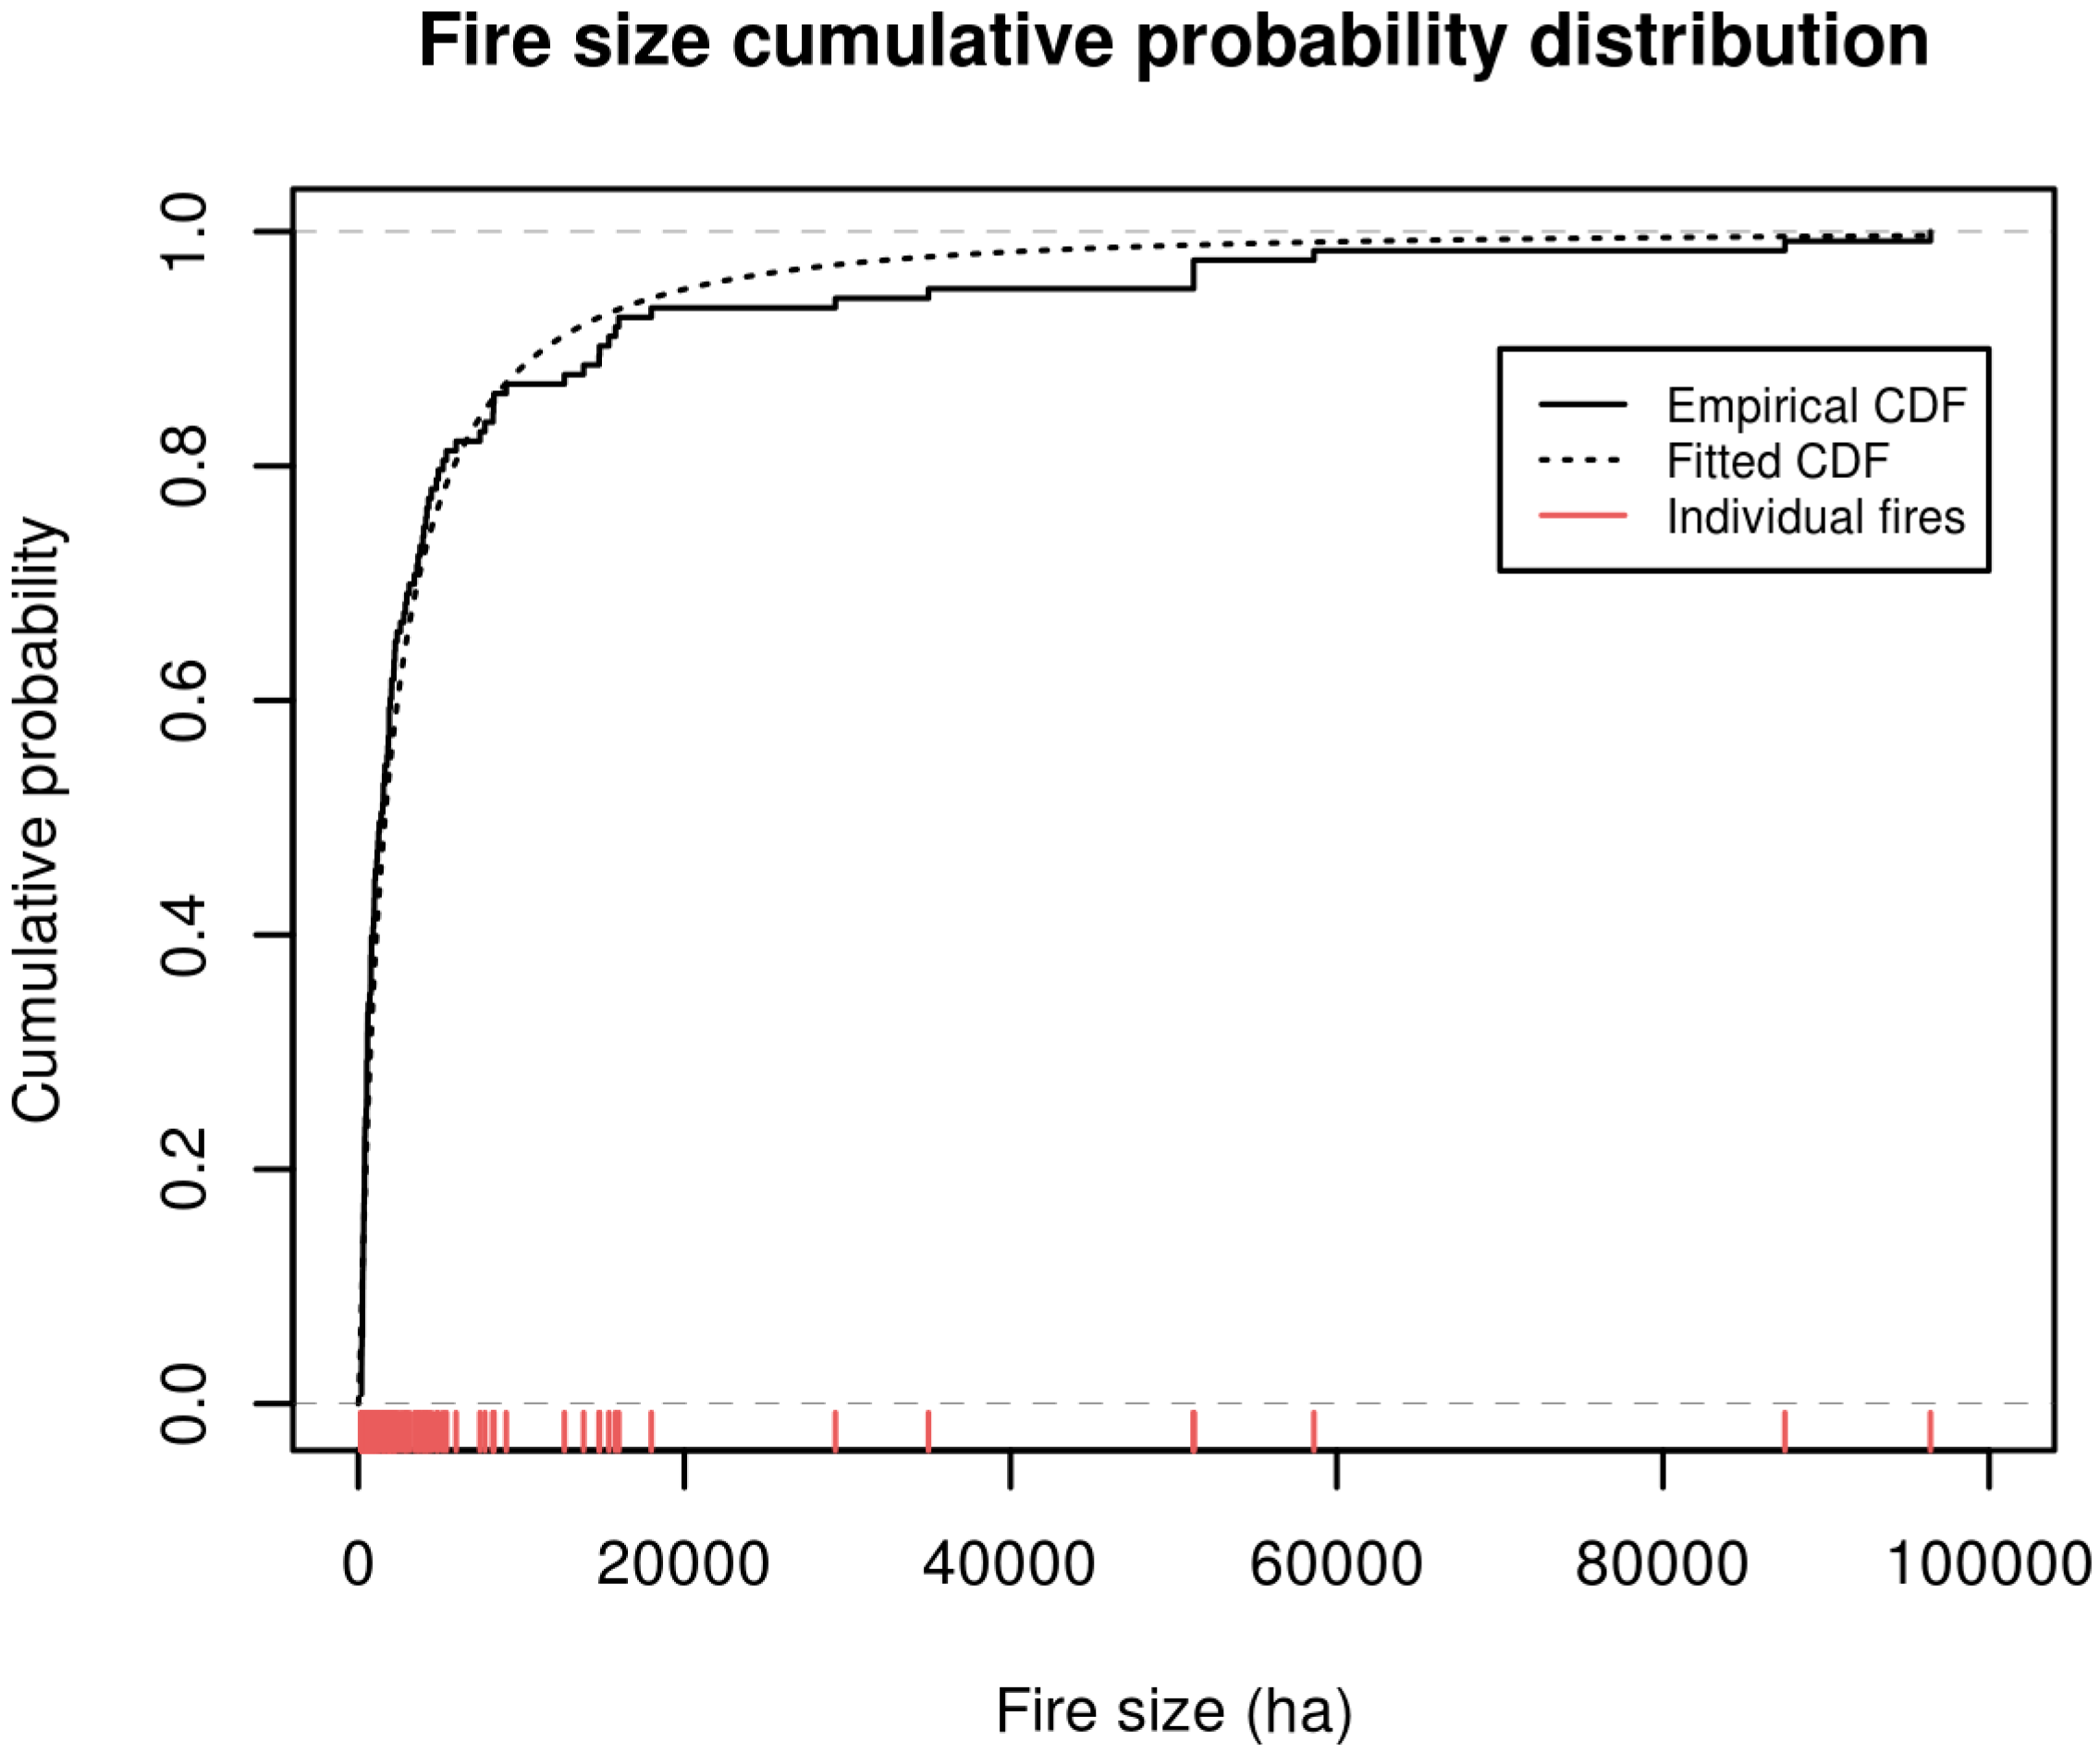
3.1. Empirical Fire Size Distribution

Fire size distribution is the only part of the simulation experiment that directly depends on empirical data. The mean size of recorded fires ignited by lightning within a 100-km radius of the case study area is 6365 ha. The maximum likelihood estimates of the log-normal distribution that was fit to the empirical size distribution of individual fire sizes are μ = 7.406 (SE = 0.136) and σ = 1.511 (SE = 0.096) (units: ln (ha); Figure 3). Individual fire sizes were drawn from this log-normal distribution for all simulations.

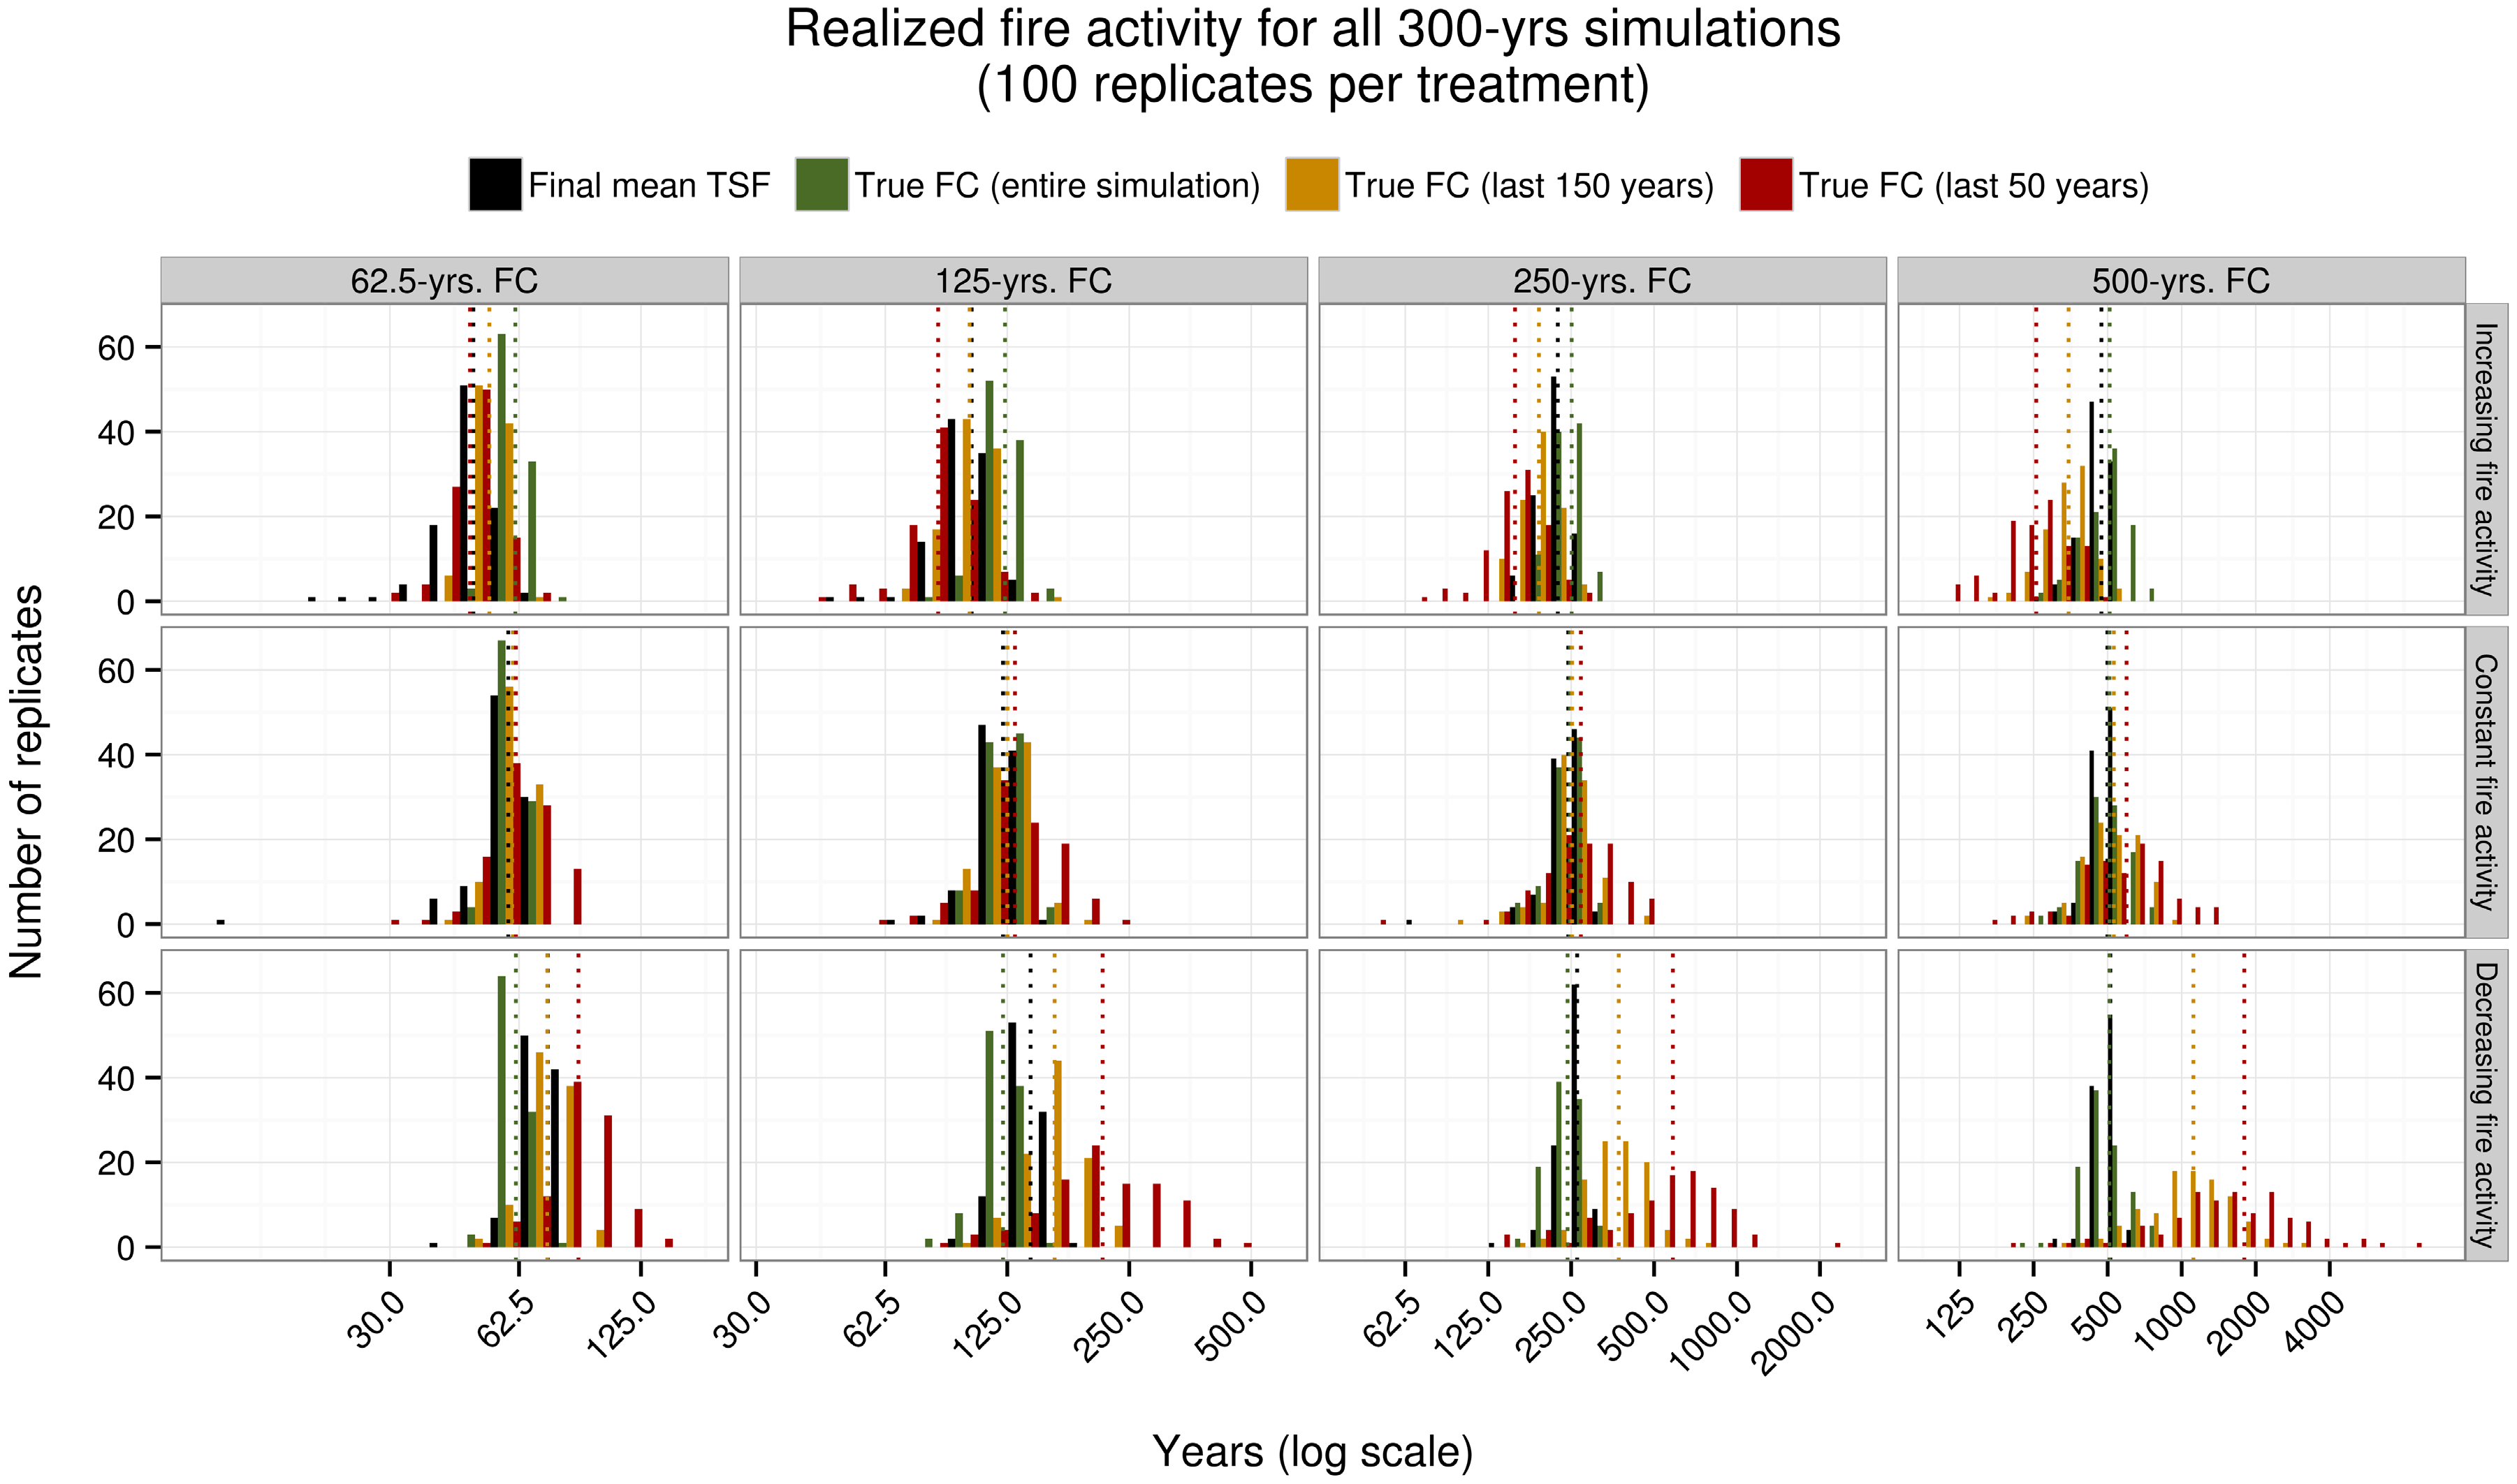
3.2. General Description of Simulation Dataset

A total of 1200 simulations made up the dataset on which subsequent processing and analyses were conducted. In these simulations, aging and burning occurred in a relatively simple manner that produced a pixelated mosaic of “stands” to each one of which was attributed a TSF value. Even though we aimed at producing specific fire regimes, the resulting FC varied because of the stochastic approach we adopted for simulating fires (Figure 4). Nevertheless, all treatments were contrasting enough to nicely cover the range of landscape conditions that we wanted to simulate and submit to simulated dendroecological samplings and FC estimation.
Generally, mean TSF roughly equals the length of the FC when the fire regime is constant. Alternatively, the shorter the FC is, the more mean TSF is linked to recent fire activity, i.e., increasing or decreasing trends in fire activity will affect the age of the simulated mosaic in a similar fashion. Moreover, the link between recent fire activity and mean TSF will be stronger when the length of the FC is shorter. A given landscape can be made drastically younger by more frequent large fires whatever its age previous to the burn, and while it can only get older one year at a time, one year is proportionally more important in younger landscapes, all of which is reflected in Figure 4.
Once FC statistics had been recorded, we mainly worked with the TSF raster produced at the final time-step of our simulations, i.e., at time t = 300 (e.g., Figure 5a). On those rasters, we randomly sampled true TSF values of varying efforts and applied a censoring function to simulate the loss of information available through dendroecological field surveys. Although we only applied censoring to our samples in order to minimize the computing time and data storage requirements, we applied censoring to an entire landscape for the sake of an example (Figure 5b), in which we can visualize how youngest patches can still be easily identified while older patches get increasingly more difficult to decipher.

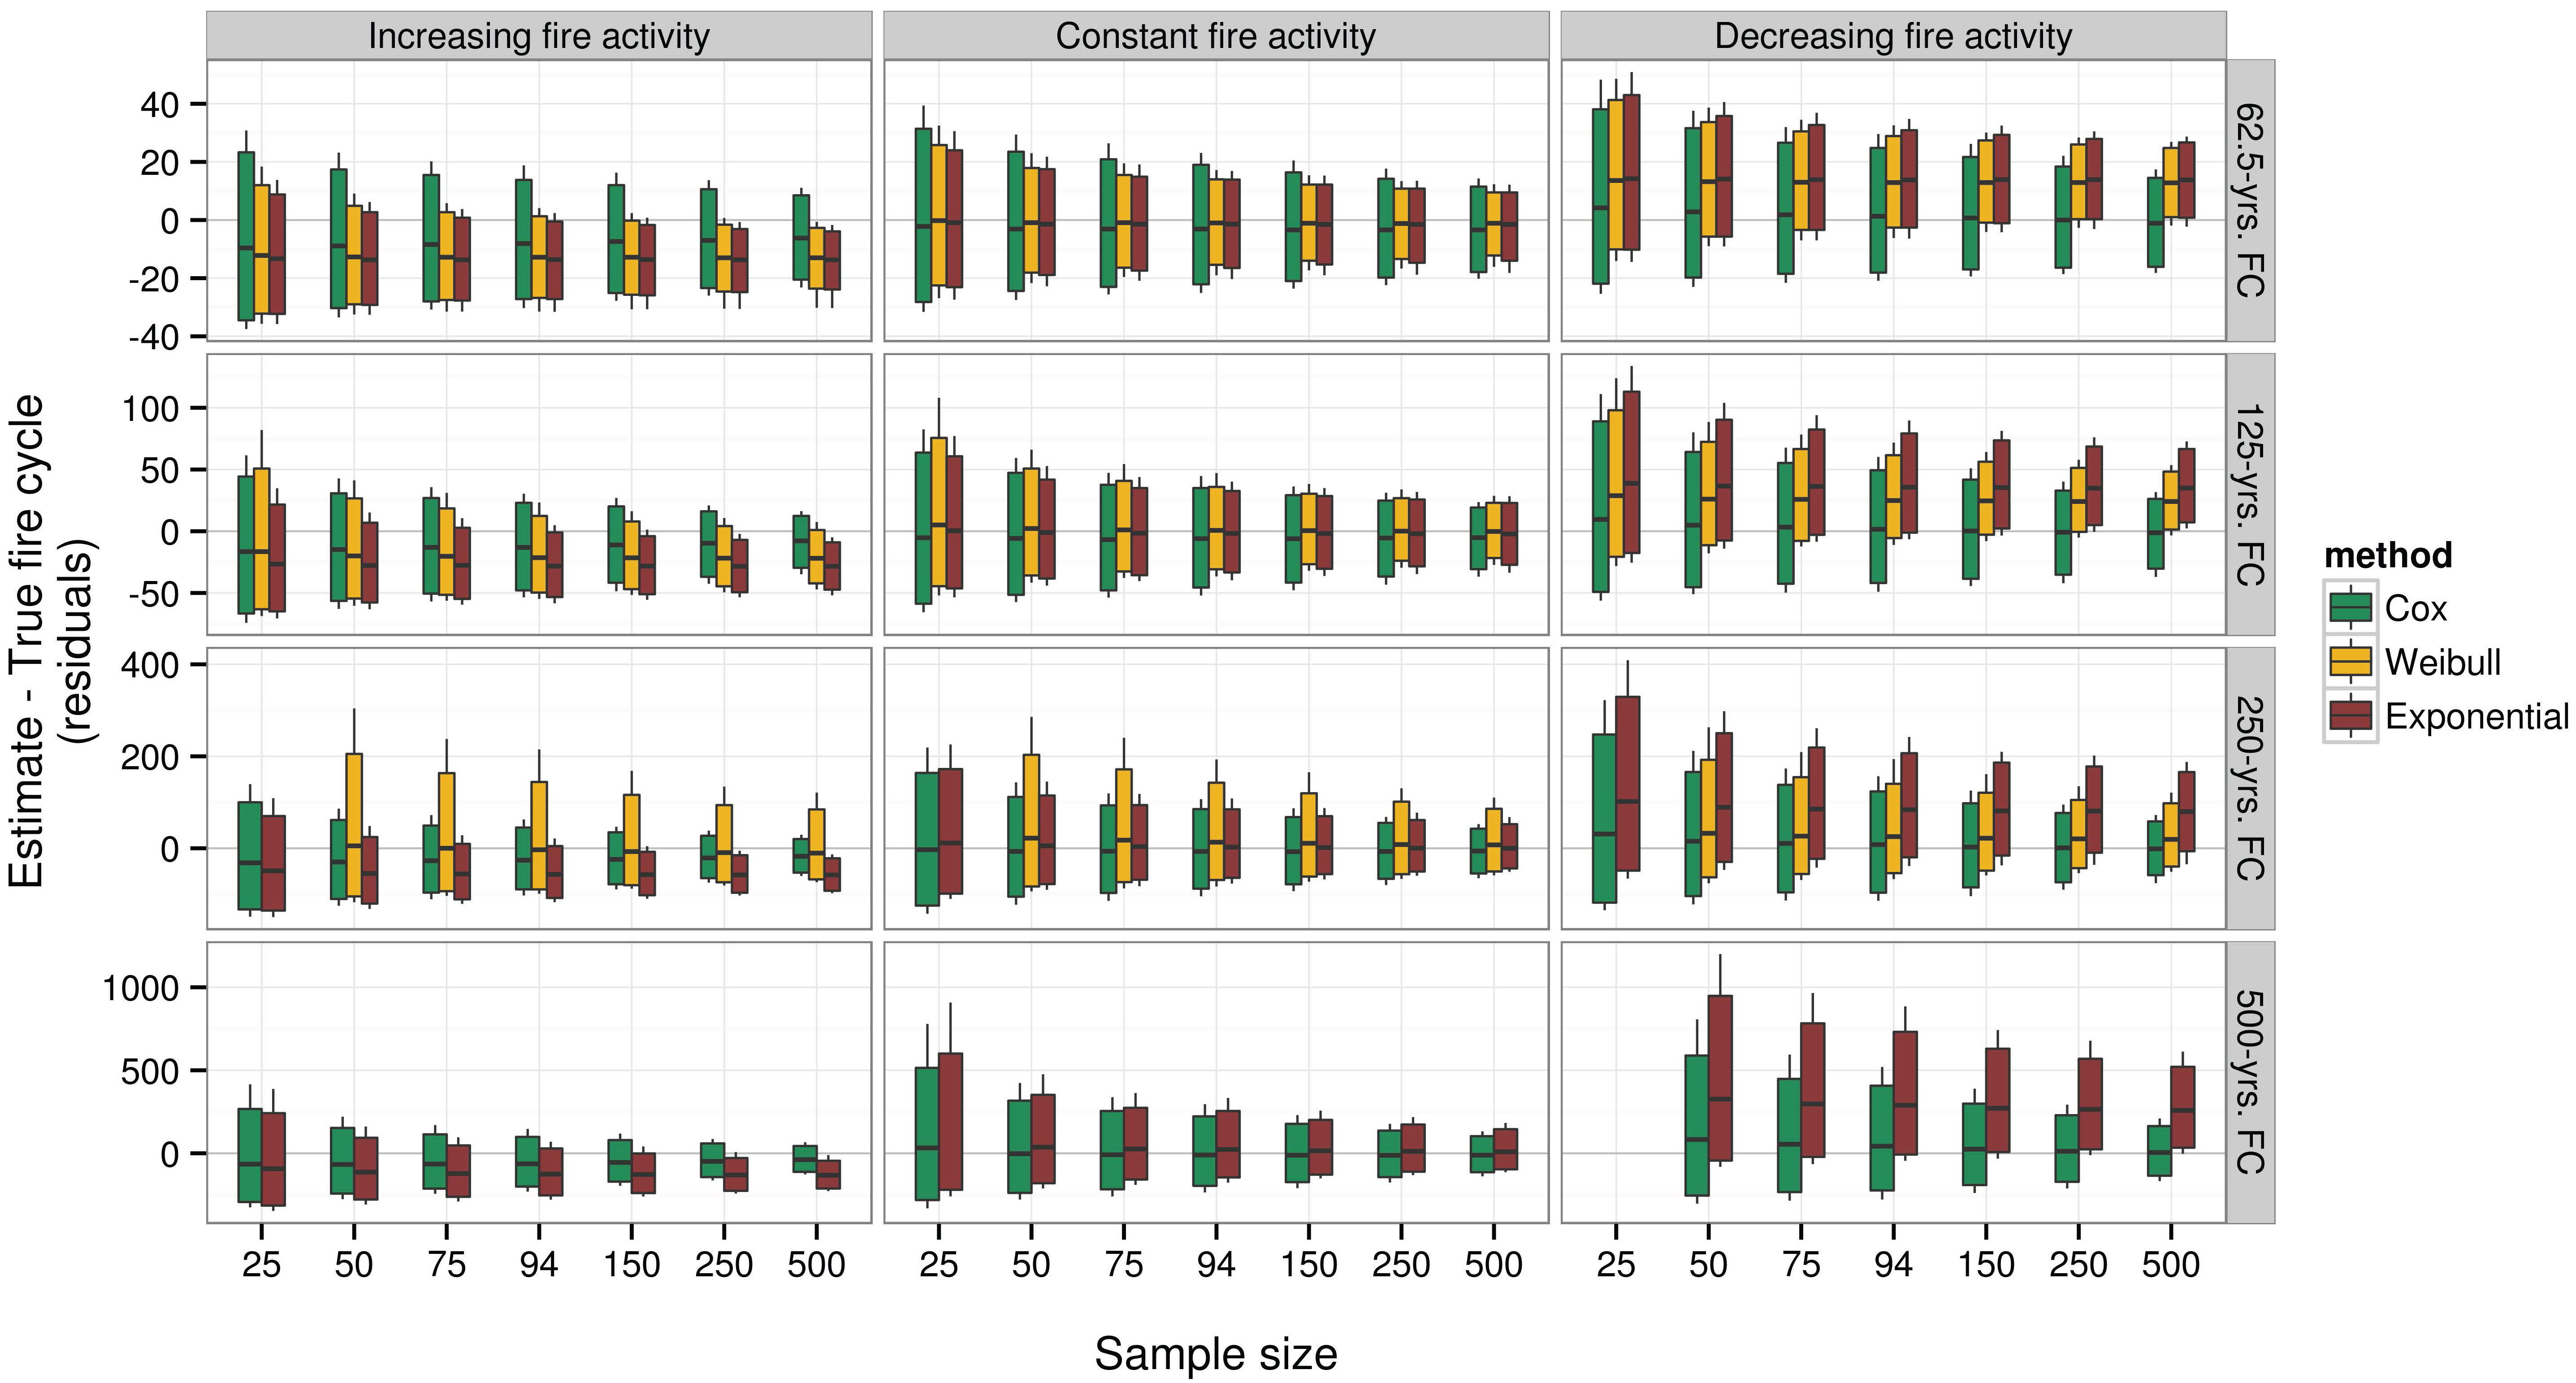
3.3. Accuracy and Precision of the Three Survival-Based Estimators of FC

For all three methods, FC estimates that were applied to samples on which the censoring function was applied appear relatively unbiased when fire activity is constant as there is no notable departure from 0 for the mean residuals (Figure 6).
The picture changes considerably when simulated fire regimes present increasing or decreasing fire activity. All methods of estimation may become biased, to different extents, toward the most recent fire activity, i.e., longer FC when fire activity is decreasing, and inversely. However, there are some differences, with exponential- and Weibull-based estimates being the most sensitive by far. While exponential-based estimates seem to simply become more representative of the most recent fire activity instead of that affecting the entire statistical population, Weibull-based estimates react in a more complex manner. In fact, they react similarly to the exponential-based estimates for the shorter FCs. However, when global FC becomes greater than or equal to 250 years, estimates become very unstable, with many values so much higher than the true ones that we could not plot them without making other patters impossible to visualize. Cox regression-based estimates are much less sensitive to temporal variations in fire regimes and seem to describe in the most accurate way the fire regime affecting the entire statistical population under analysis.
Sampling effort mainly affects how variable the estimates are around the true values (Figure 6). The decrease in variability with an increase in sampling effort is fairly gradual, presents no notable thresholds, and appears to follow a similar pattern for all three means of estimation. The narrower distribution of residuals with a greater sampling effort combined with the biases observed for parametric methods, especially the exponential one, resulted in the entire ranges covered by 99% of the estimates often not even including the true FC when fire activity was not constant, a result that is even better illustrated below, in the section describing the performances of the CI95.

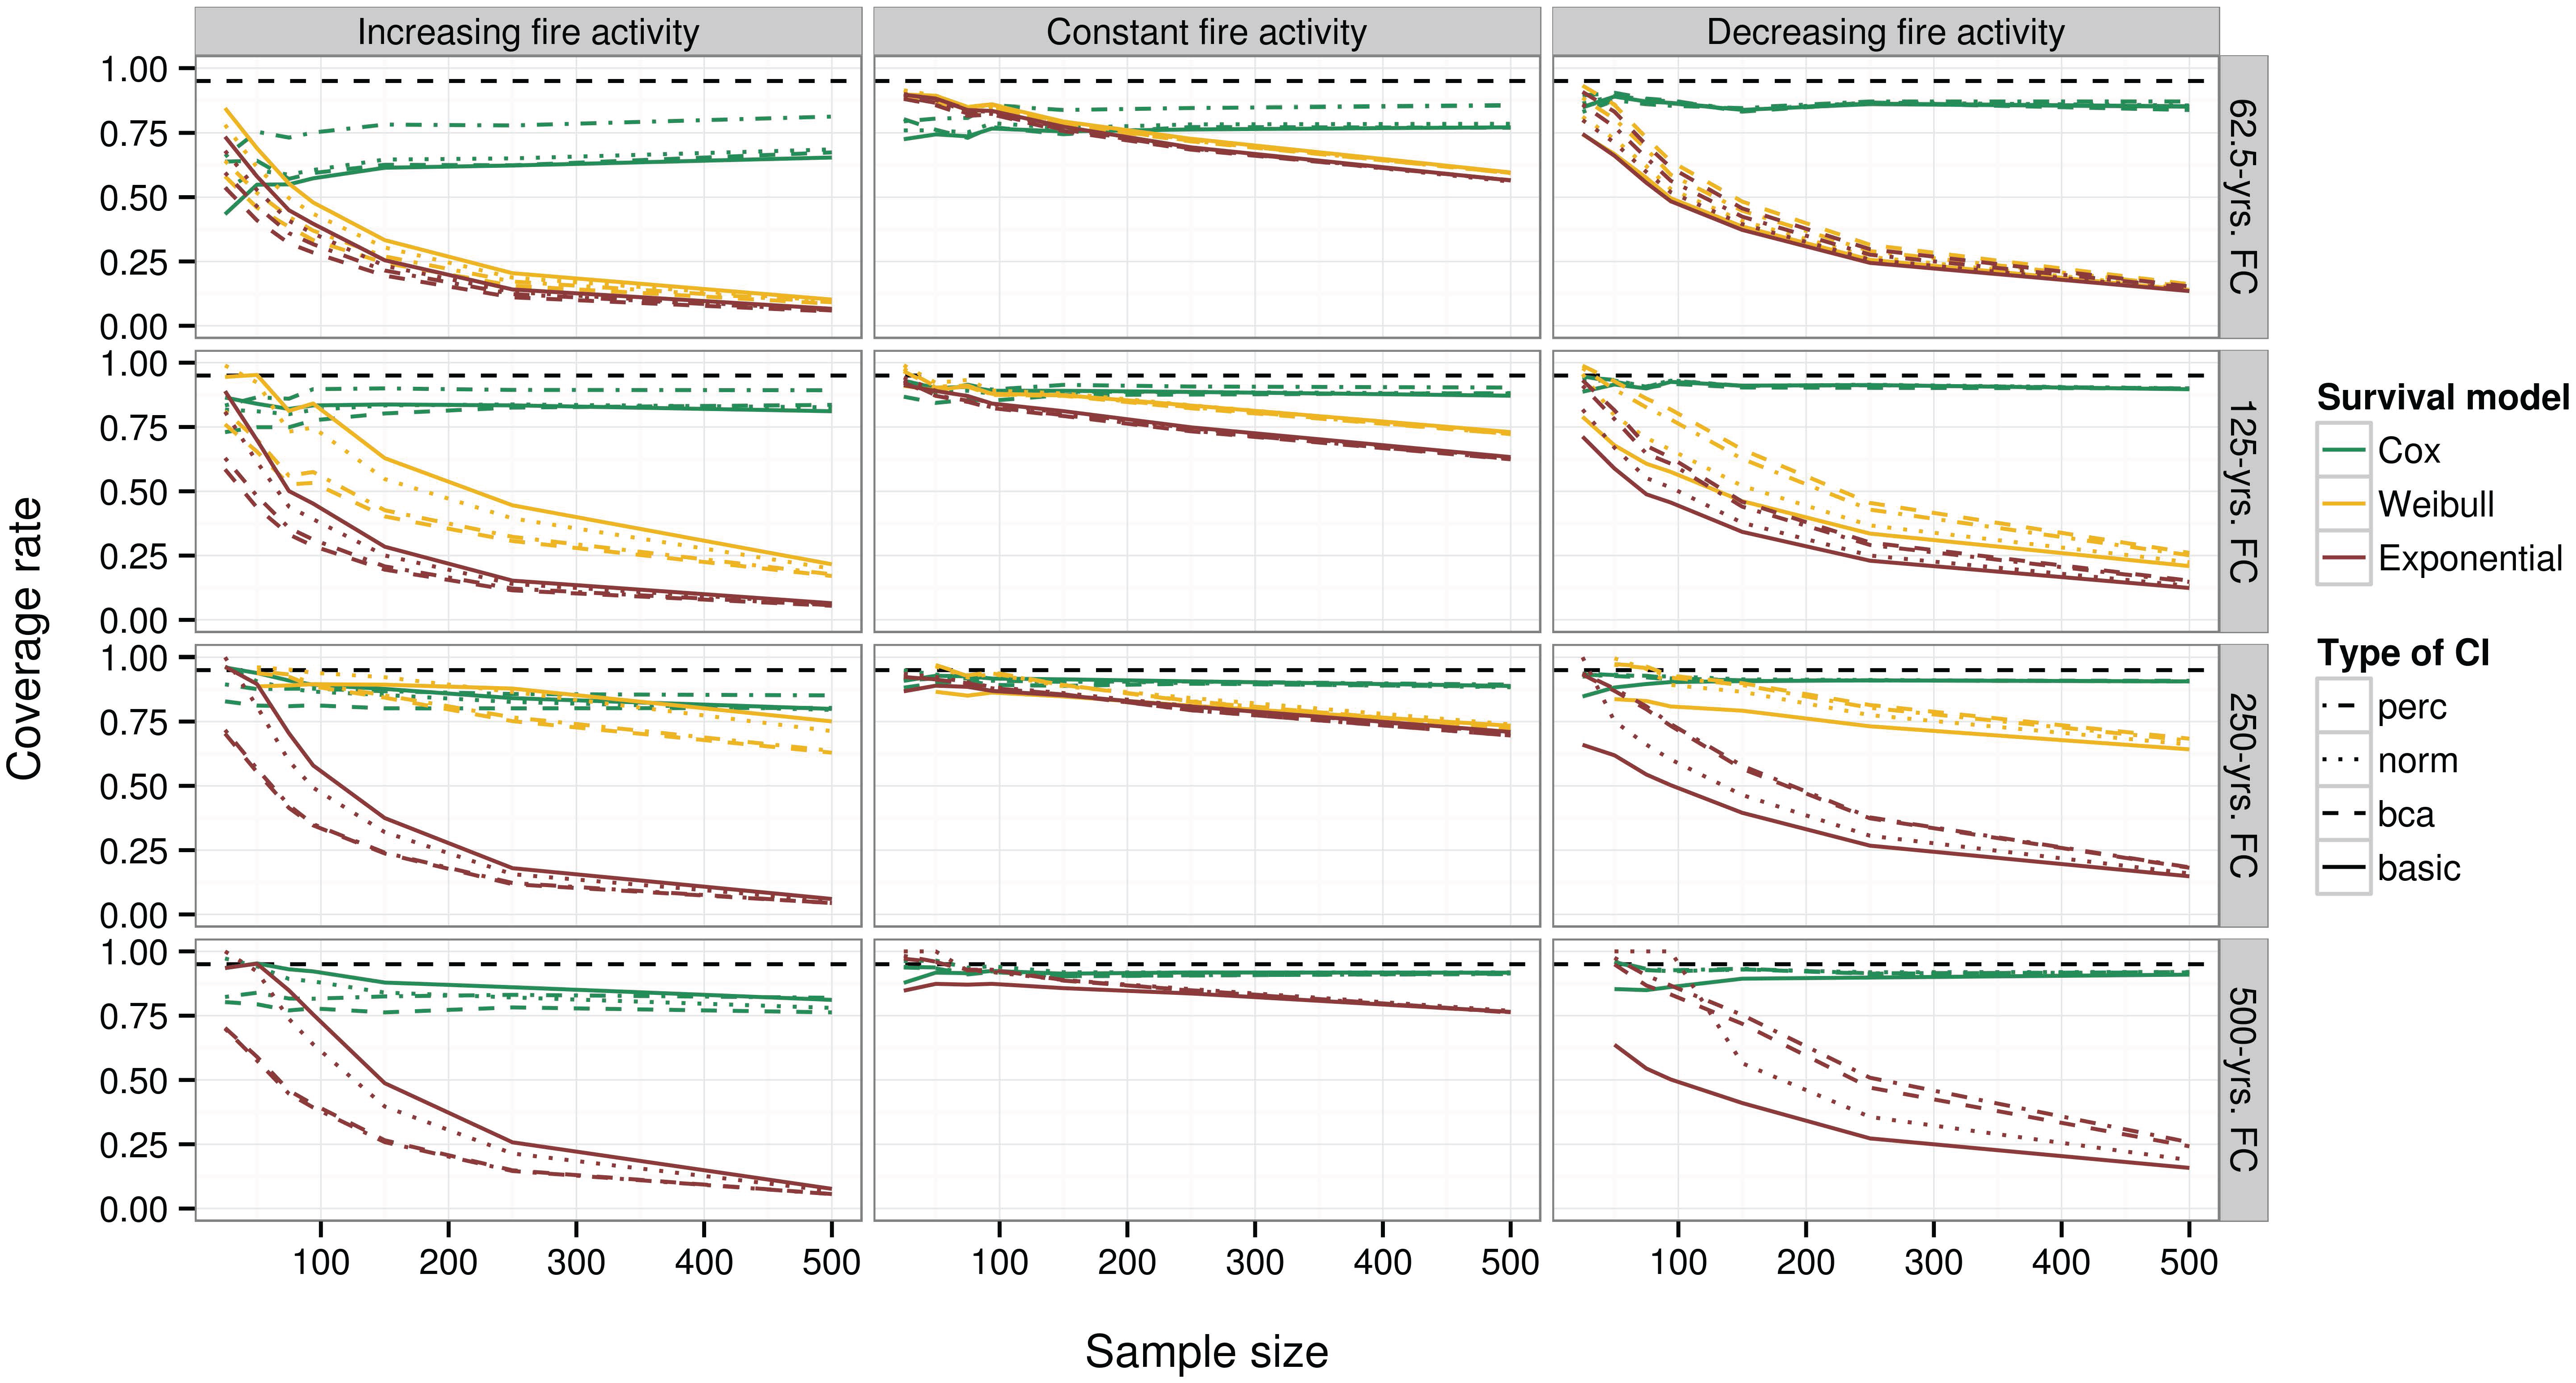
3.4. Performance of the Non-Parametric CI95

Although the different types of confidence intervals that we computed differ in terms of performance, i.e., by their coverage being different from the nominal value of 95%, those differences are subordinate to those associated with the fire regime simulated, mostly the temporal patterns, and to the survival model used to estimate the FC (Figure 7).
When estimating FC in a context of increasing or decreasing fire activity, all types of confidence intervals perform very badly when based on parametric survival models (exponential or Weibull), mainly because of the considerable biases that are associated with those methods. The CI95 associated with the estimates obtained using Cox regressions actually are the only ones that behave in a consistent manner when increasing the sampling effort or under different temporal patterns of fire regimes.
However, even Cox-based CI95 provide coverage that is narrower than the nominal one in almost every situation, although they approach the nominal value when recent fire activity is not too high, i.e., when it is generally decreasing or when it is constant and FC ≥ 125 years. In those situations, all types of CI95 are roughly equivalent in terms of coverage performances for Cox-based estimates.

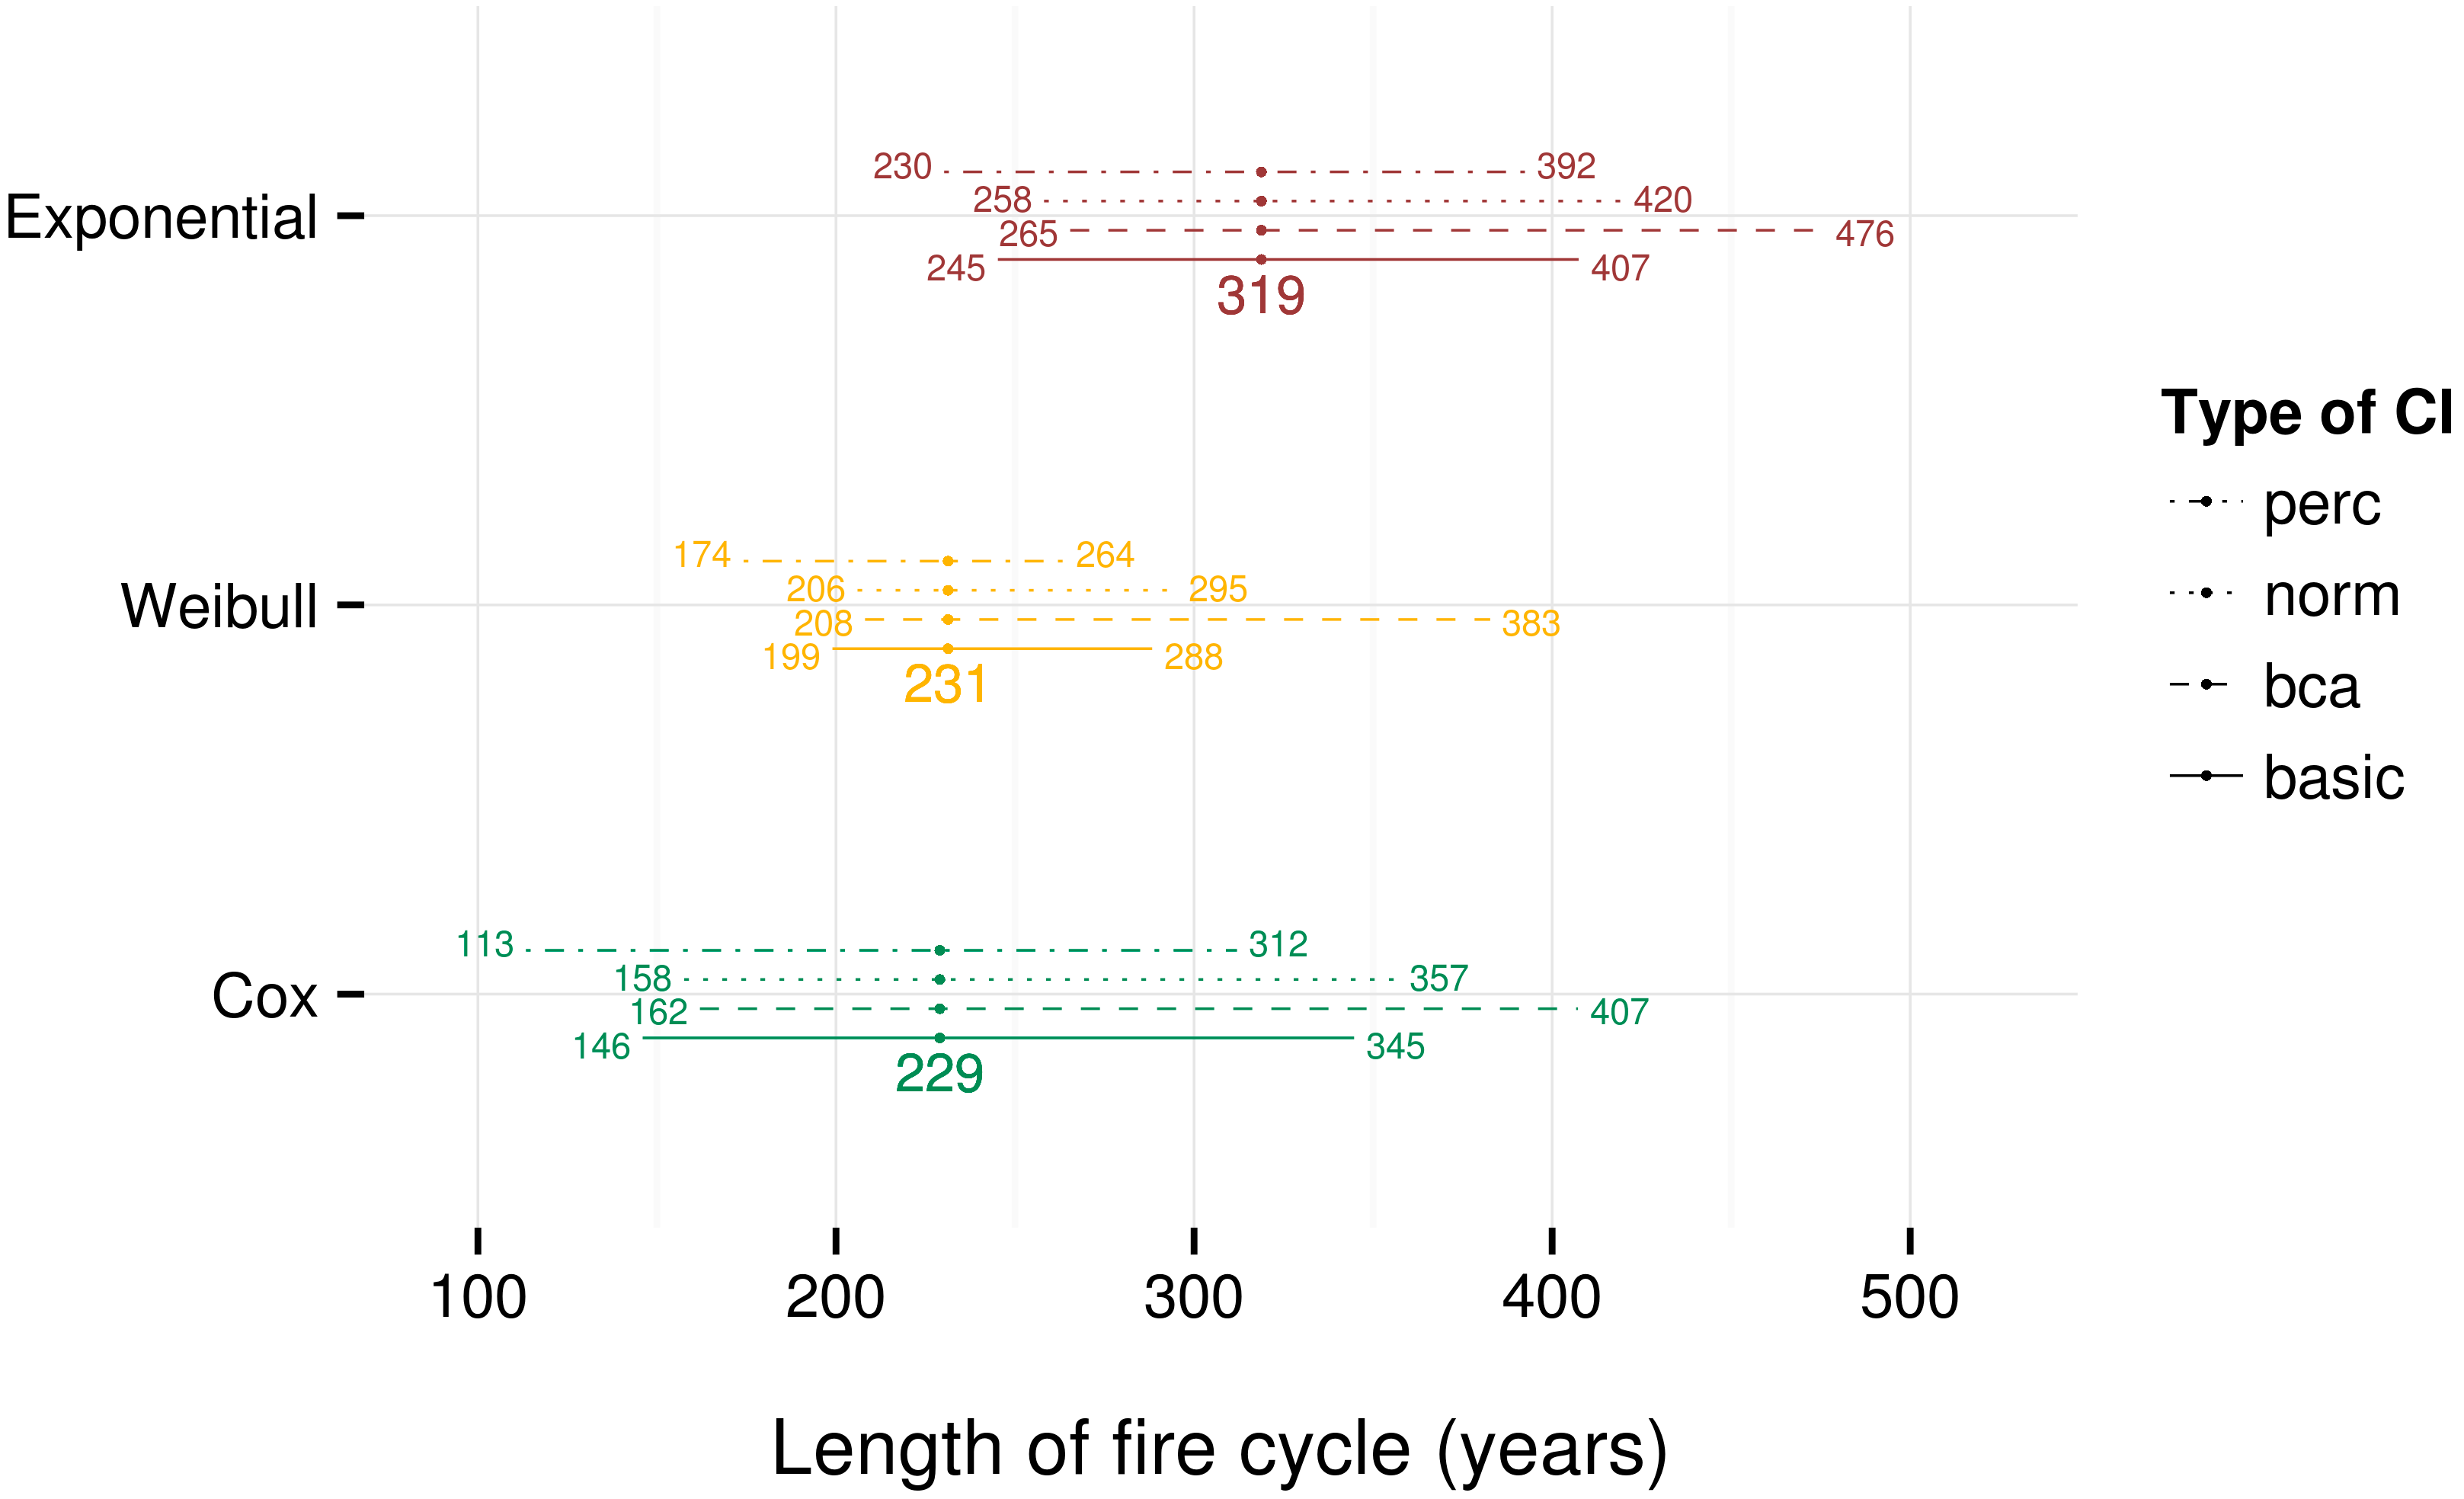
3.5. Fire Cycle Estimation in the Case Study Area

The Weibull fit and Cox regression estimates of FC for the case study area are very similar and are considerably shorter than those obtained from the negative exponential fit (Figure 3), although their CI95 overlap. Overall, the CI95 are narrower for Weibull estimates, but all CI95, irrespective of the survival method or type of CI, are considerably wide relative to central estimates.
Among the different types of non-parametric CI95 that were computed, two differ notably. First, the bias-corrected and accelerated (BCa) method tends to extend the CI95 by 50 years or more in the upper range compared to the others, while the percentile-based method (perc) does the same, to a lesser extent, in the lower range (Figure 8). The other two methods, i.e., the basic and normal approximation (norm) methods, report CI95 that are very similar and intermediate to the two others.

4. Discussion

In our simulation experiment, we tried to incorporate the most important sources of uncertainty that affect estimation of FC based on dendroecologically reconstructed fire history. In the context of fire history reconstruction obtained from cross-sectional field surveys, such as those simulated in the present study for our case study, sources of uncertainty in the estimation of FC are multiple and include: (1) the variation inherent to sampling; (2) the spatial stochasticity of the phenomenon, which involves the random burning of a landscape in which stands with various TSF values are affected; and (3) temporal variations in fire activity, which interfere with the stationarity assumption that is needed to substitute observed TSF for complete fire intervals [28]. By integrating those sources of uncertainty and by testing a variety of estimation methods in a range of conditions that are representative of the field conditions for which those reconstructions can be useful, we managed to identify the most accurate and robust method as well as the factors that limit its application and reliability.
We defined the scope of this experiment so that the most commonly raised issues would be addressed, but we acknowledge that other factors may be of interest to consider in some particular contexts. That is why we made the experiment entirely reproducible and tried to make it easily adaptable.
With no surprise, all methods are affected by the quality and quantity of information available as input. However, they are not equal, as Cox regression clearly comes out as the most reliable method for the estimation of FC. It is in fact much more robust in the face of the most common sources of uncertainty and is therefore less likely to be affected by the potentially misleading biases that often affect parametric methods such as Weibull- and exponential-based estimates.

4.1. Assessment of Estimators and Their Reported CI

Our simulations allowed us to single out temporal variations in fire activity as the most important factor interfering with estimation of FC from cross-sectional sampling, which confirms previous criticism made in that regard [25,28]. That is because survival analyses are based on TSF data and not on complete fire-return intervals, which can be treated interchangeably only if the failure process (fire) is assumed to be stationary [28]. For all methods, increases in fire activity are associated with an underestimation of the length of the FC, and vice versa, although this bias is almost negligible for the FC obtained using Cox regressions. Those biases are related to the gradual loss of information that is caused by overburning and/or censoring, which create conditions where the most recent fire activity gets a better representation in the samples that are used for estimating FC. This appears to be particularly problematic when using parametric methods, with the exception of Weibull-based estimates in some very specific situations, an aspect that we will develop below. Substantial increases in fire activity mean that records of lower amounts of area burned in previous periods (older stands) get “erased” from the landscape. In the opposite situation, when fire activity decreases, it is censoring that gradually erases records of the higher proportions of stands that were initiated in earlier decades when fire activity was higher, when the interval between fires allows it.
Compared with parametric methods, which appear to have biases that are comparable in magnitude in situations where fire activity increases or decreases, Cox regression-based estimation does considerably better in situations of decreasing fire activity. This suggests that although the a priori unspecified hazard function of the Cox regression, i.e., its non-parametric component, deals very well with varying “failure” rates, it is still sensitive to trends induced by the most intense, recent burning, which simply “erases” traces of past fire activity on the landscape.
The Weibull-based estimates show some distinct patterns that are worth discussing a little further. In situations of low fire activity, the large fires events that actually occur once in a while strongly affect the estimation of the shape parameter c of the Weibull distribution (see equation 4), which determines how the hazard of burning increases or decreases along the time axis. Weibull fit on survival samples affected by a recent increase in fire activity, or even by a punctual peak in an otherwise relatively constant fire activity, will typically yield a survival model associated with a decreasing hazard of burning along the time axis (in reverse time), a trend that is perpetuated to infinity. This is of course unrealistic as it implies that older forests see their vulnerability to fire decrease in a monotonous manner down to zero at infinity, and it thus generates overestimates of FC. Instability in the estimation of the shape parameter explains why we had to simply discard all Weibull-based estimates for FC ≥ 500 as well as those with smaller sampling sizes (n ≤ 25) when FC ≥ 250. In other set-ups, the actual length of the FC at which this becomes an issue could vary as a function of the size of the area being analyzed compared with the average size of fires, the age at which censoring occurs and starts erasing traces of past fire events, and the sampling effort. The distribution of Weibull-based estimates becomes well-centered around true values at FC = 250 with an increasing fire activity, likely because the shape parameter c fortuitously fits well that specific temporal trend in fire activity.
One interesting feature of Weibull-based survival models in fire ecology is related to their ability to formally test the age-dependency of hazard of burning within a parametric framework [30,48]. This has been a commonly used approach to test the effect of fuel loading as an endogenous source of variation in hazard of burning, especially in fire prone Mediterranean types of ecosystems [27,32,49]. In the context of the boreal forest of eastern Canada, however, typical fire return intervals are usually long enough that exogenous factors affecting the hazard of burning, such as climate, may change concurrently with potential endogenous factors, which considerably complicates the interpretation of the shape parameter that defines how hazard of burning changes along the time axis. Some ecological limits where fuel can become insufficient to support a higher level of fire activity are possible in the boreal forest of eastern Canada, although it has only been observed north of the limit of commercial forestry [50]. However, it appears unrealistic that any relationship between age and fuel loading would be monotonically increasing (or decreasing) on the entire typical lifespan of a boreal stand [51]. In fact, one would rather expect to find thresholds related to the delay in establishment of a fuel load sufficient to carry fire, as well as to succession from broadleaved species to coniferous ones, or the reverse [52,53]. In this context, the potential advantages related to the use of Weibull-based survival models to estimate FC compared with the negative exponential model are likely outweighed by the aforementioned artifacts that were observed in our simulations. We also suggest that it might be more appropriate to incorporate such empirically and independently developed relationships as the one between age and fuel loading [51] within a Cox regression model as time-dependent covariates, which would allow exogenous factors such as climate and land use to be treated separately by the unspecified hazard function. To sum up, for this reason and because the Cox regression does not require that we choose some particular probability distribution to represent survival time, we recommend the use of Cox regression to estimate FC from cross-sectional field surveys such as those modeled in our study. In our opinion, the slight underestimation of FC by Cox regression, which is very small compared with the width of the CI95, is a minor drawback considering its vastly superior robustness in terms of accuracy and CI95 performance.
Regardless of the method used, it is important to highlight the fact that a wide confidence interval must be associated with estimates of FC for the last 300 years. In many cases, the type of bootstrap CI95 does not seem to make any difference in terms of their coverage performance. However, here we suggest the use of the bias-corrected and accelerated bootstrap CI95 (BCa) for the following reasons: (1) the estimate bootstrap distribution is moderately biased and skewed toward higher values (data not shown), which corresponds exactly to the situation for which BCa bootstrapping has been developed in the first place [54]; and (2) all other methods, i.e., basic, percentile and normal approximation bootstrap CI, have been shown not to perform well in those types of situation, especially the percentile bootstrap, which, by inverting the lower and higher percentiles in the calculation of the confidence interval [43] may create artifacts such as the considerably lower limit produced from the present case study. For all three of those methods, biased and skewed bootstrap distribution may cause confidence interval coverage to be lower than the nominal value. We have not investigated why some of those latter types of confidence interval seem to perform better when the landscape being analyzed has been subject to an increase in fire activity, but we suspect this may be caused by some fortuitously convenient bias similar to that related to the surprisingly good performance of Weibull under very specific conditions that cannot a priori be assumed with empirical data.

4.2. Estimation of the FC in the Study Area

The three estimates of FC for the last 300 years in the case study area of eastern Canada range between 229 and 319 years, with CI95 that considerably extend the range of possible values. However, given the results of our simulations, the Cox regression-based estimates of FC for the last 300 years is by far the most credible, which implies that the true FC is more likely closer to 229 years than to the 319 years the exponential model yielded. Moreover, a decreasing trend in fire activity has been observed at the scale of the last 300 years in areas of the boreal forest of eastern Canada where fire history has been reconstructed (see, [12]). According to the results of our simulation experiment for a global FC of 250 years, which is the treatment that is the most similar to our case study, this trend over such a time frame is associated with considerable overestimation of the length of the FC by the negative exponential model, thus supporting the use of Cox regression-based estimation.
In the most likely and empirically supported situation where fire activity has been decreasing during the last 300 years, all types of CI95 that we tested seem to perform similarly in terms of coverage. Because of the mathematical construct and properties of BCa confidence intervals that have been discussed above, we believe that the best available CI95 for the case study area are covered by values ranging from 162 to 407 years. Our simulations suggest that it should probably be even wider since the actual coverage of all the tested bootstrap intervals is in fact slightly less than the nominal value of 95%.

4.3. Implications

The TSF distributions obtained from natural fire regimes that make up boreal landscapes are often suggested as “guidelines” for forest management because they constitute a very integrative characteristic of boreal landscapes that also directly and indirectly determines the relative influence of finer-scale types of disturbances [2]. Reproducing these natural patterns through harvesting is therefore believed to act as a coarse filter for the conservation of biodiversity [2,55] and other known and unknown ecosystem services [56,57]. With such an approach, FC is the key parameter defining the respective proportions of young and old forests, as well as the relative importance of silvicultural practices that better emulate their dynamics and maintain important processes and functions. However, the age structure at the landscape level from which the survival sample is obtained is only one result of the stochastic process [41] and, for this reason, some criticisms arose that argued that using FC as one strict reference may be too restrictive and does not adequately recognize the changing nature of fire-regulated boreal forests [26,58]. Our results show that the estimation of FC itself is subject to considerable imprecision. However, in the boreal forest of eastern North America, the idea that stands with TSF exceeding the length of typical harvesting rotations under low-retention harvesting regimes (60–100 years) made up the vast majority of large productive landscapes remains unchallenged. Even with a FC at the lower limit of the CI95 (≈ 160 years), the expected proportion of stands older than 100 years would be around 54%. Considering the central measure of the estimated FC for the last 300 years (229 years), the expected proportion of old forests would be around 65%. Of course, these proportions vary more at finer spatiotemporal scales, but there are no indications whatsoever from any kind of proxy (e.g., dendroecological or paleoecological) that boreal landscapes made up by a majority of young stands (TSF < 100 years) are the norm rather than the exception in eastern North America, south of what is today considered as the northern limit of commercial forestry [59]. Moreover, our results illustrate that FC estimated from periods of reference longer than what is available in provincial archives and that fully takes advantage of dendroecologically reconstructed fire history, i.e., a minimum of 150 years and, ideally, 300 years, is more closely related to the true mean TSF of the forest, especially in eastern Canada where fire free intervals are typically long. The use of mean TSF to set targets for age structure and composition has indeed previously been suggested [12,60], as it better summarizes the overall age-class distribution at the landscape level than FC estimated from short reference periods and because it takes the inertia of large landscapes into better consideration.
The uncertainty associated with FC estimates, however, may impose more restrictive limits to other applications of the knowledge of the length of the FC that require a more precise quantification. For instance, it may considerably complicate the detection of changes in fire regime in the past and near future because of the great variability inherent to the process [61], which is an important issue on many levels in the context of climate change. Average annual area burned has shown long-term trends in the past in relation to climate change and is expected to increase in most of the boreal forest, but these changes will very likely need to be quite dramatic to be statistically discernible. Consequently, not only is the baseline contribution of fire disturbance to the global carbon cycle difficult to assess, but recent and future changes in fire regime that might need to be documented are also considerably uncertain [62]. This also applies to the effect of fire on annual allowable cut predictions in strategic forest management planning [6]. This is why we stress the importance of integrating uncertainty into the management decision-making process by using a wide array of scenarios.
There are other sources of uncertainty or potential issues related to the use of survival-based estimates of FC. First, we did not assess how temporal partitioning of dendroecologically reconstructed fire history [12,35] could temper the bias associated with the parametric estimation of FC. Nevertheless, such temporal partitioning must generally be made a priori and consequently generates a certain level of subjectivity. This increases the risk of highly “volatile” period-specific estimates becoming mostly linked to a few spikes in fire activity, although it is generally agreed upon that even relatively constant fire regimes are characterized by considerable temporal variability.
In this study, we basically use null models to obtain estimates of FC for entire landscapes. It is often relevant from an ecological perspective as well as from a risk management one, i.e., for timber supply, infrastructures and human lives, to test for the influence of covariates that may influence fire hazard in forested landscapes. Several studies suggest that the power of survival models is somewhat limited when applied to dendroecological reconstructions of fire history obtained from cross-sectional surveys [13,63]. Based on the present simulation experiment, it would be possible to actually quantify their power and experiment procedures that aim to improve it.

5. Conclusions

The simulation approach used in this study is a transparent way to incorporate multiple types of uncertainty and to provide an integrative assessment of the accuracy and precision of survival model-based estimates of FC. We have shown that even with an increased sampling effort, large confidence intervals are obtained.
Our study confirms some of the statistical issues that were put forward with the use of survival analyses for estimating FC from a cross-sectional sample of the landscape, mainly the influence of temporal variations in fire activity [25,28]. However, the length of the FC remains important information for many practical management issues, and sources of information are limited, especially where typical fire return intervals are long. Using a modeling approach allowed us to better quantify the impact of current methodological limitations and showed that SA conducted on cross-sectional sampling of large boreal landscapes can provide valid estimates of FC even though they are associated with large confidence intervals.
Although all methods remain subject to irreducible levels of uncertainty, Cox regressions comes out as a clear winner as it is by far the least sensitive to the most common sources of error, to the point where a reassessment of many existing estimations of FC obtained using parametric methods could be justified.

Supplementary Materials

All code, input data, and future development directly based on the present study can be found in DC’s personal Github repository: https://github.com/dcyr/survFire.

Acknowledgments

We thank Jeanne Poirier for helpful comments and Isabelle Lamarre for linguistic revision.

Author Contributions

D.C., S.G. and Y.Be. provided the original ideas. D.C., S.G., Y.Be. and Y.Bo. wrote the paper. D.C. designed and performed the simulation experiment and analyzed the results. All authors participated in the interpretation of the results.

Conflicts of Interest

The authors declare no conflict of interest.

Abbreviations

The following abbreviations are used in this manuscript:
CI9595% confidence intervals
FCFire cycle
SASurvival analyses
TSFTime since fire

References

  1. Perera, A.H.; Buse, L.J.; Weber, M.G. Emulating Natural Forest Landscape Disturbances; Columbia University Press: New York, NY, USA, 2004. [Google Scholar]
  2. Gauthier, S.; Vaillancourt, M.-A.; Leduc, A.; De Grandpré, L.; Kneeshaw, D.D.; Morin, H.; Drapeau, P.; Bergeron, Y. Ecosystem Management in the Boreal Forest; Les Presses de l’Université du Québec: Québec, QC, Canada, 2009. [Google Scholar]
  3. Hirsch, K.; Kafka, V.; Tymstra, C.; McAlpine, R.; Hawkes, B.; Stegehuis, H.; Quintilio, S.; Gauthier, S.; Peck, K. Fire-smart forest management: A pragmatic approach to sustainable forest management in fire-dominated ecosystems. For. Chron. 2001, 77, 357–363. [Google Scholar] [CrossRef]
  4. Armstrong, G. Sustainability of timber supply considering the risk of wildfire. For. Sci. 2004, 50, 626–639. [Google Scholar]
  5. Bureau du forestier en chef. Manuel de Détermination des Possibilités Forestière 2013–2018; Gouvernement du Québec: Roberval, QC, Canada, 2013. [Google Scholar]
  6. Leduc, A.; Bernier, P.Y.; Mansuy, N.; Raulier, F.; Gauthier, S.; Bergeron, Y. Using salvage logging and tolerance to risk to reduce the impact of forest fires on timber supply calculations. Can. J. For. Res. 2014, 45, 480–486. [Google Scholar] [CrossRef]
  7. Amiro, B.D.; Cantin, A.; Flannigan, M.D.; de Groot, W.J. Future emissions from Canadian boreal forest fires. Can. J. For. Res. 2009, 39, 383–395. [Google Scholar] [CrossRef]
  8. Johnson, E.A.; Gutsell, S.L. Fire frequency models, methods and interpretations. Adv. Ecol. Res. 1994, 25, 239–287. [Google Scholar]
  9. Bergeron, Y.; Gauthier, S.; Kafka, V.; Lefort, P.; Lesieur, D. Natural fire frequency for the eastern Canadian boreal forest: Consequences for sustainable forestry. Can. J. For. Res. 2001, 31, 384–391. [Google Scholar] [CrossRef]
  10. Lesieur, D.; Gauthier, S.; Bergeron, Y. Fire frequency and vegetation dynamics for the south-central boreal forest of Quebec, Canada. Can. J. For. Res. 2002, 32, 1996–2009. [Google Scholar] [CrossRef]
  11. Drever, C.R.; Messier, C.; Bergeron, Y.; Doyon, F. Fire and canopy species composition in the Great Lakes-St. Lawrence forest of Témiscamingue, Québec. For. Ecol. Manag. 2006, 231, 27–37. [Google Scholar] [CrossRef] [Green Version]
  12. Bergeron, Y.; Cyr, D.; Drever, C.R.; Flannigan, M.; Gauthier, S.; Kneeshaw, D.; Lauzon, È.; Leduc, A.; Le Goff, H.; Lesieur, D.; et al. Past, current, and future fire frequencies in Quebec’s commercial forests: Implications for the cumulative effects of harvesting and fire on age-class structure and natural disturbance-based management. Can. J. For. Res. 2006, 36, 2737–2744. [Google Scholar] [CrossRef]
  13. Cyr, D.; Gauthier, S.; Bergeron, Y. Scale-dependent determinants of heterogeneity in fire frequency in a coniferous boreal forest of eastern Canada. Landsc. Ecol. 2007, 22, 1325–1339. [Google Scholar] [CrossRef]
  14. Bélisle, A.C.; Gauthier, S.; Cyr, D.; Bergeron, Y.; Morin, H. Fire regime and old-growth boreal forests in central Quebec, Canada: An ecosystem management perspective. Silva. Fenn. 2011, 45, 889–908. [Google Scholar]
  15. Bergeron, Y.; Fenton, N.J. Boreal forests of eastern Canada revisited: Old growth, nonfire disturbances, forest succession, and biodiversity. Botany 2012, 90, 509–523. [Google Scholar] [CrossRef]
  16. Stocks, B.J.; Mason, J.A.; Todd, J.B.; Bosch, E.M.; Wotton, B.M.; Amiro, B.D.; Flannigan, M.D.; Hirsch, K.G.; Logan, K.A.; Martell, D.L.; et al. Large forest fires in Canada, 1959–1997. J. Geophys. Res. 2002, 107, 5-1–5-12. [Google Scholar] [CrossRef]
  17. Hosmer, D.W., Jr.; Lemeshow, S. Applied Survival Analysis-Regression Modeling of Time to Event Data; John Wiley & Sons, Inc.: New York, NY, USA, 1999. [Google Scholar]
  18. Lawless, J.F. Observation schemes, censoring, and likelihood. In Statistical Models and Methods for Lifetime Data, 2nd ed.; John Wiley & Sons, Inc.: New York, NY, USA, 2002; pp. 49–78. [Google Scholar]
  19. Allison, P.D. Survival Analysis Using SAS: A Practical Guide; SAS Institute Inc.: Cary, NC, USA, 2005. [Google Scholar]
  20. Moritz, M.A.; Moody, T.J.; Miles, L.J.; Smith, M.M.; de Valpine, P. The fire frequency analysis branch of the pyrostatistics tree: Sampling decisions and censoring in fire interval data. Environ. Ecol. Stat. 2009, 16, 271–289. [Google Scholar] [CrossRef]
  21. Reed, W.J. Estimating historical forest-fire frequencies from time-since-last-fire-sample data. Math. Med. Biol. 1997, 14, 71–83. [Google Scholar] [CrossRef]
  22. Bergeron, Y.; Flannigan, M.; Gauthier, S.; Leduc, A.; Lefort, P. Past, current and future fire frequency in the Canadian boreal forest: Implications for sustainable forest management. Ambio 2004, 33, 356–360. [Google Scholar] [CrossRef] [PubMed]
  23. Lauzon, È.; Kneeshaw, D.; Bergeron, Y. Reconstruction of fire history (1680–2003) in Gaspesian mixedwood boreal forests of eastern Canada. For. Ecol. Manag. 2007, 244, 41–49. [Google Scholar] [CrossRef]
  24. Senici, D.; Chen, H.Y.H.; Bergeron, Y.; Cyr, D. Spatiotemporal variations of fire frequency in central boreal forest. Ecosystems 2010, 13, 1227–1238. [Google Scholar] [CrossRef]
  25. Clark, J.S. Ecological disturbance as a renewal process: Theory and application to fire history. Oikos 1989, 56, 17–30. [Google Scholar] [CrossRef]
  26. Boychuk, D.; Perera, A.H. Modeling temporal variability of boreal landscape age-classes under different fire disturbance regimes and spatial scales. Can. J. For. Res. 1997, 27, 1083–1094. [Google Scholar] [CrossRef]
  27. Polakow, D.A.; Dunne, T.T. Modelling fire-return interval T: Stochasticity and censoring in the two-parameter Weibull model. Ecol. Model. 1999, 121, 79–102. [Google Scholar] [CrossRef]
  28. Polakow, D.A.; Dunne, T.T. Numerical recipes for disaster: Changing hazard and the stand-origin-map. For. Ecol. Manag. 2001, 147, 183–196. [Google Scholar] [CrossRef]
  29. Van Wagner, C.E. Age-class distribution and the forest fire cycle. Can. J. Restor. 1978, 8, 220–227. [Google Scholar] [CrossRef]
  30. Johnson, E.A. Fire recurrence in the subarctic and its implications for vegetation composition. Can. J. Bot. 1979, 57, 1374–1379. [Google Scholar] [CrossRef]
  31. Cox, D.R. Regression models and life-tables. J. R. Stat. Soc. Ser. B 1972, 34, 187–220. [Google Scholar]
  32. Moritz, M.A. Spatiotemporal analysis of controls on shrubland fire regimes: Age dependency and fire hazard. Ecology 2003, 84, 351–361. [Google Scholar] [CrossRef]
  33. Bergeron, Y. Species and stand dynamics in the mixed woods of Quebec’s southern boreal forest. Ecology 2000, 81, 1500–1516. [Google Scholar] [CrossRef]
  34. Gauthier, S.; Boucher, D.; Morissette, J.; De Grandpré, L. Fifty-seven years of composition change in the eastern boreal forest of Canada. J. Veg. Sci. 2010, 21, 772–785. [Google Scholar] [CrossRef]
  35. Reed, W.J.; Larsen, C.P.S.; Johnson, E.A.; MacDonald, G.M. Estimation of temporal variations in historical fire frequency from time-since-fire map data. For. Sci. 1998, 44, 465–475. [Google Scholar]
  36. Reed, W.J.; Johnson, E.A. Reply-reverse cumulative standing age distributions in fire-frequency analysis. Can. J. For. Res. 1999, 29, 1812–1815. [Google Scholar] [CrossRef]
  37. Therneau, T.M. Package ‘survival’. Available online: https://cran.r-project.org/web/packages/survival/survival.pdf (accessed on 21 April 2016).
  38. Bouchard, M.; Pothier, D.; Gauthier, S. Fire return intervals and tree species succession in the North Shore region of eastern Quebec. Can. J. For. Res. 2008, 38, 1621–1633. [Google Scholar] [CrossRef]
  39. Portier, J.; Gauthier, S.; Leduc, A.; Arseneault, D.; Bergeron, Y. Fire regime variability along a latitudinal gradient of continuous to discontinuous coniferous boreal forests in Eastern Canada. Ann. Stat. 1981, 9, 93–108. [Google Scholar]
  40. Armstrong, G.W. A stochastic characterisation of the natural disturbance regime of the boreal mixedwood forest with implications for sustainable forest management. Can. J. For. Res. 1999, 29, 424–433. [Google Scholar] [CrossRef]
  41. Cyr, D. Accuracy and precision of three survival-based methods for estimating fire cycle from dendroecological data. Available online: https://github.com/dcyr/survFire (accessed on 21 April 2016).
  42. Canty, A.; Ripley, B. boot: Boostrap functions. Available online: https://cran.r-project.org/web/packages/boot/index.html (accessed on 21 April 2016).
  43. Davison, A.C.; Hinkley, D.V. Bootstrap Methods and Their Application; Cambridge University Press: Cambridge, UK, 1997. [Google Scholar]
  44. Environment Canada. Climate normal and averages, 1981–2010. Available online: http://climate.weather.gc.ca/climate_normals/ (accessed on 3 January 2016).
  45. Robitaille, A.; Saucier, J. Paysages rÉgionaux du Québec Méridional; Les Publications du Québec: Sainte-Foy, QC, Canada, 1998. [Google Scholar]
  46. Arno, S.F.; Sneck, K.M. A Method for Determining Fire History in Coniferous Forests of the Mountain West; USDA Forest Service: Ogden, UT, USA, 1977. [Google Scholar]
  47. Cyr, D.; Gauthier, S.; Bergeron, Y. The influence of landscape-level heterogeneity in fire frequency on canopy composition in the boreal forest of eastern Canada. J. Veg. Sci. 2012, 23, 140–150. [Google Scholar] [CrossRef]
  48. Johnson, E.A.; Van Wagner, C.E. The theory and use of two fire history models. Can. J. For. Res. 1985, 15, 214–220. [Google Scholar] [CrossRef]
  49. Moritz, M.A.; Keeley, J.E.; Johnson, E.A.; Schaffner, A.A. Testing a basic assumption of shrubland fire management: How important is fuel age? Front. Ecol. Environ. 2004, 2, 67–72. [Google Scholar] [CrossRef]
  50. Héon, J.; Arseneault, D.; Parisien, M.-A. Resistance of the boreal forest to high burn rates. Proc. Natl. Acad. Sci. USA 2014, 111, 13888–13893. [Google Scholar]
  51. Schoenberg, F.F.P.; Peng, R.; Huang, Z.; Rundel, P. Detection of non-linearities in the dependence of burn area on fuel age and climatic variables. Int. J. Wildl. Fire 2003, 12, 1–6. [Google Scholar] [CrossRef]
  52. Terrier, A.; Girardin, M.P.; Périé, C.; Legendre, P.; Bergeron, Y. Potential changes in forest composition could reduce impacts of climate change on boreal wildfires. Ecol. Appl. 2013, 23, 21–35. [Google Scholar] [CrossRef] [PubMed]
  53. Girardin, M.P.; Ali, A.A.; Carcaillet, C.; Blarquez, O.; Hély, C.; Terrier, A.; Genries, A.; Bergeron, Y. Vegetation limits the impact of a warm climate on boreal wildfires. New Phytol. 2013, 199, 1001–1011. [Google Scholar] [CrossRef] [PubMed]
  54. Efron, B. Better bootstrap confidence intervals. J. Am. Stat. Assoc. 1987, 82, 171–185. [Google Scholar] [CrossRef]
  55. Hunter, M.L. Natural fire regimes as spatial models for managing boreal forests. Biol. Conserv. 1993, 65, 115–120. [Google Scholar] [CrossRef]
  56. Attiwill, P.M. The disturbance of forest ecosystems: the ecological basis for conservative management. For. Ecol. Manag. 1994, 63, 247–300. [Google Scholar] [CrossRef]
  57. Christensen, N.L.; Bartuska, A.M.; Brown, J.H.; Carpenter, S.; D’Antonio, C.; Francis, R.; Franklin, J.F.; MacMahon, J.A.; Noss, R.F.; Parsons, D.J.; et al. The report of the Ecological Society of America committee on the scientific basis for ecosystem management. Ecol. Appl. 1996, 6, 665–691. [Google Scholar] [CrossRef]
  58. Armstrong, G.; Adamowicz, W.; Beck, J. Coarse filter ecosystem management in a nonequilibrating forest. For. Sci. 2003, 49, 209–223. [Google Scholar]
  59. Jobidon, R.; Bergeron, Y.; Robitaille, A.; Raulier, F.; Gauthier, S.; Imbeau, L.; Saucier, J.-P.; Boudreault, C. A biophysical approach to delineate a northern limit to commercial forestry: The case of Quebec’s boreal forest. Can. J. For. Res. 2015, 45, 515–528. [Google Scholar] [CrossRef]
  60. Gauthier, S.; Lefort, P.; Bergeron, Y.; Drapeau, P. Time since Fire Map, Age-Class Distribution and Forest Dynamics in the Lake Abitibi Model Forest; Natural Resources Canada: Québec, QC, Canada, 2002. [Google Scholar]
  61. Metsaranta, J.M. Potentially limited detectability of short-term changes in boreal fire regimes: A simulation study. Int. J. Wildl. Fire 2010, 19, 1140–1146. [Google Scholar] [CrossRef]
  62. Kurz, W.A.; Stinson, G.; Rampley, G.J.; Dymond, C.C.; Neilson, E.T. Risk of natural disturbances makes future contribution of Canada’s forests to the global carbon cycle highly uncertain. Proc. Natl. Acad. Sci. USA 2008, 105, 1551–1555. [Google Scholar] [CrossRef] [PubMed]
  63. Cyr, D.; Bergeron, Y.; Gauthier, S.; Larouche, A.C. Are the old-growth forests of the Clay Belt part of a fire-regulated mosaic? Can. J. For. Res. 2005, 73, 65–73. [Google Scholar] [CrossRef]
Figure 1. Cumulative probability function of time since fire (TSF) censorship.
Forests 07 00131 g001
Figure 2. Case study area and empirical dendroecological survey (n = 94). Stand age can be associated with either a known TSF (uncensored) or a minimum TSF (censored). Topography is amplified 10 times.
Forests 07 00131 g002
Figure 3. Empirical and fitted cumulative fire size probability distribution (n = 123).
Forests 07 00131 g003
Figure 4. Simulated fire activity for all treatments (length of fire cycle and temporal patterns). Final mean TSF is computed at time t = 300. The true FC is computed over the entire course of the simulations, and is also computed for shorter periods of time toward the end of the simulations (last 150 and 50 years) to illustrate temporal patterns. Dotted lines indicate average values.
Forests 07 00131 g004
Figure 5. Example of a simulated landscape subject to a constant fire regime of 250 years: (a) true TSF at time t = 300; (b) minimum TSF at time t = 300 after the censoring function was applied; and (c) location of pixels where only a minimum age can be inferred from simulated dendroecological sampling. For all panels, the inner rectangles indicate the region that was subject to simulated samplings. (Patch contours were accentuated for the sake of illustration and may appear to be of an intermediate age. This does not reflect the true TSF values that were considered in our simulations.)
Forests 07 00131 g005
Figure 6. Fire cycle estimation error from simulated forest fire history reconstruction affected by censoring. Boxes contain 95% of the variations, while whiskers extend to cover 99% of the variations. Black lines within boxes indicate mean residuals.
Forests 07 00131 g006
Figure 7. Coverage rate of bootstrap CI95 (10,000 resamplings). Black dashed lines indicate the nominal coverage rate of 95%.
Forests 07 00131 g007
Figure 8. Fire cycle estimates and CI95 for the Côte-Nord case study area, eastern Canada.
Forests 07 00131 g008
Table 1. Summary of simulation parameters.
Total area/Pixel size of simulated landscape (ha)1,562,500 ha*/100 ha
Spatial resolution1 km
Simulation duration300 years
Fire size distributionLog-normal (fit from empirical records)
Length of the FC (years, averaged over the entire simulation)62.5, 125, 250 and 500 years
Temporal trends in fire activityIncreasing, constant or decreasing
Number of independent simulation replications100
Number of independent samples for each simulation100
Simulated sampling effort (random points)25, 50, 75, 94*, 250 and 500
* Similar or equal to the empirical dataset from the case study area.

