Article

A Global Index for Mapping the Exposure of Water Resources to Wildfire

1
Western Partnership for Wildland Fire Science, Department of Renewable Resources, University of Alberta, Edmonton, AB T6G 2H1, Canada
2
Aldo Leopold Wilderness Research Institute, Missoula, MT 59801, USA
3
Natural Resources Canada, Canadian Forest Service, Northern Forestry Centre, Edmonton, AB T6H 3S5, Canada
4
Department of Civil and Environmental Engineering, University of Waterloo, Waterloo, ON N2L 3G1, Canada
5
Department of Forest Engineering, Resources, and Management, Oregon State University, Corvallis, OR 97331, USA
6
Department of Renewable Resources, University of Alberta, Edmonton, AB T6G 2H1, Canada
7
Western Partnership for Wildland Fire Science, Department of Renewable Resources, University of Alberta, Edmonton, AB T6G 2H1, Canada
*
Author to whom correspondence should be addressed.
Forests 2016, 7(1), 22; https://doi.org/10.3390/f7010022
Submission received: 2 October 2015 / Revised: 18 December 2015 / Accepted: 5 January 2016 / Published: 13 January 2016
(This article belongs to the Special Issue Forest Management and Water Resources in the Anthropocene)

Abstract

:
Wildfires are keystone components of natural disturbance regimes that maintain ecosystem structure and functions, such as the hydrological cycle, in many parts of the world. Consequently, critical surface freshwater resources can be exposed to post-fire effects disrupting their quantity, quality and regularity. Although well studied at the local scale, the potential extent of these effects has not been examined at the global scale. We take the first step toward a global assessment of the wildfire water risk (WWR) by presenting a spatially explicit index of exposure. Several variables related to fire activity and water availability were identified and normalized for use as exposure indicators. Additive aggregation of those indicators was then carried out according to their individual weight. The resulting index shows the greatest exposure risk in the tropical wet and dry forests. Intermediate exposure is indicated in mountain ranges and dry shrublands, whereas the lowest index scores are mostly associated with high latitudes. We believe that such an approach can provide important insights for water security by guiding global freshwater resource preservation.

1. Introduction

Wildfires are essential to ecosystem function across the globe [1], influencing a wide spectrum of ecosystem components and natural processes [2], among which is the hydrological cycle. Accordingly, an abundant literature has described the effects of vegetation burning and post-fire recovery on local hydrology in different biogeographic areas [3,4,5,6]. Vegetation cover, litter and soil organic matter can be dramatically reduced by large fires and can lead to higher surface runoff and soil erosion, increasing water quantity, but decreasing water quality. The water requirements of rapidly growing post-fire vegetation can subsequently limit water quantity [4], even though water quality may improve [7].
Although a significant number of studies have examined such second-order fire effects on surface freshwater resources [8], most have been conducted at a local or regional scale [8,9,10,11,12], whereas global-scale studies do not exist. Despite the ubiquitous nature of fire and the potential for adverse consequences on ecosystems and populations [13], large-scale assessments of the risks that fire can pose to water resources are lacking. However, several important advancements in natural resources global mapping [14] and the development of innovative methods and global databases now make it possible to better understand the intersection of wildfire activity [15,16] and water resource availability [17,18] at the scale of the planet.
The large diversity of data types and derived metrics in these global databases creates a challenge for conducting global assessments, particularly when combining data from two fields, pyrogeography and hydrogeography. Often, resource or risk indices are created by aggregating proxy variables, called indicators, that are known to play a role in the occurrence of the studied phenomenon [19,20,21,22]. In such an approach, raster datasets representing indicators are selected and normalized to assign each pixel a score. Each indicator is then assigned a weight according to its assumed importance to the phenomenon of interest. Numerous indicators can then be aggregated to create a final raster index, whereby pixel values reflect the degree of risk or resource availability. Finally, the index can be tested for its sensitivity to each indicator and assigned weight. Several key global studies used this approach to underline issues in water security and riverine biodiversity [20], ocean vulnerability to human impact [22] and to identify natural areas of great importance for ecosystem functioning [19].
Inspired by this effective approach, we introduce here the concept of the wildfire water risk (WWR), which we define as the potential for wildfires to adversely affect water resources important for downstream ecosystems and human water needs for adequate water quantity and quality. We present a spatial framework as a foundation for assessing this underappreciated risk and introduce the global wildfire water exposure index (GWWEI) as a first step toward an integrated global assessment of the WWR. We then evaluate the sensitivity of the GWWEI to seven indicators relevant to fire and to water resources. Finally, we discuss how inclusion or variation in individual exposure indicators affects the interpretation of the index.

2. Materials and Methods

We detail below the procedure of the GWWEI concept, starting with a precise description of the data selected to be used as indicators in our framework (Figure 1). We then explain how those data were transformed to obtain normalized indicators, resulting in pixel values ranging from 0 to 100. We follow with an explanation of the weighted aggregation process of indicators’ scores, known as indexation, and finally, we perform a thorough sensitivity analysis of the resulting index to test its stability.

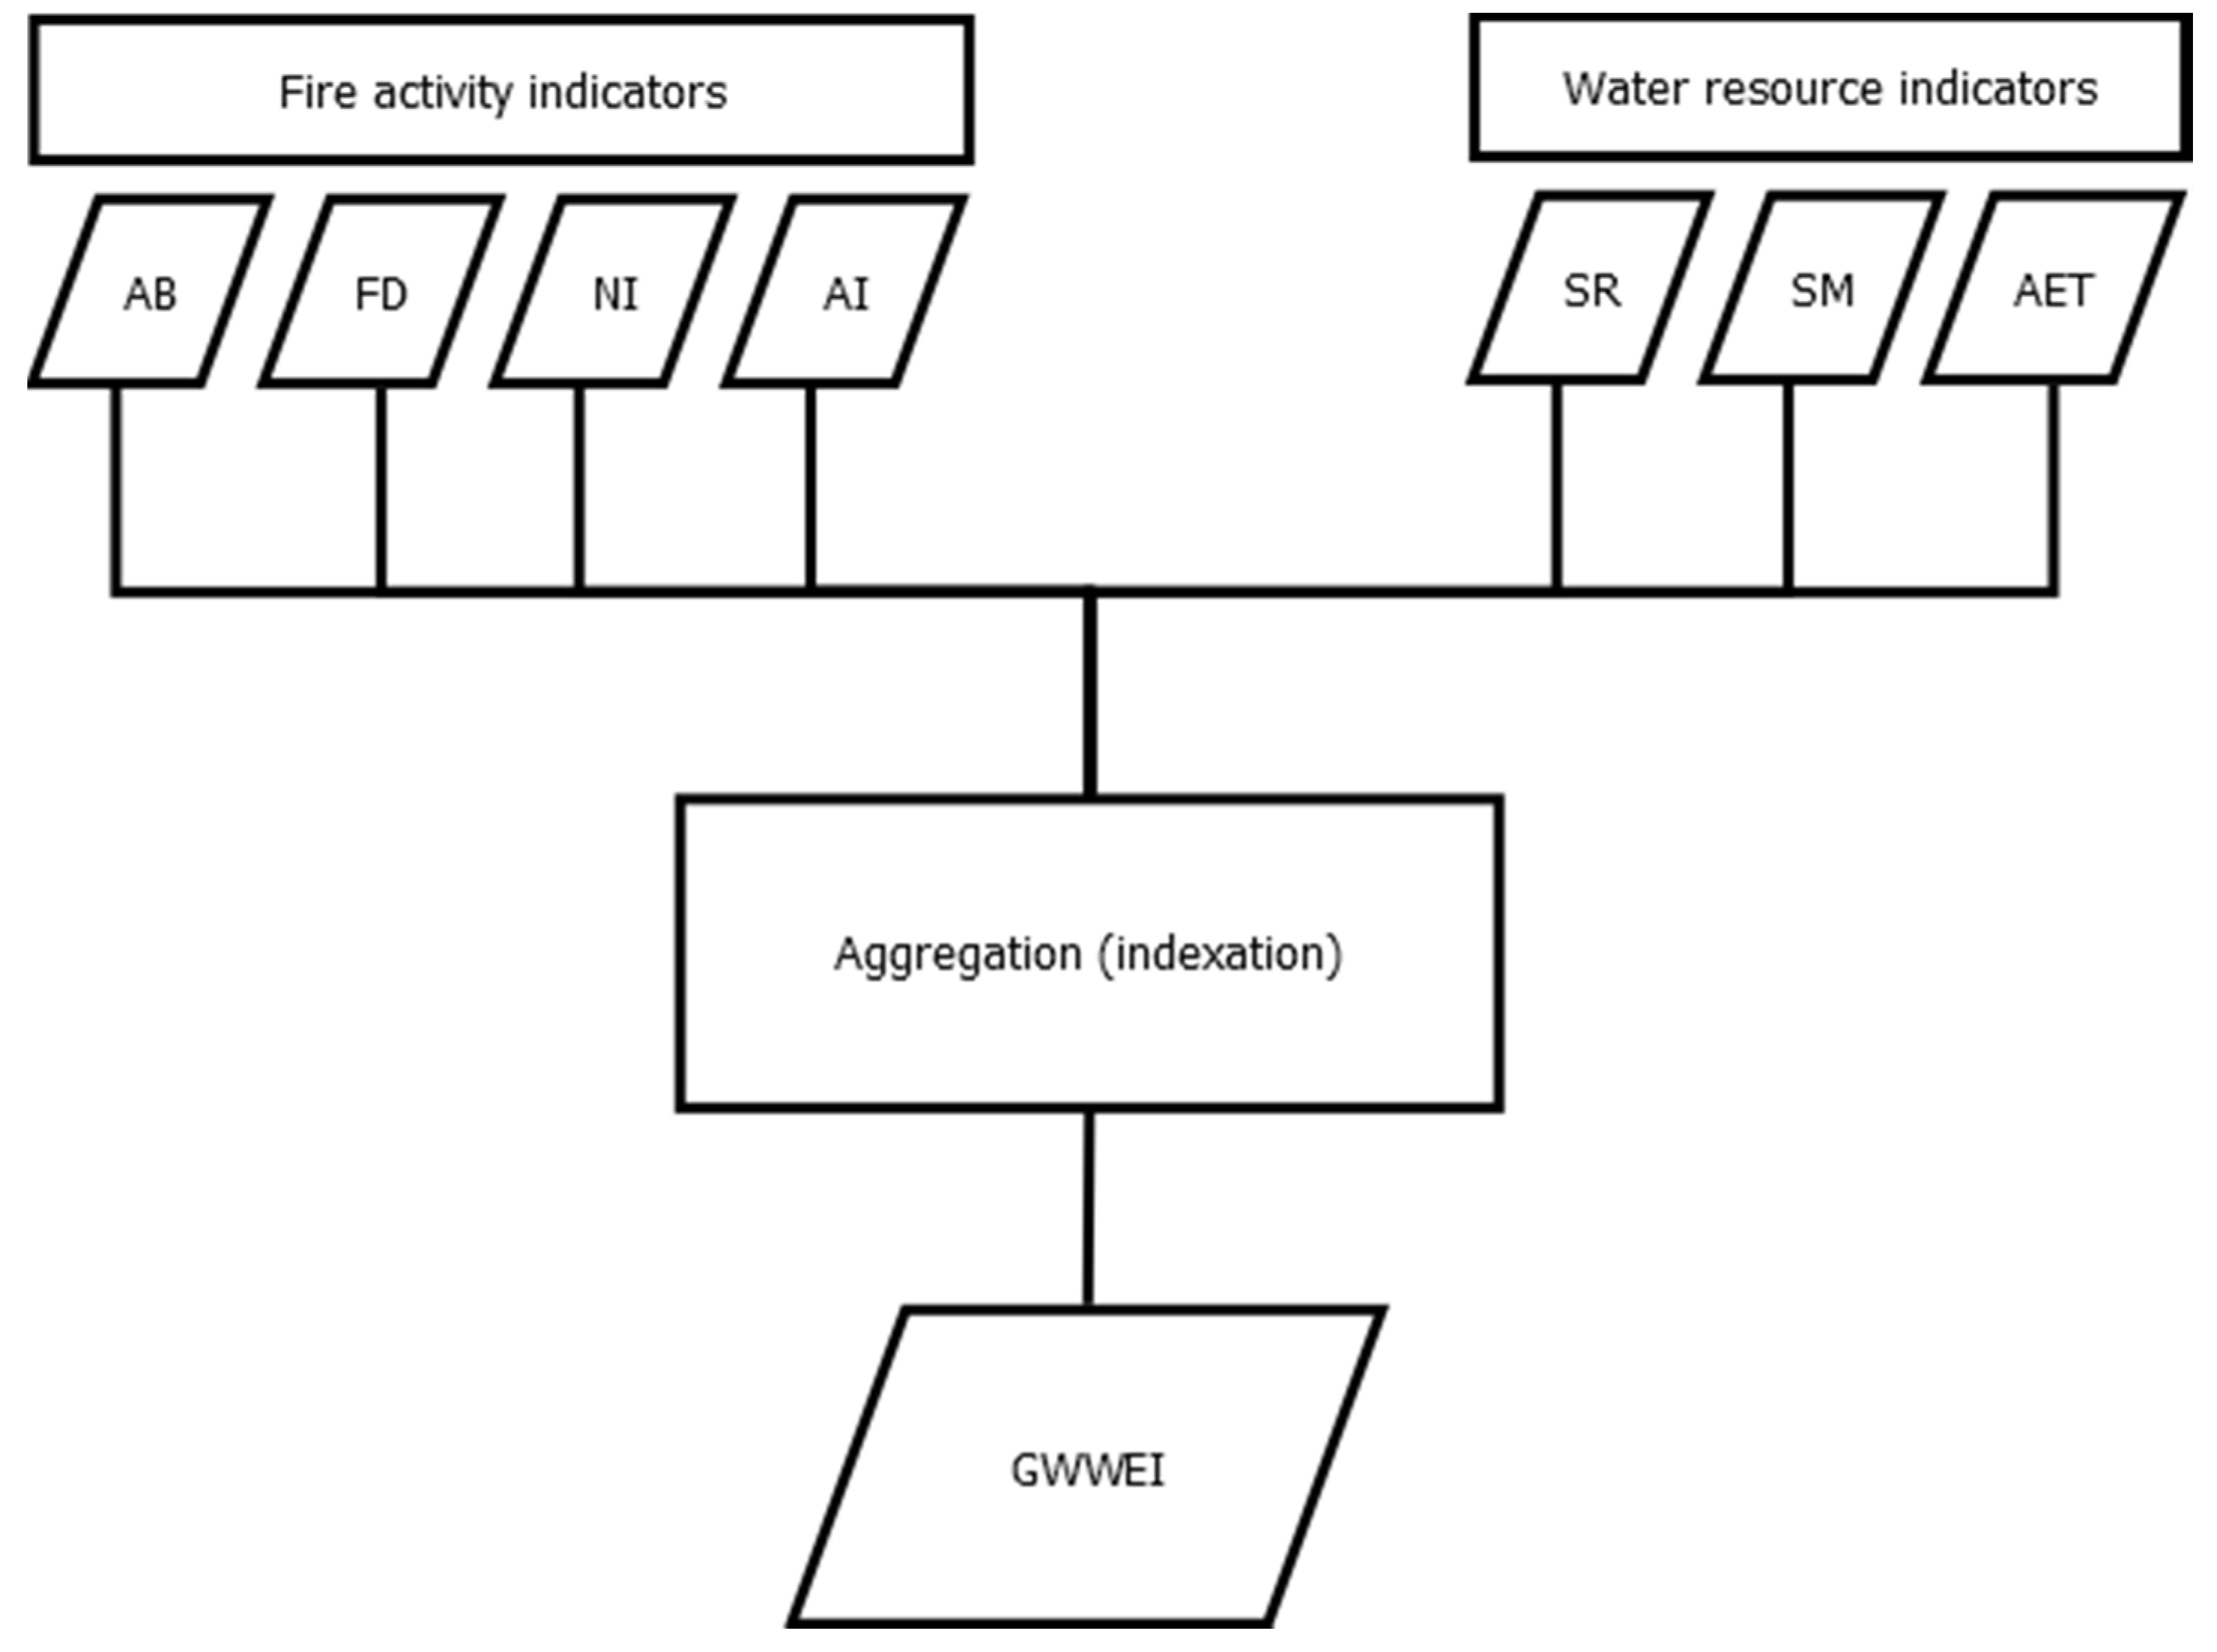
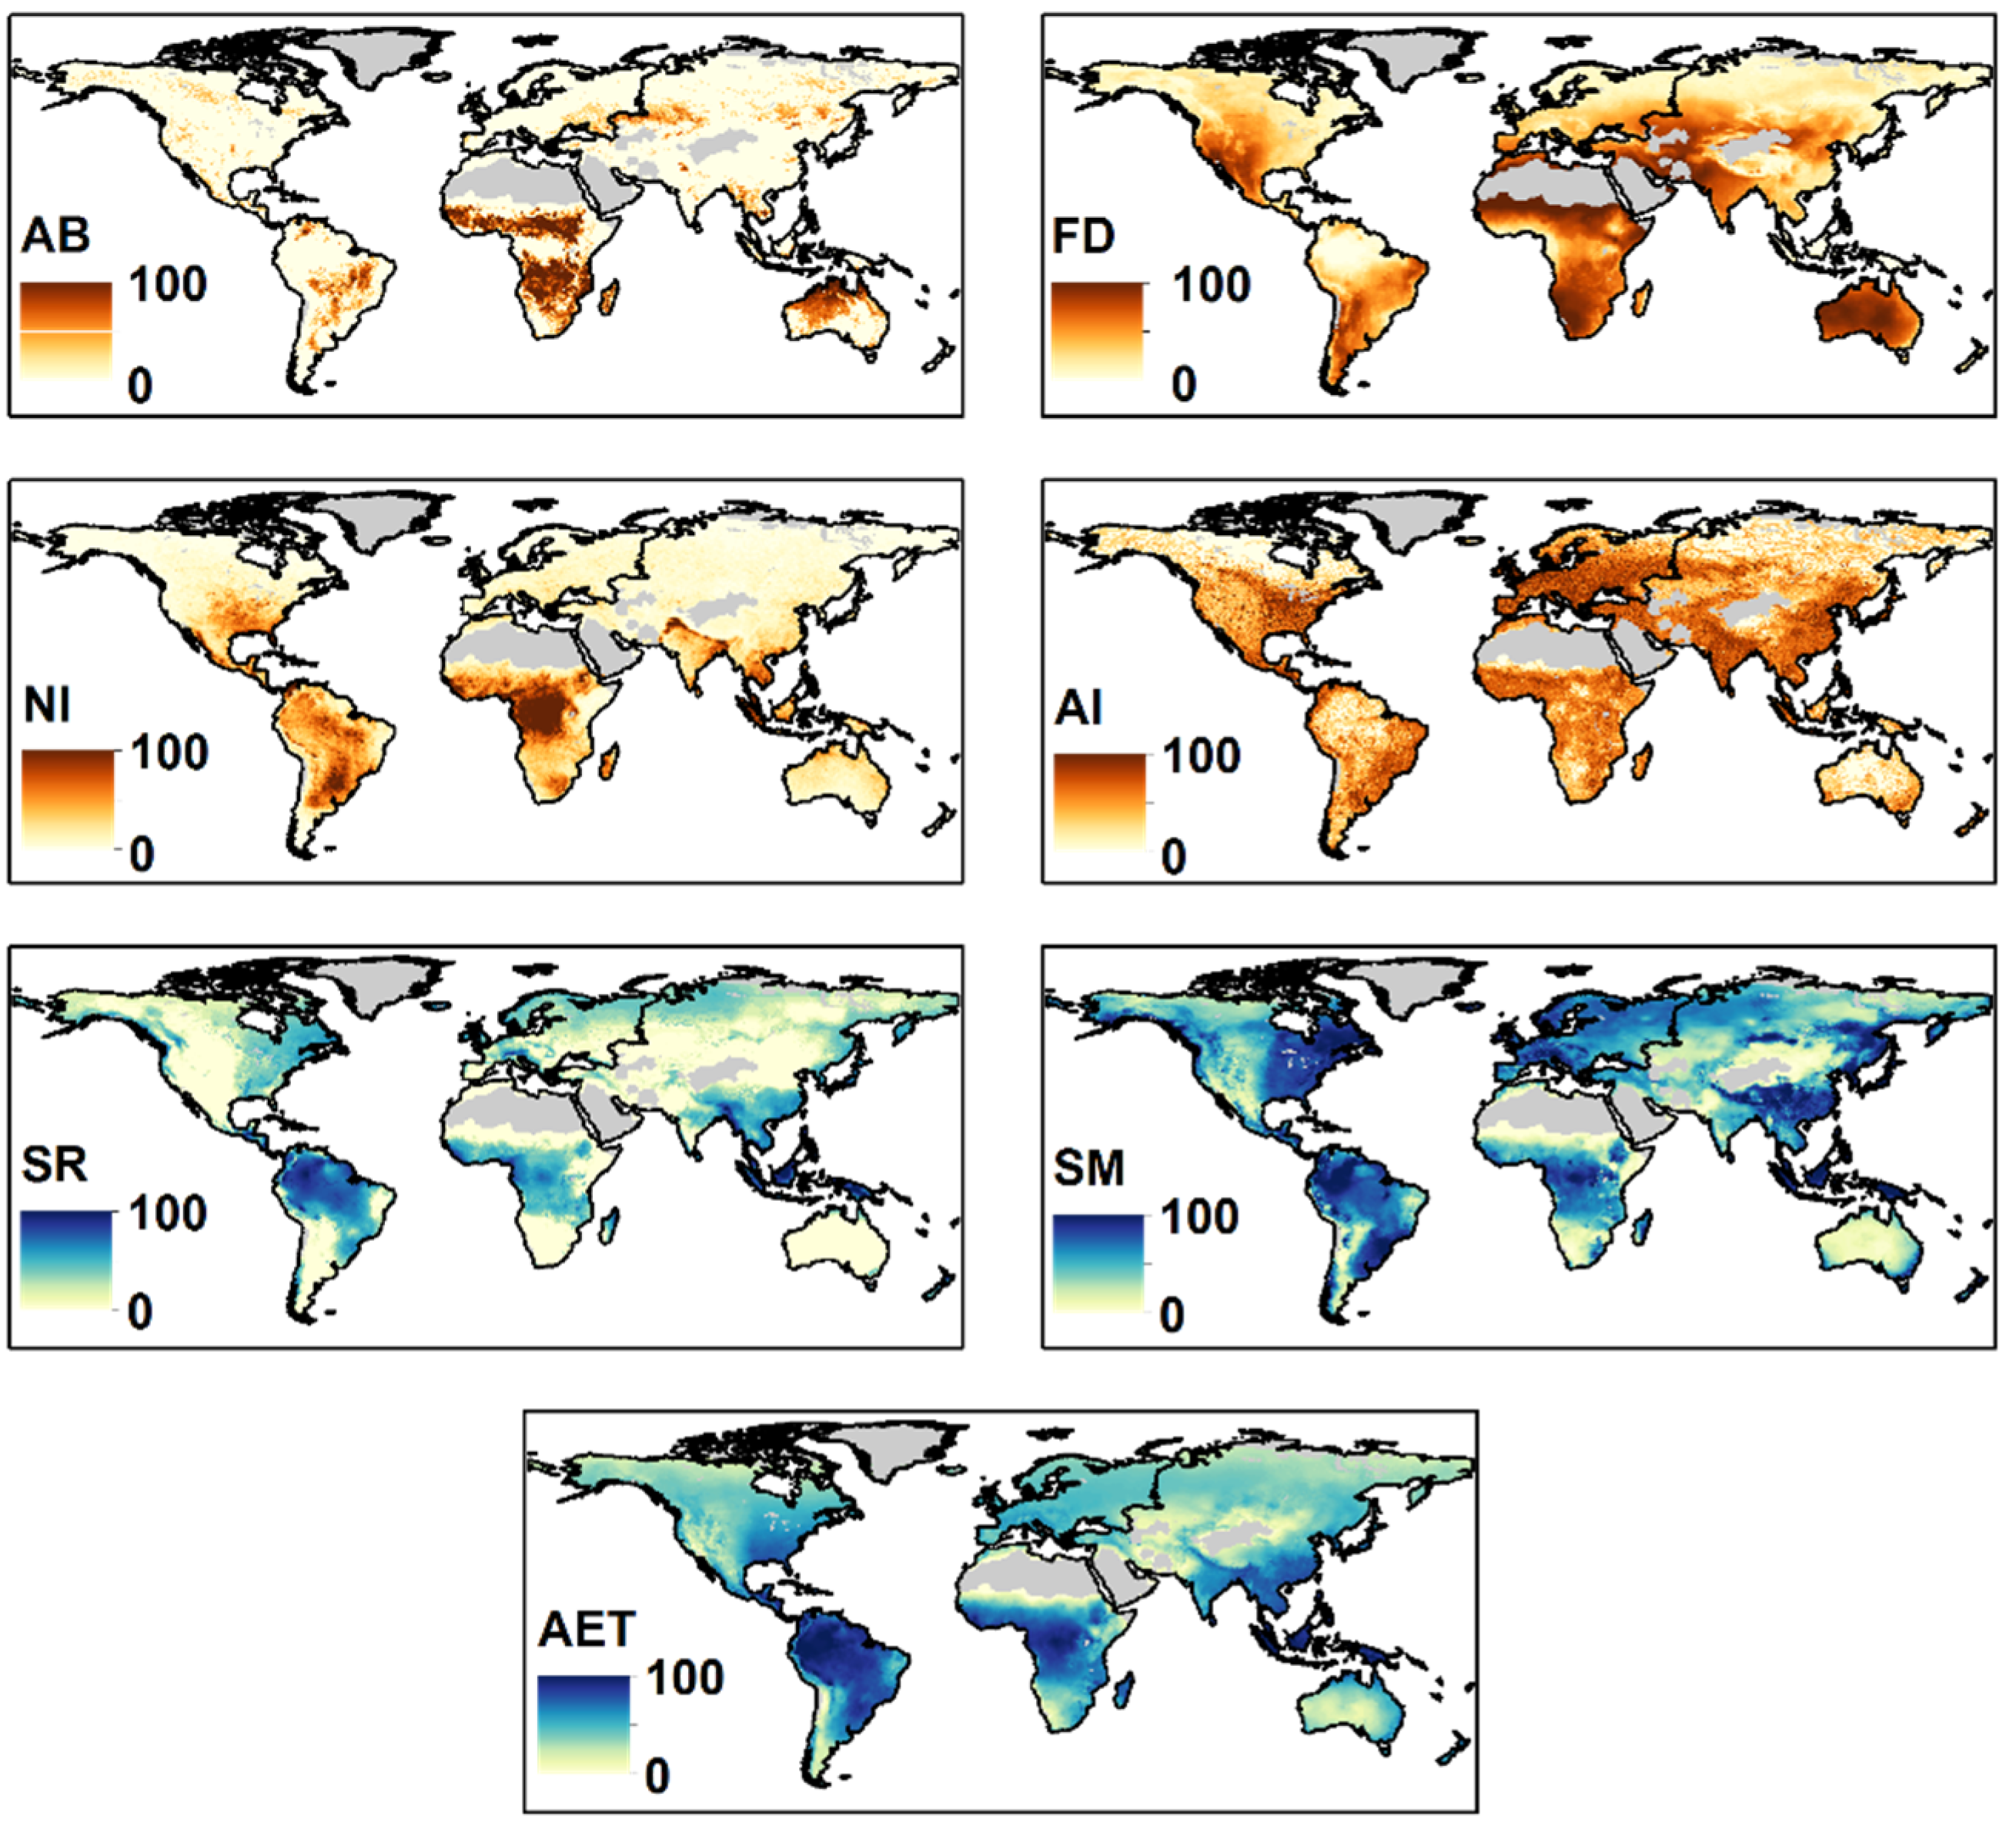
2.1. Data Selection and Indicators’ Definition

We selected a parsimonious set of global indicators that described the potential for wildfire activity and the availability of surface freshwater resources (Table 1). A total of seven indicators were selected based on their availability at the global scale, their relevance to the GWWEI and the nature of the information (i.e., yearly to multi-decadal averages). All data used in this study are “off-the-shelf” and freely available on the Internet or by request from the authors. Although our data have some discrepancies in their time period, they are the product of large-scale long-term monitoring, which substantially smooths spatial and temporal variability, making them suitable for use in a global model. Although slight temporal mismatches may be responsible for some inaccuracies, there is reason to believe that these would be relatively minor.
Figure 1. Schematic of the global wildfire water exposure index (GWWEI) framework. AB, area burned; FD, fire danger; NI, natural ignitions; AI, anthropogenic influence; SR, surface runoff; SM, soil moisture; AET, actual evapotranspiration.
Forests 07 00022 g001
Table 1. Summary of datasets used to develop the GWWEI indicators. NASA: National Aeronautic and Space Administration, SEDAC: Socioeconomic Data and Applications Center, GWSP: Global Water System Project, CGIAR-CSI: Consortium of International Agricultural Research Centers-Consortium for Spatial Information.
IndicatorData SourceUnitsNative ResolutionCoverage Years
Area Burned (AB)Giglio et al.Ha/month0.25°1997–2013
Fire Danger (FD)NASAunitless0.5° × 2/3°1980–2014
Natural Ignitions (NI)NASAFlashes/km2/year0.5°1995–2010
Anthropogenic Influence (AI)SEDACUnitless (0–100)0.08°1960–2004
Surface Runoff (SR)GWSPmm/year0.5°1950–2000
Soil Moisture (SM)Terrestrial water budget; data archivemm/m0.5°1950–1999
Actual Evapotranspiration (AET)CGIAR-CSImm/year0.08°1960–1990
Area burned (AB) has been found to be a good global proxy for fire activity [23], especially as fire size is an important factor of post-fire impact to water resources [3]. Mean monthly area burned (hectares) for large fires (>120 ha) was extracted from the Global Fire Emission Database (GFED) V4, a database derived from remote-sensing imagery acquired with several sensors. Data span 1995–2014, and are spatially aggregated at a 0.25° pixel resolution [24,25]. Our AB indicator, as an average of the monthly area burned for the past 20 years, provides a view of areas experiencing most of the fire activity across the planet.
Fire danger (FD) is a measure of the potential for a fire to ignite and spread across the landscape and therefore is critical to assess water resources exposure. The most common fire danger metrics are calculated using the Canadian Fire Weather Index (FWI) System [26], which estimates existing fire danger across an area as derived from observations of four fire-weather elements (i.e., temperature, relative humidity, wind speed, and precipitation). An increasing index value means lower fuel moisture, higher wind speed and, consequently, a greater fire danger. Data come from the Global Fire Weather Database (GFWED), a global database of the FWI system and its components. Data are derived from the Modern Era-Retrospective Analysis for Research and Applications (MERRA) climate product provided by NASA and ground weather stations, compiled for 1980–2012 at a resolution of 0.5° latitude × 2/3° longitude [27,28]. Our FD indicator, based on the final FWI, provides information about the potential for fire activity, but does not account for actual area burned, vegetation composition or human influence on fire activity.
In many places of the world, lightning activity is an important factor of fire ignition [23] that can lead to a large area burned when it occurs in remote areas [29,30,31]. We used the mean annual lightning flash rate as an indicator of natural ignitions (NI), expressed as the number of flashes per km2 and per year. Data come from the High Resolution Flash Climatology, a sub-product of the Gridded Lightning Climatology dataset produced by the Lightning and Atmospheric Electricity Research Team at NASA using LIS/OTD remote-sensing observations. It is the result of flash counts per area scaled by the detection efficiency of sensors and gridded at a resolution of 0.5° for 1995–2010 [32]. We build our NI indicator considering that a higher lightning flash rate is associated with a higher chance for lightning to reach the ground, potentially starting a fire when the strike occurs in a vegetated area. As it does not account for individual strikes, lightning activity should not be considered as an actual fire ignition product.
The anthropogenic influence (AI) on fire activity is well known, but is still a matter of debate, as the nature of this influence is complicated [33,34,35]. Nonetheless, a recent study argues that human influence tends to decrease fire activity at the global scale [16] and, consequently, the area burned. We thus consider higher levels of AI as an indicator of lower fire activity. As a proxy for AI, we used the Human Footprint Index (HFP) V2 data from the Socioeconomic Data and Applications Center from NASA, computed from 1995 to 2004 at a one-kilometer pixel resolution. This data depicts the extent and density of human features, conveying higher levels of disturbances to natural areas, with lower values showing a lower footprint, on a 0–100 score scale [36]. However, scores are scaled per biome and, thus, encompass different socio-environmental configurations, which, in turn, have different effects on fire activity across the globe [35].
Surface runoff (SR) is excess precipitation contributing to surface river-stream networks after evaporative and drainage losses. It can be greatly increased due to changes in water interception by vegetation and alteration of soil properties caused by wildfires. SR data is available as long-term average runoff, derived from a global water-balance model and river gauging stations, computed in mm/year at a 0.5° pixel resolution over the 1950–2000 period [37,38]. For this study, our indicator assumes that areas showing higher levels of SR play a prominent role in the amount of available water resources and are thus more vulnerable to disturbances. We thus considered them as preferential areas of post-fire runoff increases. That said, if natural SR increases when vegetation cover is reduced, it becomes more difficult to predict and can lead to greater erosion levels and floods.
Soil moisture (SM) reserves are critical to sustain surface runoff and dry season river-stream baseflows. Although high levels of SM favor runoff and water availability, it is also sensitive to post-fire changes in vegetation cover [39]. SM data were compiled from the Atlas of the Biosphere [40] and based on the Terrestrial Water Budget Data Archive produced by the Center for Climatic Research at the University of Delaware [40,41,42]. Data were derived from several thousands of weather stations records from 1950 to 1999 and interpolated at a 0.5° pixel resolution. Our indicator assumes that a drop in soil moisture content after a fire is caused by greater inputs of radiative energy [43], which, in turn, negatively impact SR levels and amounts of water during the dry season.
The reduction of the vegetation cover after a fire might impact actual evapotranspiration (AET) levels [44], which is the effective quantity of water released by vegetation transpiration and water evaporation from the soil. AET data come from the Consortium of International Agricultural Research Centers-Consortium for Spatial Information (CGIAR-CSI) [45] and show the average of AET in mm/year at a 0.08° pixel resolution, from 1950 to 2000, based on WorldClim inputs. Our indicator is used as a proxy for post-fire water-balance change, based on the reasonable assumption that without vegetation interception and respiration, AET will mainly be converted to runoff. This process would be limited, however, by expected increases in post-fire soil-water evaporation.

2.2. Data Processing and Aggregation

All data were rasterized, reprojected to the WGS84 geographic coordinate system and resampled to a 0.5° pixel resolution. We used the FWI layer, which does not account for desert areas, as an extraction mask for other layers. Therefore, we avoided result biases by including arid areas where climatic conditions restrain water availability, as well as vegetation growth and, consequently, wildfire activity. We also processed the grids in order to match the spatial coverage of FD. Finally, small islands without consistent coverage through the different layers were removed, as well as Greenland and Antarctica (28% of global land surface). Data were processed with ArcGIS 10.1 [46] and exported as GeoTIFF images for post-processing.
Prior to the indexation process, data were normalized between 0 and 100 scores and then considered as actual indicators of the GWWEI (Figure 2). Normalization, in this context, makes indicators comparable to each other by replacing initial values (e.g., mm or ha) according to a common and standard scale, here 0–100. Our raw exposure index is then a simple pixel-wise additive aggregation process of the selected indicators, based on their respective attributed weight:
I = i = 1 n w i x n , i
where I is our final risk index; n is the number of indicators (i.e., 7); wi is the relative weight of each indicator; xn,i is the normalized value of each indicator [47].
Our weighting scheme assigns 50% to fire indicators and 50% to water indicators and equally partitions the weights within each of these groups. Therefore, we assigned a 16.6% weight to each water indicator (3) and a 12.5% weight to each fire indicator (4). As a result, one pixel’s final score in the index theoretically ranges from 0 to 100, a higher score meaning a higher concentration of exposure factors. This method is inspired by the work of Freudenberger et al. [19]. Data normalization and index calculation were carried out using Insensa-GIS (0.2.0.1), 64-bit version [47].
Figure 2. Map series of selected spatial indicators. Wildfire indicators are shown in orange tones; water indicators are shown in blue tones.
Forests 07 00022 g002

2.3. Sensitivity Analysis

It is critical in indexation models to test the robustness of the aggregated index to evaluate the level of confidence in the final score [48]. We thoroughly evaluated the sensitivity of the raw index to the seven indicators using one non-spatial approach and six spatial approaches (Table 2). The main product of this analysis is a measure of score variability expressed as a coefficient of variation that was computed from the re-weighting of the indicators and by omitting some indicators from the calculation in order to assess their relative weight to the final score.
Table 2. Details pertaining to each sensitivity analysis method.
Sensitivity Analysis MethodProcedure DetailWeight Variation Scheme# of Modified Indices
Spearman/Pearson correlationCalculus of correlation coefficients between index and indicators--
StepwiseOne-by-one addition of each indicator until final index--
JackknifingIterative exclusion of each indicator in the aggregation process-7
Low/high case scenarioBounded weight variation based on indicator distributionWithin 6.5% and 18.5% for fire indicators; Within 10.6% and 22.6% for fire indicators2
Random variationBounded random weight variationWithin 6.5% and 18.5% for fire indicators; Within 10.6% and 22.6% for fire indicators14
Systematic variationIncremental bounded weight variationWithin 6.5% and 18.5% for fire indicators; Within 10.6% and 22.6% for fire indicators28
The first common technique we applied was to non-spatially analyze index sensitivity by measuring the level of correlation between the GWWEI and each indicator separately, as well as among indicators (Table 3). The Spearman correlation coefficient table was generated as a measure of dependency, such that indicators highly correlated with the final index have an overall higher influence on final index scores.
Table 3. Spearman correlation coefficients between the GWWEI and source indicators, as well as between indicators.
GWWEIFireWater
ABFDNIAIAETSMSR
GWWEI1.000.21−0.110.55−0.060.760.740.66
FireAB0.211.000.360.35−0.060.20−0.13−0.04
FD−0.110.361.000.41−0.31−0.14−0.58−0.57
NI0.550.350.411.00−0.410.650.150.15
AI−0.06−0.06−0.31−0.411.00−0.40−0.16−0.02
WaterAET0.760.20−0.140.65−0.401.000.680.63
SM0.74−0.13−0.580.15−0.160.681.000.76
SR0.66−0.04−0.570.15−0.020.630.761.00
The simplest spatial approach we used for our sensitivity analysis was the “stepwise” method. We reprocessed GWWEI adding one indicator at a time. We started with the weighted aggregation of only AB and SR, as the former is the recorded fire activity and the latter is the recorded natural water availability; together, these indicators logically provide the simplest possible index. Then, we added the other indicators individually, alternating fire and water indicators until all were included (i.e., the GWWEI itself). This simple stepwise approach to sensitivity analysis allowed us to monitor the spatial changes caused by the addition of each new variable included and to assess variation in the spatial distribution of risk scores.
Insensa-GIS [47] also implements several modes allowing for a thorough spatial sensitivity analysis. We used jackknifing; low-high case scenario weighting; random weighting; and systematic weighting of indicators. These four methods captured the variability in indicator aggregation, giving information about their intrinsic influence when compared to the original index results (Table 2). For all weight variation modes, we computed a pixel-wise mean and coefficient of variation and averaged them into one final map of the index’s overall coefficient of variation.
The jackknifing mode involves the iterative exclusion of each indicator from the aggregation procedure. As this process removes our seven indicators successively to create a new index each time, jackknifing produced eight modified indices; in other words, one for each missing indicator.
Lower and higher case scenarios modify the weight of indicators according to a predefined range of variation, which is based on their influence on the aggregation result. As such, if an indicator favors high index scores, its weight will be depreciated, yet not below the predefined minimum. The opposite is true for a higher case scenario, whereby an indicator lowering the final index scores will be over-weighted, below or equal to the upper bound of the range of variation. We set the lower case weight boundary to 6.5% and the higher case weight boundary to 18.5% for fireindicators and 10.6%–22.6% for water indicators, a range we consider wide enough to capture index variability. This process produced two modified indices, one for each scenario.
Random weight variation involves the randomization of each indicator’s weight during the aggregation procedure, according to a predefined variation range. We set the same variation range as for the previous mode, which means that an indicator can randomly be assigned any weight in this range during indexation. We applied this procedure several times to increase the detection of variations in index scores, which resulted in 14 new modified indices.
Finally, we created a rule set to apply the systematic weighting variation mode. We kept the same range of variation that we used for previous modes with a 3% step increment. The process is repeated for each indicator, resulting in 28 new modified indices. In total, the sensitivity analysis created 51 modified versions of the index (not shown), with the coefficient of variation computed for each of the four modes. We averaged those to produce a map of the per-pixel mean variability of the GWWEI scores, where areas showing higher variability are thus more sensitive to changes in the indicators’ values.

3. Results and Discussion

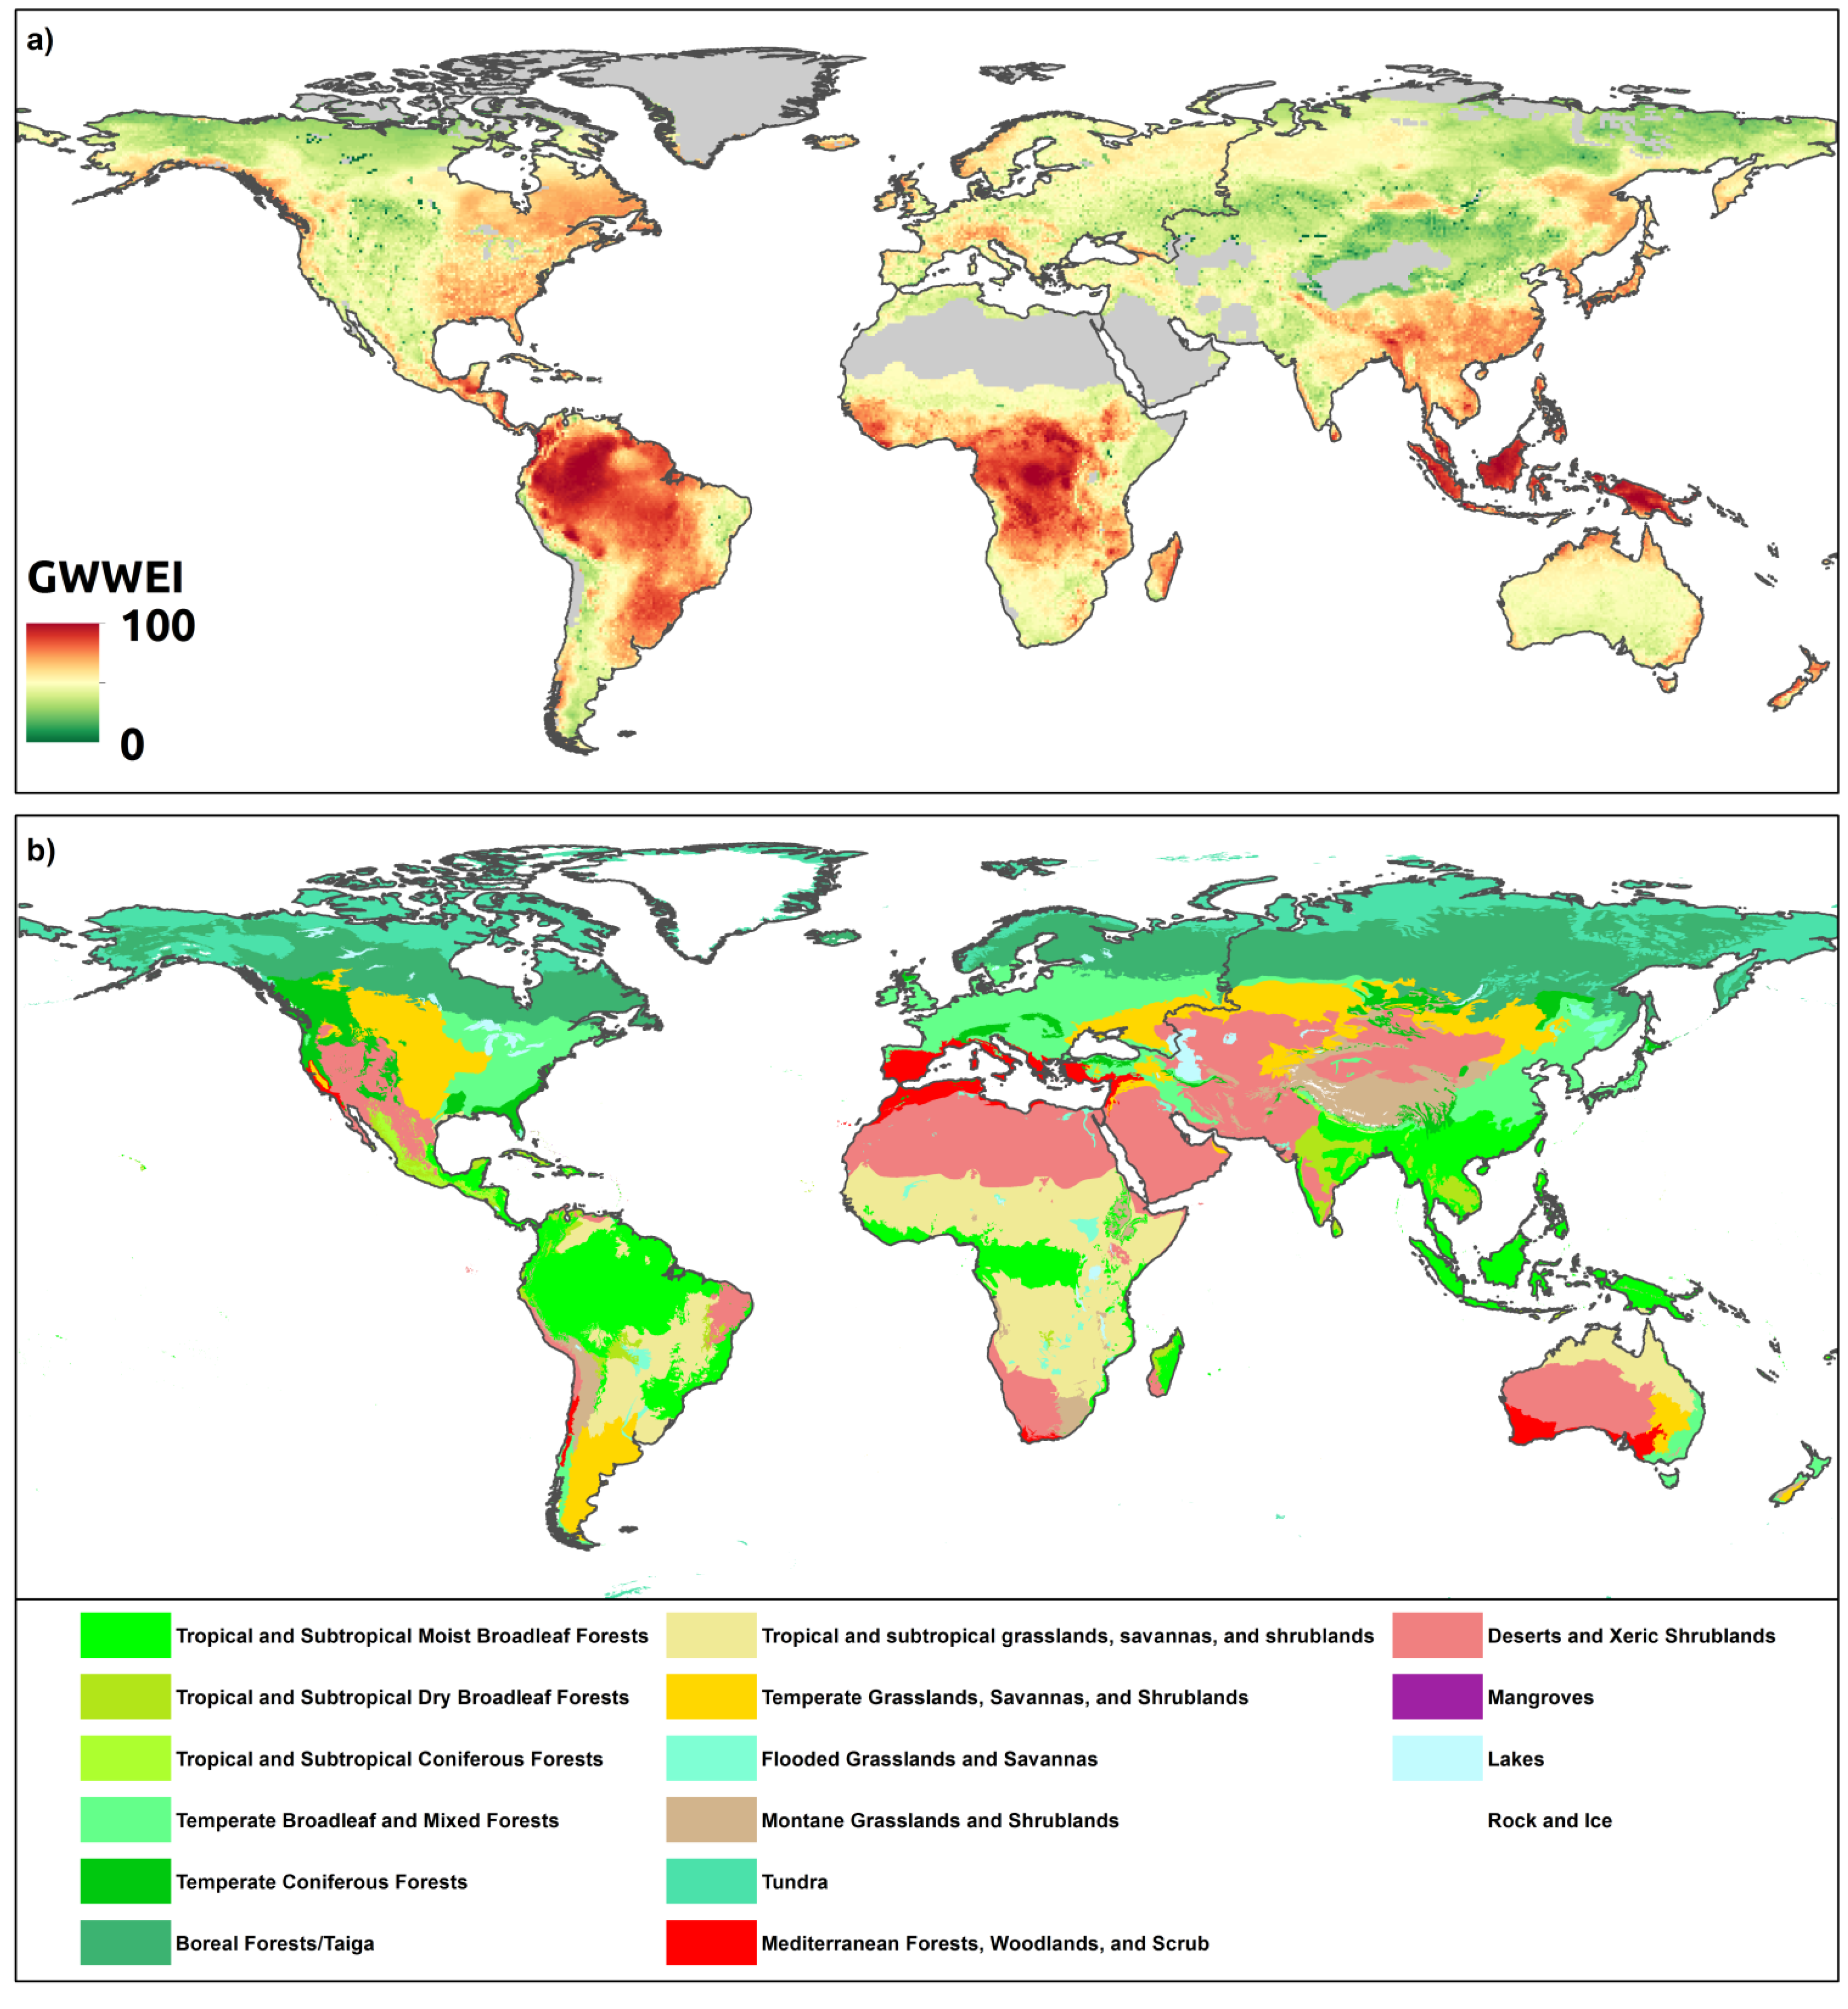
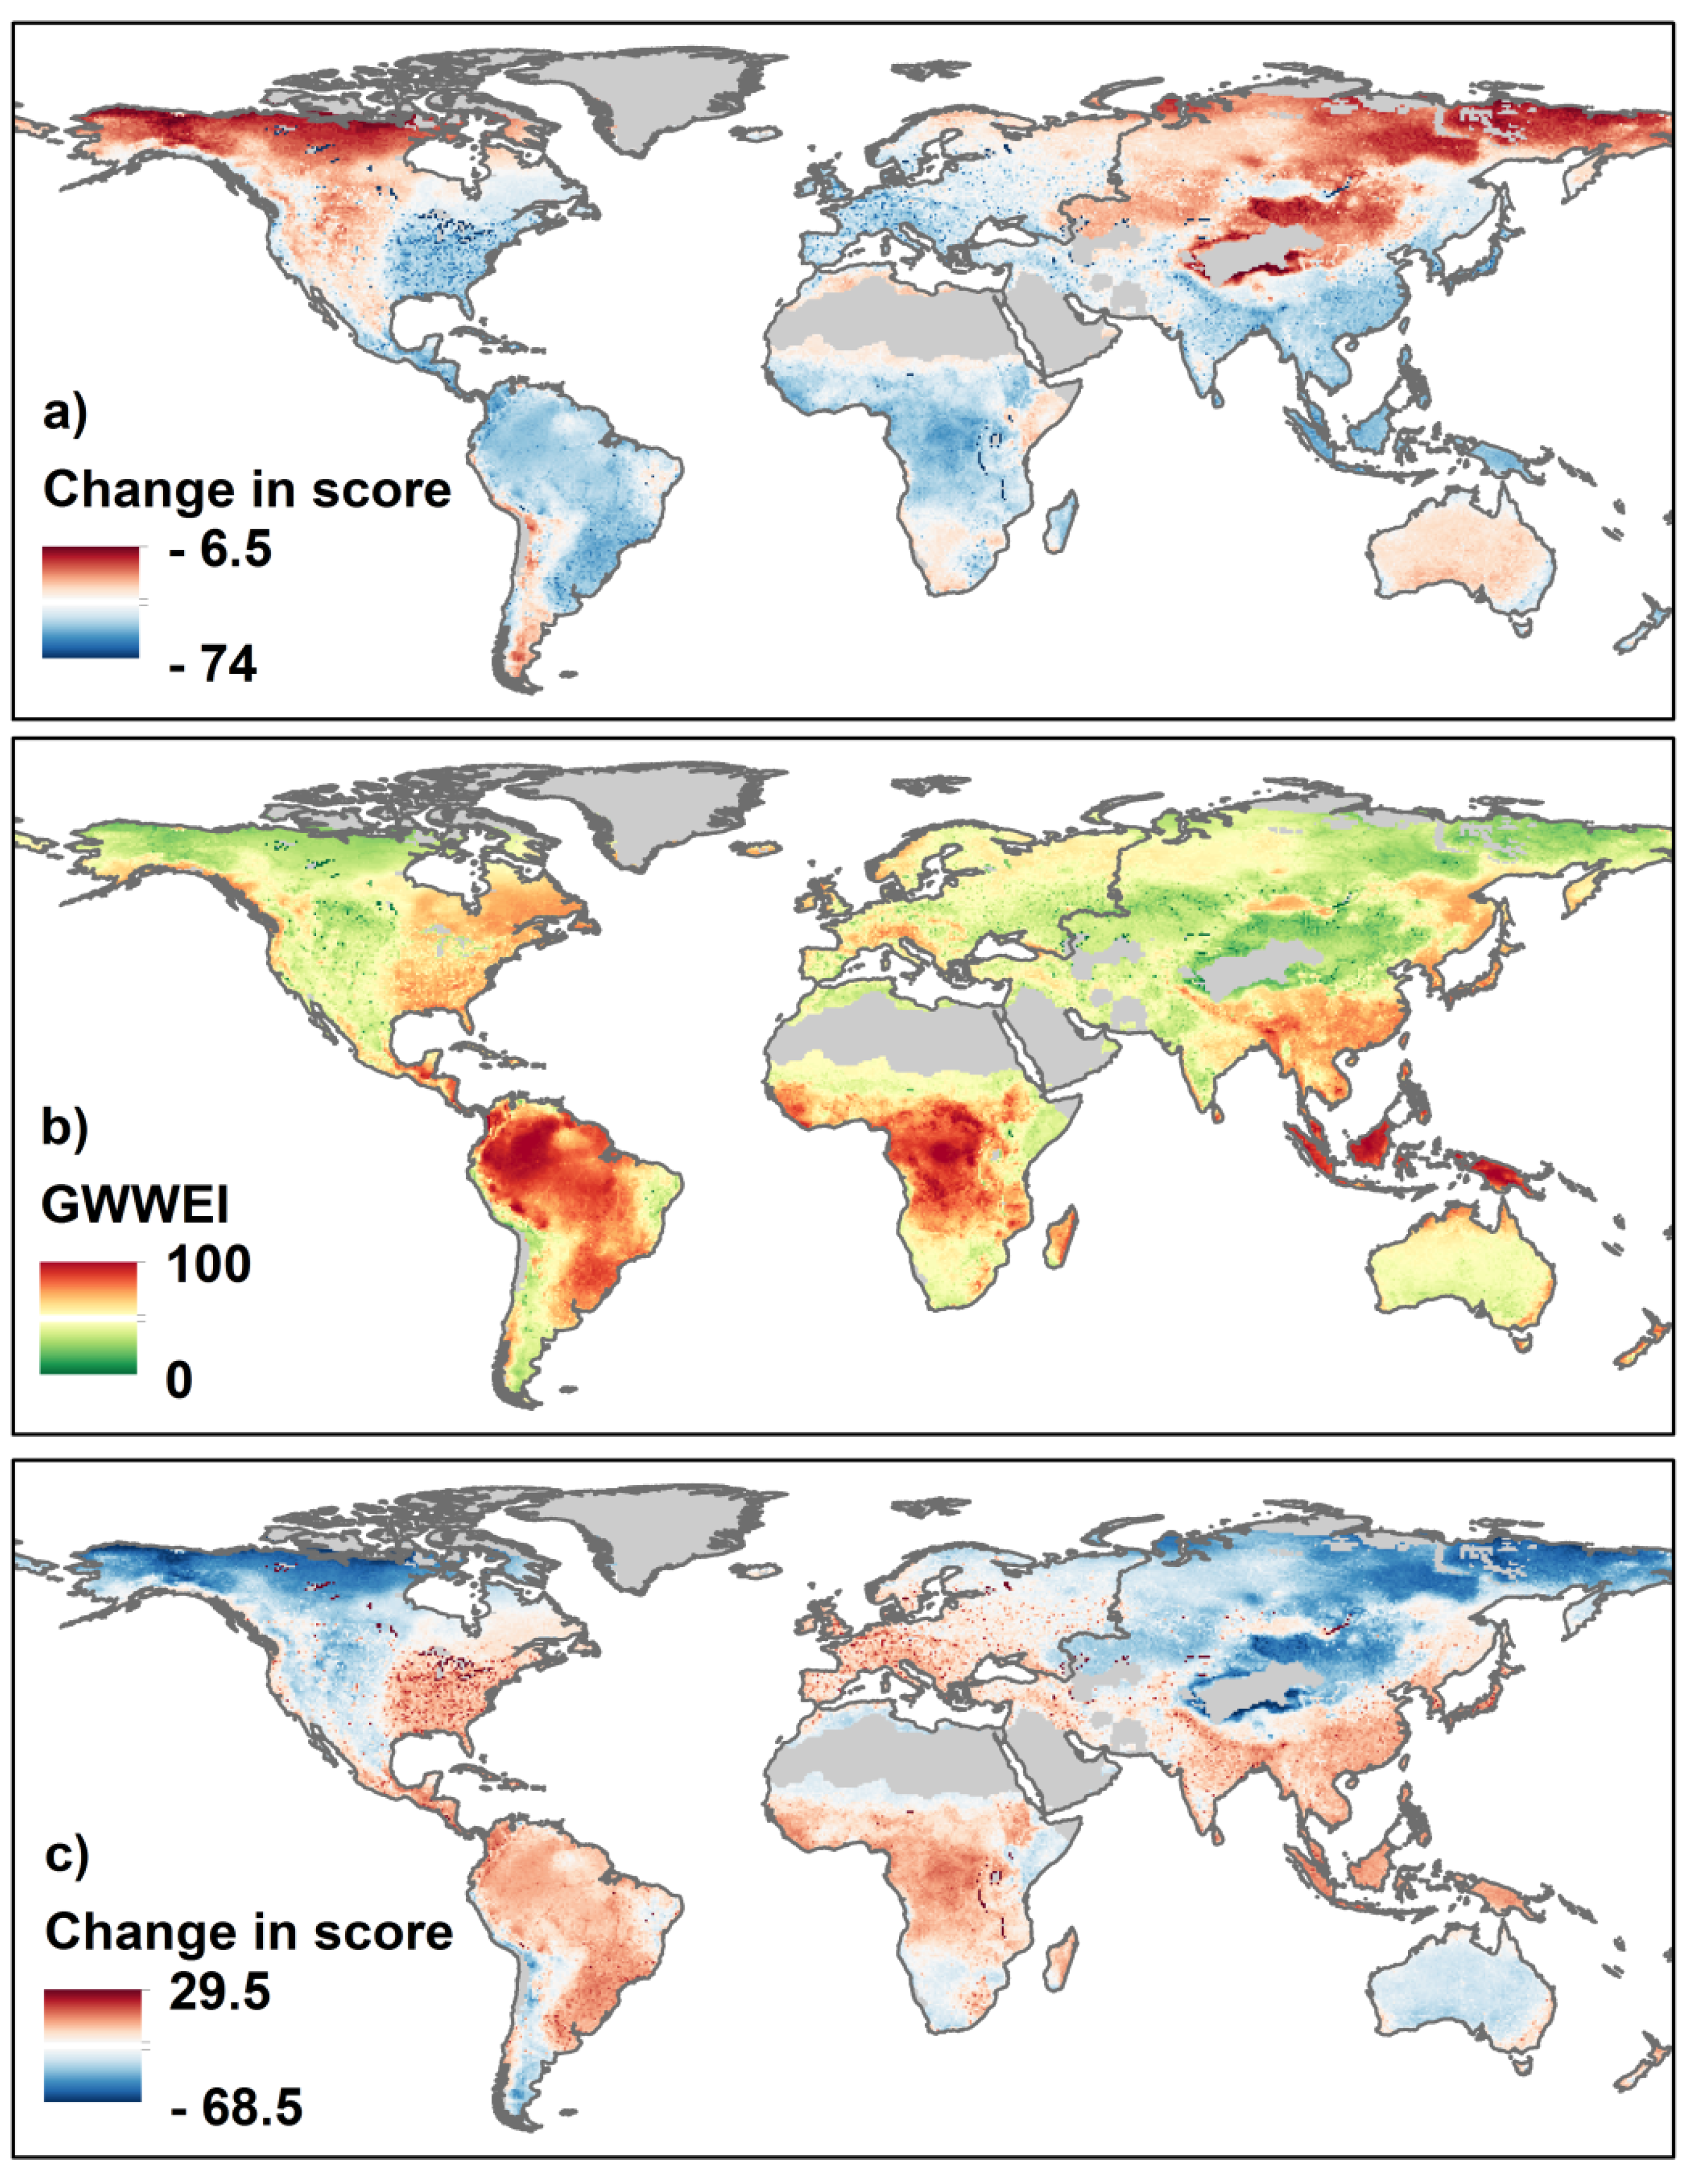
3.1. Geography of the GWWEI

Our GWWEI (Figure 3a) shows the distribution of the exposure of water resources to wildfires across the globe. Highest scores are concentrated in the tropical latitudes, more specifically in the forests of the Amazon basin, the Congo basin and Indonesia. Moderately high scores are mostly located in the subtropical humid forests of southeastern Asia, southeastern North America, Central America and in fire-prone dry forested savannas of Africa, southeastern South America and southeastern Oceania. A large part of northeastern North America, as well as many mountain ranges across the globe, also show moderately high scores. Intermediate scores are shown in dry savannas, dry steppes and dry shrublands on all continents, as well as in the Mediterranean, the northwest of the Eurasian boreal forest and the southern range of the North American boreal forest. The lowest scores are seen in the temperate prairies of North America, South America and Eurasia, as well as in the northern boreal and the tundra (Figure 3b).
At this stage of our framework development, it is important to recall that the GWWEI does not describe a quantitative likelihood or probability of impacts on water resources. It rather depicts the geographic overlay of important drivers of the WWR and identifies areas where such quantitative assessments must be carried out. Working at the global scale usually smooths regional differences, and in this regard, the scores should be interpreted according to specific environmental, socio-cultural and economic factors. For instance, high scores in African savannas are mostly driven by the AB, as those ecosystems experience most of fire activity on Earth [24], whereas high scores in mountain ranges are mostly driven by intermediate to high scores of SM. It is important to note that indicators are global-scale proxies that may not be suitable when estimating fire risk or water discharge across small areas.
Figure 3. (a) Map of the global GWWEI as provided by additive aggregation. The index is dimensionless; scores stretched to 0–100. Higher values (100, dark red) mean a higher concentration of risk factors; (b) A map of terrestrial biomes [49] is also provided for comparison purposes (see Section 3.1).
Forests 07 00022 g003

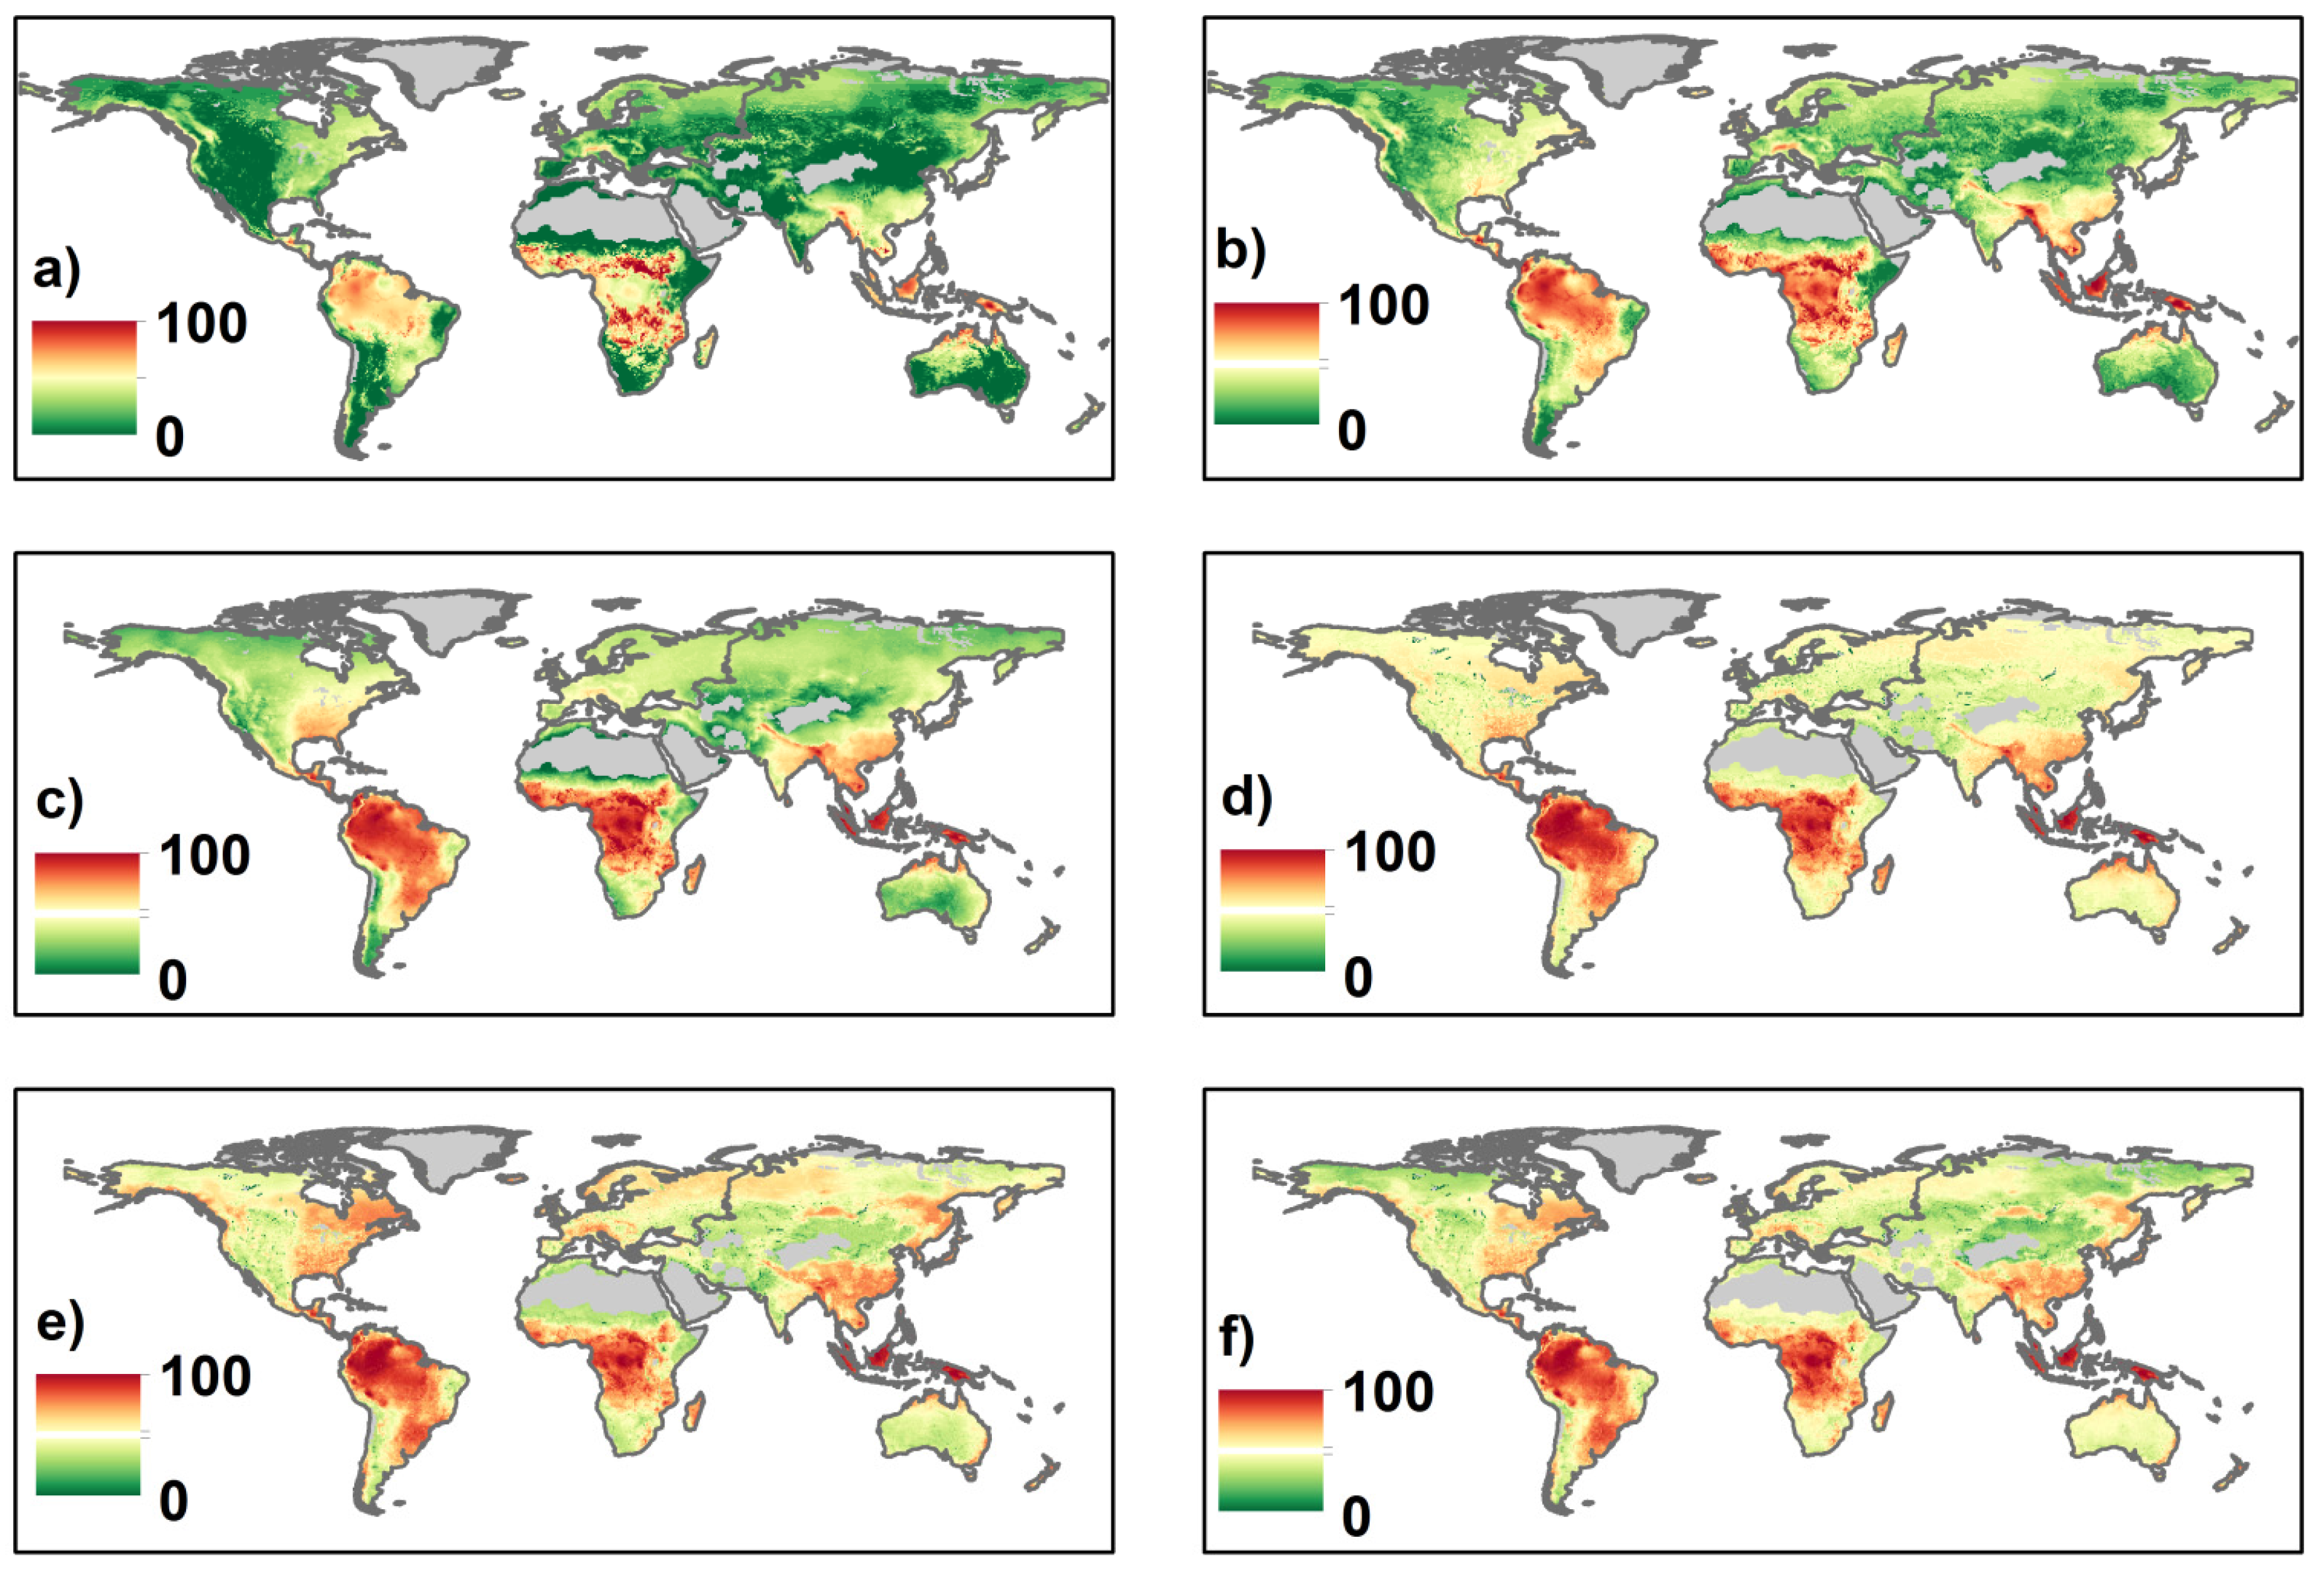
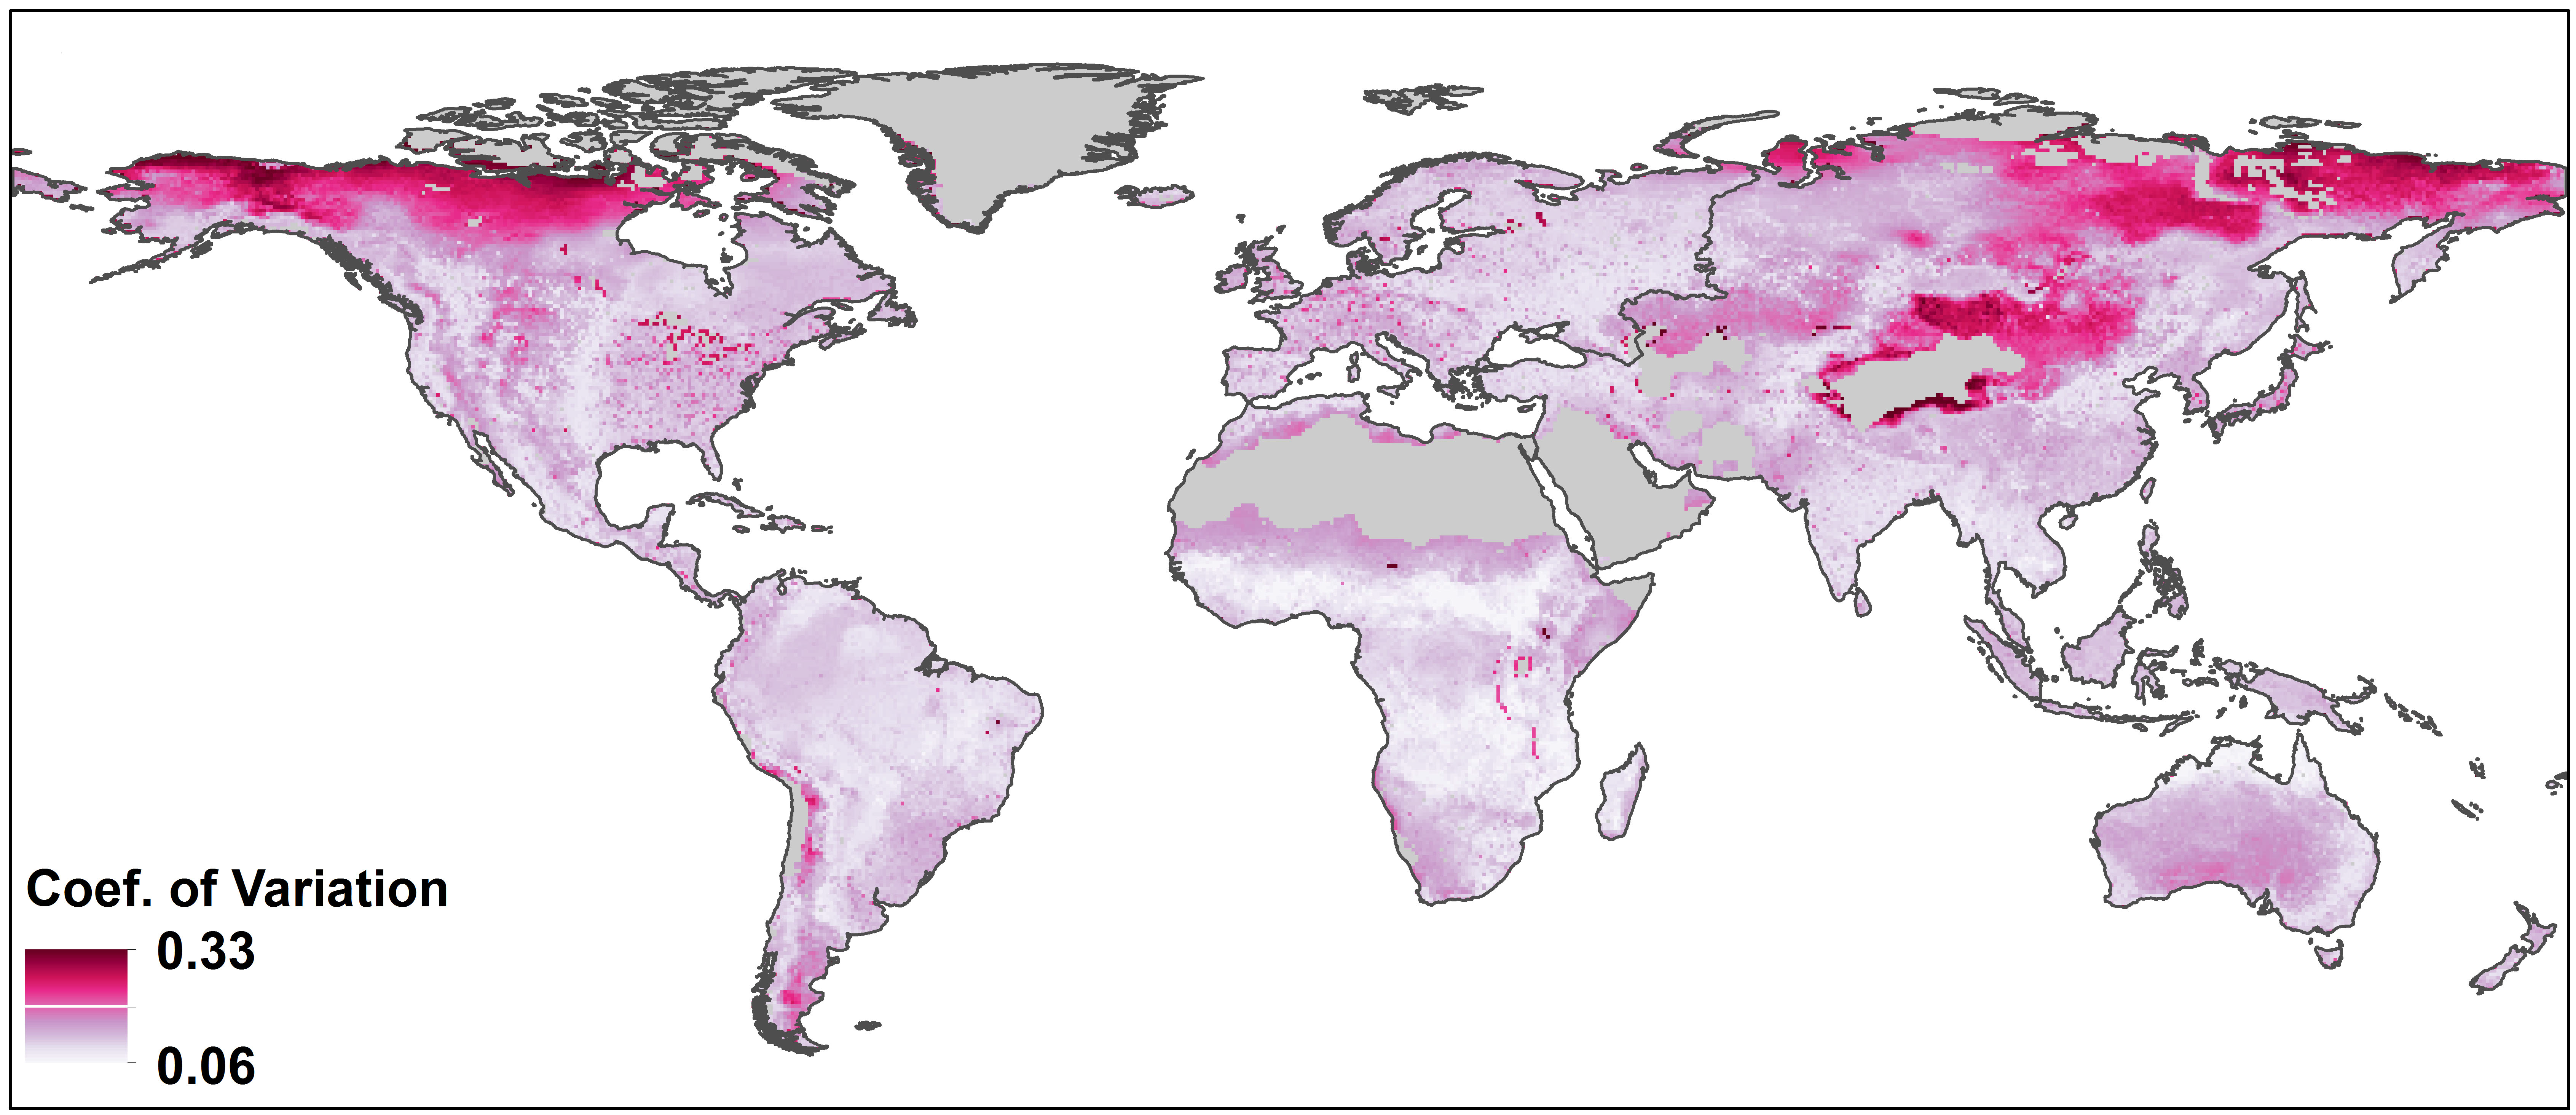
3.2. Sensitivity of the GWWEI

The Spearman correlation coefficients (Table 3) between the GWWEI and indicators show that the most influential water indicators are AET (0.76), SM (0.74) and SR (0.66), whereas the most influential fire indicators are NI (0.55) and AB (0.21). The correlation between the index and water indicators explains the pattern of high values in tropical areas, which naturally concentrate a very dynamic hydrological cycle. This influence of water resource indicators is confirmed by the stepwise approach, where the inclusion of AET in the simplest version of the index (Figure 4a) sets a pattern that is conserved and enforced through all steps (Figure 4b–f), with SM being critical in setting the pattern for mountain ranges, such as the Himalayas or Southern Alaska, as well as increasing scores for the southern fringe of the boreal forest (Figure 4c). NI and AB are the fire indicators that add the most to the pattern of the final index, whereas FD and AI show surprisingly low influence. We assume that the strong pattern shown by water indicators may mask information contained in fire indicators, thus showing lower levels of correlation in them.
Although several nonlinear relationships and interactions might exist, they are not explored with these simple correlation coefficients.
Figure 4. Map of the stepwise sensitivity analysis as provided by additive aggregation. (a) AB + SR; (b) AB + SR + NI; (c) AB + SR + NI + AET; (d) AB + SR + NI + AET + AI; (e) AB + SR + NI + AET + AI + SM; (f) AB + AET + NI + SM + AI + SR + FD, i.e., the GWWEI (see Figure 1). The index is unitless; scores stretched to 0–100. Higher values (100, dark red) mean a higher concentration of risk factors.
Forests 07 00022 g004
The highest values of the coefficient of variation (Figure 5) (i.e., where the index is less robust) are mostly concentrated at northern latitudes (i.e., the tundra and northern fringe of the circumboreal forest), where water indicators have the most influence on the wildfire water risk exposure pattern (Figure 6). Moderately high to high variability in index scores is also shown in areas of dense human pressure, like Japan, Western Europe and eastern North America. That said, this pattern is clearly localized, giving clusters of spotted areas on the map. Several mountain ranges, such the Andes, the Rocky Mountains, the European and New-Zealand Alps, also show this range of moderately high values. Moderately low levels of variability cover most of circumboreal, temperate, tropical, and sub-tropical forests and dry shrublands in both hemispheres. Robust estimates of the GWWEI, i.e., the lowest coefficient of variation values, are concentrated in the tropical savannas and the dry temperate steppes, except for the North American prairies, which show a wide range of variability, and for northern Australia, which shows a constant high level in all individual indicator scores.
Figure 5. Map of the average coefficient (Coef.) of variation derived from modified indices. Higher values (dark purple) show higher sensitivity to the weighting scheme used.
Forests 07 00022 g005
Figure 6. Map set of the relative change (%) in final GWWEI scores using the low case (a) and high case (c) scenario mode in the sensitivity analyses. The role of water resource indicators is made clear by the pattern of change when compared with the GWWEI (b).
Forests 07 00022 g006

3.3. The GWWEI and Its Implications for Water Resource Protection

Water security was originally defined as the guarantee of a safe, affordable and sustainable amount of water to fulfill one’s basic daily needs [50]. This definition has been subsequently extended to include the amount of water resources necessary to secure ecological functions, as well as agricultural or industrial activities [51]. Knowing the potential exposure of water resources to wildfire activity, as provided by this study, as well as the current pressure on the water supply worldwide [20,52,53], we argue that a high level of GWWEI can have potential implications for water security. This is especially true in areas that are dependent on surface water coming from a highly fire-prone river basin. Regional studies from Thompson et al. [12], Santos et al. [54] and Moody and Martin [11], as well as reports from the U.S. Forest Service [9] and the Water Research Foundation [55] showed that wildfire risk in source watersheds raises concerns for water treatment and supply. The global information provided by our index might be a good way to identify regions across the planet showing higher levels of exposure, potentially requiring more detailed wildfire water risk analysis for regional water planning and management.
Surprisingly, wildfires are rarely considered as a critical threat to water resources by international authorities. This lack of recognition, despite major worldwide concerns about water sustainability and scarcity, is underlined by the absence of dedicated mentions in most of the global reports and mapping initiatives focusing on water security, water management issues or forested water basin monitoring; in contrast, the role of forests for water resource preservation is widely aknowledged. The GWWEI, as a part of a larger WWR framework, can contribute to knowledge improvement, especially in mountainous areas, known as “water towers”, across the globe. Viviroli et al. [56] indeed showed that several mountainous regions provide at least a “supportive” amount of water for downstream supply needs, and Nogués-Bravo et al. [57] pointed out the extreme sensitivity of headwaters to natural hazards in the context of climate change, though wildfire was not considered. Mori and Johnson [58], for instance, demonstrated that mountains might experience significant changes in their fire regime because of climate change, whereas Moody and Martin [11] showed the critical exposure of mountainous reservoirs to wildfire impacts, although limited to the western U.S. In this respect, our framework can be used to identify and prioritize sensitive areas and initiate the creation or improvement of resource management plans or mitigation actions.
A recent study by Green et al. [59] shows global population dependence on upstream freshwater sources. According to our index, water resources’ exposure to fire activity potentially threatens the water supply of a large portion of the human population, as underlined by several localized events. For example, the 2013 Rim Fire raised concerns with California State authorities when it threatened the Hetch Hetchy reservoir, which provides most of the water supplied to the San Francisco Bay Area, i.e., 2.6 million people. This recent event brought to light the threat induced by large and severe wildfires to communities dependent on surface freshwater to ensure daily potable water needs, as is the case with 78% of large cities on the planet [60]. Other major blazes that occurred in the past decade had significant impacts on several cities’ water supply, such as Melbourne in Australia and Denver, Boulder and Santa Fe in the United States [61], as well as numerous large cities across the world, such as San Salvador, Caracas and Istanbul, all of which are considered exposed to potential water provision issues in case of a major fire in their watershed [62].
Although fire activity can increase the net quantity of water downstream, potentially severe impacts on water quality and timing/magnitude of event flows (i.e., floods) can impact a wide range of ecological and human water resource uses (i.e., drinking water). This aspect will be explored in further versions of the index. We argue that the WWR should be viewed primarily as a source of cumulative effects on water resources whose watersheds are exposed, if not already impacted, by forest degradation and human activities [63].

3.4. Limitations and Improvements

The sensitivity analysis showed that water resource indicators tend to overwhelm fire-related indicators in the pattern of the GWWEI. This raises a question about the assumption of equal weight used in the aggregation process. While we considered this assumption acceptable to create our framework, the variability in the spatial pattern of the index shows that different weighting schemes could improve its robustness. The following versions will integrate an intermediate step based on a survey of scientists, in order to obtain a robust rating of the score we should assign to each indicator. This step has been previously used in several studies describing the creation of risk and resource indices [20,22,59].
Our initial pool of data is a collection of common variables that are known to affect wildfire activity and freshwater availability. Our indicator list is intentionally simple, though we expect to extend it to explore the effect of alternative variables in future versions of the index. For instance, area burned could be replaced by adding different variables that contribute to fire probability, such as ecosystems’ net primary productivity or drought proneness [64]. Similarly, the Build-Up Index of the FWI System may be a better proxy to fire impacts than FWI, because it better reflects burn severity, a critical determinant of post-fire hydrological effects. The correlation in water resource indicators must also be addressed by the inclusion of innovative information on surface freshwater availability, such as lake density or stream network connectivity. Moreover, resulting estimates of GWWEI could be improved if indicator data were averaged for biome-specific fire seasons, rather than annually. It is important to underline that we were dependent on data availability; the improvement of our index will therefore depend on the creation of and enhancements to global datasets, especially regarding water-related indicators, given that several wildfire indicators already exist.
Our current version of the framework only considers overlapping additive effects mostly based on long-term indicator averages. Further versions will address downstream cumulative effects in space and time and explicitly consider existing connectivity in water systems that could potentially lead to adverse effects on the water supply [65]. Extending the WWR framework to take into account the induced risk to the downstream water supply implies the integration of a “spatial transmission” process, in other words the capacity of a hazardous process to impact geographically-distant values at risk [66]. This process has been translated in the “downstream routing” method recently used in several studies related to the impact of human activities on water security at the global and continental scale [20,59,67] and may be considered in future versions of the GWWEI.

4. Conclusions

A unique global view of the potential exposure of water resources to wildfire activity and a valuable approach complementary to recent worldwide assessments of global exposure towards natural hazards was presented herein [68,69]. The highest exposure scores were mostly clustered in the tropical wet forests, whereas intermediate scores tended to be localized in tropical dry forest and shrublands, as well as in several mountain ranges and boreal forests. The lowest levels were found in the tundra, temperate forests and temperate prairies. These results represent an important source of information that can be considered in the international governance of forested areas and freshwater resources.
Notably, the sensitivity analysis showed an overwhelming influence of water resource indicators on the final index scores, which indicates the need for several modifications in the weighting scheme, such as incorporating expert opinion or including a larger set of variables. Future improvements to the WWR framework should also explore restricting indicators’ score range to worldwide fire seasons and develop new complementary indices that allow for the assessment of downstream water supply vulnerability and the subsequent risk to dependent populations and ecosystems.
The global index presented in this study can help us pinpoint regions of potential concern that may require a more detailed assessment of wildfire-induced risk to water resources. Indeed, high exposure levels may reveal the potential for deleterious impacts on water quality and downstream cumulative effects that might in turn affect local to regional water security, especially in river basins serving large populations. Although wildfires can impair water provision services from ecosystems, they are a natural and essential ecosystem process. Therefore, a trade-off has to be found between the preservation of natural fire regimes and the need for risk mitigation and source water protection. In this regard, the definition of a WWR opens new perspectives in the understanding of the global water and land systems. This framework adds an important component to the global water security paradigm in the context of climate change that do not presently encompass global wildfire water risk.

Acknowledgments

We want to thank the Canadian Water Network for funding this research. We are also grateful to the following people for providing advice and data: Enric Batllori from InForest Joint Research Unit CSIC-CTFC-CREAF, Alan Cantin from the Great Lake Forestry Centre of the Canadian Forest Service, Tom Gleeson from the Civil Engineering Department at McGill University, Victoria Naipal from the Max Plank Institute for Meteorology and Arnout van Soesbergen from the UNEP World Conservation Monitoring Centre.

Author Contributions

F-N Robinne designed the study and ran the analysis. All the authors assisted with the interpretation of results and the manuscript writing.

Conflicts of Interest

The authors declare no conflict of interest.

References

  1. Bond, W.J.; Woodward, F.I.; Midgley, G.F. The global distribution of ecosystems in a world without fire. New Phytol. 2005, 165, 525–537. [Google Scholar] [CrossRef] [PubMed]
  2. Lavorel, S.; Flannigan, M.D.; Lambin, E.F.; Scholes, M.C. Vulnerability of land systems to fire: Interactions among humans, climate, the atmosphere, and ecosystems. Mitig. Adapt. Strateg. Glob. Chang. 2007, 12, 33–53. [Google Scholar] [CrossRef]
  3. USDA. Wildland Fire in Ecosystems: Effects of Fire on Soil and Water; Gen. Tech. Rep. RMRS-GTR-42-vol.4. Ogden; U.S Department of Agriculture, Forest Service: Ogden UT, USA, 2005; Volume 4.
  4. Kuczera, G. Prediction of water yield reductions following a bushfire in ash-mixed species eucalypt forest. J. Hydrol. 1987, 94, 215–236. [Google Scholar] [CrossRef]
  5. DeBano, L.F. The role of fire and soil heating on water repellency in wildland environments: A review. J. Hydrol. 2000, 231–232, 195–206. [Google Scholar] [CrossRef]
  6. Seibert, J.; McDonnell, J.J.; Woodsmith, R.D. Effects of wildfire on catchment runoff response: A modelling approach to detect changes in snow-dominated forested catchments. Hydrol. Res. 2010, 41, 378–390. [Google Scholar] [CrossRef] [Green Version]
  7. Dunnette, P.V.; Higuera, P.E.; Mclauchlan, K.K.; Derr, K.M.; Briles, C.E.; Keefe, M.H. Biogeochemical impacts of wildfires over four millennia in a Rocky Mountain subalpine watershed. New Phytol. 2014, 203, 900–912. [Google Scholar] [CrossRef] [PubMed]
  8. Scott, J.H.; Helmbrecht, D.J.; Thompson, M.P.; Calkin, D.E.; Marcille, K. Probabilistic assessment of wildfire hazard and municipal watershed exposure. Nat. Hazards 2012, 64, 707–728. [Google Scholar] [CrossRef] [Green Version]
  9. Weidner, E.; Todd, A.H. From the Forest to the Faucet Methods Paper; U.S Department of Agriculture, Forest Service: Ogden, UT, USA, 2011.
  10. Boerner, C.; Coday, B.; Noble, J.; Roa, P.; Roux, V. Impacts of Wildfire in Clear Creek Watershed on the City of Golden’s Drinking Water Supply; Colorado School of Mines: Golden, CO, USA, 2012. [Google Scholar]
  11. Moody, J.A.; Martin, D.A. Wildfire impacts on reservoir sedimentation in the western United States. In Proceedings of the Ninth International Symposium on River Sedimentation, Yichang, China, 18–21 October 2004; pp. 1095–1102.
  12. Thompson, M.P.; Scott, J.H.; Langowski, P.; Gilbertson-Day, J.W.; Haas, J.; Bowne, E. Assessing Watershed-Wildfire Risks on National Forest System Lands in the Rocky Mountain Region of the United States. Water 2013, 5, 945–971. [Google Scholar] [CrossRef]
  13. Emelko, M.B.; Silins, U.; Bladon, K.D.; Stone, M. Implications of land disturbance on drinking water treatability in a changing climate: Demonstrating the need for “source water supply and protection” strategies. Water Res. 2011, 45, 461–472. [Google Scholar] [CrossRef] [PubMed]
  14. Shi, P.; Kasperson, R. World Atlas of Natural Disaster Risk; Springer: Berlin, Germany, 2015. [Google Scholar]
  15. Bowman, D.M.J.S.; Balch, J.K.; Artaxo, P.; Bond, W.J.; Carlson, J.M.; Cochrane, M.A.; Antonio, C.M.D.; Defries, R.S.; Doyle, J.C.; Harrison, S.P.; et al. Fire in the Earth System. Science 2009, 324, 481–484. [Google Scholar] [CrossRef] [PubMed]
  16. Knorr, W.; Kaminski, T.; Arneth, A.; Weber, U. Impact of human population density on fire frequency at the global scale. Biogeosciences 2014, 11, 1085–1102. [Google Scholar] [CrossRef] [Green Version]
  17. Oki, T.; Kanae, S. Global hydrological cycles and world water resources. Science 2006, 313, 1068–1072. [Google Scholar] [CrossRef] [PubMed]
  18. Davies, E.G.R.; Simonovic, S.P. Global water resources modeling with an integrated model of the social-economic-environmental system. Adv. Water Resour. 2011, 34, 684–700. [Google Scholar] [CrossRef]
  19. Freudenberger, L.; Hobson, P.R.; Schluck, M.; Ibisch, P.L. A global map of the functionality of terrestrial ecosystems. Ecol. Complex. 2012, 12, 13–22. [Google Scholar] [CrossRef]
  20. Vörösmarty, C.J.; McIntyre, P.B.; Gessner, M.O.; Dudgeon, D.; Prusevich, A.; Green, P.A.; Glidden, S.; Bunn, S.E.; Sullivan, C.A.; Liermann, C.R.; et al. Global threats to human water security and river biodiversity. Nature 2010, 467, 555–561. [Google Scholar] [CrossRef] [PubMed]
  21. Dickson, B.; Blaney, R.; Miles, L.; Regan, E.; van Soesbergen, A.; Väänänen, E.; Blyth, S.; Harfoot, M.; Martin, C.S.; McOwen, C.; et al. Towards a Global Map of Natural Capital: KEY Ecosystem Assets; United Nations Environment Program: Nairobi, Kenya, 2014. [Google Scholar]
  22. Halpern, B.S.; Walbridge, S.; Selkoe, K.A.; Kappel, C.V.; Micheli, F.; D’Agrosa, C.; Bruno, J.F.; Casey, K.S.; Ebert, C.; Fox, H.E.; et al. A global map of human impact on marine ecosystems. Science 2008, 319, 948–952. [Google Scholar] [CrossRef] [PubMed]
  23. Krawchuk, M.A.; Moritz, M.A.; Parisien, M.-A.; van Dorn, J.; Hayhoe, K. Global pyrogeography: The current and future distribution of wildfire. PLoS ONE 2009, 4, e5102. [Google Scholar] [CrossRef] [PubMed]
  24. Giglio, L.; Randerson, J.T.; van der Werf, G.R. Analysis of daily, monthly, and annual burned area using the fourth-generation global fire emissions database (GFED4). J. Geophys. Res. Biogeosci. 2013, 118, 317–328. [Google Scholar] [CrossRef]
  25. Giglio, L.; Loboda, T.; Roy, D.P.; Quayle, B.; Justice, C.O. An active-fire based burned area mapping algorithm for the MODIS sensor. Remote Sens. Environ. 2009, 113, 408–420. [Google Scholar] [CrossRef]
  26. Van Wagner, C. Development and Structure of the Canadian Forest Fire Weather Index System; Canadian Forestry Servic, Ed.; Government of Canada: Ottawa, ON, Canada, 1987.
  27. Field, R.D.; Spessa, A.C.; Aziz, N.A.; Camia, A.; Cantin, A.; Carr, R.; de Groot, W.J.; Dowdy, A.J.; Flannigan, M.D.; Manomaiphiboon, K.; et al. Development of a Global Fire Weather Database. Nat. Hazards Earth Syst. Sci. 2015, 15, 1407–1423. [Google Scholar] [CrossRef] [Green Version]
  28. Chen, M.; Shi, W.; Xie, P.; Silva, V.B.S.; Kousky, V.E.; Higgins, R.W.; Janowiak, J.E. Assessing objective techniques for gauge-based analyses of global daily precipitation. J. Geophys. Res. Atmos. 2008, 113, 1–13. [Google Scholar] [CrossRef]
  29. Stocks, B.J.; Mason, J.A.; Todd, J.B.; Bosch, E.M.; Wotton, M.B.; Amiro, B.D.; Flannigan, M.D.; Hirsch, K.G.; Logan, K.A.; Martell, D.L.; et al. Large forest fires in Canada, 1959–1997. J. Geophys. Res. 2002, 108, 8149. [Google Scholar] [CrossRef]
  30. Bond, W.J.; Keeley, J.E. Fire as a global “herbivore”: The ecology and evolution of flammable ecosystems. Trends Ecol. Evol. 2005, 20, 387–394. [Google Scholar] [CrossRef] [PubMed]
  31. Ramos-Neto, M.B.; Pivello, V.R. Lightning fires in a Brazilian Savanna National Park: Rethinking management strategies. Environ. Manag. 2000, 26, 675–684. [Google Scholar] [CrossRef] [PubMed]
  32. Cecil, D.J.; Buechler, D.E.; Blakeslee, R.J. Gridded lightning climatology from TRMM-LIS and OTD: Dataset description. Atmos. Res. 2014, 135–136, 404–414. [Google Scholar] [CrossRef]
  33. Aldersley, A.; Murray, S.J.; Cornell, S.E. Global and regional analysis of climate and human drivers of wildfire. Sci. Total Environ. 2011, 409, 3472–3481. [Google Scholar] [CrossRef] [PubMed]
  34. Bistinas, I.; Oom, D.; Sá, A.C.L.; Harrison, S.P.; Prentice, C.I.; Pereira, J.M.C. Relationships between human population density and burned area at continental and global scales. PLoS ONE 2013, 8, e81188. [Google Scholar] [CrossRef] [PubMed]
  35. Archibald, S.; Lehmann, C.E. R.; Gómez-dans, J.L.; Bradstock, R.A. Defining pyromes and global syndromes of fire regimes. Proc. Natl. Acad. Sci. USA 2013, 110, 6442–6447. [Google Scholar] [CrossRef] [PubMed]
  36. Sanderson, E.W.; Jaiteh, M.; Levy, M.A.; Redford, K.H.; Wannebo, A.V.; Woolmer, G. The Human Footprint and the Last of the Wild. Bioscience 2002, 52, 891–904. [Google Scholar] [CrossRef]
  37. Fekete, B.M. High-resolution fields of global runoff combining observed river discharge and simulated water balances. Glob. Biogeochem. Cycles 2002, 16, 15-1–15-10. [Google Scholar] [CrossRef]
  38. GWSP. Digital Water Atlas Map 38: Mean Annual Surface Runoff 1950–2000 (V1.0); GWSP International Project Office: Bonn, Germany, 2008. [Google Scholar]
  39. Kasischke, E.S.; Bourgeau-Chavez, L.L.; Johnstone, J.F. Assessing spatial and temporal variations in surface soil moisture in fire-disturbed black spruce forests in Interior Alaska using spaceborne synthetic aperture radar imagery—Implications for post-fire tree recruitment. Remote Sens. Environ. 2007, 108, 42–58. [Google Scholar] [CrossRef]
  40. Willmott, C.J.; Matsuura, K. Terrestrial Water Budget Data Archive: Monthly Time Series (1950–1999); University of Delaware: Newark, DE, USA, 2001. [Google Scholar]
  41. Legates, D.R.; Willmott, C.J. Mean seasonal and spatial variability in gauge-corrected, global precipitation. Int. J. Climatol. 1990, 10, 111–127. [Google Scholar] [CrossRef]
  42. Legates, D.R.; Willmott, C.J. Mean seasonal and spatial variability in global surface air temperature. Theor. Appl. Climatol. 1990, 41, 11–21. [Google Scholar] [CrossRef]
  43. Moody, J.A.; Ebel, B.A.; Nyman, P.; Martin, D.A.; Stoof, C.; McKinley, R. Relations between soil hydraulic properties and burn severity. Int. J. Wildland Fire 2016, in press. [Google Scholar] [CrossRef]
  44. Nolan, R.H.; Lane, P.N.J.; Benyon, R.G.; Bradstock, R.A.; Mitchell, P.J. Changes in evapotranspiration following wildfire in resprouting eucalypt forests. Ecohydrology 2014, 7, 1363–1377. [Google Scholar] [CrossRef]
  45. Zomer, R.J.; Trabucco, A.; van Straaten, O.; Bossio, D.A. Carbon, Land and Water:A Global Analysis of the Hydrologic Dimensions of Climate Change Mitigation through Afforestation/Reforestation; International Water Management Institute: Colombo, Sri Lanka, 2006; Volume 101. [Google Scholar]
  46. Environmental Systems Research Institute. ArcGIS: Release 10.1 SP1 for Desktop; Environmental Systems Research Institute: Redlands, CA, USA, 2012. [Google Scholar]
  47. Biber, D.; Freudenberger, L.; Ibisch, P.L. Insensa-GIS: An Open-Source Software Tool for GIS Data Processing and Statistical Analysis; Eberswalde University for Sustainable Development: Eberswalde, Germany, 2011. [Google Scholar]
  48. OECD. Handbook on Constructing Composite Indicators; European Comission: Bruxelles, Belgium, 2008. [Google Scholar]
  49. Olson, D.M.; Dinerstein, E.; Wikramanayake, E.D.; Burgess, N.D.; Powell, G.V.N.; Underwood, E.C.; D’amico, J.A.; Itoua, I.; Strand, H.E.; Morrison, J.C.; et al. Terrestrial Ecoregions of the World: A New Map of Life on Earth. Bioscience 2001, 51, 933–938. [Google Scholar] [CrossRef]
  50. Falkenmark, M. The Greatest Water Problem: The Inability to Link Environmental Security, Water Security and Food Security. Int. J. Water Resour. Dev. 2001, 17, 539–554. [Google Scholar] [CrossRef]
  51. Norman, E.; Cook, C.; Dunn, G.; Allen, D. Water Security: A Primer; University of British Columbia: Vancouver, BC, Canada, 2010. [Google Scholar]
  52. Postel, S.L.; Daily, G.C.; Ehrlich, P.R. Human Appropriation Of Renewable Fresh Water. Science 1996, 271, 785–788. [Google Scholar] [CrossRef]
  53. Falkenmark, M.; Rockström, J.; Karlberg, L. Present and future water requirements for feeding humanity. Food Secur. 2009, 1, 59–69. [Google Scholar] [CrossRef]
  54. Santos, R.M.B.; Sanches Fernandes, L.F.; Pereira, M.G.; Cortes, R.M.V.; Pacheco, F.A.L. Water resources planning for a river basin with recurrent wildfires. Sci. Total Environ. 2015, 526, 1–13. [Google Scholar] [CrossRef] [PubMed]
  55. Ho Sham, C.; Tuccillo, M.E.; Rooke, J. Effects of Wildfire on Drinking Water Utilities and Best Practices for Wildfire Risk Reduction and Mitigation; Water Research Foundation: Denver, CO, USA, 2013. [Google Scholar]
  56. Viviroli, D.; Dürr, H.H.; Messerli, B.; Meybeck, M.; Weingartner, R. Mountains of the world, water towers for humanity: Typology, mapping, and global significance. Water Resour. Res. 2007, 43, 1–13. [Google Scholar]
  57. Nogués-Bravo, D.; Araújo, M.B.; Errea, M.P.; Martínez-Rica, J.P. Exposure of global mountain systems to climate warming during the 21st Century. Glob. Environ. Chang. 2007, 17, 420–428. [Google Scholar] [CrossRef]
  58. Mori, A.S.; Johnson, E.A. Assessing possible shifts in wildfire regimes under a changing climate in mountainous landscapes. For. Ecol. Manag. 2013, 310, 875–886. [Google Scholar] [CrossRef]
  59. Green, P.A.; Vörösmarty, C.J.; Harrison, I.; Farrell, T.; Sáenz, L.; Fekete, B.M. Freshwater ecosystem services supporting humans: Pivoting from water crisis to water solutions. Glob. Environ. Chang. 2015, 34, 108–118. [Google Scholar] [CrossRef]
  60. McDonald, R.I.; Weber, K.; Padowski, J.; Flörke, M.; Schneider, C.; Green, P.A.; Gleeson, T.; Eckman, S.; Lehner, B.; Balk, D.; et al. Water on an urban planet: Urbanization and the reach of urban water infrastructure. Glob. Environ. Chang. 2014, 27, 96–105. [Google Scholar] [CrossRef]
  61. Bladon, K.D.; Emelko, M.B.; Silins, U.; Stone, M. Wildfire and the Future of Water Supply. Environ. Sci. Technol. 2014, 48, 8936–8943. [Google Scholar] [CrossRef] [PubMed]
  62. Dudley, N.; Stolton, S. Running Pure; World Bank/WWF Alliance for Forest Conservation and Sustainable Use: Washington, DC, USA, 2003. [Google Scholar]
  63. Millar, C.I.; Stephenson, N.L. Temperate forest health in an era of emerging megadisturbance. Science 2015, 349, 823–826. [Google Scholar] [CrossRef] [PubMed]
  64. Moritz, M.A.; Parisien, M.-A.; Batllori, E. Climate change and disruptions to global fire activity. Ecosphere 2012, 3, 1–22. [Google Scholar] [CrossRef]
  65. Alcamo, J.M.; Flörke, M.; Märker, M. Future long-term changes in global water resources driven by socio-economic and climatic changes. Hydrol. Sci. J. 2007, 52, 247–275. [Google Scholar] [CrossRef]
  66. Miller, C.; Ager, A.A. A review of recent advances in risk analysis for wildfire management. Int. J. Wildland Fire 2013, 22, 1–14. [Google Scholar] [CrossRef]
  67. Vörösmarty, C.J.; Douglas, E.M.; Green, P.A.; Revenga, C. Geospatial indicators of emerging water stress: An application to Africa. Ambio 2005, 34, 230–236. [Google Scholar] [CrossRef] [PubMed]
  68. Lerner-Lam, A. Assessing global exposure to natural hazards: Progress and future trends. Environ. Hazards 2007, 7, 10–19. [Google Scholar] [CrossRef]
  69. Peduzzi, P.; Dao, H.; Herold, C.; Mouton, F. Assessing global exposure and vulnerability towards natural hazards: the Disaster Risk Index. Nat. Hazards Earth Syst. Sci. 2009, 9, 1149–1159. [Google Scholar] [CrossRef]

