Article

Intra-Annual Xylem Growth of Larix principis-rupprechtii at Its Upper and Lower Distribution Limits on the Luyashan Mountain in North-Central China

1
State Key Laboratory of Earth Surface Processes and Resource Ecology, Beijing Normal University, 19 Xinjiekouwai Street, Haidian District, Beijing 100875, China
2
College of Resources Science and Technology, Beijing Normal University, 19 Xinjiekouwai Street, Haidian District, Beijing 100875, China
3
College of Forestry, He’nan University of Science and Technology, Luoyang 471003, China
*
Author to whom correspondence should be addressed.
Forests 2015, 6(11), 3809-3827; https://doi.org/10.3390/f6113809
Submission received: 13 July 2015 / Revised: 21 October 2015 / Accepted: 26 October 2015 / Published: 29 October 2015

Abstract

:
Altitude-related climatic factors, especially temperature, are important factors that affect tree growth in mountain forest ecosystems. The aims of this study were to estimate the intra-annual radial growth differences of Larix principis-rupprechtii (L. principis-rupprechtii) between its upper and lower distribution limits, at 2740 and 2040 m a.s.l, respectively. Dynamics of xylem growth were observed by collecting microcore samples weekly during the 2011 growth season. The result indicated that different strategies were adopted at the two selected sites. Trees at the upper distribution limit adopted an “intensive strategy” with higher maximum growth rates (0.69 cell·day−1) within a shorter duration of 95 days, producing 21 new tracheids. By contrast, trees at the lower distribution limit exhibited an “extensive strategy” with lower maximum growth rates (0.53 cell·day−1) over a longer duration of 135 days, producing 50 tracheids. The soil temperature was probably the main factor limiting the onset of cambial activity for L. principis-rupprechtii, its daily mean thresholds for onset were 0 °C and 1.4 °C at the upper and lower distribution limits, respectively. These results indicate that L. principis-rupprechtii is able to adjust its xylem growth according to environmental conditions.

1. Introduction

Analysis of cambial activity and xylem formation (xylogenesis) is a useful tool to study the response of trees to global change [1]. The majority of previous studies on intra-annual xylem growth have been carried out in boreal forests [2,3] and at Alpine timberlines [4,5,6]. The trees studied have been primarily conifers (i.e., spruce, pine, and larch) [7].
Cambial activity and xylogenesis are regulated by both internal factors and climatic factors [8]. At high altitudes/latitudes, temperature (mean daily/heat sum) is regarded as the major determinant for the cambial reactivation in spring [9,10]. However, the influence of temperature weakens during the course of the growing season and wood formation ends within a wider range of time [11]. Some studies have concluded that a specific threshold must be exceeded to induce the onset of wood formation, i.e., an air temperature sum threshold of 85–90 d.d. (degree days) and/or mean daily air temperature of 5.6–8.5 °C is needed [12,13]. Soil temperature is not considered to be a direct limiting factor for xylogenesis [14]. Nevertheless, warming of the belowground parts of the tree is also required for full resumption of cambial activity [15], since frozen soil will inhibit water uptake and activity in root systems [16]. Therefore, compared with air temperature, there may be more complicated relationships between soil temperature and tree growth onset.
Studies of intra-annual xylem growth along altitudinal transects are beneficial to understanding climate-driven changes in tree growth [17]. Particularly in temperate and cold climates, air temperature is the most important environmental variable along elevational gradients [18]. Previous studies have revealed that a shorter growing season [19] and declining radial growth are general trends as altitude/latitude increases [20,21]. However, whether the shorter duration of xylogenesis is due to later onset, or to earlier cessation remains unclear. The contrary results by Moser et al. [22] on larch and by Treml et al. [23] on spruce were attributed to the differences between evergreen and deciduous conifers. Thus, the variation of intra-annual xylem growth with altitude may be mediated by diverse climate regimes as well as species-specific traits.
As an indigenous species, Larix principis-rupprechtii Mayr. (L. principis-rupprechtii) is one of the most dominant species within cold temperature coniferous forests in north-central China. This species is mainly distributed at middle and high elevations (1800–2800 m a.s.l.) in montane areas [24]. Considering its total area of nearly 140,000 hm2 (36°30′ N~43°40′ N, 111°30′ E~118°30′ E) [25], L. principis-rupprechtii may play an important role in soil and water conservation and the carbon cycle for regional ecosystems. Based on a previous dendrochronology analysis, temperature in May had a positive effect on L. principis-rupprechtii annual growth, especially at high elevations [26]. Therefore, we selected two different altitude sites (2740 m a.s.l. and 2040 m a.s.l.), which represented the upper and lower distribution limits of L. principis-rupprechtii. The aims of this study were to (1) compare the xylem growth pattern of L. principis-rupprechtii at its upper and lower distribution limits during the growing season of 2011, including the variation of growth onset and cessation, the rate of cell production, and the total cell numbers; and (2) analyze the threshold air and soil temperatures required for initiating cambial activity at the two distribution limits. We hypothesized that at the upper distribution limit of L. principis-rupprechtii the duration of xylem growing season would be shortened and the amount of new xylem cells would be reduced compared to the values at the lower distribution limit.

2. Materials and Methods
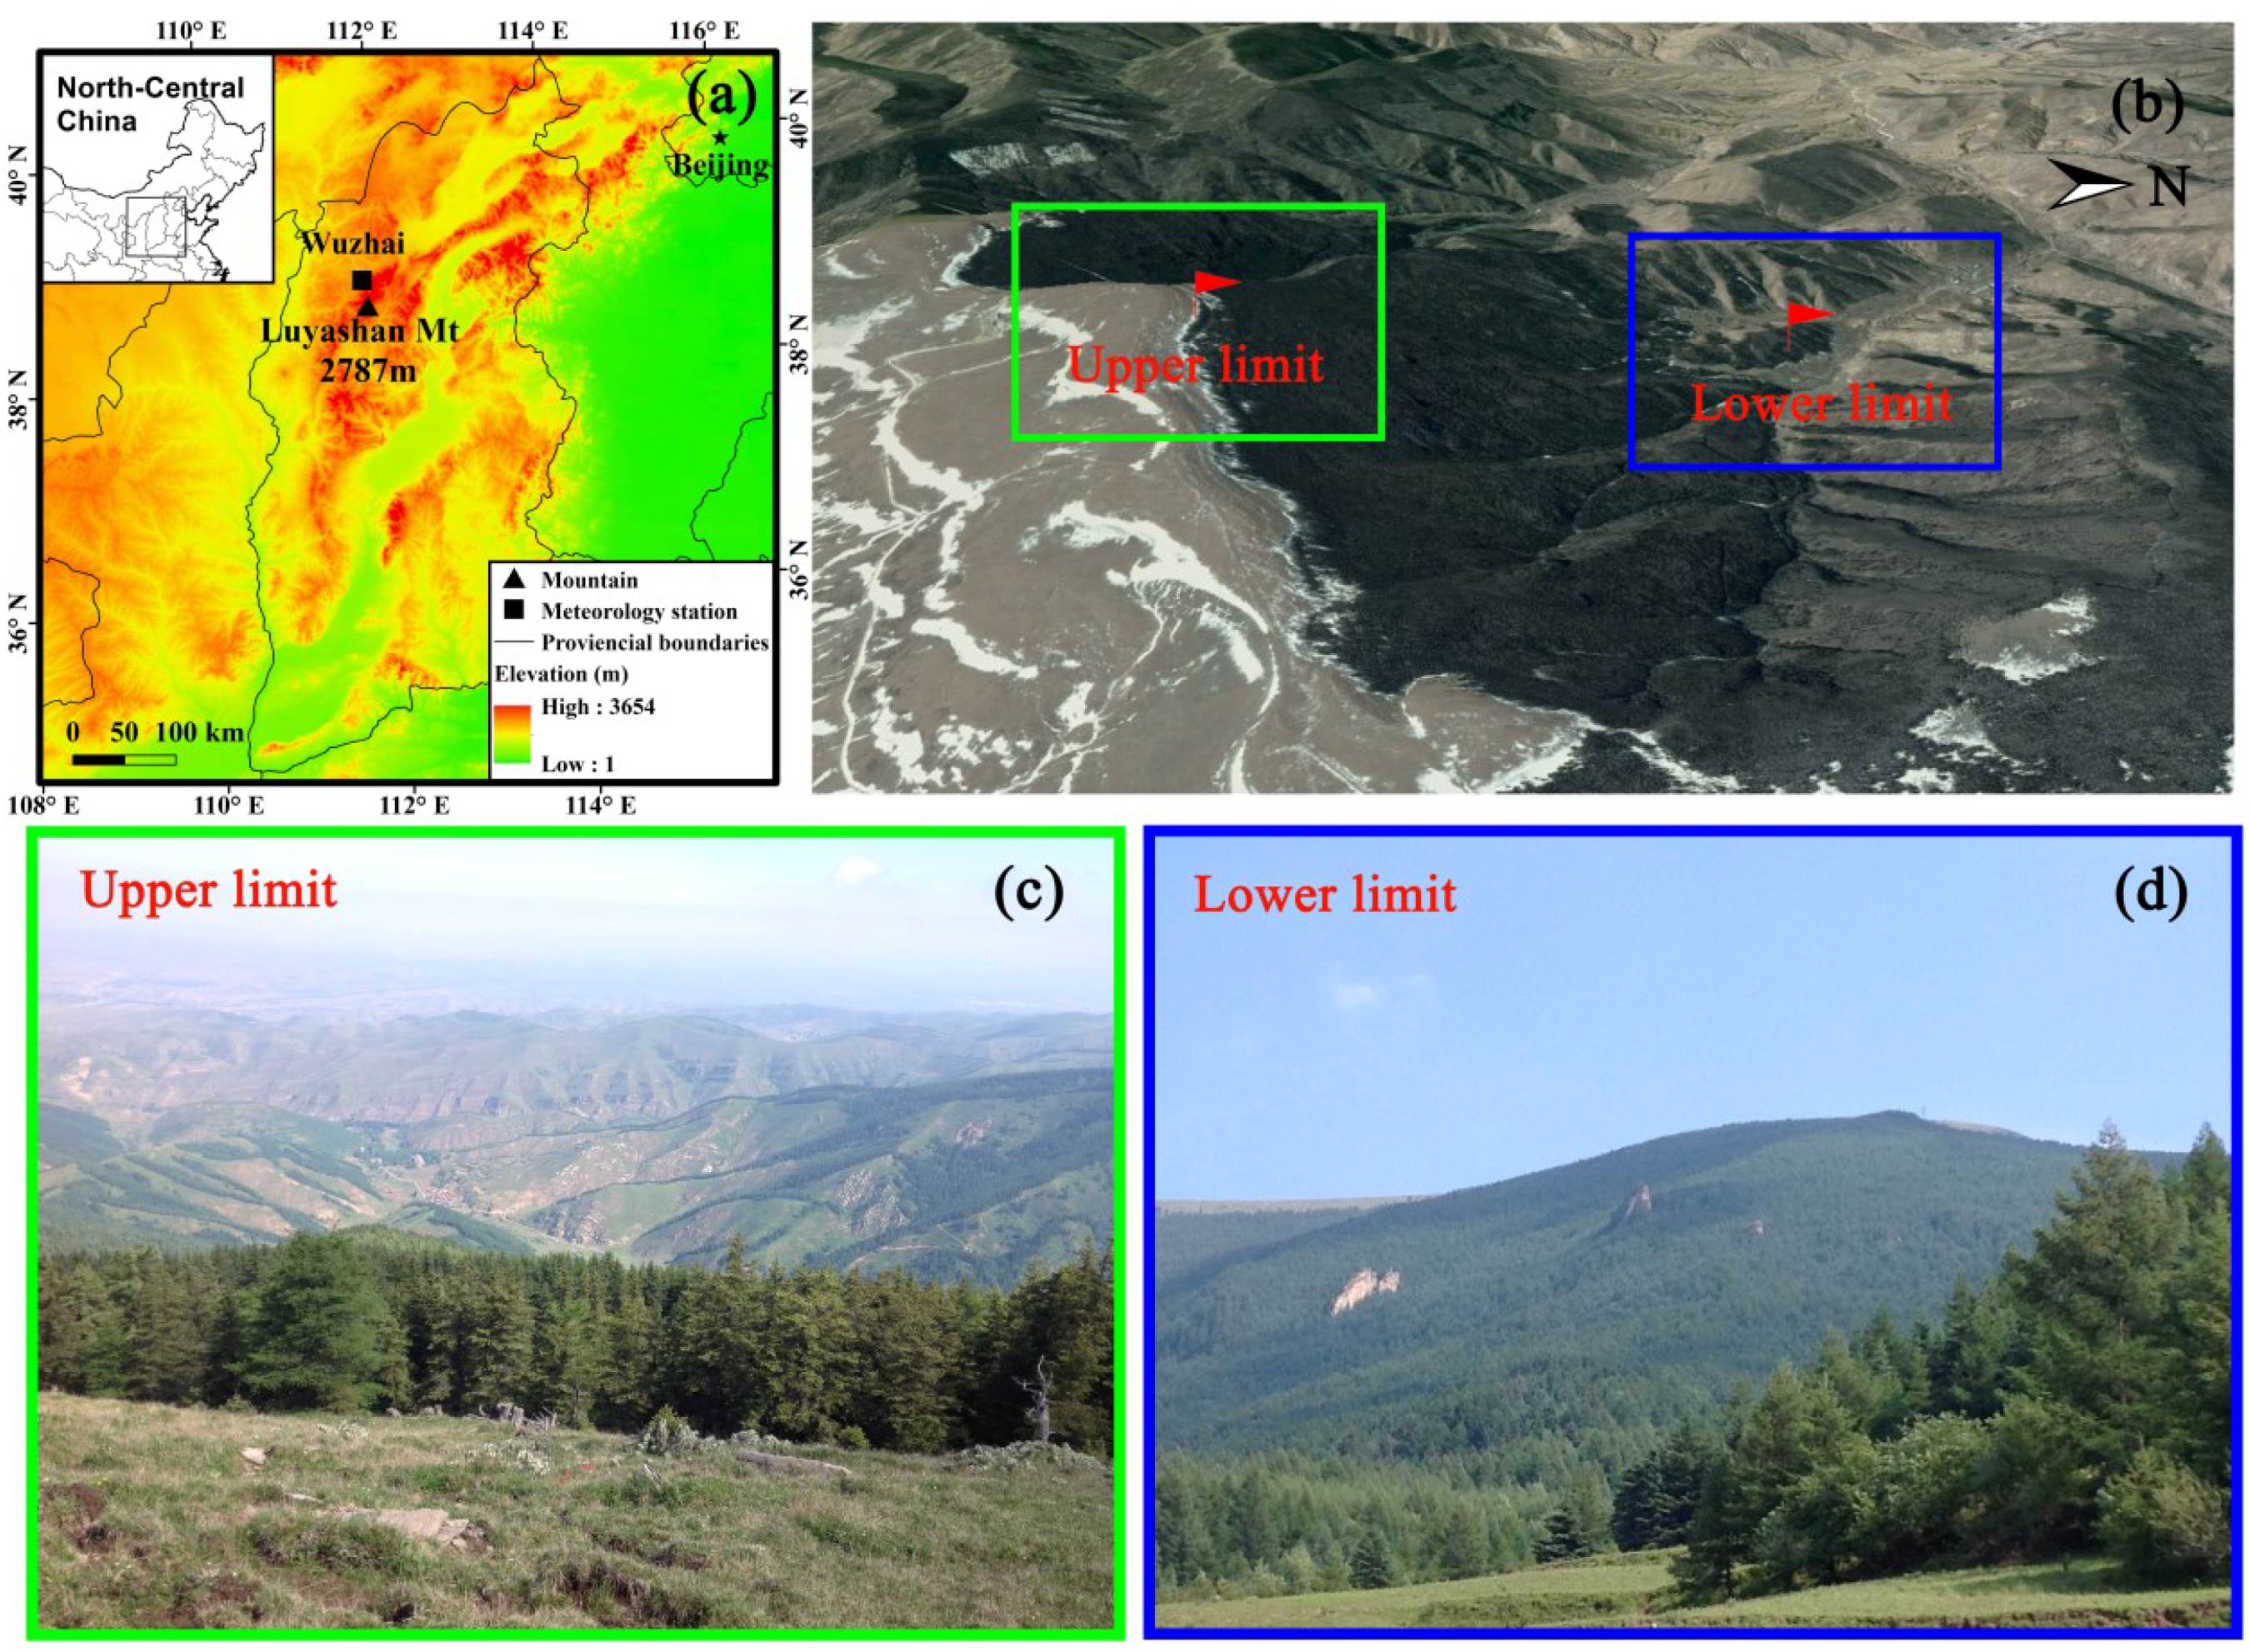
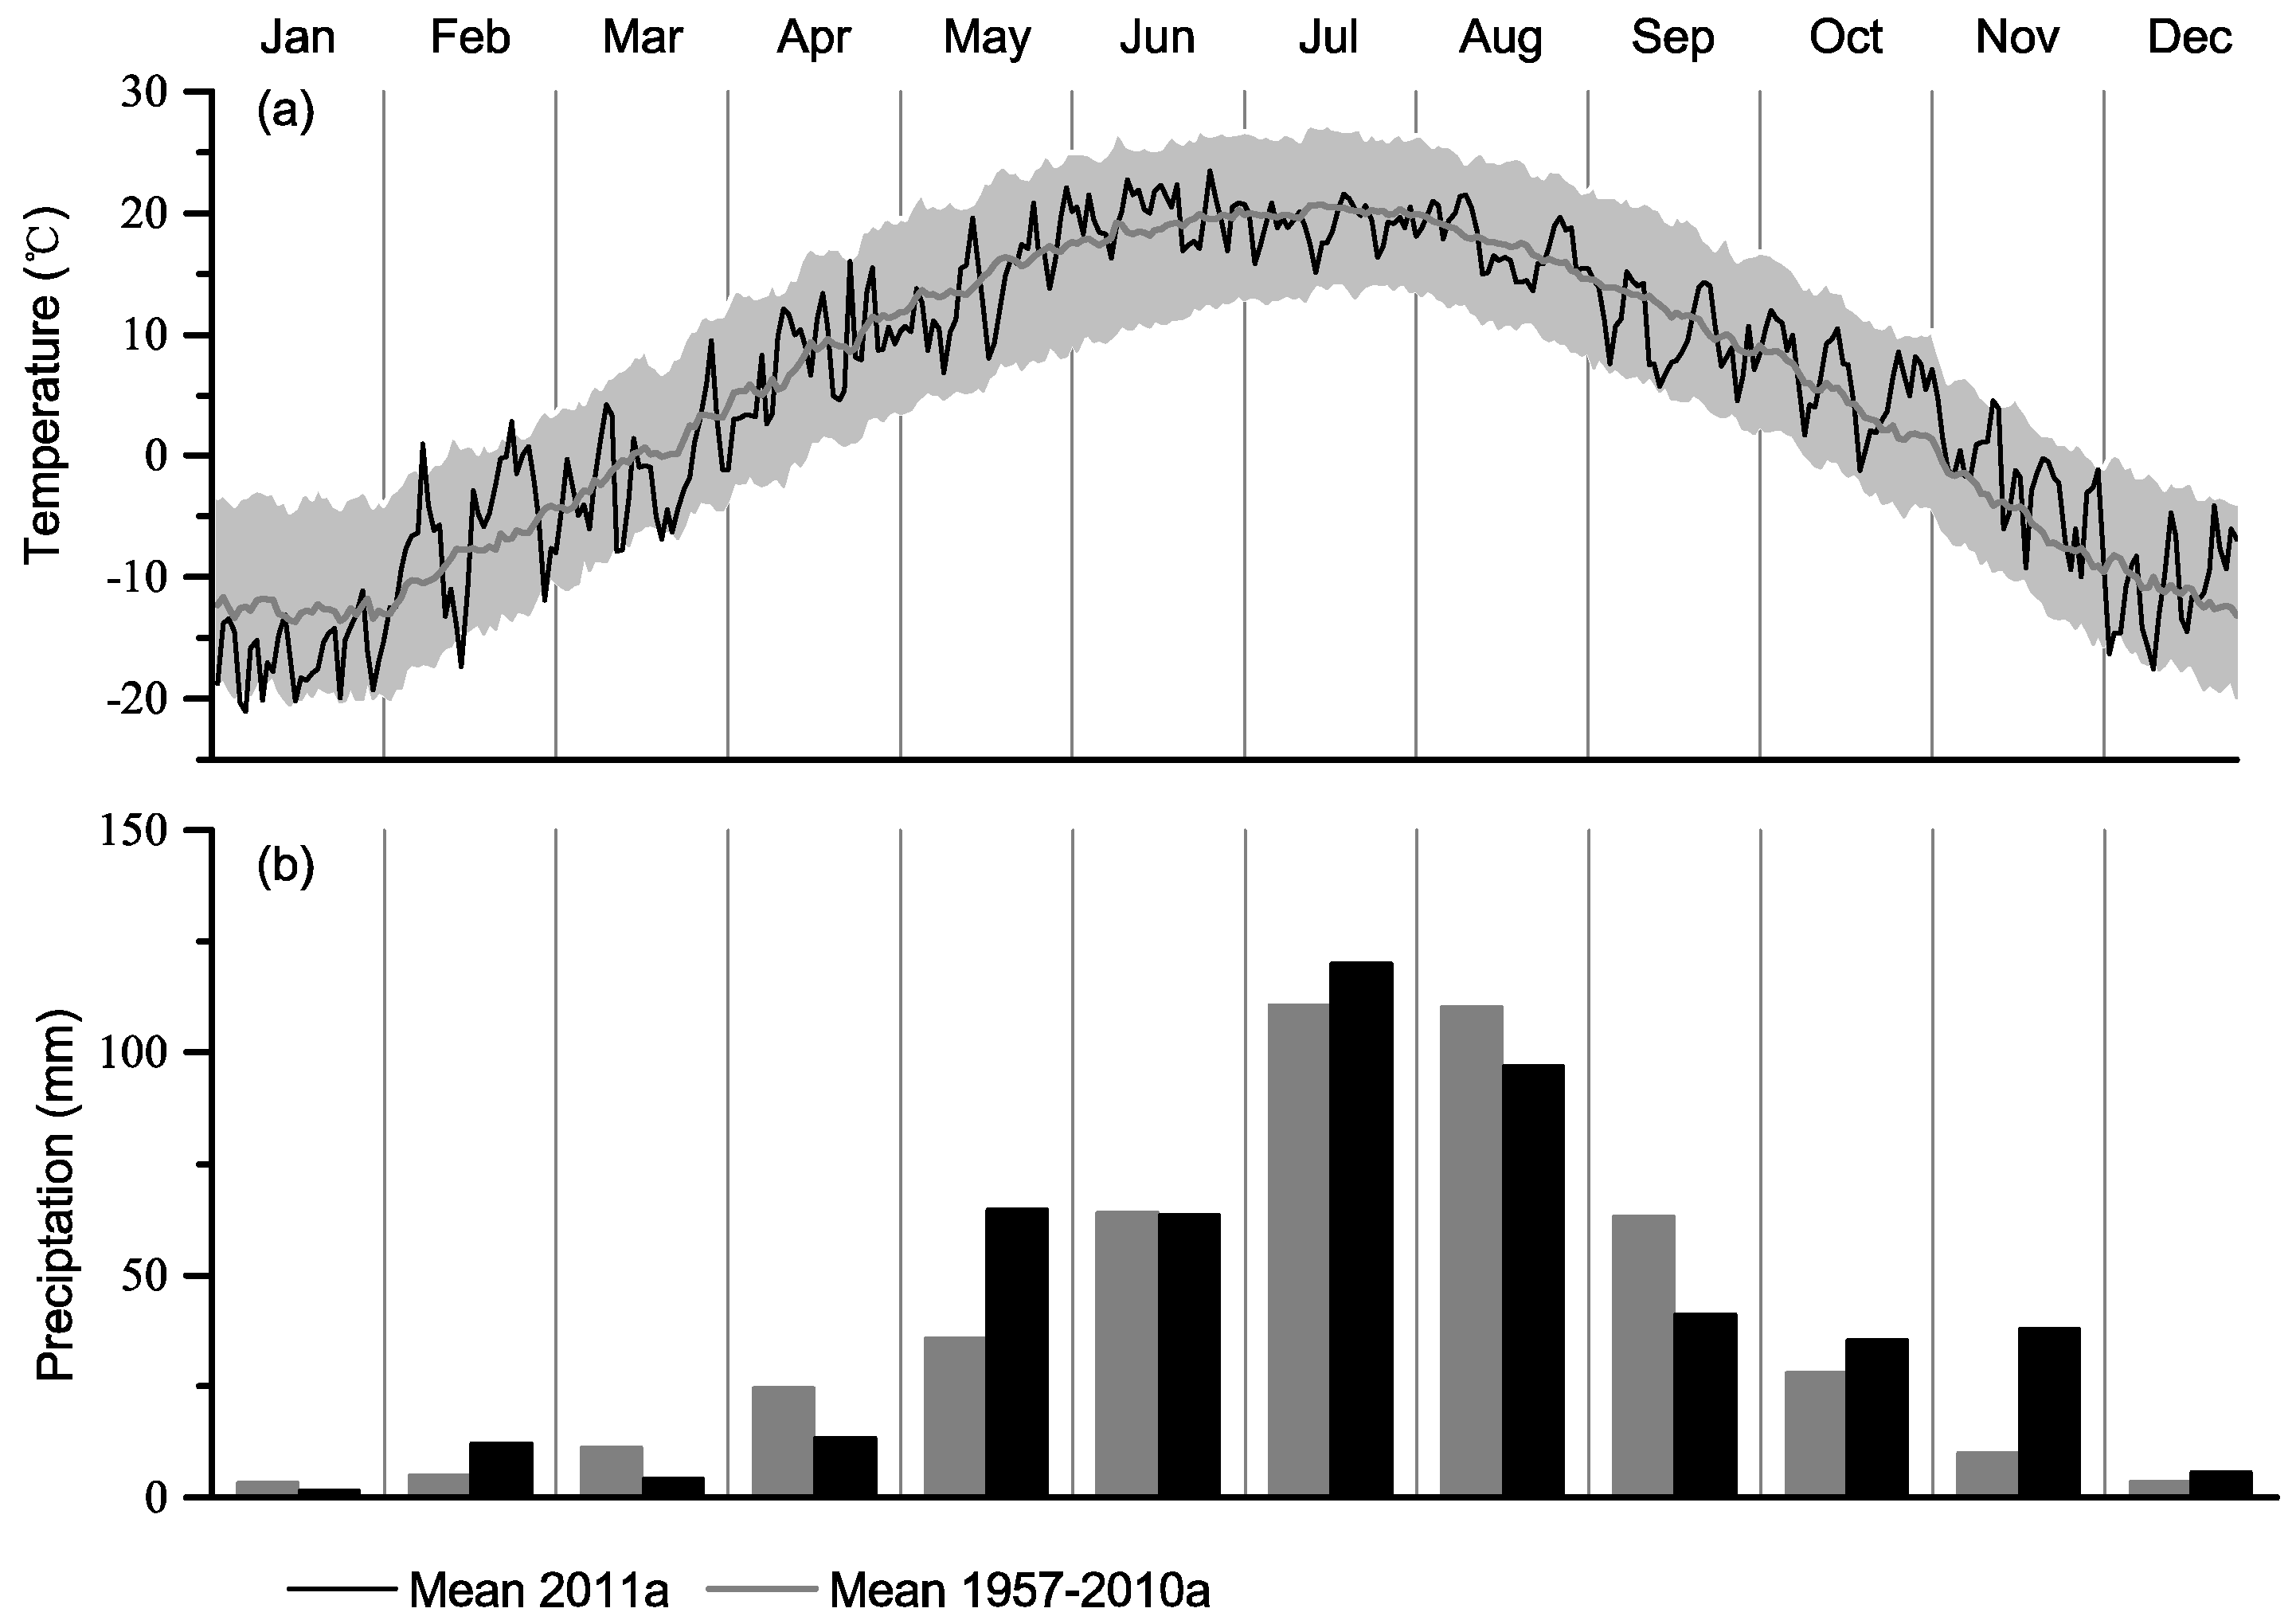
2.1. Study Sites

The study sites were located on Luyashan Mountain in Shanxi Province (38°40′ N~38°50′ N, 111°50′ E~112°00′ E, Figure 1). The climate type is semi-humid temperate with monsoon rainfall during summer. For the period of 1957–2010, the mean annual temperature was approximately 5.2 °C and the mean annual precipitation was approximately 468 mm with more than 60% of this falls during the monsoon season from June to September (Figure 2). Moreover, snow cover usually persists from previous November until May at the summit (2787 m a.s.l.). The climate in 2011 was typical of an ordinary year, considering the mean annual temperature was 5.1 °C and the annual precipitation was 496 mm (Figure 2).
Figure 1. Location of study area in north-central China (a) and the landscape of the study area (bd).
Forests 06 03809 g001
Figure 2. Comparison of the mean daily air temperatures (a), and the monthly sums of precipitation (b) for the monitoring year 2011 (black) and the 1957–2010 average (grey). The grey shading in (a) indicates the mean minimum and maximum temperatures averaged over the 1957–2010 period. Data were obtained from the nearest State standard meteorological station in Wuzhai (38°55′ N, 111°49′ E, 1401 m a.s.l., linear distance ca. 20 km north of the study site).
Forests 06 03809 g002
The vegetation on Luyashan Mountain is divided into four vertical belts: the grassland and birch forest belt (1300–1500 m a.s.l.), the birch and poplar forest belt (1500–1900 m a.s.l.), the cold coniferous forest belt dominated by Picea meyeri Rehd. et Wils. (P. meyeri) and L. principis-rupprechtii (1850–2700 m a.s.l.) and the sub-alpine meadow belt (>2700 m a.s.l.) at the peak of the mountain [27]. The soil under the coniferous forest vegetation belt is mountainous brown forest soil, a well-drained sandy loam characterized by 12%–18% clay and 50%–60% fine sand [28].
The sites of the upper and lower distribution limits of L. principis-rupprechtii were set on both north-facing slopes (approximately 20–30°) to minimize habitat differences caused by micro geomorphological factors. Especially, the upper site corresponded to a treeline ecotone, as trees were very sparse and the tree height above the site decreased abruptly, with only isolated L. principis-rupprechtii and P. meyeri.

2.2. Tree Selection

At each site, three mature L. principis-rupprechtii trees were selected for growth observations. Trees with polycormic stems, partially dead crowns, reaction wood or evidence of damage due to parasites were avoided. Wood formation was monitored weekly from April to November in 2011. Microcores were collected from around the stem at breast height (1.3 m) using a Trephor tool, placed in an ethanol solution (50% in water) and stored at 5 °C to avoid tissue deterioration. In the laboratory, the microcores were dehydrated with successive immersions in ethanol and embedded in paraffin. Transverse sections of 6–10 μm thickness were cut using a Leica RM 2235 rotary microtome (Leica Microsystems, Wetzlar, Germany) and stained with 1% safranin and 0.5% fast green (in 95% ethanol) [5]. The sections were observed using a Nikon Ni-U light microscope under bright field and polarized light to follow the cambial activity and to differentiate the xylem growth.

2.3. Cambial Activity and Xylem Differentiation

In each sample, the radial number of cells in the cambial zone (CZ), radial enlargement phase (EN), cell wall thickening phase (WT), and mature (M) cells were counted along three radial rows (Figure 3). In cross section, cambial cells had small radial diameters and thin cell walls. Enlargement cells were characterized by thin primary cell walls with a radial diameter roughly two or more times that of the dividing cambial cells. Polarized light was used to discriminate between enlargement and wall thickening tracheids. Mature cells showed empty cell lumen and red cell walls [5].
Figure 3. Phases of wood formation of Larix principis-rupprechtii in 2011 at upper distribution limit: (A) Cambial zone (CZ) on 24 April; no new xylem cell production observed; (B) and (C) enlarging (EN), wall-thickening (WT) and mature (M) cells on 20 July under bright field and polarized light, respectively; (D) wall-thickening (WT) and mature (M) cells on 29 August; and (E) mature cells (M) on 25 September.
Forests 06 03809 g003
The phenology of xylem differentiation (phases of enlargement, cell wall thickening and lignification, and mature) was assessed for each tree. Five phenophases, including (i) first enlarging cell, (ii) first wall-thickening cell, (iii) first mature cell, (iv) ending of cell enlargement, and (v) ending of cell wall lignification, were calculated and expressed as day of year (DOY). The first appearance in spring of cells in the enlargement phase was defined as the onset of stem growth. The ending of cell wall lignification in late summer, when the cell walls of the last formed tracheids were completely formed (indicated by red colored cell walls and empty lumen), was defined as the end of growth. The duration of xylogenesis was calculated as the number of days between the onset of cell enlargement and the ending of cell wall thickening and lignification. The differences in the timing and duration of the growing phases—namely cell enlargement, wall thickening and maturation—between sites were determined using the Mann–Whitney rank-sum test (SPSS Inc., Chicago, IL, USA).
To assess the dynamics of radial growth, the total number of xylem cells was modeled for each site with a Gompertz function for the use of a nonlinear regression procedure included in the Origin software (OriginLab Corporation, Northampton, MA, USA). Furthermore, the estimated rate of cell production during the growing season was derived from the Gompertz function through the first derivation [29]. Considering that the number of cells in the annual rings varies within the tree circumference and consequently among different samples, standardization is required. The total cell number of the previous tree ring was recorded in every sample and was used for cell number correction for each tree [30].

2.4. Environmental Factors and Climate-Growth Relationship

Environmental factors, including air temperature, soil temperature and soil water content, were monitored at the upper and lower distribution limits during the entire year of 2011. We used two temperature loggers for each site. One was fixed at 1.5 m above the ground for measuring air temperature (Ta, °C) using a HOBO data logger (Onset Computer Corp, Bourne, MA, USA), and the other was buried in the soil at a depth of 20 cm for measuring the soil temperature (Ts, °C) and soil volumetric water content (SWC, m3·m−3) using a GP1 data logger (Delta-t, UK). Additionally, precipitation (mm) was collected at an automatic weather station (Onset Computer Corp, USA), which was located in a relatively flat area approximately 400 m above the upper distribution limit. The recording frequencies were every 30 min for all measurements.
The relationships between xylem growth and environmental factors were analyzed using Pearson correlation coefficients [31]. Xylem cell number increases (including total cells in enlarging, wall-thickening and mature phase) were calculated for one weekly interval based on the Gompertz function. For the same interval mean daily minimum, mean and maximum air and soil temperature, soil volumetric water content and precipitation sums were also calculated. Considering the majority of cells were produced during the phase of cell enlargement [32], the time period for the climate-growth relationship analysis was set as the period from the date of the onset of xylem growth to the date of the maximum growth rate.

2.5. Threshold Temperature

Logistic regression (SPSS Inc., Chicago, IL, USA) was used to calculate the 0.5-probability of cambium being active at a given daily temperature for the cambium onset in spring [13]. The time when the number of cambial cells started to increase after the dormancy was considered as the cambium being active. For each tree and site, the model was fitted with the respective temperature series (mean, minimum and maximum air and soil temperatures). The estimated thresholds were compared between the two sites using Mann–Whitney rank-sum test.

3. Results

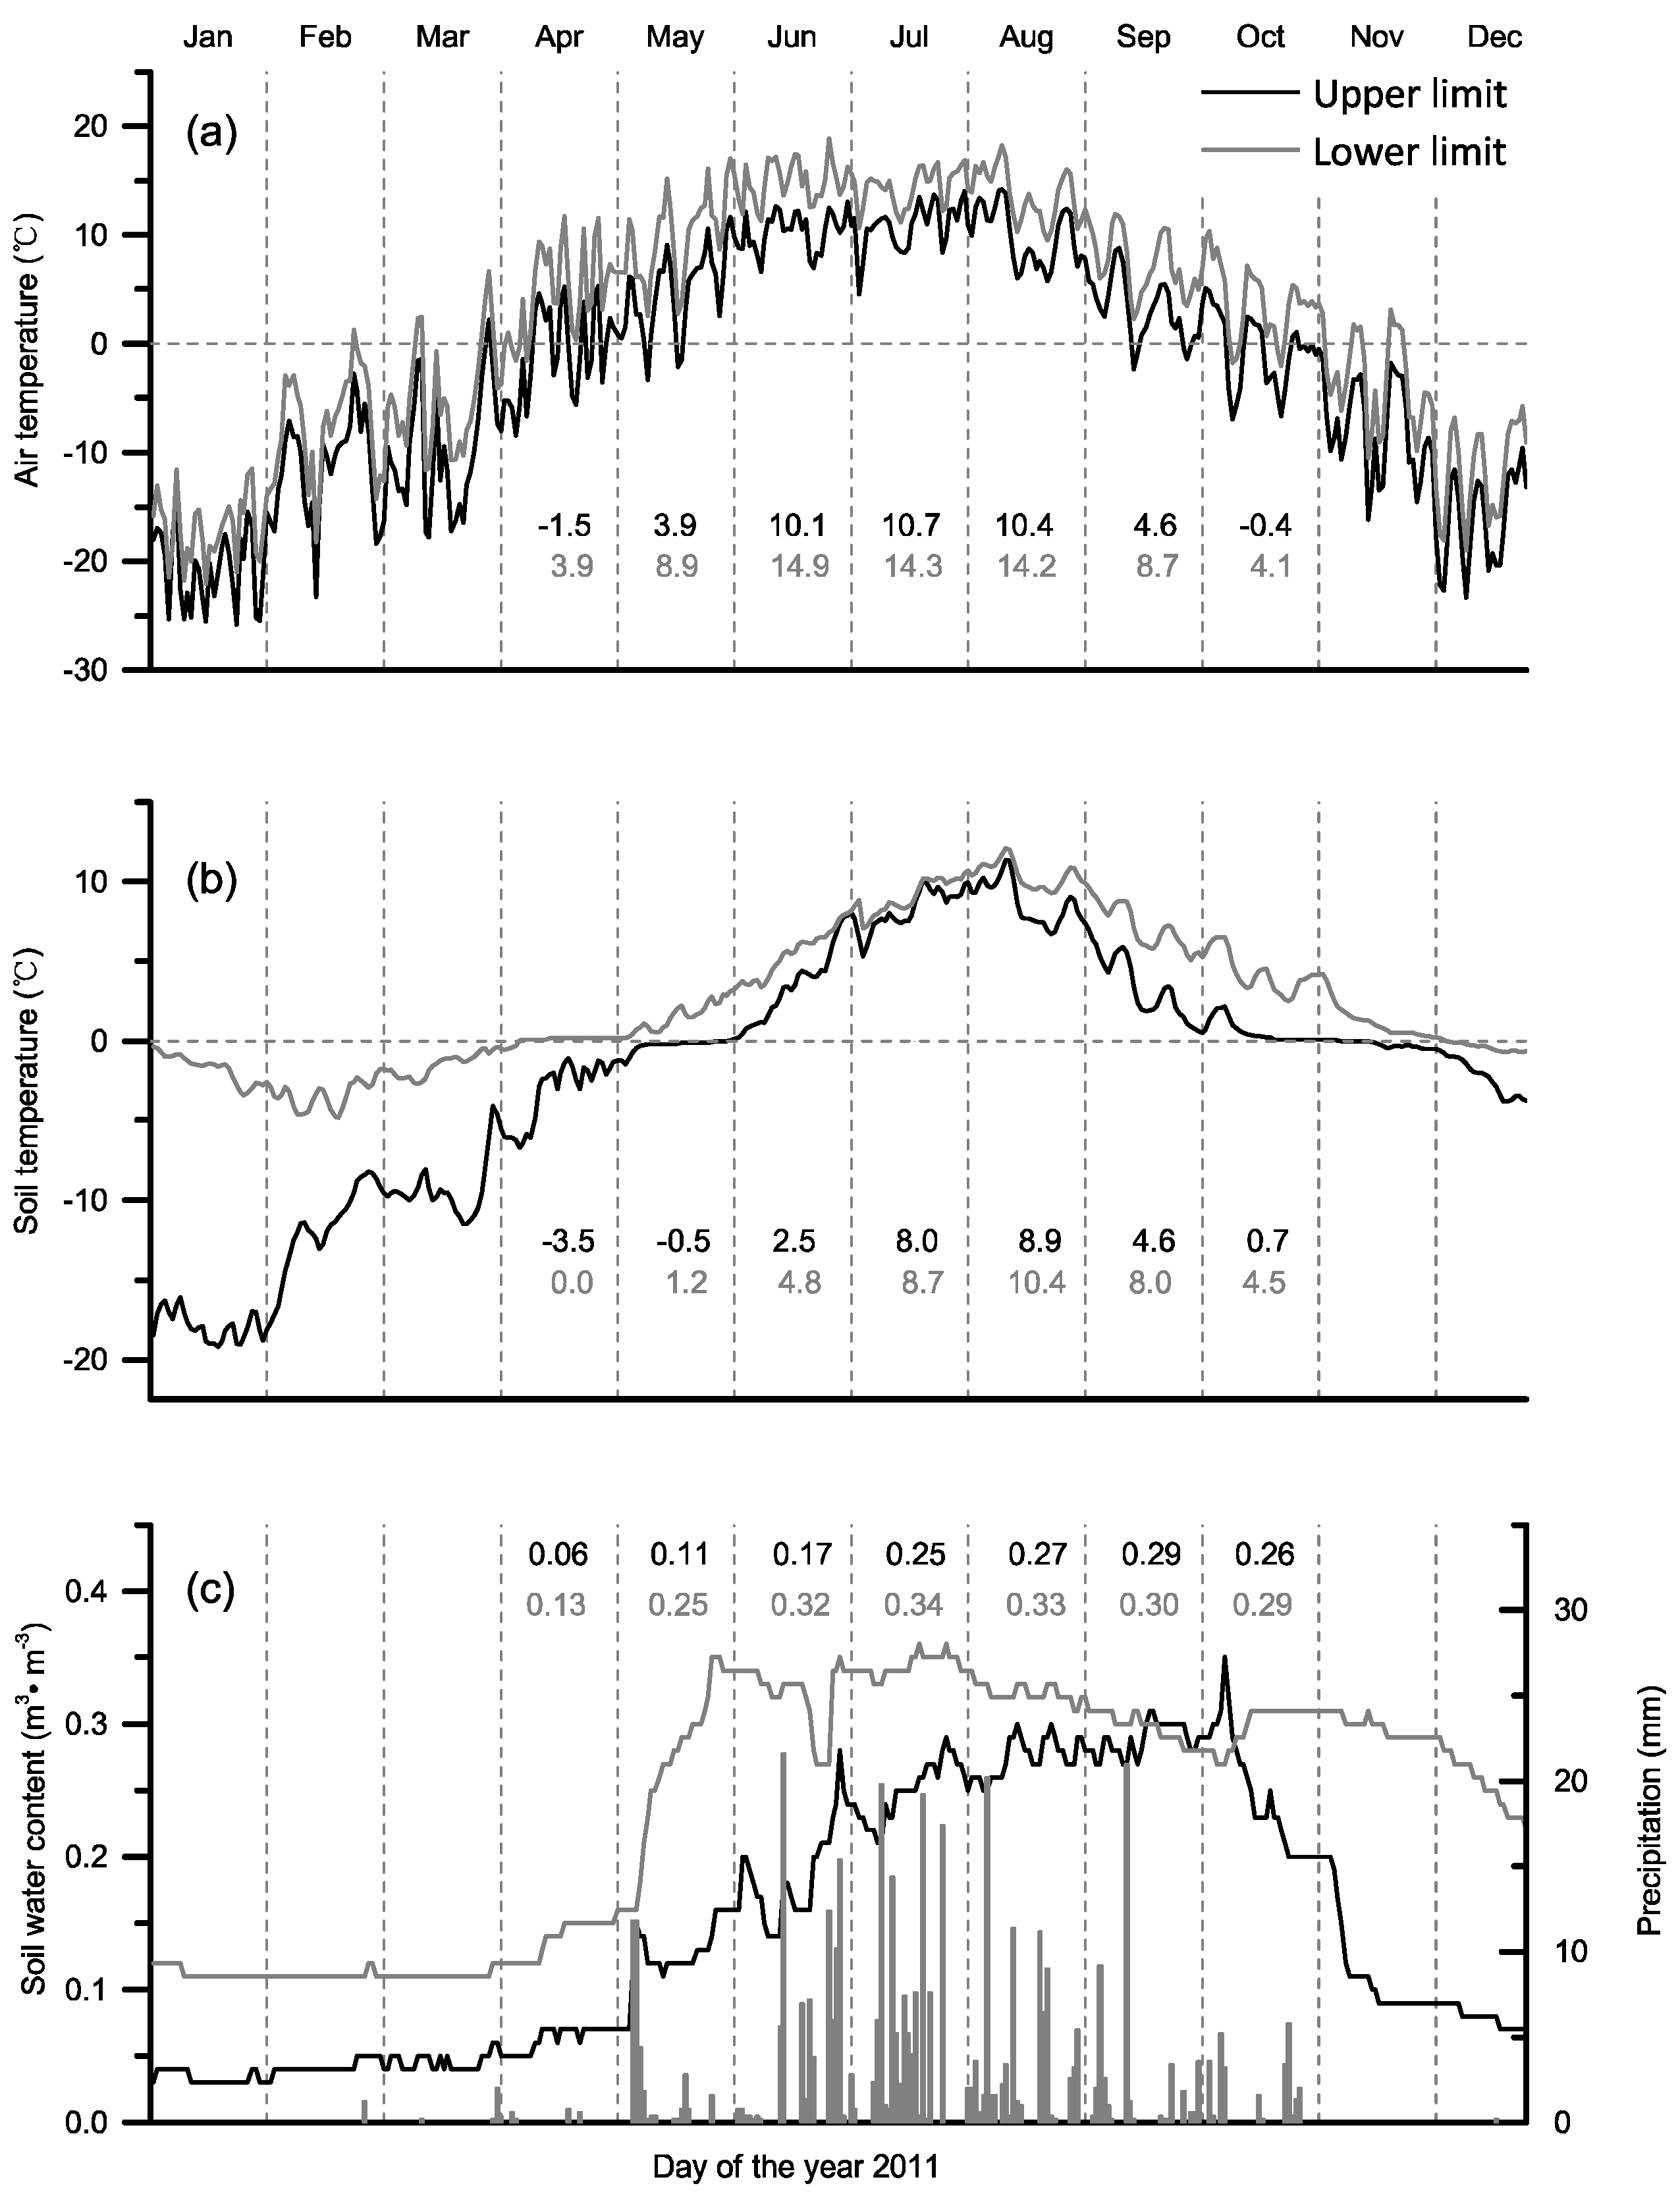
3.1. Temperature and Water Conditions at the Upper and Lower Distribution Limits

Based on the daily values, the meteorological parameters showed significant altitude-dependent differences (analyses of independent T-test, P < 0.001) (Figure 4, Table 1). The mean annual air temperature in 2011 was −2.1 °C and 2.3 °C at the upper and lower distribution limits, respectively. This 4.4 °C difference between two sites was nearly maintained throughout the whole year. During the growth period (from May to September), the monthly mean air temperature varied between 3.9 °C and 10.7 °C and between 8.9 °C and 14.9 °C at the upper and lower distribution limits, respectively.
Figure 4. Environmental variables recorded at the upper (black line) and lower (grey line) distribution limits in the year of 2011, including the mean daily (a) air temperature, (b) soil temperature, (c) soil water content and daily precipitation sum (grey bar). (a–c) The mean monthly values are denoted by black and grey colors for the upper and lower distribution limits, respectively.
Forests 06 03809 g004
Table 1. Characteristics of Larix principis-rupprechtii trees (n = 3 trees/site) and meteorological parameters recorded at the upper and lower distribution limits forest site in the year of 2011.
SiteAltitude (m a.s.l.)Tree Height (m)DBH (cm)AgeTa (°C)Ts (°C)SWC (m3·m−3)
annualwinterGSannualwinterGSannualwinterGS
Upper distribution limit (Upper)27405.7 ± 1.317.2 ± 7.343 ± 3−2.1−13.57.9−1.7−10.94.70.150.050.22
Lower distribution limit (Lower)204015.3 ± 1.527.3 ± 5.634 ± 52.3−9.112.22.8−0.96.60.240.160.31
Abbreviations: DBH = Diameter at Breast Height, Ta = Air Temperature, Ts = Soil Temperature, SWC = Soil Water Content, winter = previous year of November-current year of March, GS (growth season) = May–September; mean ± SD (standard deviation).
Soil temperature, which lagged behind air temperature, was above zero after the snow had disappeared. During the period of snowmelt at the upper distribution limit, the soil temperature exhibited a plateau with a small amplitude fluctuation approximately 0 °C, which lasted for nearly one month until late May (Figure 4b). Because of the higher air temperature at the lower distribution limit, the soil temperature reached above zero almost one month earlier (9 April) than the upper distribution limit.
The average volumetric SWC was lower at the upper distribution limiting site (0.22 m3·m−3) than at the lower distribution limiting site (0.31 m3·m−3) for the duration of the growing season. From early April, when the snow began to melt, the soil water content started to increase. The soil water content fluctuated somewhat in the following months probably due to precipitation levels (Figure 4c, Table 1).

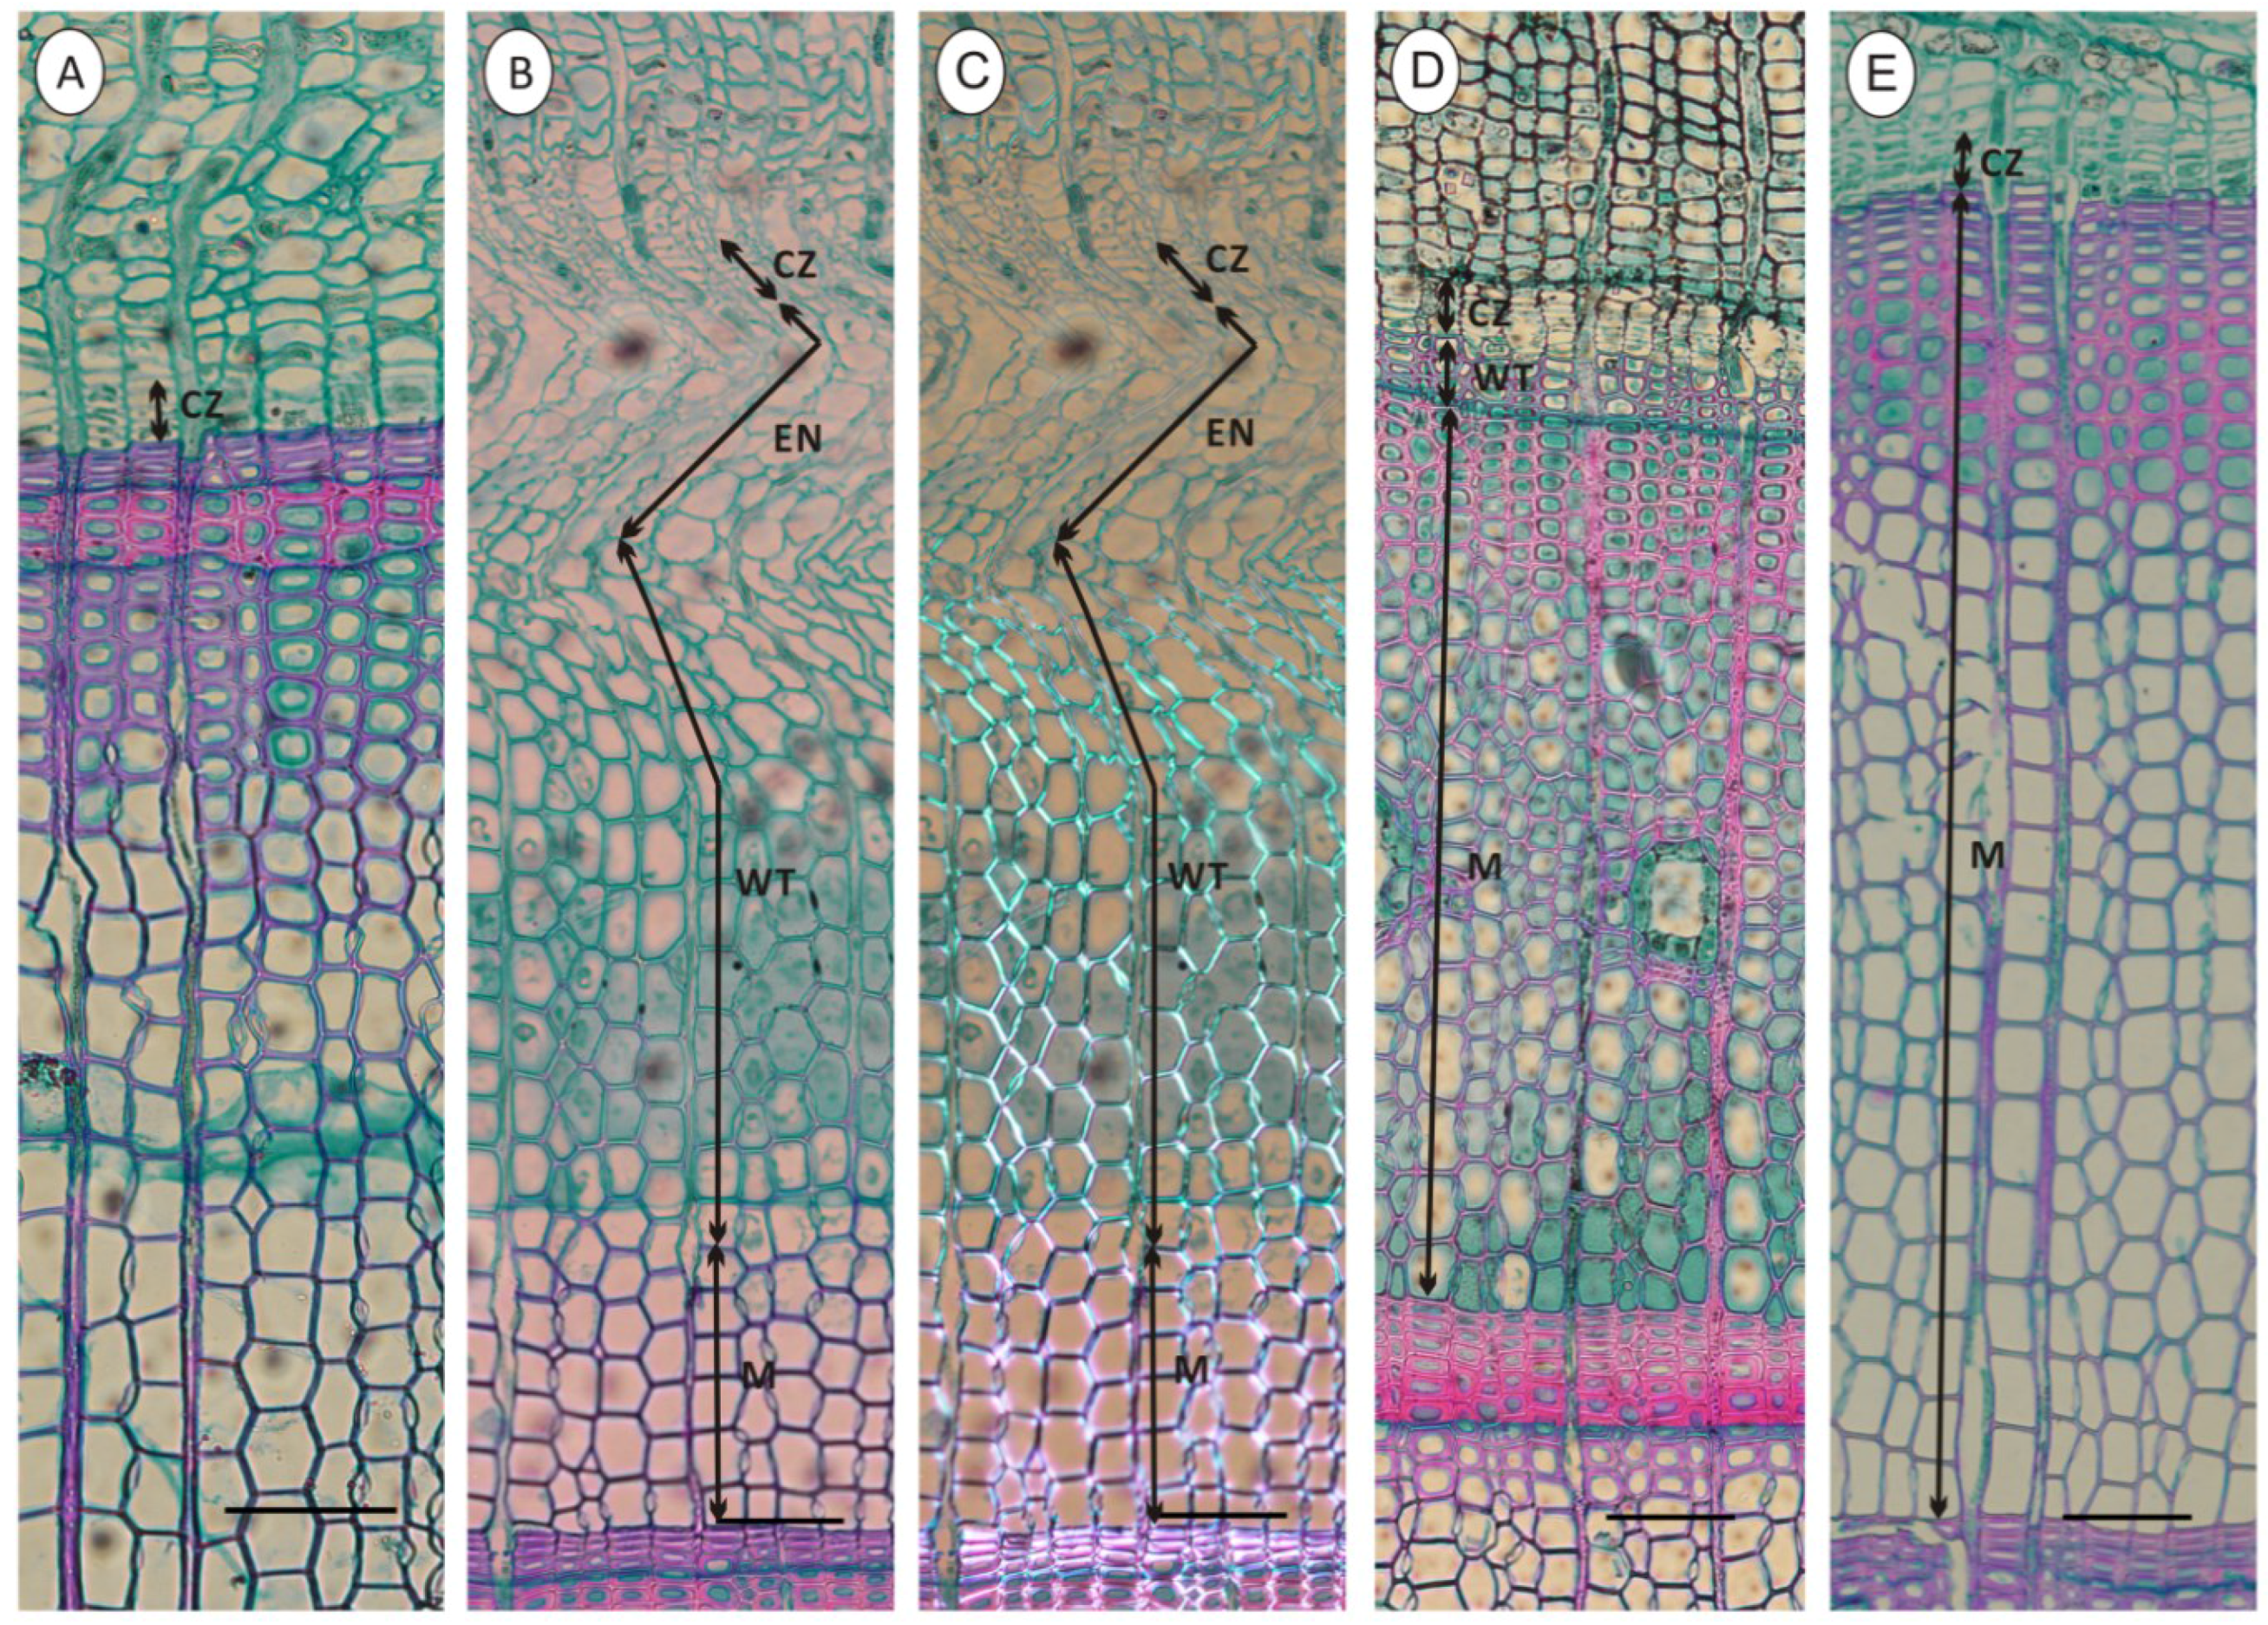
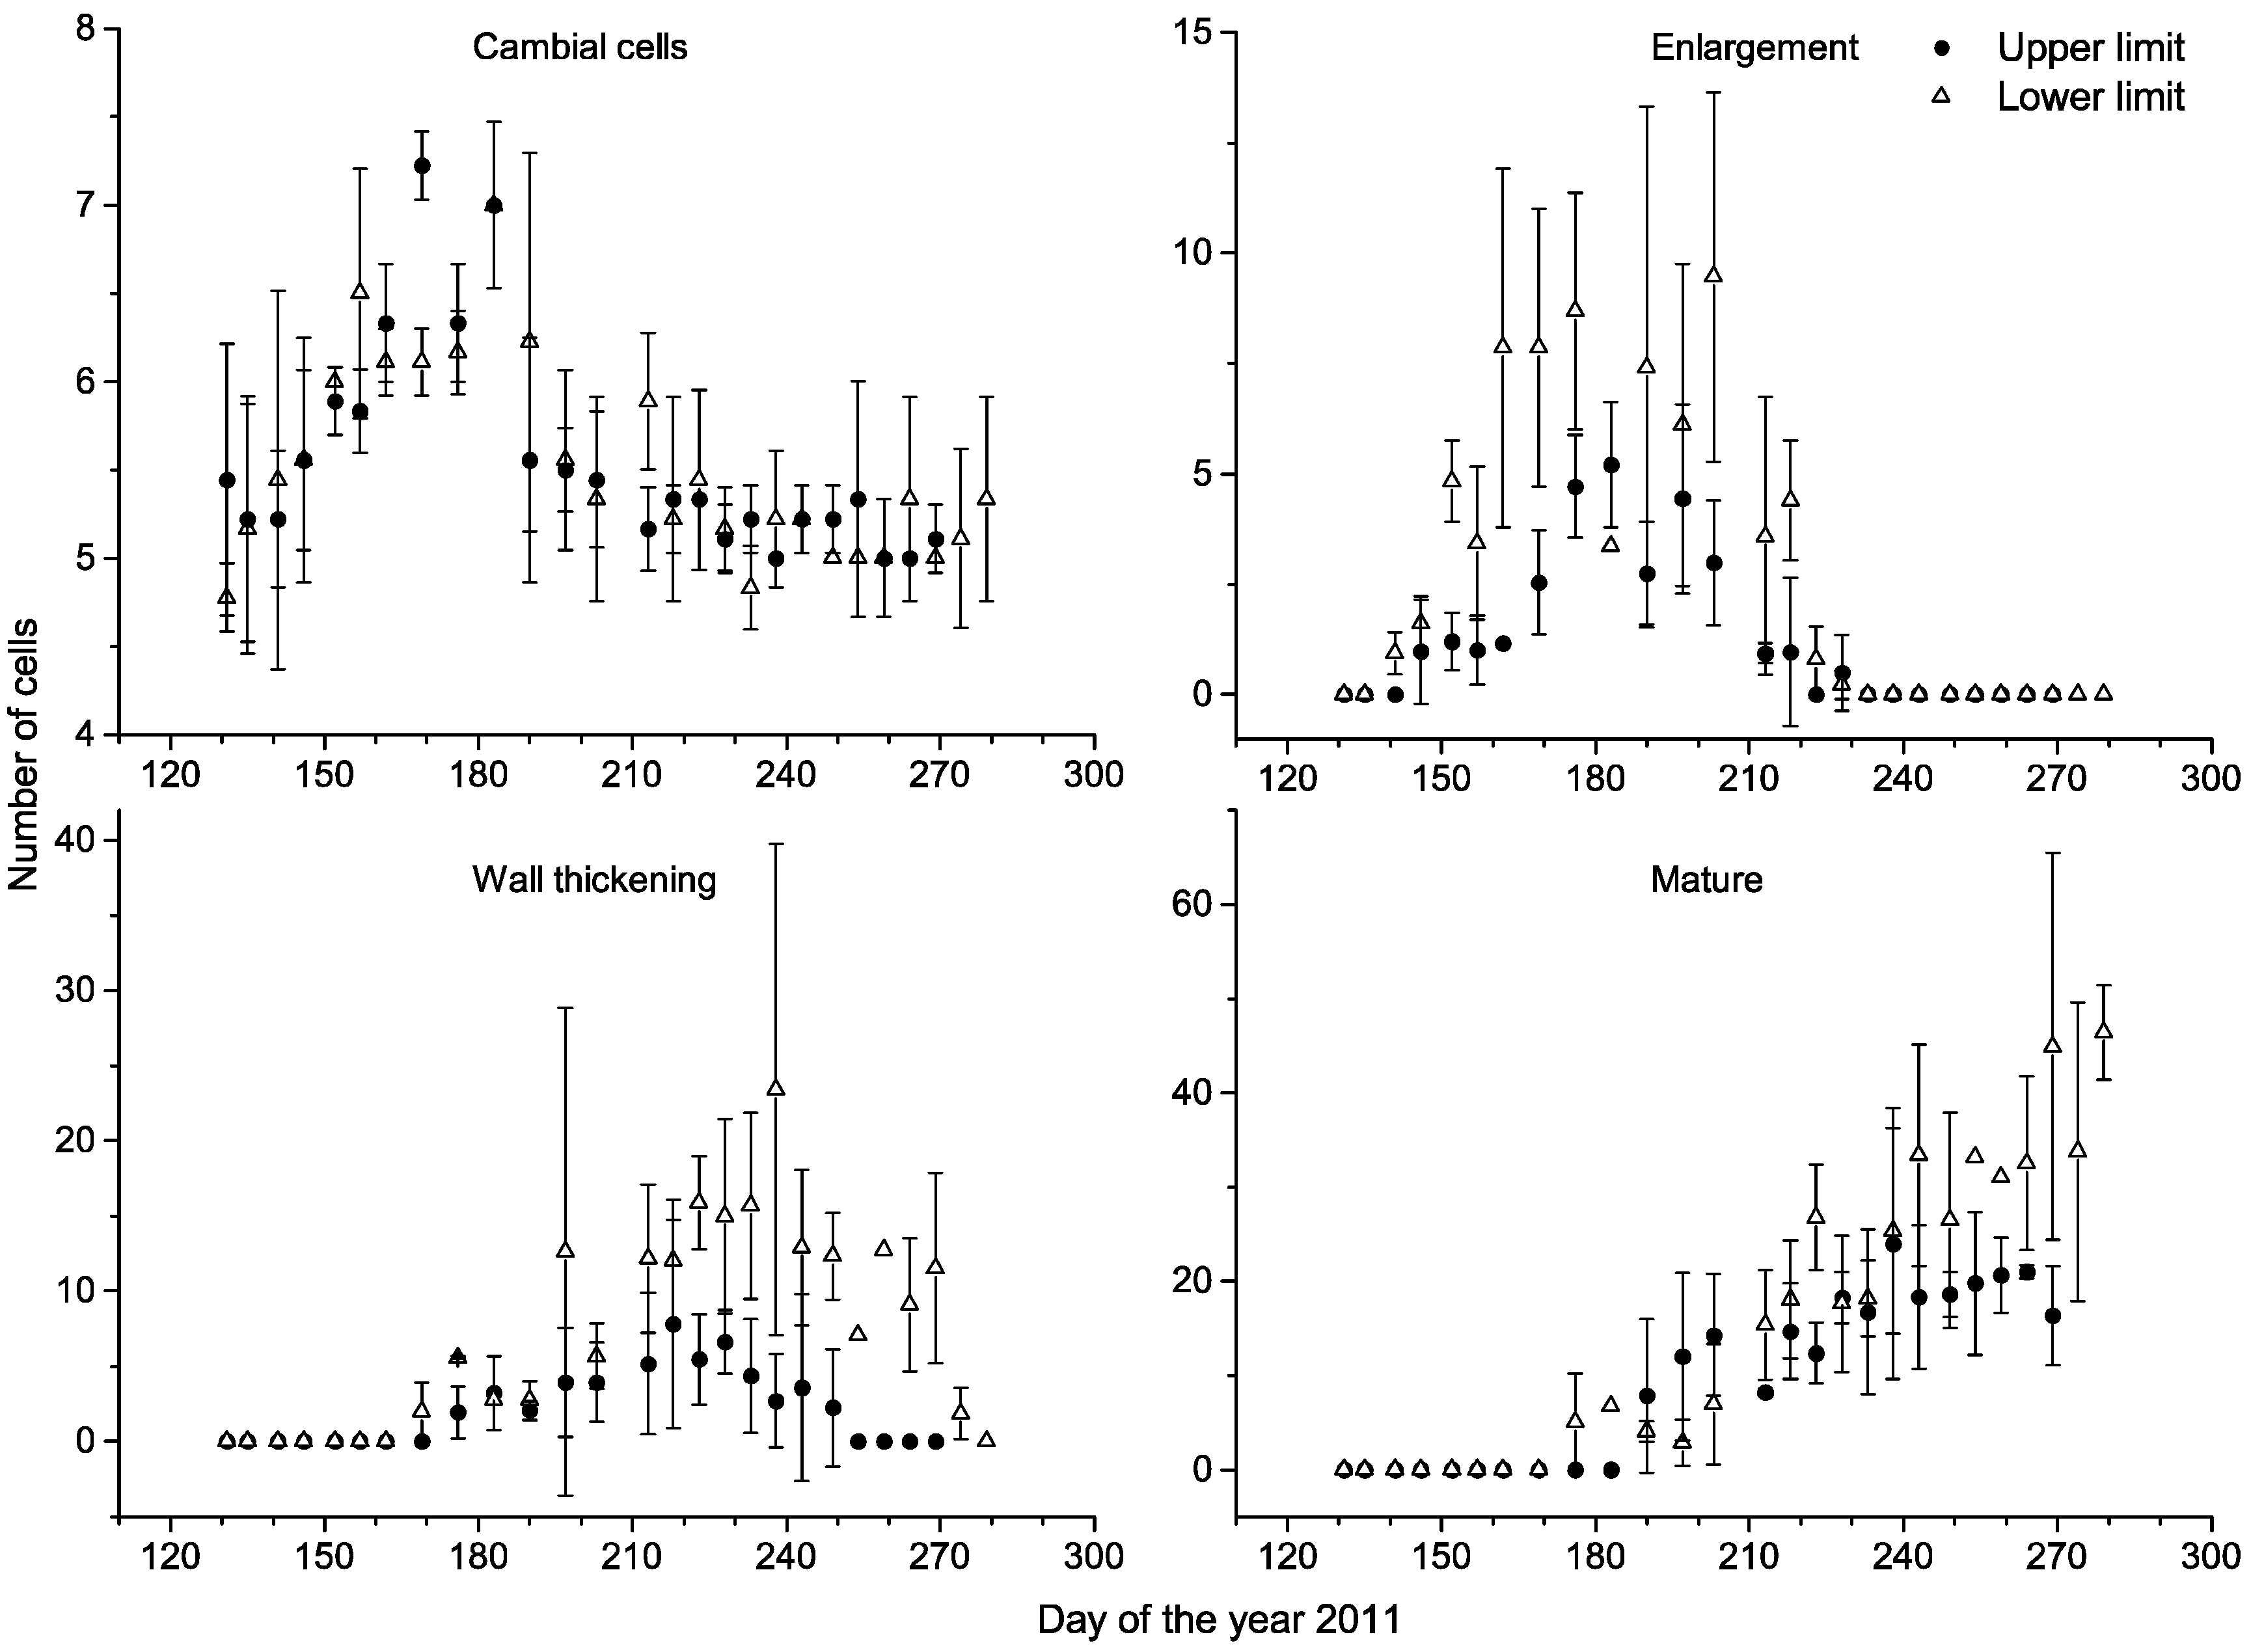
3.2. Cambial Activity and Xylem Differentiation

In late autumn and winter, when no cell production occurred, the dormant cambium was comprised of four and five cells. In late May, the cambial cells began to increase around 26 May (DOY 146) at the upper distribution limit versus 21 May (DOY 141) at the lower distribution limit. In summer, the cambial cells decreased to minimum values around 23 July (DOY 204) at the upper distribution limit, which was nearly two weeks earlier than the lower distribution limit. The maximum number of cambial cells (seven to eight cells) occurred in late June and early July for the upper and lower distribution limit, respectively (Figure 5).
Figure 5. Numbers of cells in the cambial zone, radial enlargement, wall thickening, and maturephase at the upper and lower distribution limits in the year of 2011. Error bars represent standard deviations.
Forests 06 03809 g005
The timing of xylem differentiation differed between the upper and lower distribution limits. The onset of cell enlargement was observed in late May, and was seven days earlier for the lower distribution limit (Figure 5, Table 2). However, there was no difference in the timing of the onset of cell enlargement between the two distribution limits (Mann–Whitney rank-sum test, P > 0.05). On the other hand, a significant difference in the timing of the end of xylem differentiation was observed (P = 0.046), i.e., around the beginning of September (DOY 245) at the upper distribution limit and around early October (DOY 277) at the lower distribution limit.
Table 2. Timing and duration of xylem differentiation and cell production at the upper and lower distribution limits of Larix principis-rupprechtii trees in the 2011.
SiteOnsetEndDuration
ENWTMENWTENWTxylogenesis
Upper150 ± 3178 ± 4190 ± 0 a225 ± 8245 ± 8 a75 ± 1167 ± 5 a95 ± 12 a
Lower143 ± 3171 ± 4176 ± 0 b225 ± 3277 ± 3 b82 ± 0106 ± 4 b135 ± 3 b
Z−1.826−1.650−2.236−0.232−1.993−0.696−1.964−1.993
P0.0680.0990.0250.8170.0460.4870.0500.046
Abbreviations: EN, WT and M refer to the enlargement (EN), wall-thickening (WT) and mature (M) phase, respectively; onset and end of xylem formation phase are given in days of the year (DOY); letters (a, b) indicate significant differences between two sites based on Mann–Whitney rank-sum Test (P < 0.05).
Correspondingly, the durations of xylem differentiation phase (including cell enlargement, wall thickening and xylogenesis) were significantly different (Mann–Whitney rank-sum test, P < 0.05) except for the duration of cell enlargement. Additionally, the duration of xylogenesis was 95 days and 135 days for the trees at the upper and lower distribution limits, respectively.

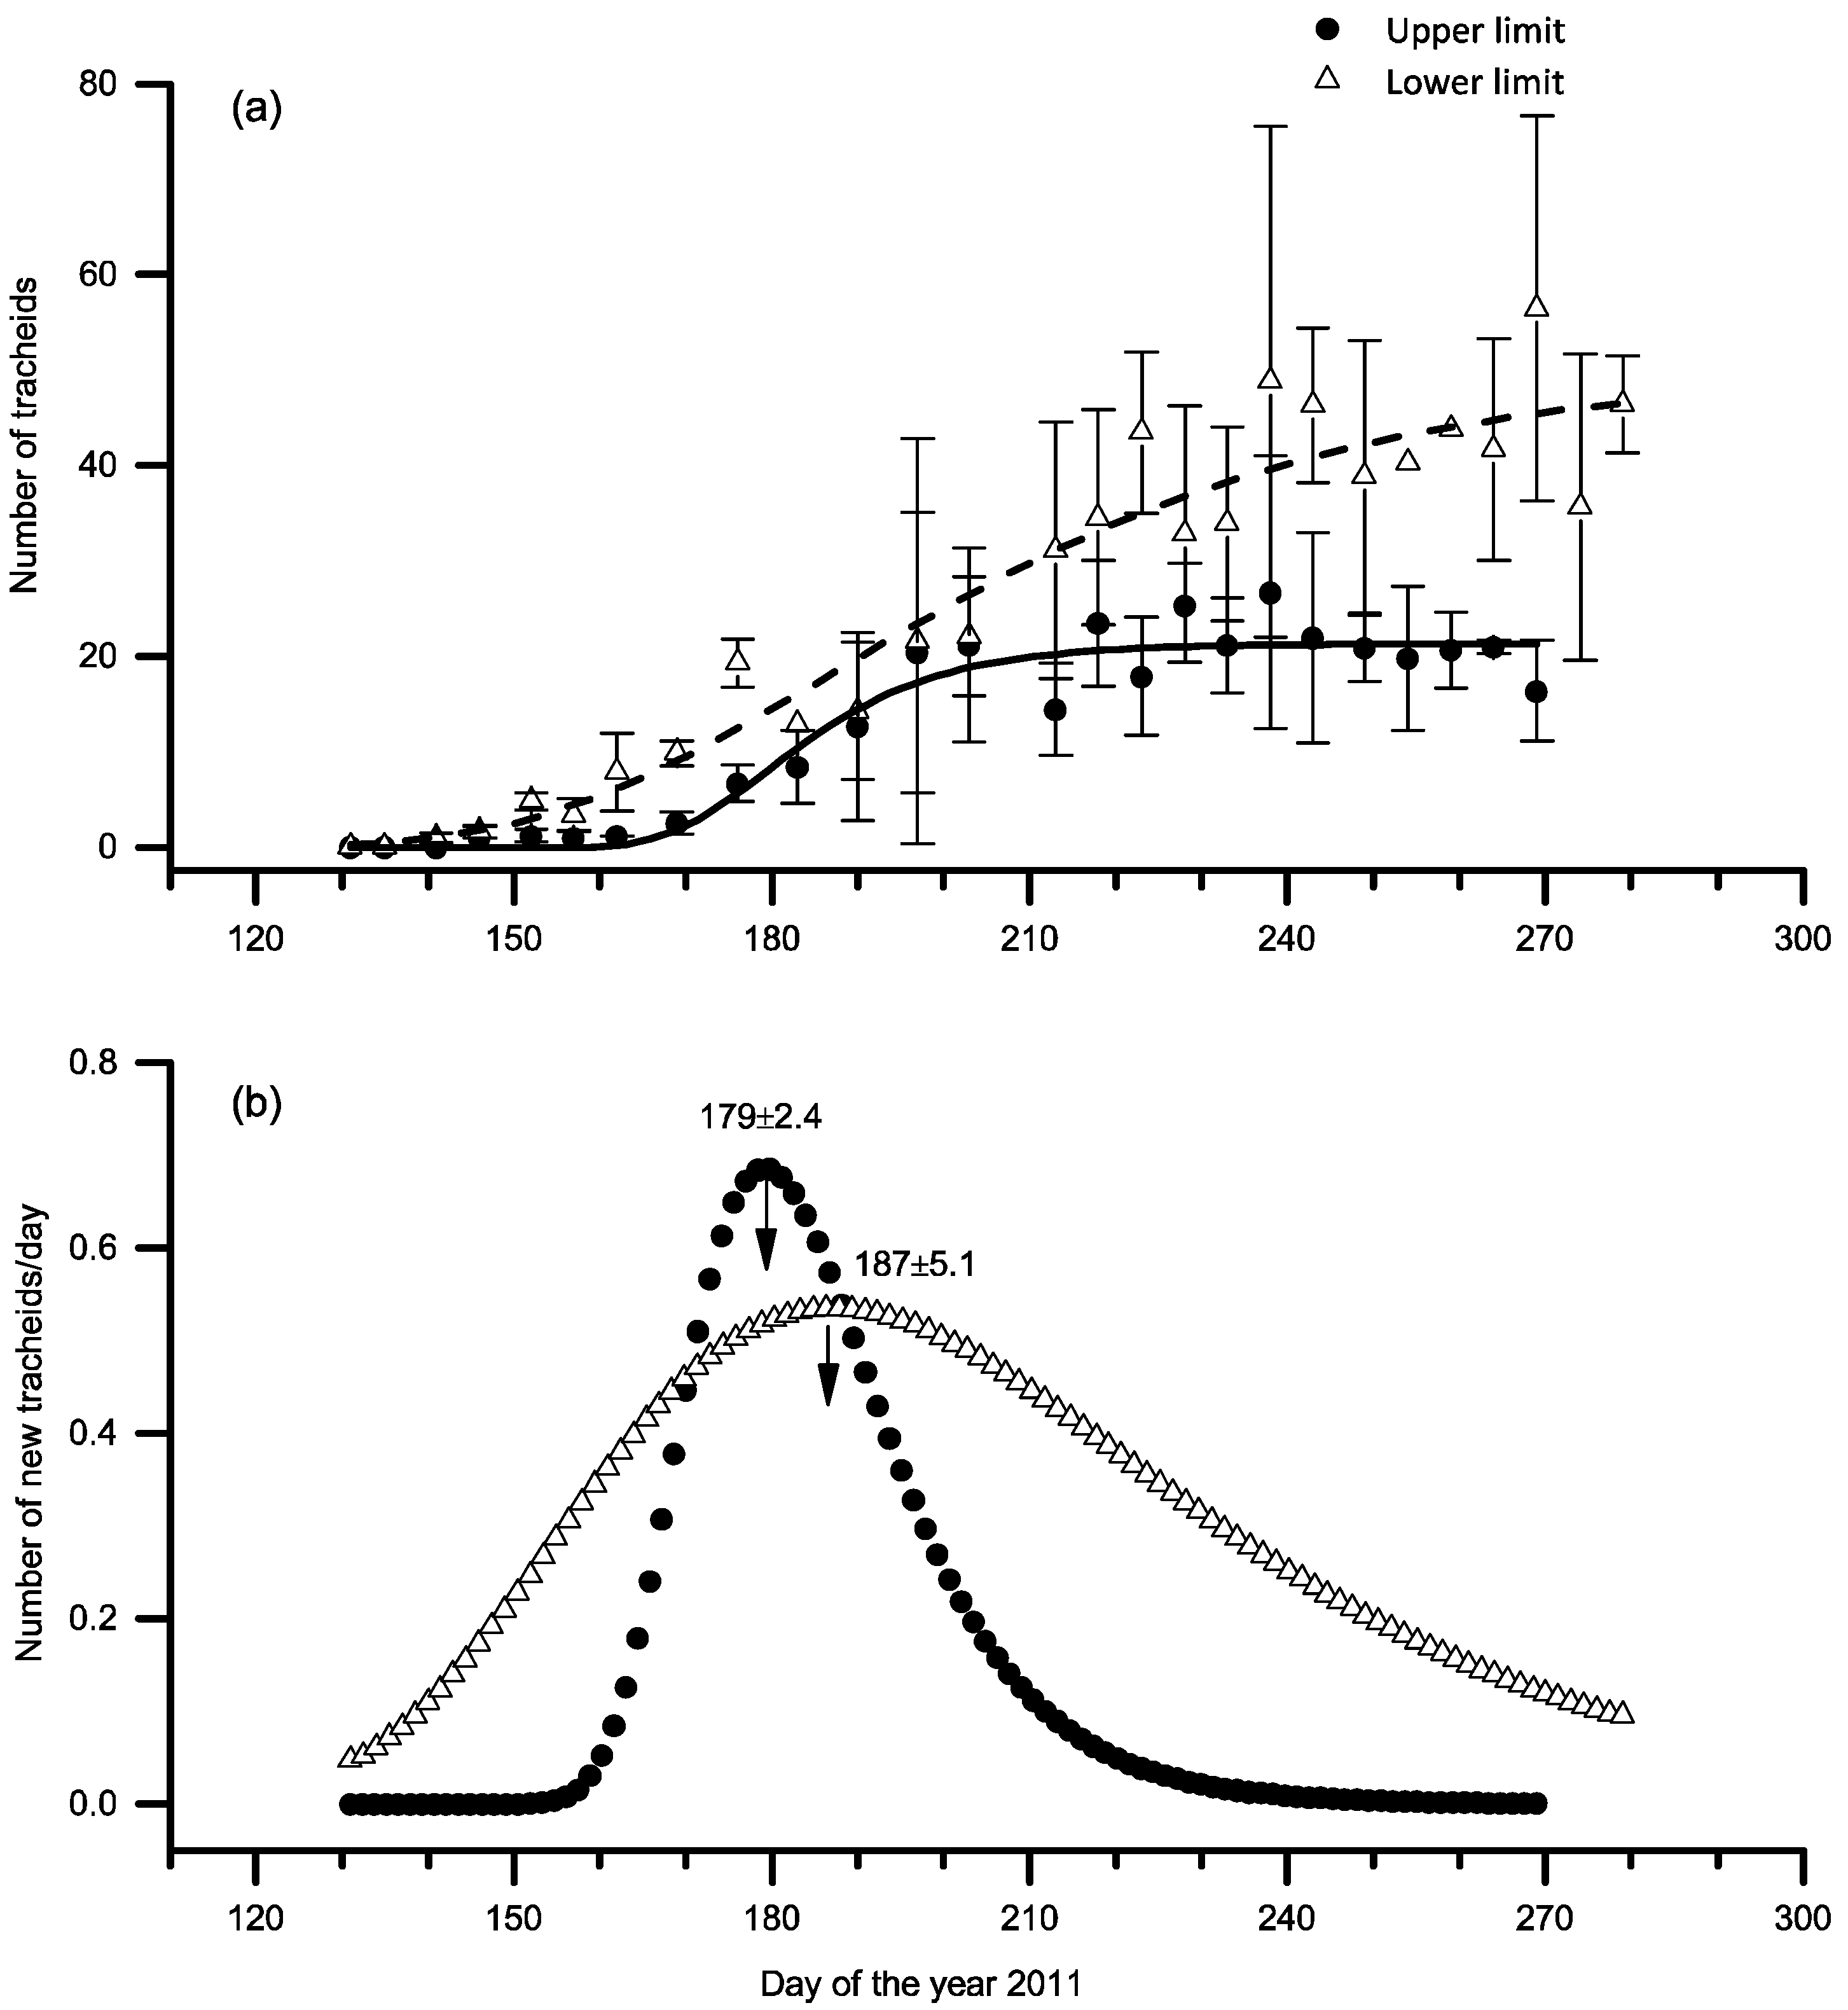
3.3. Xylem Growth Comparison

The xylem growth was well fit by the Gompertz function with the high adjusted R2 values of 0.92 (P < 0.001). The total number of new xylem cells and the xylem growth rate differed between the upper and lower distribution limits (Figure 6). The trees at the upper site produced 50% fewer cells than the lower ones; these values were 21 and 50, respectively. The maximum rate of cell production occurred in late June and mid-July for the trees at the upper and lower distribution limit, which were 0.69 cell·day−1 and 0.53 cell·day−1, respectively.
Figure 6. (a) Dynamic of xylem growth (including enlarging, wall thickening, and mature cells) are modeled by applying the Gompertz function. (b) Daily xylem growth rates are calculated on the basis of modeled growth. Inflection points (day of the year ± standard deviation) are indicated.
Forests 06 03809 g006

3.4. Climate-Growth Relationship

Soil temperature significantly and positively correlated with the cells production, especially the daily minimum soil temperature, which the correlations were r = 0.951 and r = 0.924 for the upper and lower distribution limits, respectively (Table 3A). The daily minimum air temperature was also positively correlated with cell production at both sites, whereas a significant positive correlation of the daily mean and maximum air temperature on cell production was only found at the lower site. Moreover, no significant correlation was found between cell production and precipitation, or between cell production and soil water content.
Table 3. Climate-growth relationship of Larix principis-rupprechtii at the upper and lower distribution limits in 2011. (A) Pearson correlation coefficients between total cell numbers and environmental factors in the period from the date of the onset of xylem growth to the date of the maximum growth rate. (B) Threshold daily minimum, mean and maximum temperatures of air and soil. The total cell numbers were the number of cells produced during one weekly interval based on the Gompertz function. The threshold temperature was the given daily temperautre with the 0.5-probability of cambium being active for the onset in spring.
SiteA: Pearson Correlation CoefficientsB: Threshold Temperature
SWCPTaTsTa (°C)Ts (°C)
minmeanmaxminmeanmaxminmeanmaxminmeanmax
Upper0.5460.3740.6850.6600.6310.9510.9450.9352.8 ± 0.7 a6.7 ± 0.5 a11.5 ± 0.1 a−0.07 ± 0.01−0.07 ± 0.02−0.05 ± 0.04
Lower0.4970.4920.8310.8050.7360.9240.9240.9214.5 ± 0.6 b9.4 ± 0.8 b14.6 ± 0.9 b1.23 ± 0.271.42 ± 0.281.71 ± 0.29
Abbreviations: SWC = Soil Water Content, P = Precipitation, Ta = Air Temperature, Ts = Soil Temperature; Significant correlation (P < 0.05) are marked bold; letters (a, b) indicate significant differences between two sites based on Mann–Whitney rank-sum Test (P < 0.05).

3.5. Threshold Temperature

A significant difference was found in the daily air temperature thresholds for cambium onset between the upper and lower distribution limits (Mann–Whitney rank-sum test, P < 0.05). For the trees at the upper distribution limit, the thresholds of the daily air temperature were approximately 2.8, 6.7 and 11.5 °C for minimum, mean and maximum, respectively (Table 3B). The values for the trees at the lower distribution limit were approximately 2.5 °C higher. For soil temperature, no significant difference was observed between the upper and lower distribution limits (P > 0.05). A slight variation in the threshold for the minimum and maximum soil temperature was found at both sites, which ranged from −0.07 to −0.05 °C at the upper distribution limit and from 1.23 to 1.71 °C at the lower distribution limit.

4. Discussion

4.1. Comparison of Xylem Growth Patterns at the Upper and Lower Distribution Limits

Our results support the hypothesis that the different xylem growth pattern was found between the upper and lower distribution limits. Compared with trees at the lower distribution limit, xylogenesis at the upper treeline was characterized by (i) a considerably shorter duration (6–7 weeks) of xylem growth, (ii) a sharp and high amplitude of the cell production rate, and (iii) a total newly formed xylem cell production of less than half that of the lower distribution limit.
In European and North American conifers in cold environments, xylem growth mostly occurs from May to October [33,34]. A similar trend of L. principis-rupprechtii was observed, i.e., the onset of the cambial zone occurred in late May and xylem formation ended during early September at the upper treeline or early October at the lower distribution limit. Accordingly, the duration of xylem formation lasted between 95 and 135 days, which indicated a clear 40-day shortening of the growing season with an increase in elevation of ca. 700 m. Similarly, in the Swiss Alps Larix decidua has been observed to have a 36 day shortening of the growing season with an increase in elevation of ca. 800 m [22]. The small discrepancy with our results can perhaps be explained by the higher elevation of our upper site (600 m altitudinal difference).
Rate of cell production is very important in the progress of the growing season [35]. Our results demonstrated that different cell production rates of L. principis-rupprechtii showed different life strategies between the upper and lower distribution limits. At the lower distribution limit, trees exhibited an “extensive strategy” of xylem growth, with a longer duration but lower maximum growth rates. By contrast, at the upper distribution limit, trees adopted an “intensive strategy” with a shorter duration but higher maximum growth rates [36]. Different altitudes are associated with different thermal regimes, which strongly influence the availability of water and nutrients for trees, mainly in cold ecosystems [37]. Thus, as an efficient strategy, a much shorter growth season and much faster maximum rate of cell production was required by the trees at the upper distribution limit.
Both the rate of cell production and the length of the growing season may influence the number of newly formed xylem cells [38]. Within the same habitat, based on the competitive production principle, trees tend to achieve great overall productivity by accelerating the rate of cell production [39]. However, in different habitats, the controlling factor for the formation of new cells may change. For example, Prislan et al. found that xylem ring widths in beech depended more on the length of the growing season than on the rate of cell production at lower elevations. The opposite was observed at higher elevations [40]. Thus, at high altitude and in colder environments, trees tended to produce fewer total cells in order to guarantee enough time for newly formed cells to complete lignification before winter [5]. This is consistent with the observation in our study of a strong correlation between total cell production and air/soil temperature, particularly the minimum soil temperature.

4.2. Role of Soil Temperature in Cambial Activity Onset and Its Threshold Values

Compared with the air temperature, the role of soil temperature might also be very important for cambial reactivation [41,42]. This is because soil warming is able to alter xylem differentiation both in the root and along the stem. In our study, stem cambial activity was initiated when the soil temperature increased to 0 °C. Neither the soil temperature thresholds for xylogenesis nor the timing of the onset of xylem growth were significantly different between the upper and lower distribution limits. By contrast, the air temperature thresholds for xylogenesis were significantly different between altitudes. Therefore, our results suggested that soil temperature was the main limiting factor that controlled the onset of cambial activity in this study area. Our previous study on intra-annual stem radial growth of P. meyeri at Luyashan Mountain by using point dendrometers also indicated that soil temperature determined the initiation of radial growth [43]. This is agreement with Kirdyanov et al., who stated that a soil temperature above 0 °C is needed for triggering cambial activity [44].
However, some studies reported that a much higher soil temperature should be reached for cambial resumption. A daily mean soil temperature below 6 °C strongly limited root activity and water uptake in temperate trees [45]. Körner who studied northern treelines, did not detect cambial activity at a soil temperature below 3–5 °C [46]. However, Schenker et al. proposed minimum soil temperature for the root growth of seven broad-leaved trees was 2.3–4.2 °C [47]. Considering these species’ natural distribution limits at higher elevations, their roots are likely to have lower thermal limits. In Canada, the needles of evergreen conifers were temporarily active once the soil temperature increased to 0 °C during the warmest days of winter and early spring [16,48]. In China, L. principis-rupprechtii that can survive in environments where the mean annual temperature is less than −4 or −2 °C appear to be more adapted to living at low temperatures [49].
The range of the threshold temperature may depend not only on species-specific traits but also on the climatic conditions, which control the length of the period that is suitable for xylem growth. A previous study reported that 100 days was the minimum period for xylem growth [11]. In the upper distribution limit of our study, the trees initiated cambial activity once the daily soil temperature increased above 0 °C, which guaranteed sufficient time for a growing season with a length of 95 days. If the threshold of the soil temperature is assumed to be 2 °C, the length of the growing season required for complete differentiation probably will be insufficient.

4.3. Cessation of Xylem Growth

The cessation of xylem growth between two altitudes showed statistically significant differences. The same trend of large variability in the timing of ending was also observed in some other reports studying growth along montane altitude transects [13,20,50]. Based on previous studies, the cessation of xylem growth may be triggered not only by the photoperiod and/or air temperature, but is also probably regulated by tree social status [32], resource availability [51], or other internal physiological mechanisms [52]. Considering from the cause and correlation of xylem cell phenology, some studies demonstrated that the delayed cessation of wood formation could contribute to a greater amount of xylem cell, which was required more time for cell differentiation [53,54,55]. In Moser’s research of Larix decidua in the Swiss Alps [22], the termination of cell differentiation was simultaneous, which can partial explained by the similar total cell number along the altitudes.

5. Conclusions

Our results support the hypothesis that xylogenesis differs between the upper and lower distribution limits in L. principis-rupprechtii; there was a clear 40-day shortening of the growing season and a reduced total number of new xylem cells with an increase in altitude of ca. 700 m. Different strategies were adopted by the trees between the upper and lower distribution limits. Because of the cold environment, trees at the upper distribution limit adopted an “intensive strategy” to complete xylem growth during a shorter growing season but with a higher maximum growth rate; these trees produced 21 new cells. By contrast, trees at the lower distribution limit exhibited an “extensive strategy” with a longer duration but a lower maximum growth rate; these trees produced 50 new cells. The total cell numbers were largely dependent on the daily soil temperature and minimum air temperature during the major period of xylem growth at both sites. Estimated using mean daily values, soil temperature was likely the main factor controlling the initiation of growth of L. principis-rupprechtii in this region; the thresholds of daily mean soil temperature were 0 °C and 1.4 °C for the upper and lower distribution limits, respectively, while the air temperature thresholds were 6.7 °C and 9.4 °C, respectively. At present, there are insufficient data available from comparative studies across different years. We suggest that more work be conducted in the future on intra-annual growth of trees at their distribution limits.

Acknowledgments

This work was supported by the National Science Foundation of China (Grant No. 41171067 and 41401063), as well as State Key Laboratory of Earth Surface Processes and Resource Ecology.

Author Contributions

Yuan Jiang and Yiping Zhang were responsible for the research design and the editing coordination of the paper. Data preparation and analysis were partitioned as follows: site inventory and sample collection (Mingchang Wang and Biao Wang); microcore embedment and cut (Yiping Zhang and YuanYuan Guo); and xylem growth analysis (Yuan Jiang and Yiping Zhang). Yuan Jiang, Yiping Zhang and Muyi Kang contributed to editing and reviewing the manuscript. The authors also thank Haochun Yang and Wentao Zhang for joining in the field samples collection.

Conflicts of Interest

The authors declare no conflict of interest.

References

  1. Fonti, P.; von Arx, G.; García-González, I.; Eilmann, B.; Sass-Klaassen, U.; Gärtner, H.; Eckstein, D. Studying global change through investigation of the plastic responses of xylem anatomy in tree rings. New Phytol. 2010, 185, 42–53. [Google Scholar] [CrossRef] [PubMed]
  2. Huang, J.G.; Bergeron, Y.; Zhai, L.H.; Denneler, B. Variation in intra-annual radial growth (xylem formation) of Picea mariana (pinaceae) along a latitudinal gradient in western Quebec, Canada. Am. J. Bot. 2011, 98, 792–800. [Google Scholar] [CrossRef] [PubMed]
  3. Rossi, S.; Morin, H.; Deslauriers, A.; Plourde, P.-Y. Predicting xylem phenology in black spruce under climate warming. Glob. Chang. Biol. 2011, 17, 614–625. [Google Scholar] [CrossRef]
  4. Gruber, A.; Zimmermann, J.; Wieser, G.; Oberhuber, W. Effects of climate variables on intra-annual stem radial increment in Pinus cembra (L.) along the alpine treeline ecotone. Ann. For. Sci. 2009, 66, 503. [Google Scholar] [CrossRef]
  5. Rossi, S.; Deslauriers, A.; Anfodillo, T. Assessment of cambial activity and xylogenesis by microsampling tree species: An example at the Alpine timberline. IAWA J. 2006, 27, 383–394. [Google Scholar] [CrossRef]
  6. Oberhuber, W.; Gruber, A.; Kofler, W.; Swidrak, I. Radial stem growth in response to microclimate and soil moisture in a drought-prone mixed coniferous forest at an inner Alpine site. Eur. J. For. Res. 2014, 133, 467–479. [Google Scholar] [CrossRef] [PubMed]
  7. Rossi, S.; Anfodillo, T.; Čufar, K.; Cuny, H.E.; Deslauriers, A.; Fonti, P.; Frank, D.; Gričar, J.; Gruber, A.; King, G.M.; et al. A meta-analysis of cambium phenology and growth: Linear and non-linear patterns in conifers of the northern hemisphere. Ann. Bot. 2013, 112, 1911–1920. [Google Scholar] [CrossRef] [PubMed]
  8. Begum, S.; Nakaba, S.; Yamagishi, Y.; Oribe, Y.; Funada, R. Regulation of cambial activity in relation to environmental conditions: Understanding the role of temperature in wood formation of trees. Physiol. Plant. 2013, 147, 46–54. [Google Scholar] [CrossRef] [PubMed]
  9. Begum, S.; Nakaba, S.; Bayramzadeh, V.; Oribe, Y.; Kubo, T.; Funada, R. Temperature responses of cambial reactivation and xylem differentiation in hybrid poplar (Populus sieboldii × P. grandidentata) under natural conditions. Tree Physiol. 2008, 28, 1813–1819. [Google Scholar] [CrossRef] [PubMed]
  10. Deslauriers, A.; Rossi, S.; Anfodillo, T.; Saracino, A. Cambial phenology, wood formation and temperature thresholds in two contrasting years at high altitude in southern Italy. Tree Physiol. 2008, 28, 863–871. [Google Scholar] [CrossRef] [PubMed]
  11. Rossi, S.; Deslauriers, A.; Gričar, J.; Seo, J.-W.; Rathgeber, C.B.K.; Anfodillo, T.; Morin, H.; Levanic, T.; Oven, P.; Jalkanen, R. Critical temperatures for xylogenesis in conifers of cold climates. Glob. Ecol. Biogeogr. 2008, 17, 696–707. [Google Scholar] [CrossRef]
  12. Schmitt, U.; Jalkanen, R.; Eckstein, D. Cambium dynamics of Pinus sylvestris and Betula spp. in the northern boreal forest in Finland. Silva Fenn. 2004, 38, 167–178. [Google Scholar] [CrossRef]
  13. Rossi, S.; Deslauriers, A.; Anfodillo, T.; Carraro, V. Evidence of threshold temperatures for xylogenesis in conifers at high altitudes. Oecologia 2007, 152, 1–12. [Google Scholar] [CrossRef] [PubMed]
  14. Swidrak, I.; Gruber, A.; Kofler, W.; Oberhuber, W. Effects of environmental conditions on onset of xylem growth in Pinus sylvestris under drought. Tree Physiol. 2011, 31, 483–493. [Google Scholar] [CrossRef] [PubMed]
  15. Turcotte, A.; Morin, H.; Krause, C.; Deslauriers, A.; Thibeault-Martel, M. The timing of spring rehydration and its relation with the onset of wood formation in black spruce. Agric. For. Meteorol. 2009, 149, 1403–1409. [Google Scholar] [CrossRef]
  16. Goodine, G.K.; Lavigne, M.B.; Krasowski, M.J. Springtime resumption of photosynthesis in balsam fir (Abies balsamea). Tree Physiol. 2008, 28, 1069–1076. [Google Scholar] [CrossRef] [PubMed]
  17. Körner, C. Alpine Plant Life: Functional Plant Ecology of High Mountain Ecosystem, 2nd ed.; Springer: Berlin, Germany, 2003. [Google Scholar]
  18. Körner, C. The use of ‘altitude’ in ecological research. Trends Ecol. Evol. 2007, 22, 569–574. [Google Scholar] [CrossRef] [PubMed]
  19. Ruosteenoja, K.; Räisänen, J.; Pirinen, P. Projected changes in thermal seasons and the growing season in Finland. Int. J. Climatol. 2011, 31, 1473–1487. [Google Scholar] [CrossRef]
  20. Oladi, R.; Pourtahmasi, K.; Eckstein, D.; Bräuning, A. Seasonal dynamics of wood formation in Oriental beech (Fagus orientalis Lipsky) along an altitudinal gradient in the Hyrcanian forest, Iran. Trees-Struct. Funct. 2011, 25, 425–433. [Google Scholar] [CrossRef]
  21. Takahashi, K.; Okuhara, I. Comparison of climatic effects on radial growth of evergreen broad-leaved trees at their northern distribution limit and co-dominating deciduous broad-leaved trees and evergreen conifers. Ecol. Res. 2011, 27, 125–132. [Google Scholar] [CrossRef]
  22. Moser, L.; Fonti, P.; Büentgen, U.; Esper, J.; Luterbacher, J.; Franzen, J.; Frank, D. Timing and duration of European larch growing season along altitudinal gradients in the Swiss Alps. Tree Physiol. 2010, 30, 225–233. [Google Scholar] [CrossRef] [PubMed]
  23. Treml, V.; Kašpar, J.; Kuželová, H.; Gryc, V. Differences in intra-annual wood formation in Picea abies across the treeline ecotone, Giant Mountains, Czech Republic. Trees-Struct. Funct. 2015, 29, 515–526. [Google Scholar] [CrossRef]
  24. Wu, Z. Vegetation of China; Science Press: Beijing, China, 1980. [Google Scholar]
  25. Wang, G.X.; Liu, X.Q.; Qiao, J. Forest of Shanxi; China Forestry Press: Beijing, China, 1992. [Google Scholar]
  26. Jiang, Y.; Zhang, W.T.; Wang, M.C.; Kang, M.Y.; Dong, M.Y. Radial growth of two dominant montane conifer tree species in response to climate change in North-Central China. PLoS ONE 2014, 9, e112537. [Google Scholar] [CrossRef] [PubMed]
  27. Ma, Z. Vegetation of Shanxi; China Science and Technology Press: Beijing, China, 2001. (In Chinese) [Google Scholar]
  28. National Soil Survey Office. Annals of Soil Species in China; China Agriculture Press: Beijing, China, 1995; Volume 4. (In Chinese)
  29. Zhai, L.H.; Bergeron, Y.; Huang, J.G.; Berninger, F. Variation in intra-annual wood formation, and foliage and shoot developement of three major Candian boreal tree species. Am. J. Bot. 2012, 99, 827–837. [Google Scholar] [CrossRef] [PubMed]
  30. Rossi, S.; Deslauriers, A.; Morin, H. Application of the Gompertz equation for the study of xylem cell development. Dendrochronologia 2003, 21, 33–39. [Google Scholar] [CrossRef]
  31. Li, X.X.; Liang, E.Y.; Gričar, J.; Prislan, P.; Rossi, S.; Čufar, K. Age dependence of xylogenesis and its climatic sensitivity in Smith fir on the south-eastern Tibetan Plateau. Tree Physiol. 2013, 33, 48–56. [Google Scholar] [CrossRef] [PubMed]
  32. Rathgeber, C.B.K.; Rossi, S.; Bontemps, J.-D. Cambial activity related to tree size in a mature silver-fir plantation. Ann. Bot. 2011, 108, 429–438. [Google Scholar] [CrossRef] [PubMed]
  33. Jyske, T.; Mäkinen, H.; Kalliokoski, T.; Nöjd, P. Intra-annual tracheid production of Norway spruce and Scots pine across a latitudinal gradient in Finland. Agric. For. Meteorol. 2014, 194, 241–254. [Google Scholar] [CrossRef]
  34. Thibeault-Martel, M.; Krause, C.; Morin, H.; Rossi, S. Cambial activity and intra-annual xylem formation in roots and stems of Abies balsamea and Picea mariana. Ann. Bot. 2008, 102, 667–674. [Google Scholar] [CrossRef] [PubMed]
  35. Deslauriers, A.; Morin, H.; Begin, Y. Cellular phenology of annual ring formation of Abies balsamea in the Quebec boreal forest (Canada). Can. J. For. Res. 2003, 33, 190–200. [Google Scholar] [CrossRef]
  36. Cuny, H.E.; Rathgeber, C.B.; Lebourgeois, F.; Fortin, M.; Fournier, M. Life strategies in intra-annual dynamics of wood formation: Example of three conifer species in a temperate forest in north-east France. Tree Physiol. 2012, 32, 612–625. [Google Scholar] [CrossRef] [PubMed]
  37. Jarvis, P.; Linder, S. Constraints to growth of boreal forests. Nature 2000, 405, 904–905. [Google Scholar] [CrossRef] [PubMed]
  38. Rossi, S.; Girard, M.-J.; Morin, H. Lengthening of the duration of xylogenesis engenders disproportionate increases in xylem production. Glob. Chang. Biol. 2014, 20, 2261–2271. [Google Scholar] [CrossRef] [PubMed]
  39. Devine, W.D.; Harrington, T.B. Aboveground growth interactions of paired conifer seedlings in close proximity. New For. 2011, 41, 163–178. [Google Scholar] [CrossRef]
  40. Prislan, P.; Gričar, J.; de Luis, M.; Smith, K.T.; Čufar, K. Phenological variation in xylem and phloem formation in Fagus sylvatica from two contrasting sites. Agric. For. Meteorol. 2013, 180, 142–151. [Google Scholar] [CrossRef]
  41. Dufour, B.; Morin, H. Climatic control of tracheid production of black spruce in dense mesic stands of eastern Canada. Tree Physiol. 2013, 33, 175–186. [Google Scholar] [CrossRef] [PubMed]
  42. Gruber, A.; Baumgartner, D.; Zimmermann, J.; Oberhuber, W. Temporal dynamic of wood formation in Pinus cembra along the alpine treeline ecotone and the effect of climate variables. Trees-Struct. Funct. 2009, 23, 623–635. [Google Scholar] [CrossRef]
  43. Dong, M.Y.; Jiang, Y.; Zhang, W.T.; Yang, Y.G.; Yang, H.C. Effect of alpine treeline conditions on the response of the stem radial variation of Picea meyeri Rebd. et Wils to environmental factors. Pol. J. Ecol. 2011, 59, 729–739. [Google Scholar]
  44. Kirdyanov, A.; Hughes, M.; Vaganov, E.; Schweingruber, F.; Silkin, P. The importance of early summer temperature and date of snow melt for tree growth in the Siberian Subarctic. Trees-Struct. Funct. 2003, 17, 61–69. [Google Scholar] [CrossRef]
  45. Alvarez-Uria, P.; Körner, C. Low temperature limits of root growth in deciduous and evergreen temperate tree species. Funct. Ecol. 2007, 21, 211–218. [Google Scholar] [CrossRef]
  46. Körner, C. Carbon limitation in trees. J. Ecol. 2003, 91, 4–17. [Google Scholar] [CrossRef]
  47. Schenker, G.; Lenz, A.; Körner, C.; Hoch, G. Physiological minimum temperatures for root growth in seven common European broad-leaved tree species. Tree Physiol. 2014, 34, 302–313. [Google Scholar] [CrossRef] [PubMed]
  48. Bergh, J.; Linder, S. Effects of soil warming during spring on photosynthetic recovery in boreal Norway spruce stands. Glob. Chang. Biol. 1999, 5, 245–253. [Google Scholar] [CrossRef]
  49. Leng, W.F.; He, H.S.; Liu, H.J. Response of larch species to climate changes. J. Plant Ecol. 2008, 1, 203–205. [Google Scholar] [CrossRef]
  50. Wang, Z.; Yang, B.; Deslauriers, A.; Bräuning, A. Intra-annual stem radial increment response of Qilian juniper to temperature and precipitation along an altitudinal gradient in northwestern China. Trees-Struct. Funct. 2015, 29, 25–34. [Google Scholar] [CrossRef]
  51. Dufour, B.; Morin, H. Tracheid production phenology of Picea mariana and its relationship with climatic fluctuations and bud development using multivariate analysis. Tree Physiol. 2010, 30, 853–865. [Google Scholar] [CrossRef] [PubMed]
  52. Duchesne, L.; Houle, D.; D’Orangeville, L. Influence of climate on seasonal patterns of stem increment of balsam fir in a boreal forest of Quebec, Canada. Agric. For. Meteorol. 2012, 162, 108–114. [Google Scholar] [CrossRef]
  53. Gričar, J.; Čufar, K.; Oven, P.; Schmitt, U. Differentiation of terminal latewood tracheids in silver fir trees during autumn. Ann. Bot. 2005, 95, 959–965. [Google Scholar] [CrossRef] [PubMed]
  54. Lupi, C.; Morin, H.; Deslauriers, A.; Rossi, S. Xylem phenology and wood production: Resolving the chicken-or-egg dilemma. Plant Cell Environ. 2010, 33, 1721–1730. [Google Scholar] [CrossRef] [PubMed]
  55. Rossi, S.; Morin, H.; Deslauriers, A. Causes and correlations in cambium phenology: Towards an integrated framework of xylogenesis. J. Exp. Bot. 2012, 63, 2117–2126. [Google Scholar] [CrossRef] [PubMed]

