Article

Aerial Seeding: An Effective Forest Restoration Method in Highly Degraded Forest Landscapes of Sub-Tropic Regions

1
College of Forestry, Jiangxi Agricultural University, Nanchang 330045, China
2
Earth and Environmental Science, University of British Columbia (Okanagan), 1177 Research Road, Kelowna, BC V1V 1V7, Canada
3
School of Forestry and Bio-Technology, Zhejiang A&F University, Linan 311300, China
*
Author to whom correspondence should be addressed.
Forests 2015, 6(6), 1748-1762; https://doi.org/10.3390/f6061748
Submission received: 2 March 2015 / Accepted: 19 May 2015 / Published: 25 May 2015

Abstract

:
Carbon stock is an important indicator of cumulative ecosystem productivity. Using this indicator, and based on field sampling data, this paper compared the long-term difference in carbon stocks between aerial seeding (AS) and natural regeneration (NR) forests of Pinus massoniana in sub-tropic forests, China, in order to assess the effectiveness of AS in a highly degraded forest landscape. The results showed that the carbon stocks of stems, branches, roots, and trees (including stems, branches, leaves, and roots) were 140%, 85%, 110%, and 110%, significantly higher (p < 0.05) in the NR forests than those in the AS forests at the ages of 11–20 years, respectively. In addition, the carbon stocks of understory, litter and soil were also 176%, 151%, and 77%, significantly higher (p < 0.05) in the NR forests than those in the AS forests at the same age range, respectively. However, with increasing age (i.e., >21 years), those differences became statistically insignificant (p > 0.05). The total carbon stocks of the two forest types also showed a similar pattern. Those results clearly demonstrate that AS was an effective mean for restoring carbon stocks in highly degraded areas, even though their early growth was lower than the NR forests, and thus can be applied in the regions where the areas with limited seed sources and road accessibility.

1. Introduction

Forest degradation attracts world attention, especially in the tropic and sub-tropic forest ecosystems mainly because the majority of greenhouse gas (GHG) emission associated with land cover and land use changes is from tropic and sub-tropic deforestation and land degradation [1,2,3,4,5]. Thus, seeking an innovative approach to restore degraded forest ecosystems becomes an imperative task. In practice, the aerial seeding was employed to the areas where road accessibility is limited, and the areas are too large to sow or where the seed bank is limited to natural regeneration. However, the effectiveness of this aerial seeding-based forests or restoration on ecosystem functions has been rarely examined [6], even though it is a common and traditional practice in the world.
Increasing forest cover and functions through restoration is an important measure to increase forest ecosystem carbon stock and carbon sequestration [7,8,9]. Natural forests, originated from seeds naturally, are dominant forest types in China, which are about 116 million ha, accounting for 70% of the country’s total forest area [10]. Natural regeneration may develop a more reasonable and stable structure [11,12] and is an easy way to restore vegetation of felled lands [13]. However, in large and remote areas where seeds or coppices are rather limited, natural regeneration and subsequent forest succession may take much longer [14,15]. To overcome this issue, aerial seeding is commonly applied to promote vegetation recovery and thus shorten the time required for ecosystem restoration. Aerial seeding has a long history (>50 years) in China, and has been accomplished for 136,400 ha in 2012 alone [16]. Aerial seeding has also been widely used around the world [17,18,19,20,21]. Pyke et al. [20] noted the aerial seeding was the only restoration option in the areas with complex terrains after a forest fire in the western United States, while Davies et al. [21] pointed out that aerial seeding had significantly accelerated forest vegetation recovery in USA.
Carbon stock is an important indicator for representing certain ecological functions [9,22]. The forest carbon accounts for about 86% of global vegetation carbon [23,24]. A small change of forest carbon stocks can have a great impact on global GHG emissions [9,25]. Therefore, it is critical to assess the effectiveness of vegetation restoration on carbon stock so that management strategies can be carefully implemented to maximize carbon sequestration capacity for mitigating the impacts of climate change, particularly in tropic and sub-tropic forests.
In this study, we addressed the following questions: (1) Are there any differences in carbon stocks between aerial seeding (AS) and natural regeneration (NR) forests of Pinus massoniana after 30 years of restoration? (2) Are there any structural differences among age ranges between these two forest types? and (3) What are management implications of those differences?

2. Methods

2.1. Study Area

The study area was located in the central and southern parts of Jiangxi Province, China, including Ji’an and Ganzhou cities (24°29′~27°57′ N and 113°46′~116°38′ E). The climate of this region is humid sub-tropic monsoon with four distinct seasons. The annual average temperature is between 16.2 °C–19.7 °C, while average annual precipitation is about 1635 mm. Landforms are mostly mountains and hills. The soil is mostly acidic and red, with soil thickness of 20–100 cm, humus of 3–20 cm and soil organic matter content of 1%–5%. The dominant vegetation types include coniferous forests (e.g., Pinus massoniana, Cunninghamia lanceolata and Pinus elliottii), evergreen broadleaf forests (e.g., Cinnamomum camphora, Schima superba and Castanopsis sclerophylla) and bamboo forests (e.g., Phyllostachys heterocycla). According to the 11th forest resource inventory data, the total area of Pinus massomiana in the study area is 1.24 million ha (accounting for 26% of the forest land area in the province), of which 1.18 million ha is from NR, while the rest is from plantations (including AS).

2.2. Description of Sample Plots

The aerial seeding events occurred during 1965–1997 in our study area, with a sowing density of 2.2–2.6 kg·ha−1. The seed sources were consistent over the study area. In this study, a 10-year age range was used to group the Pinus massoniana into four age ranges: 11–20 years, 21–30 years, 31–40 years and 41–50 years. To ensure comparability, all sampled plots have a similar slope, aspect, soil type, and origin (logging of natural forests) [26]. Each age range had three random replications for a total of 24 plots. The plot size was 28.28 m × 28.28 m (0.08 ha, Table 1). The distances between the sampled plots range from several kilometers to about fifty kilometers.
Table 1. The description of Pinus massoniana sample plots (DBH: diameter at breast height 1.3 m over bark; BA: basal area; N: number of trees; AS: aerial seeding; NR: natural regeneration; and values : means ± standard errors).
TypeAge Range (Years)Average Age (a)Average DBH (cm)Average Height (m)Average BA (m2·ha−1)Average Stand Density (N·ha−1)
AS11–2018 ± 0.35.4 ± 0.126.3 ± 0.885.2 ± 0.662267 ± 311.0
21–3024 ± 1.910.7 ± 1.1012.2 ± 0.8711.9 ± 0.331408 ± 283.0
31–4035 ± 1.213.4 ± 1.0012.3 ± 0.8717.9 ± 1.541329 ± 285.4
41–5041 ± 0.316.6 ± 0.3216.6 ± 2.1925.1 ± 4.121152 ± 168.8
NR11–2018 ± 0.79.0 ± 0.709.6 ± 0.9311.3 ± 1.411808 ± 227.1
21–3023 ± 0.911.7 ± 2.1610.9 ± 3.0815.9 ± 4.201575 ± 343.9
31–4036 ± 2.013.6 ± 0.7012.0 ± 1.0017.6 ± 2.101221 ± 145.8
41–5044 ± 1.216.5 ± 1.9516.1 ± 0.4620.52 ± 2.571054 ± 281.6

2.3. Tree Biomass

For each plot, DBH (the diameter at breast height; minimum ≥5 cm and below that was classified as understory) and the height of all trees were measured individually. To estimate above-ground forest biomass, we harvested 1–2 standard trees at each sample plot with a total of 25 standard trees. Following harvesting, the aboveground biomass components (stems, branches, and leaves) were separated and measured, while the underground part (root) were all excavated and weighted. Samples of each component were taken back to the laboratory for oven dry at 65 °C to obtain a consistent weight. The allometric regressions (Equation (1)) [27] were established through the relationship between dry weight of each component and DBH. Thus, total forest biomass for each plot for tree biomass is the sum of each component using the equation.
W = a × D B H b
where, W (Mg·ha−1) is biomass of each component, D B H (cm) is diameter at breast height, a and b are regression coefficients.

2.4. Understory and Forest Floor Litter

Understory biomass was determined at each sample plot using destructive sampling techniques, including herbs, shrubs, and trees of less than 5 cm DBH. The measured species include herbs (e.g., Dicranopteris dichotoma and Miscanthus floridulus), shrubs (e.g., Syzygium grijsii, Eurya japonica Thunb and Loropetalum chinense), and trees (e.g., Pinus massoniana, Schima superba, and Liquidambar formosana). Three 2 × 2 m subplots were set up for shrubs, while three 1 × 1 m subplots were for litter along a diagonal line inside the plots. The above- and below-ground biomass, litter, and humus were weighted in the field. The samples were then taken back to the laboratory and oven dried at 65 °C to obtain a consistent weight for calculating dry weights for each plot.

2.5. Soil Sampling

A soil profile pit of a 100 cm depth was dug in each plot. The soil profile was divided into five layers, including 0–10 cm, 10–20 cm, 20–30 cm, 30–50 cm and 50–100 cm. The samples of each layer were collected by a cutting ring (volume of 100 cm3) for soil bulk density, while other samples of each layer were transported to the laboratory and then air-dried for determination of carbon concentration using the Walkley-Black method [28].

2.6. Carbon Stock Calculations

The biomass of each component was multiplied by the corresponding carbon concentration to calculate carbon stocks. The carbon concentration of each biomass component was obtained from this study. The total vegetation carbon stocks is the sum of different biomass components.
The soil organic carbon (SOC) stocks at different depths were calculated by soil organic carbon concentration, soil bulk density, soil depth, and proportion of gravels. The total SOC (Mg·ha−1) was calculated as follows (Equation (2)) [24,29,30]:
S O C t = i = 1 5 C i × D i × E i × ( 1 G i ) / 10
where, C i (g·kg−1) is the soil organic carbon concentration of the ith layer, D i (g·cm−3) is the soil bulk density of the ith layer, E i (cm) is the soil depth of the ith layer, and G i (%) is proportion of gravels (diameter > 2 mm) in the soil volume of the ith layer.

2.7. Statistical Analysis

Statistical analyses were conducted using SPSS 17.0 software, One-way analyses of variance (ANOVA) were used to test the differences among the carbon stock of each age range between the two forest types (AS vs. NR). One-way ANOVA were also performed to determine the significant differences among the carbon stock of the same type between the different age ranges, with least significant differences (LSD) calculated when treatments were significantly different.

3. Results

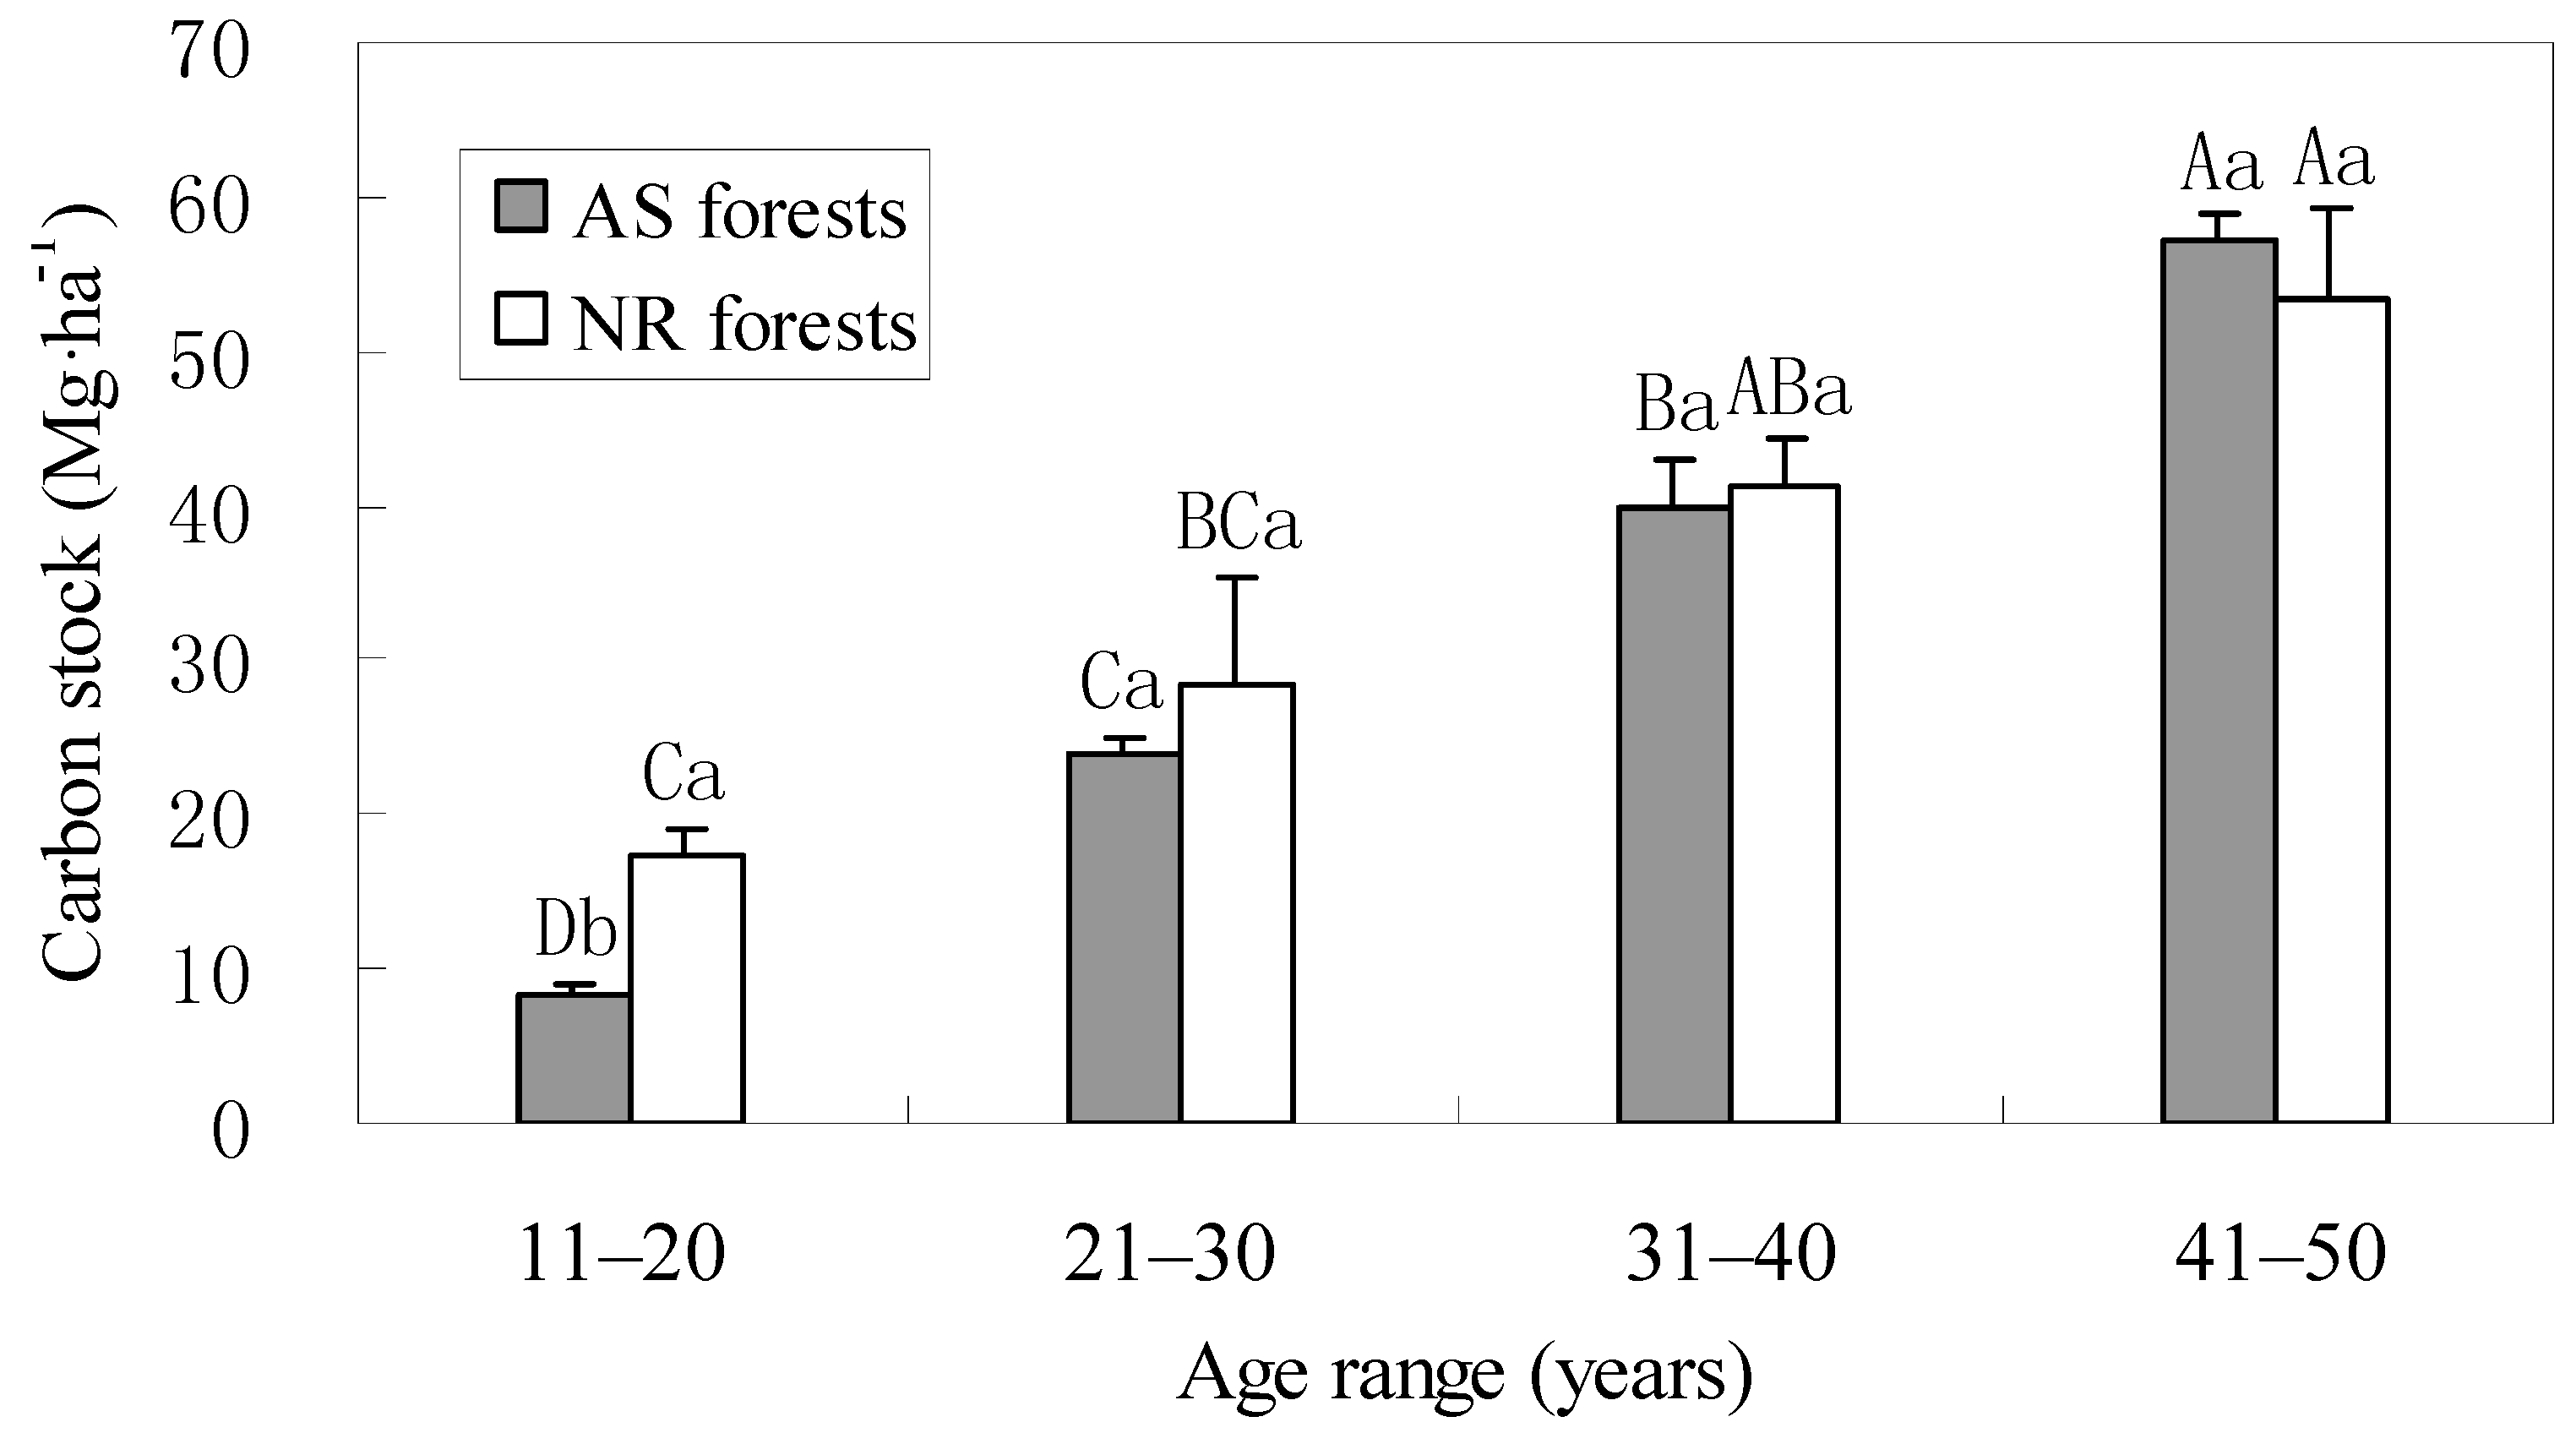
3.1. Carbon Stocks in Trees

Carbon stocks of different biomass components in two forest types increased significantly with the stand age except leaf in natural regeneration (NR) forests (Table 2). For example, the stem stock in aerial seeding (AS) forests at 41–50 years were 800%, 147% and 45%, significantly higher (p < 0.05) than those at the other age ranges. It is not surprising that the stem carbon was the largest component among all others as it accounts for about 60% of the total carbon followed by branches (~17%), roots (~13%), and leaf (~8%; Table 2).
The stem, branch and root carbon stocks at 11–20 years were 140%, 85%, and 110%, significantly higher (p < 0.05) in the NR forests than those in the AS forests, respectively. While there were not significantly different (p > 0.05) in other older age ranges (>21 years). In addition, they were not significantly different (p > 0.05) in leaf carbon stocks at all age ranges between the two forest types. Furthermore, the averaged carbon stocks over different age ranges were not significantly different either (p > 0.05) of all components between two forest types (Table 2).
The tree carbon stocks in the AS forests at 11–20 years was significantly lower than those in the NR forests (p < 0.05), while the differences at the other age ranges were not significant (p > 0.05) (Figure 1). The tree carbon stocks increment between the adjacent age ranges of the AS forests were 15.9, 15.0, 18.0 Mg·ha−1, respectively, while the corresponding values for the NR forests were 11.4, 13.0, 12.2 Mg·ha−1, respectively. With the increasing of the stand age, the differences in tree carbon stocks between the two forest types were decreased gradually and then became insignificant.
Table 2. The carbon stocks (Mg·ha−1) and distribution (%) of each component between aerial seeding (AS) and natural regeneration (NR) of Pinus massoniana; numbers in brackets are the percentage of various components of the same age range; different uppercase letters indicate significant differences between different age ranges of the same biomass component at p < 0.05; and different lowercase letters indicate significant differences between different forest types of the same component and age range (p < 0.05).
Age RangeStemBranchLeafRoot
ASNRASNRASNRASNR
11–203.9 ± 0.34Aa9.4 ± 1.04Ab2.1 ± 0.27Cb3.9 ± 0.50Ca1.3 ± 0.97Ca2.0 ± 0.29Aa0.9 ± 0.15Db1.9 ± 0.23Ca
(48.0)(54.8)(25.4)(22.2)(15.5)(11.7)(11.1)(11.1)
21–3014.2 ± 0.79Bb17.8 ± 5.08BCa4.7 ± 0.11Ba5.1 ± 0.80BCa2.1 ± 0.12BCa2.4 ± 0.22Aa3.1 ± 0.10Ca3.3 ± 0.93BCa
(58.9)(62.2)(19.7)(18.0)(8.7)(8.4)(12.8)(11.4)
31–4024.2 ± 2.14Cb26.5 ± 2.03Ca6.8 ± 0.94Ba6.8 ± 0.68ABa2.7 ± 0.43ABa2.6 ± 0.35Aa5.3 ± 0.46Ba5.3 ± 0.67ABa
(62.0)(64.3)(17.4)(16.5)(7.0)(6.3)(13.6)(12.9)
41–5035.1 ± 2.26Db35.4 ± 4.05Ca10.1 ± 0.97Aa8.3 ± 1.05Aa4.1 ± 0.69Aa3.0 ± 0.48Aa7.8 ± 0.28Aa6.8 ± 0.88Aa
(61.51)(66.2)(17.6)(15.6)(7.2)(5.6)(13.7)(12.7)
Mean19.4 ± 3.55a22.3 ± 3.05a5.9 ± 0.93a6.0 ± 0.58a2.6 ± 0.36a2.5 ± 0.18a4.3 ± 0.78a4.3 ± 0.61a
(60.3)(63.4)(18.4)(17.2)(8.0)(7.1)(13.3)(12.3)
Figure 1. The tree carbon stocks (including stem, branch, leaf and root stocks) at different age ranges in the aerial seeding (AS) and natural regeneration (NR) of Pinus massoniana forests; different uppercase letters indicate significant differences between different age ranges of the same forest type at p < 0.05, and different lowercase letters indicate significant differences between different forest types of the same age range (p < 0.05).
Forests 06 01748 g001

3.2. Carbon Stocks in the Understory and Litter

The understory and litter carbon stocks were 176% and 151%, significantly higher (p < 0.05) at the age range of 10–20 years in the NR forests than those in the AS forests (Table 3). The similar results were observed in the understory and litter carbon stocks in the other age ranges between two forest types (Table 3).
Table 3. Comparison of the understory vegetation and litter layer carbon stocks (Mg·ha−1); different uppercase letters indicate significant differences between different age ranges of the same forest type at p < 0.05, and different lowercase letters indicate significant differences between two forest types of the same age range (p < 0.05).
TypeAge RangeMean
11–2021–3031–4041–50
UnderstoryAS3.1 ± 0.33Aa4.4 ± 1.00Aa3.1 ± 1.13Aa4.0 ± 1.07Aa3.7 ± 0.52a
NR8.6 ± 1.85Ab6.8 ± 2.76Aa5.0 ± 1.70Aa5.8 ± 1.98Aa6.6 ± 1.11b
LitterAS0.4 ± 0.09Aa0.6 ± 0.13Aa0.6 ± 0.19Aa0.5 ± 0.05Aa0.5 ± 0.10a
NR0.9 ± 0.14Ab1.1 ± 0.17Aa0.9 ± 0.09Aa1.0 ± 0.30Aa1.0 ± 0.08b

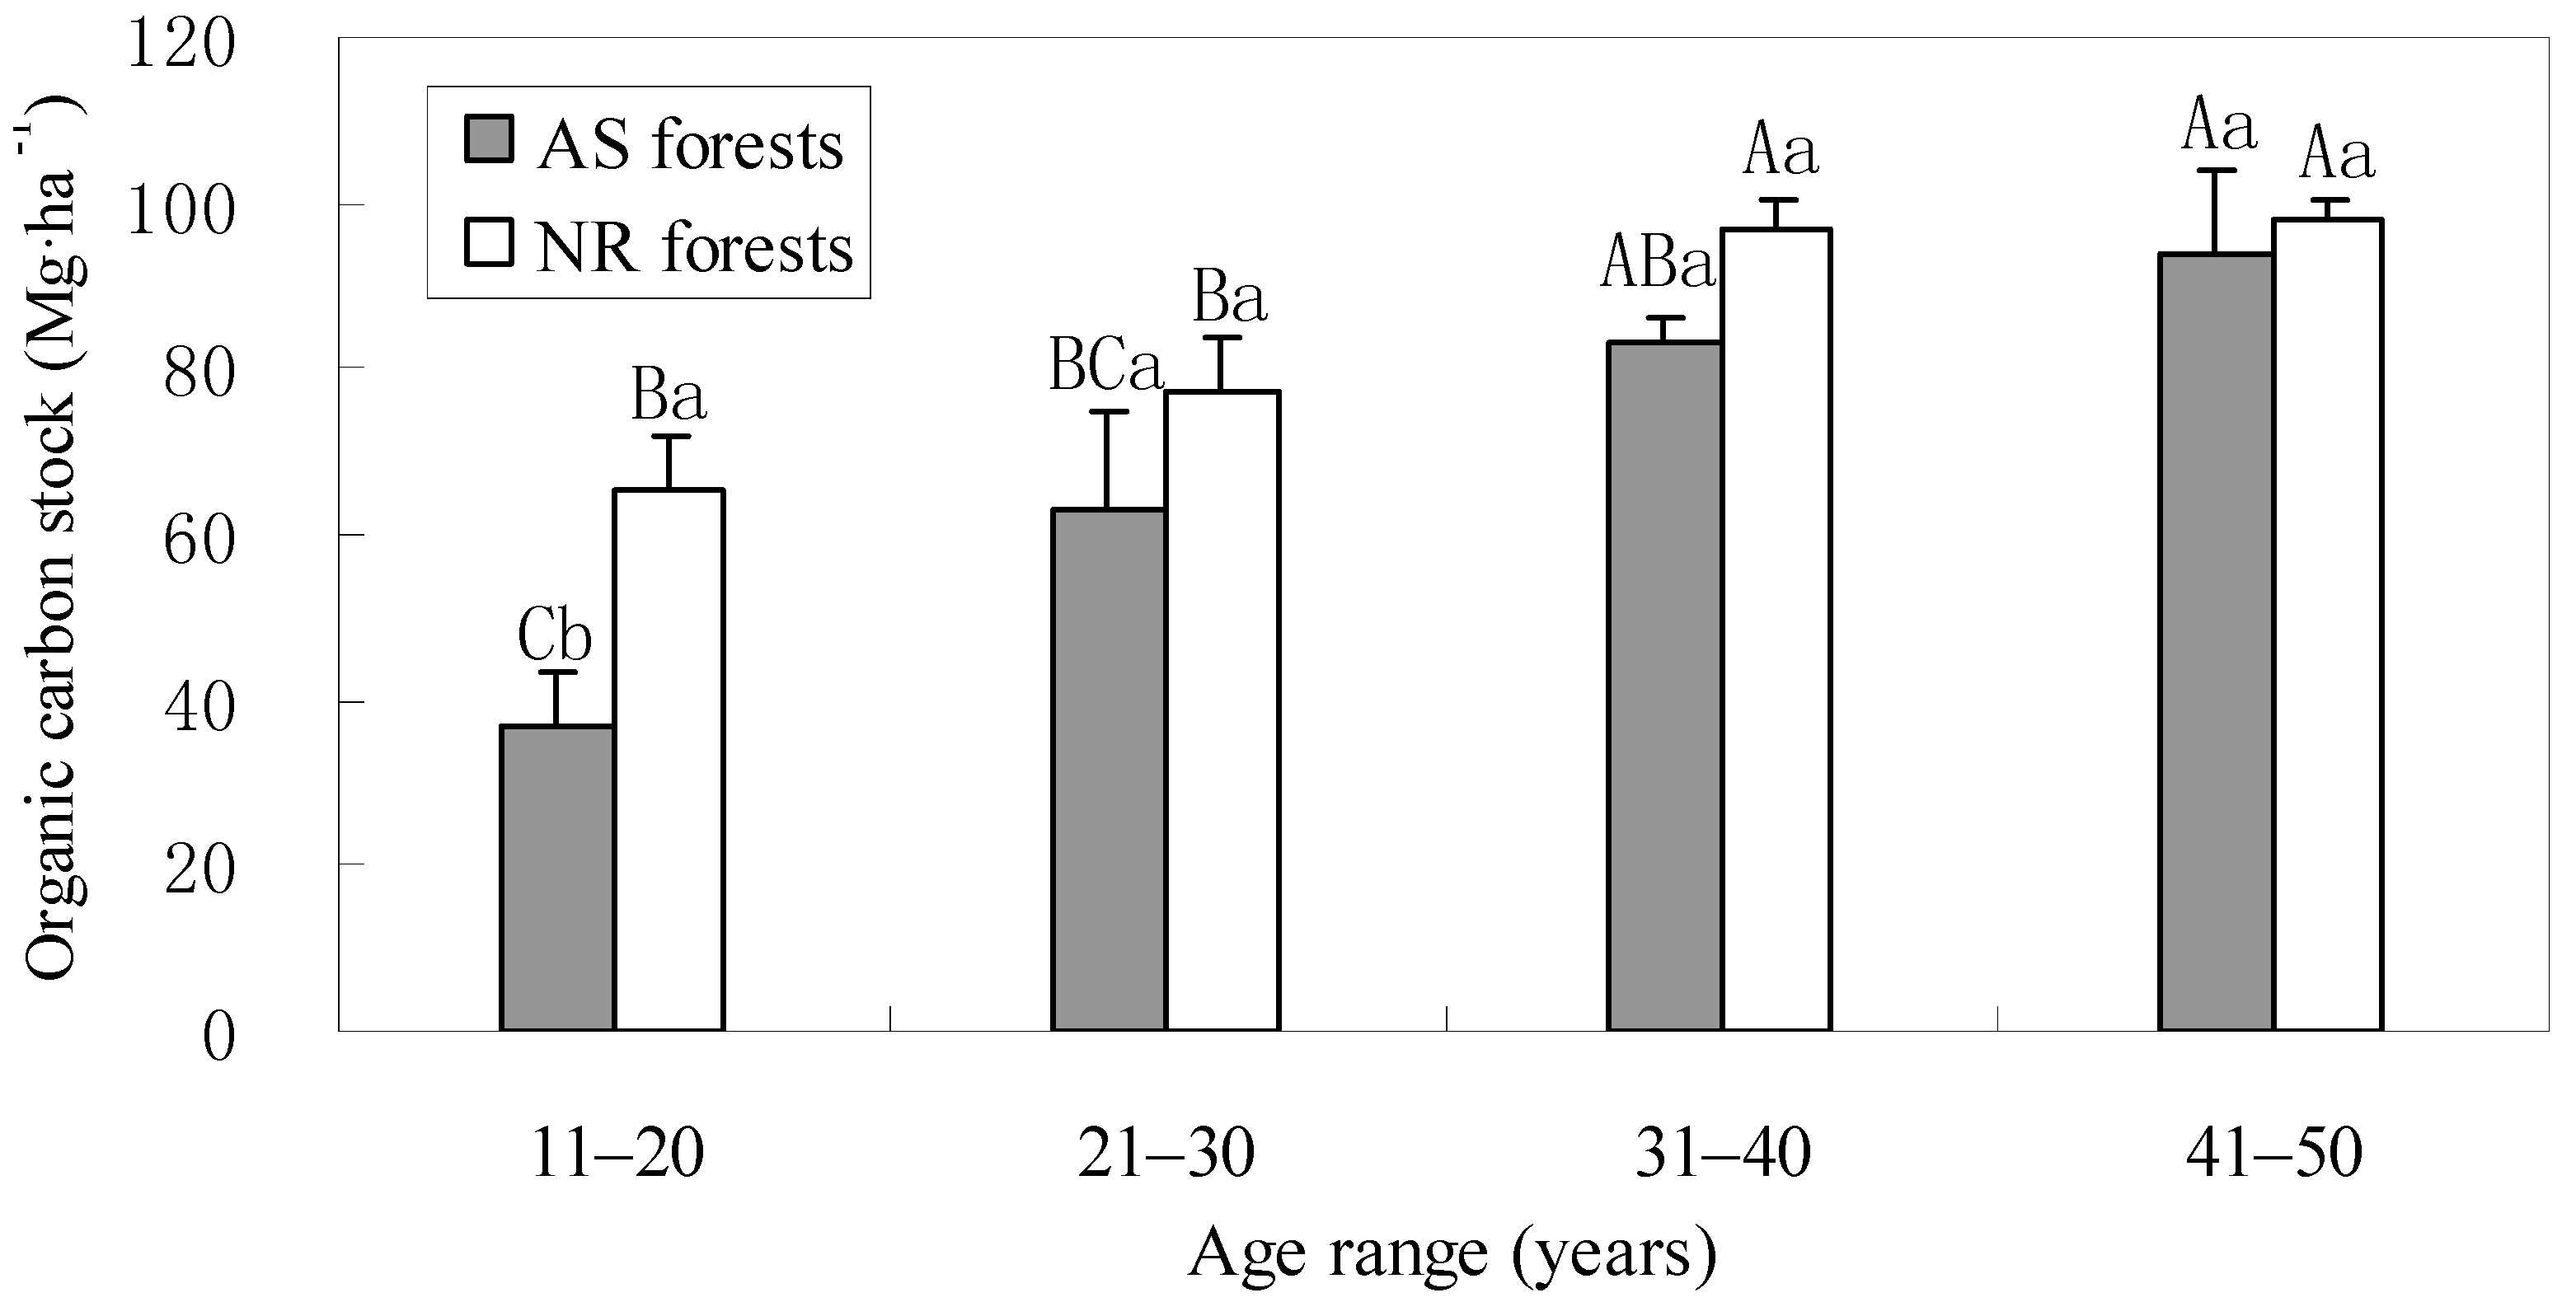
3.3. Carbon Stocks in Soil

The soil organic carbon (SOC) stocks increased significantly (p < 0.05) with increasing of stand age (Figure 2). For example, for the AS forests, the SOC at 41–50 years were 153% and 49%, significantly higher (p < 0.05) than those at 11–20 years and 21–30 years, respectively, while the SOC at 31–,40 years was 124% significantly higher (p < 0.05) than those of 11–20 years. In the NR forests, the SOC of the 41–50 years were 50% and 27%, significantly higher (p < 0.05) than those at 11–20 years and 21–30 years, respectively. Furthermore, the SOC at 31–40 years were 48% and 25%, significantly higher (p < 0.05) than those of 11–20 years and 21–30 years, respectively. In addition, the SOC of the NR forests at 11–20 years was 77%, significantly higher (p < 0.05) than those in the AS forests (Figure 2). There were no significant differences (p > 0.05) between the AS and NR forests in the other age ranges (Figure 2).
Figure 2. Comparison of soil organic carbon (SOC) stocks; different uppercase letters indicate significant differences between different age ranges of the same forest type at p < 0.05, and different lowercase letters indicate significant differences between different forest types of the same age range (p < 0.05).
Forests 06 01748 g002

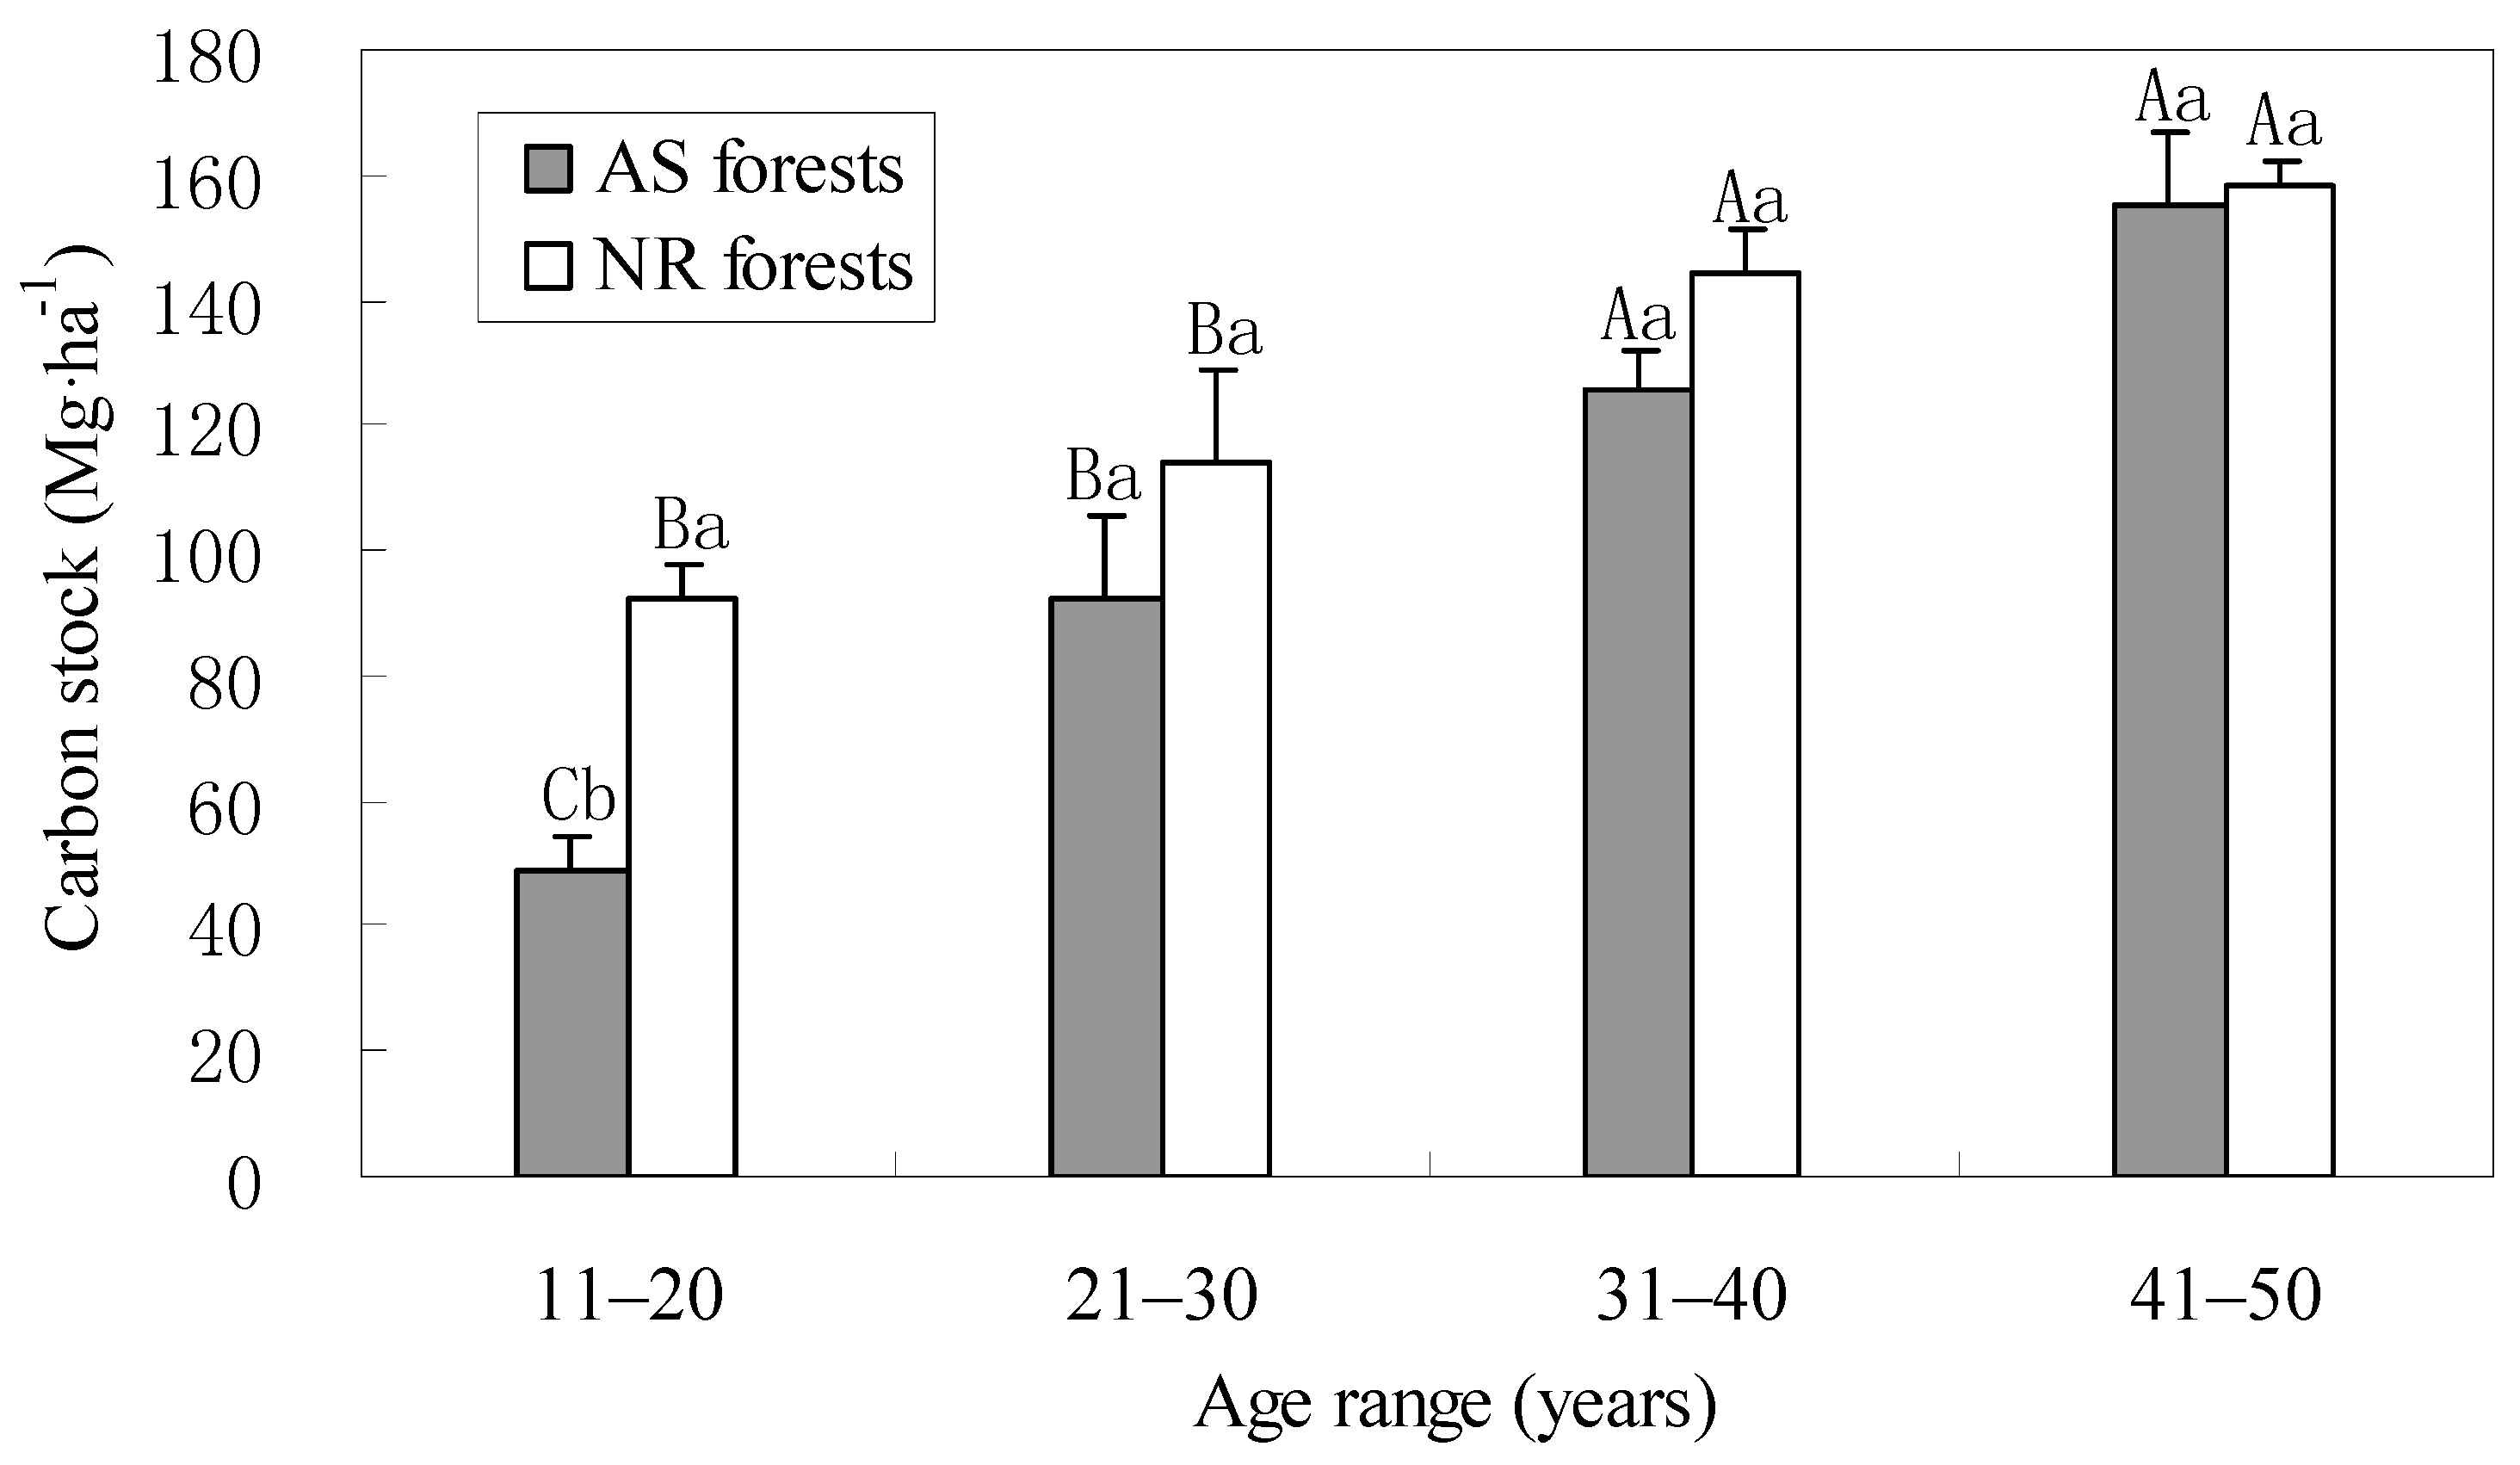
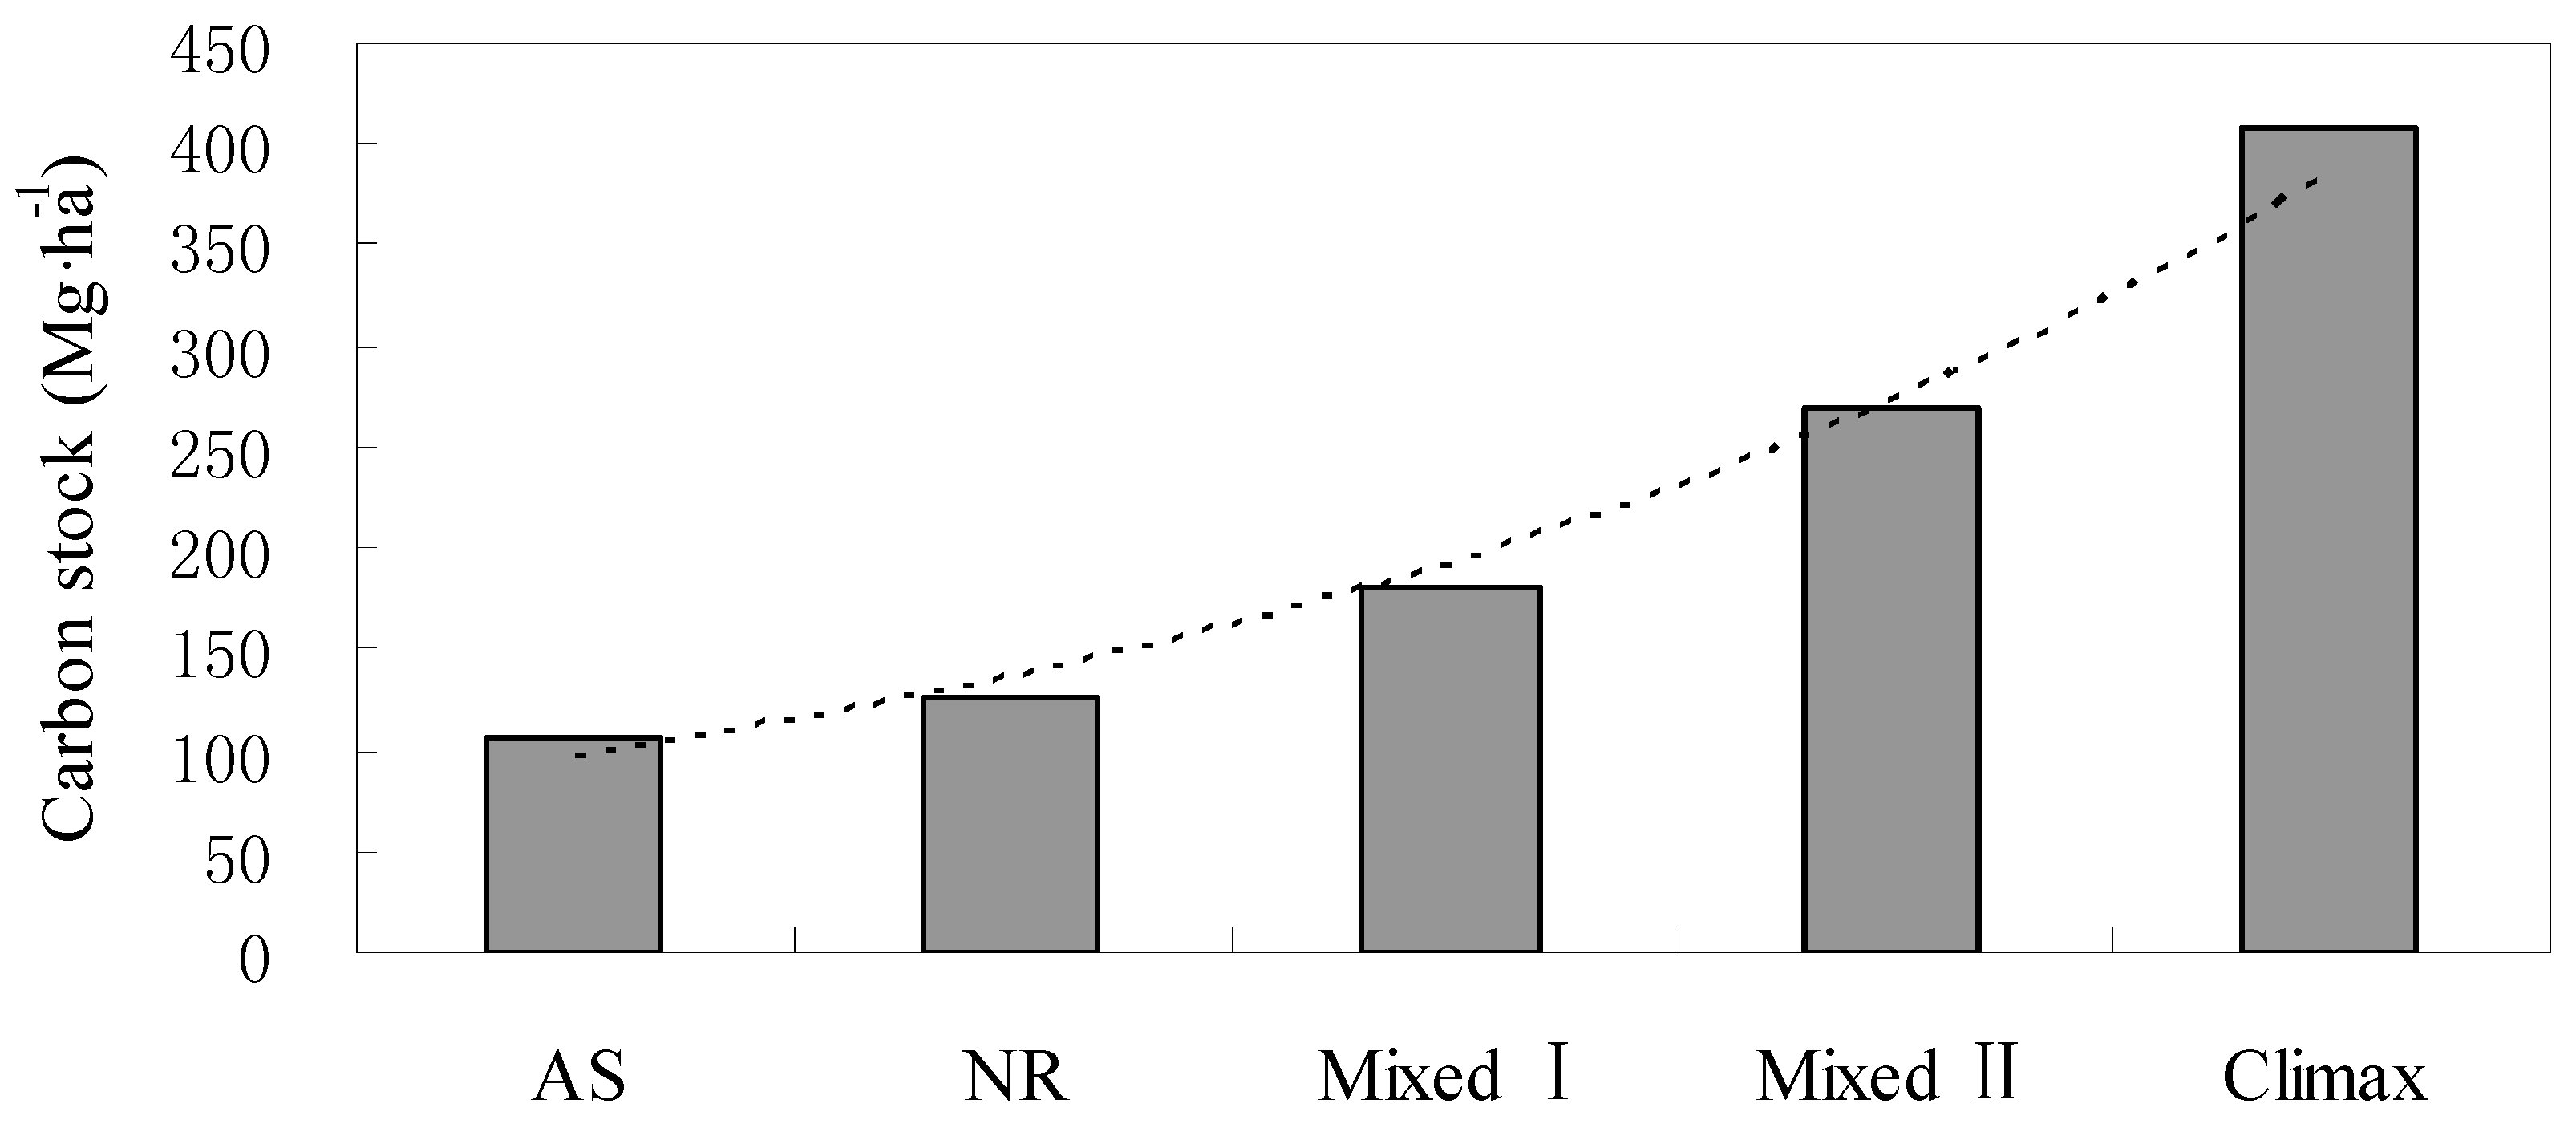
3.4. Total Carbon Stocks

The total carbon stocks (including tree, understory, litter and soil stocks) in both forest types exhibited an overall increasing trend with stand age (Figure 3). More specifically, the total carbon stocks in the AS forests at 41–50 years were 219% and 69%, significantly higher (p < 0.05) than those at 11–20 and 21–30 years, while the total carbon stocks at the age range of 31–40 years were 158% and 36%, significantly higher (p < 0.05) than those of 11–20 years and 21–30 years, respectively. In the NR forests, the total carbon stocks at the age ranges of 31–40 and 41–50 years were 56% and 72%, significantly higher (p < 0.05) than those at 11–20 years, and 26% and 39%, significantly higher (p < 0.05) than those at 21–30 years. Like the carbon stocks in soils, the difference in total carbon stocks between two forest types were not significant (p > 0.05) for all age ranges except 11–20 years.
Figure 3. Comparison of total carbon stocks (including tree, understory, litter and soil stocks); different uppercase letters indicate significant differences between different age ranges of the same forest type at p < 0.05, while different lowercase letters indicate significant differences between different forest types of the same age range (p < 0.05).
Forests 06 01748 g003

4. Discussion

The main objective of this study was to assess carbon stocks of the AS method in restoring highly degraded sub-tropic forest landscapes, and our data over the long-term (30 years) demonstrated that AS was a successful strategy in establishing forests and gaining carbon stocks similar to the sites with the NR forests. In our study, the average total carbon stocks of different age ranges in the AS forests (Pinus massoniana) was 105 Mg·ha−1, which was comparable to the provincial average (116 Mg·ha−1) [31] and slightly lower than the NR forests (127 Mg·ha−1, in this study). Our results are generally consistent in the carbon stocks between natural and pure pine plantation forests from Chen et al. [32]. Therefore, for forest restoration where seeds are limited, AS would be a viable option for consideration in terms of carbon stock.
However, we did observe some differences between the two restoration methods at the younger forests (11–20 years). For example, the carbon stocks of major biomass components (e.g., stems, branches, and roots) were significantly lower at 11–20 years in the AS forests than those in the NR forests. The reason for lower initial growth in the AS forests may be that their stand densities at the younger age range (11–20 years) were comparatively higher, and consequently led to more severe competition and slow growth because Pinus massoniana is a shade-intolerant species [33,34]. However, with the stand age increasing, the differences in carbon stocks between the two forest types were diminishing (p > 0.05). This may be due to faster growth of the AS forests as a result of self-thinning and further improved growing conditions. Pan et al. [35] also indicated that after self-thinning, the biomass in tree layer of Pinus massoniana increased due to accelerated individual tree growth. In addition, the species and ages in the AS forests were relatively homogeneous [6], which may promote greater growth as stands grow older. Lu et al. [36] and Liu [37] also found that forest growth in plantation forests were faster as compared with the natural forests with mixed age ranges (also [38]). Thus, it is understandable that with forest age increasing, carbon stocks of the AS forests approached to a comparable level as the NR forests.
The carbon stocks of the understory and litter in the two studied forest types had no significant difference among all age ranges, but both carbon stocks at the age range of 11–20 years were significant higher in the NR forests than those in the AS forests. The average carbon stock also showed the similar results, which is also consistent with the results from Zhang et al. [39]. The significant lower carbon stock at the younger age range (11–20 years) in the AS forests may be due to their higher tree densities. The higher densities can cause suppressed growth of understory vegetation as a result of aggressively competing for natural resources, such as nutrients, water and light [40]. Accordingly, the significantly lower carbon stocks in trees and understory vegetation in the AS forests at 11–20 years are the key reason for significantly lower litter carbon stocks at this age range, as compared to those in the NR forests. In spite of low carbon stocks in the forest floor litter, it plays a critical role in carbon cycling as it influences nutrients and provides soil carbon sources through its decomposition process [41,42].
The soil organic carbon (SOC) of two forest types increased with the stand age, although there were some significant differences between different age ranges within the same forest type. However, there was no significant difference in SOC between 31–40 years and 41–50 years in both forest types (Figure 2). This result suggests that the soil carbon accumulation was rapid during the early growth periods (11–30 years) and then approached to a stable stage at older ages, in our case, around 31–50 years. Our results also indicated that the SOC between two forest types were not statistically significant for all age ranges except 11–20 years, which demonstrates that either forest restoration type would be suitable in terms of maintaining soil carbon stocks.
This study has significant practical implications. First, there were limited studies in the literature on the applications of AS and their long-term effects on carbon stock. Our result demonstrates that aerial seeding reforestation using Pinus massoniana for the regions where seed sources are limited for natural regeneration is an effective restoration technique, which is consistent with the conclusion from Bassett et al. in Australia [43]. Pyke and Davies et al. [20,21] also indicated that aerial seeding can accelerate the recovery of vegetation in the United States. Thus, we expect that our result can be effectively applied in sub-tropic regions in China or other countries. Second, our study clearly indicates usefulness of long-term data. In this study, we have found the significant differences in carbon stocks of various biomass components as well as the total carbon stocks at 11–20 years between the two studied forest types, but their differences were not significant at all other age ranges. This suggests that long-term data can help understanding dynamics of carbon stocks [5]. Finally, our carbon stock data indicated that the AS and NR forests in our study region were at a very early stage towards the local climax (Figure 4) [44,45]. This highlights that our future management strategies should consider inclusion of broadleaf species for mixed-wood forests in order to increase carbon sequestration capacity, and potentially promote higher carbon stocks (also [46,47]).
Figure 4. Carbon stocks of various successional forests in the study sub-tropic region. Mixed I denotes the mixed forests Pinus massoniana dominant, while Mixed II is for the mixed forests broadleaf dominant [44,45].
Forests 06 01748 g004
There are a few uncertainties from this study. The carbon concentrations of various biomass components are from our own measurement in this study, and they range from 0.45 to 0.50. Ma et al. [48] showed that the average carbon concentrations of most conifers in the sub-tropic region were higher than or equal to 0.5, while most researchers often used 0.5 as the average carbon concentration of all types forests [49,50]. Therefore, the carbon stocks used in our study were slightly lower than the data used by other studies. In addition, the contributions of coarse woody debris (CWD) to forest carbon stocks were not taken into account in our study. Although Fedrigo et al. [51] indicated the carbon stocks of CWD was larger than that from litter in rainforests, Zhang et al. [52] found that the carbon contributions from CWD were rather low in Pinus massoniana forests in sub-tropic regions. Thus, this error (not considering CWD) may be acceptable.

5. Conclusions

Through comparative and long-term study on the carbon stocks between the AS and NR forests of Pinus massoniana in the sub-tropic region of China, we have made the following key conclusions. We found that the differences in carbon stocks of major biomass components at all age ranges except 11–20 years between the two studied forest restoration types were not significant, which highlights that the aerial seeding restoration method is an effective approach for promoting restoration of carbon stocks for the areas where seeds are limited for natural regeneration. There is an important need to consider inclusion of a mixed species management strategy for promoting higher carbon sequestration capacity in future restoration projects. Finally, our study also reveals usefulness of long-term datasets/observations in addressing forest restoration issues.

Acknowledgments

This study was financially supported by the National Natural Science Foundation of China (Grant No. 31,160,159 and 31,360,181) and Strategic Priority Research Program of the Chinese Academy of Sciences (Grant No. XDA05050205) and Gan-Po 555 Talent Project Funding of Jiangxi Province. We also thank the two anonymous reviewers’ detailed and constructive suggestions and comments for improving this manuscript.

Author Contributions

The authors contributed equally to investigating, collecting data and completing the project. Xin Xiao and Xunzhi Ouyang were responsible for the research design and wrote early drafts of the manuscript with contributions from Xiaohua Wei and Qinglin Li through the editorial process.

Conflicts of Interest

The authors declare no conflict of interest.

References

  1. Li, W.H. Degradation and restoration of forest ecosystems in China. For. Ecol. Manag. 2004, 201, 33–41. [Google Scholar] [CrossRef]
  2. Corbera, E.; Estrada, M.; Brown, K. Reducing greenhouse gas emissions from deforestation and forest degradation in developing countries: Revisiting the assumptions. Clim. Chang. 2010, 100, 355–388. [Google Scholar] [CrossRef]
  3. Dulal, H.B.; Brodnig, G.; Shah, K.U. Capital assets and institutional constraints to implementation of greenhouse gas mitigation options in agriculture. Mitig. Adapt. Strateg. Glob. Chang. 2011, 16, 1–23. [Google Scholar] [CrossRef]
  4. Upadhyay, T.P.; Sankhayan, P.L.; Solberg, B. A review of carbon sequestration dynamics in the Himalayan region as a function of land-use change and forest/soil degradation with special reference to Nepal Agriculture. Ecosyst. Environ. 2005, 105, 449–465. [Google Scholar] [CrossRef]
  5. Guo, L.B.; Gifford, R.M. Soil carbon stocks and land use change: A meta analysis. Glob. Chang. Boil. 2002, 8, 345–360. [Google Scholar] [CrossRef]
  6. Li, G.L.; Liu, Y.; Guo, B.; Xu, Y.; Zhang, K.D.; Zhao, S.R. Advances in the research of the aerial-seeding forest in China. World For. Res. 2006, 19, 45–48. (In Chinese) [Google Scholar]
  7. Liu, J.; Li, S.; Ouyang, Z.; Tam, C.; Chen, X. Ecological and socioeconomic effects of China’s policies for ecosystem services. Proc. Natl. Acad. Sci. USA 2008, 105, 9477–9482. [Google Scholar] [CrossRef] [PubMed]
  8. Jiang, Z.H. Developing Low-carbon Forestry for Low-carbon Economy. World For. Res. 2010, 23, 1–6. (In Chinese) [Google Scholar]
  9. Dixon, R.K.; Brown, S.; Houghton, R.A.; Trexier, M.C.; Wisniewski, J. Carbon pools and flux of global forest ecosystem. Science 1994, 263, 185–190. [Google Scholar] [CrossRef] [PubMed]
  10. The National Forestry Development State Foresty Administration Office. China Forestry Development Division; China Forestry Publishing House: Beijing, China, 2011; pp. 62–92. (In Chinese) [Google Scholar]
  11. Zhai, M.P. Concept for vegetation rehabilitation and construction in the North-west Region of China. Sci. Soil Water Conserv. 2003, 1, 60–63. (In Chinese) [Google Scholar]
  12. Tripathi, K.P.; Singh, B. Species diversity and vegetation structure across various strata in natural and plantation forests in Katerniaghat Wildlife Sanctuary, North India. Trop. Ecol. 2009, 50, 191–200. [Google Scholar]
  13. Shono, K.; Cadaweng, E.A.; Durst, P.B. Application of assisted natural regeneration to restore degraded tropical forestlands. Restor. Ecol. 2007, 15, 620–626. [Google Scholar] [CrossRef]
  14. Aide, T.M.; Zimmerman, J.K.; Herrera, L.; Rosario, M.; Serrano, M. Forest recovery in abandoned tropical pastures in Puerto Rico. For. Ecol. Manag. 1995, 77, 77–86. [Google Scholar] [CrossRef]
  15. Orians, G.H.; Pfeiffer, E.W. Ecological effects of the war in Vietnam. Science 1970, 168, 544–554. [Google Scholar] [CrossRef] [PubMed]
  16. The National Forestry Bureau. China Forestry Development Report 2013; China Forestry Publishing House: Beijing, China, 2013. (In Chinese) [Google Scholar]
  17. Beyers, J.L. Postfire Seeding for Erosion Control: Effectiveness and impacts on native plant communities. Conserv. Biol. 2004, 18, 947–956. [Google Scholar] [CrossRef]
  18. Groen, A.H.; Woods, S.W. Effectiveness of aerial seeding and straw mulch for reducing post-wildfire erosion, north-western Montana, USA. Int. J. Wildland Fire 2008, 17, 559–571. [Google Scholar] [CrossRef]
  19. Greipsson, S.; El-Mayas, H. Large-scale reclamation of barren lands in Iceland by aerial seeding. Land Degrad. Dev. 1999, 10, 185–193. [Google Scholar] [CrossRef]
  20. Pyke, D.A.; Wirth, T.A.; Beyers, J.L. Does seeding after wildfires in rangelands reduce erosion or invasive species? Restor. Ecol. 2013, 21, 415–421. [Google Scholar] [CrossRef]
  21. Davies, K.W.; Bates, J.D.; Madsen, M.D.; Nafus, A.M. Restoration of mountain big sagebrush steppe following prescribed burning to control western Juniper. Environ. Manag. 2014, 53, 1015–1022. [Google Scholar] [CrossRef]
  22. Zhang, Q.; Wang, C. Carbon density and distribution of six Chinese temperate forests. Sci. China Life Sci. 2010, 53, 831–840. [Google Scholar] [CrossRef] [PubMed]
  23. Woodwell, G.M.; Whittaker, R.H.; Reiners, W.A.; Likens, G.E.; Delwiche, C.C.; Botkin, D.B. The biota and the world carbon budget. Science 1978, 199, 141–146. [Google Scholar] [CrossRef] [PubMed]
  24. Post, W.M.; Emanuel, W.R.; Zinke, P.J.; Stangenberger, A.G. Soil pools and world life zone. Nature 1982, 298, 156–159. [Google Scholar] [CrossRef]
  25. Cao, M.; Ian Woodward, F. Dynamic responses of terrestrial ecosystem carbon cycling to global climate change. Nature 1998, 393, 249–252. [Google Scholar] [CrossRef]
  26. Navarro-Cerrillo, R.M.; del Campo, A.D.; Ceacero, C.J.; Quero, J.L.; de Mena, J.H. On the importance of topography, site quality, stock quality and planting date in a semiarid plantation: Feasibility of using low-density LiDAR. Ecol. Eng. 2014, 67, 25–38. [Google Scholar] [CrossRef]
  27. Muukkonen, P. Generalized allometric volume and biomass equations for some tree species in Europe. Eur. J. For. Res. 2007, 126, 157–166. [Google Scholar] [CrossRef]
  28. Pearson, T.; Walker, S.M.; Brown, S. Sourcebook for Land Use, Land-Use Change and Forestry Projects; BioCarbon Fund, Winrock International: Washington, DC, USA, 2005; p. 64. [Google Scholar]
  29. Rodriguez-Murillo, J.C. Organic carbon content under different types of land use and soil in peninsular Spain. Biol. Fertil. Soils 2001, 33, 53–61. [Google Scholar] [CrossRef]
  30. Batjes, N.H. Total carbon and nitrogen in the soils of the world. Eur. J. Soil Sci. 1996, 47, 151–163. [Google Scholar] [CrossRef]
  31. Wang, B.; Wei, W.J. Carbon storage and density of forests in Jiangxi province. Jiangxi Sci. 2007, 25, 681–687. (In Chinese) [Google Scholar]
  32. Chen, G.S.; Yang, Y.S.; Xie, J.S.; Guo, J.F.; Gao, R.; Qian, W. Conversion of a natural broad-leafed evergreen forest into pure plantation forests in a subtropical area: Effects on carbon storage. Ann. For. Sci. 2005, 62, 659–668. [Google Scholar] [CrossRef]
  33. Forrester, D.I.; Kohnle, U.; Albrecht, A.T.; Bauhus, J. Complementarity in mixed-species stands of Abies alba and Picea abies varies with climate, site quality and stand density. For. Ecol. Manag. 2013, 304, 233–242. [Google Scholar] [CrossRef]
  34. Chen, Z.X.; He, Y.J.; Bai, F.M.; Zhang, J.H.; Li, Z.H. Effects of stand density on the biomass and productivity of Pinus massoniana air sowing stands. J. Cent. South For. Univ. 2001, 21, 44–47. (In Chinese) [Google Scholar]
  35. Pan, P.; Lyu, D.; Ouyang, X.Z.; Wang, X.T. A study on biomass and carbon storage of natural Pinus massoniana forest at different stand growing stages in central Jiangxi Province. Acta Agric. Univ. Jiangxiensis 2014, 36, 131–136. (In Chinese) [Google Scholar]
  36. Lu, Q.; Zhao, T.S.; Luo, T.X.; Jin, L.Y.; Yin, S.J. Comparative study on biodiversity and stand growth regulation in Pinus taiwanensis from different origin. For. Res. 1996, 9, 273–277. (In Chinese) [Google Scholar]
  37. Liu, C.H. Community characteristics and growth of natural forest and plantation of Cyclobalanopsis chungii. J. Zhejiang For. Coll. 2005, 22, 56–60. (In Chinese) [Google Scholar]
  38. Jordan, C.F.; Farnworth, E.G. Natural vs. plantation forests: A case study of land reclamation strategies for the humid tropics. Environ. Manag. 1982, 6, 485–492. [Google Scholar] [CrossRef]
  39. Zhang, S.W.; Zhao, Y.H.; Hou, M.M.; Xi, L. Comparative study for undergrowth vegetation biomass of Eucalyptus Plantations and natural forest. Resour. Dev. Mark. 2008, 24, 385–387. (In Chinese) [Google Scholar]
  40. Riegel, G.M.; Miller, R.F.; Krueger, W.C. The effects of aboveground and belowground competition on understory speciescomposition in a Pinus ponderosa forest. For. Sci. 1995, 41, 864–889. [Google Scholar]
  41. Melillo, J.M.; Aber, J.D.; Linkins, A.E.; Ricca, A.; Fry, B.; Nadelhoffer, K.J. Carbon and nitrogen dynamics along the decay continuum: Plant litter to soil organic matter. Plant Soil 1989, 115, 189–198. [Google Scholar] [CrossRef]
  42. Carrera, A.L.; Bertiller, M.B. Relationships among plant litter, fine roots, and soil organic C and N across an aridity gradient in Northern Patagonia, Argentina. Ecoscience 2010, 17, 276–286. [Google Scholar] [CrossRef]
  43. Bassett, O.D.; Prior, L.D.; Slijkerman, C.M.; Jamieson, D.; Bowman, D.M.J.S. Aerial sowing stopped the loss of alpine ash (Eucalyptus delegatensis) forests burnt by three short-interval fires in the Alpine National Park, Victoria, Australia. For. Ecol. Manag. 2015, 342, 39–48. [Google Scholar] [CrossRef]
  44. Gong, C.; Wang, S.L.; Zeng, Z.Q.; Deng, S.J.; Chen, J.P.; Long, K.S. Carbon storage and its distribution pattern of evergreen broad-leaved forests at different succession stages in mid-subtropical China. Chin. J. Ecol. 2011, 30, 1935–1941. (In Chinese) [Google Scholar]
  45. Fang, Y.T.; Mo, J.M.; Peng, S.L.; Li, D.J. Role of forest succession on carbon sequestration of forest ecosystems in lower subtropical China. Acta Ecol. Sin. 2003, 23, 1685–1694. (In Chinese) [Google Scholar]
  46. Cameron, A.D. Building resilience into Sitka spruce (Picea sitchensis (Bong.) Carr.) forests in Scotland in response to the threat of climate change. Forests 2015, 6, 398–415. [Google Scholar] [CrossRef]
  47. Pretzsch, H. The elasticity of growth in pure and mixed stands of Norway spruce (Picea Abies (L.) Karst.) and common beech (Fagus sylvatica L.). J. For. Sci. 2003, 49, 491–501. [Google Scholar]
  48. Ma, Q.Y.; Chen, X.L.; Wang, J.; Lin, C.; Kang, F.F.; Cao, W.Q.; Ma, Z.B.; Li, W.Y. Carbon content rate in constructive species of main forest types in northern China. J. Beijing For. Univ. 2002, 24, 96–100. (In Chinese) [Google Scholar]
  49. Liu, G.H.; Fu, B.J.; Fang, J.Y. Carbon dynamics of Chinese forests and its contribution to global carbon balance. Acta Ecol. Sin. 2000, 20, 733–740. (In Chinese) [Google Scholar]
  50. Houghton, R.A.; Skole, D.L.; Nobre, C.A.; Hackler, J.L.; Lawrence, K.T.; Chomentowski, W.H. Annual fluxes of carbon from deforestation and regrowth in the Brazilian Amazon. Nature 2000, 403, 301–304. [Google Scholar] [CrossRef] [PubMed]
  51. Fedrigo, M.; Kasel, S.; Bennett, L.T.; Roxburgh, S.H.; Nitschke, C.R. Carbon stocks in temperate forests of south-eastern Australia reflect large tree distribution and edaphic conditions. For. Ecol. Manag. 2014, 334, 129–143. [Google Scholar] [CrossRef]
  52. Zhang, X.Y.; Guan, D.S.; Zhang, H.D. Characteristics of storage and decomposition of coarse woody debris (CWD) under three forests in Guangzhou. Acta Ecol. Sin. 2009, 29, 5227–5236. [Google Scholar]

