Article

Allometric Equations for Estimating Biomass of Euterpe precatoria, the Most Abundant Palm Species in the Amazon

1
Brazilian National Institute for Research in the Amazon, Laboratory for Forest Management, Manaus 69.060-000, Brazil
2
Forestry and Forest Products Research Institute, Kansai Research Center, 68 Nagaikyutaroh, Momoyama, Fushimi, Kyoto 612-0855, Japan
3
Forestry and Forest Products Research Institute, Matsunosato, Tsukuba, Ibaraki 305-8687, Japan
4
Department for Biogeochemical Processes, Max Planck Institute for Biogeochemistry, Hans Knöll Str. 10, Jena 07745, Germany
*
Author to whom correspondence should be addressed.
These authors contributed equally to this work.
Forests 2015, 6(2), 450-463; https://doi.org/10.3390/f6020450
Submission received: 25 November 2014 / Accepted: 2 February 2015 / Published: 10 February 2015

Abstract

:
Allometric models to estimate biomass components such as stem mass Ms, foliage mass Ml, root mass Mr and aboveground mass Ma, were developed for the palm species Euterpe precatoria Mart., which is the most abundant tree species in the Amazon. We harvested twenty palms including above- and below-ground parts in an old growth Amazonian forest in Brazil. The diameter at breast height D ranged from 3.9–12.7 cm, and the stem height H ranged from 2.3–16.4 m. The D, diameter at ground basis D0, crown diameter CD, H, stem specific gravity ρ, and number of fronds Nf were considered as independent variables and incorporated into a power function model. The best predictors were D2 for Ms and Ma, D2HNf for Ml, and D for Mr. Slender index (H/D) ranged from 0.56–1.46 m·cm−1, and the D-H relationship suggested that the stem shape becomes more slender with increasing D. On the other hand, ρ increased with D implying a stiffening of stem tissue. The average root/shoot ratio was estimated as 0.29 which was higher than that reported for the non-palm tree species in the Amazon. Comparisons of several models to estimate Ma of different palm species, suggested that the variations of the D-H relationship and ρ should be considered to develop allometric models for estimating biomass in palm species. In particular the ρ largely varied depending on individual size, which should be important to consider, when developing the allometric models for palms.

1. Introduction

Tropical forests, and especially the Amazon rainforest, play a crucial role in the Earth’s climate system, and can be considered an important buffer for global climate change. Pristine and undisturbed tropical forest ecosystems are hence one of the most important terrestrial carbon sink and storage pools [1]. However, the total capacity of tropical forests to sequester and store carbon is still not fully evaluated, making an exact determination of the biomass in tropical forests a highly relevant issue for modeling global climate change. The total stock of biomass and carbon in tropical forests still remains with a significant error due to the high diversity of species and growth forms [2,3].
Palm species are one of the most representative vegetation components in the Amazon [4], making up about 3.5% of the total above-ground biomass in Brazil [5]. In the Amazon, the arborescent palms dominate some habitats such as seasonally flooded small valley streams or along the large riparian systems [6], though they are not restricted to those areas. Euterpe precatoria, for instance, can be found in the terra-firme forests, which are the dominant forest type in the Amazon. Total biomass of palms in terra-firme increases from the plateau areas with clay-rich soils to low slopes and bottomlands [7].
Up to date, palms are frequently excluded from biomass assessments (e.g., [8]) even if they are a conspicuous component of the Amazonian forests [7]. This is due to a lack of allometric equations specific to palms (e.g., [9,10]). Few studies focus on palm above-ground biomass [9,11,12,13] and there is only a single study for below-ground biomass estimation [12]. The palm species shows unique plant architecture and anatomical characteristics. Arborescent palms, for instance, have slender stem without branching because of a lack of secondary growth, and the specific gravity of stem varies greatly within an individual body [14]. These unique characteristics would be reflected in the allometric models for estimating biomass.
In the present study, we established allometric models for estimating biomass components including leaves, stems, and roots of a native palm species Euterpe precatoria var. precatoria known as Açai in the Amazon. A recent study showed that E. precatoria is the most abundant tree species in the Amazon [15]. For in-depth analysis of allometry of the species, the stem diameter (diameter at breast height D or at ground basis D0)-stem height H relationship, and size dependency of stem specific gravity ρ were also investigated as the stem diameter vs. height relationships and ρ distribution patterns are reportedly quite different from those of non-palm tree species (e.g., [14,16,17]). Finally, the established allometric models were compared with those of similar palm species to evaluate the generality of the allometric models for estimating palm biomass.

2. Material and Methods

2.1. Study Site

This study was conducted in a terra-firme forest along the access road to the field station of the forest management site of the Brazilian National Institute for Research in the Amazon (INPA) (2°36′ S 11°35′ W). The field station is situated ca. 60 km northwest of Manaus, Brazil. The elevation ranges from ca. 80–120 m above sea level. Annual precipitation in the area is on average 2547 mm per year [18]. Rainfall is more or less evenly distributed throughout the whole year with some drier months between July and October when rainfall can drop below 100 mm per month. Annual mean temperature is 25.8 ± 0.25 (SE) °C and does not vary a lot between months [18]. The main natural vegetation type is terra-firme, a species-rich evergreen tropical moist lowland forest. The forests on plateau areas are characterized by clay rich Oxisols, whereas the forests on valley bottom areas are characterized by sandy Spodosols [7,19,20].

2.2. Euterpe precatoria

Euterpe precatoria var. precatoria (Arecaceae) is a solitary palm and has been reported as the most abundant tree species in the Amazon by a recent study which investigated the individual density and species abundance on the basis of 1170 monitoring plots established in the Amazon [15]. Euterpe precatoria develops 10–20 compound leaves with 43–91 evenly distribute leaflets [21] and is characterized by stilt root formation [22,23]. The mesocarp of the palm seeds and the palm hearts are widely consumed [21]. The common name is “Açai” and is currently one of the most important resources in agroforestry systems in the Amazon [24].

2.3. Data Collection

In a preliminary research, we measured diameter at breast height D for large trees (D > 10 cm) including palm and non-palm trees in three quadrates (60 m × 60 m) established in a terra-firme forest at a valley near the present study site. In addition, small trees (5 < D < 10 cm) were also measured in a subplot (20 m × 60 m) within each quadrate. Tree height H was also measured for E. precatoria. In total, 56 E. precatoria individuals were counted on these quadrates. D ranged from 5.5–14.0 cm, and H ranged from 7.3–21.3 m. The stem of E. precatoria reaches reportedly to 23 cm in D and 25 m in H [22].
In February 2013, twenty individuals of E. precatoria were harvested. D ranged from 3.9–12.7 cm and H ranged from 2.3–16.4 m (see Supplementary Table S1 for details). The size range of the destructively collected samples covers a large portion of the recorded D and H in the preliminary study, i.e., 80% of the individuals recorded in the preliminary study showed their D and H within the size range of the destructively collected samples. For the samples, we measured D, diameter at ground basis D0, stem height H, crown diameter CD, number of fronds Nf, and total fresh mass of each component (stem, leaves, roots including stilt roots and below-ground roots, and reproductive organs) in the field. H was quantified with a measuring tape after sample individuals had been felled. H was defined as a length from the stem base to tip of meristem. CD was calculated as the average values measured along two perpendicular directions with a measuring tape before felling the samples, where the same geographic orientation was used for all samples. D0 was measured above the stilt root formation which was observed for large trees whose D > 8 cm. Nf was counted after harvesting. All leaves including leaflets and rachis were entirely clipped and their fresh masses were weighed directly in the field. Below-ground parts were excavated manually to include all coarse roots (>2 mm). The horizontal distribution of root system was similar to that of crown on the basis of visual observation. The root depth was less than ca. 1 m. To determine the average water content and specific gravity ρ of stems, three disks (5–10 cm in thickness) were collected from the top, middle, and bottom positions of each stem. We collected subsamples (~1 kg) of leaves and roots to determine the water content for each individual. Specific gravity ρ was measured as a ratio of dry mass to green volume. All collected subsamples were transported to the laboratory and oven-dried at 65 °C to constant dry mass. Using the corresponding water content of each component, we converted fresh to dry mass individually.

2.4. Models and Statistics

The allometric relationships were expressed as the following power function:
y = gxh
where y and x are the dependent and the independent variables, respectively, and g and h are coefficients. The equation was linearized by taking logarithms, as in the following form:
lny = lng + hlnx
where lng and h are the intercept and slope of the regression line, respectively. The lng and h were obtained by the standardized major axis (SMA) method using a package of smatr for statistical software R version 3.1.0 [25]. The allometric relationships for estimating the mass of stem Ms, leaves Ml, roots Mr, and above-ground Ma to different dimensions, such as D, D0, H and CD, and their combined variables, were established. In addition, ρ was tested for estimating Ms, Mr and Ma, while Nf was tested for estimating Ml. The stem diameter (D or D0)-H relationships and stem diameter-ρ relationship were also examined using Equation (2). The best model was selected according to the adjusted coefficient of determination R2adj.
Several theoretical works proposed different models predicting the h value in Equation (2) for the relationships among D, H, and individual mass. In the present study, we tested three models involving the geometric similarity model [26], the elastic similarity model [26], and the fractal geometry model (namely WBE model) [27]. The geometric similarity model assumes that the different sized individuals have the same body shape, which predicts the following relationships: DH, D3Ma. Elastic similarity model assumes that the margin of safety against buckling of stem owing to its own body mass is constant irrespective of body size, which leads to the following relationships: D2H3, D8Ma3. The fractal geometry model assumes a fractal-like branching network of plant body optimized for its primary metabolism, and predicts the following relationships D2H3, D8Ma3. A function of slope.test in smatr was used to test if the estimated h values in Equation (2) were statistically equal to the specific value derived from the different models.
For comparisons of allometric models between the present and previous studies [9,12,13,16], the residual sum of squares RSS were calculated. The relative error based on residual was also calculated for each sample to evaluate the systematic errors according to individual size, and the relationship of the relative error to D was expressed with a trend curve determined using a lowess procedure (locally weighted scatter plot smoothing) with a statistical software KaleidaGraph ver. 4.1.0 (Synergy Software, Reading, PA, USA) (e.g., [28]).
The Spareman correlation coefficient rs was calculated to examine the relationships of slender indices (H/D and H/D0) to H using statistical software R version 3.1.0 [25].

3. Results and Discussion

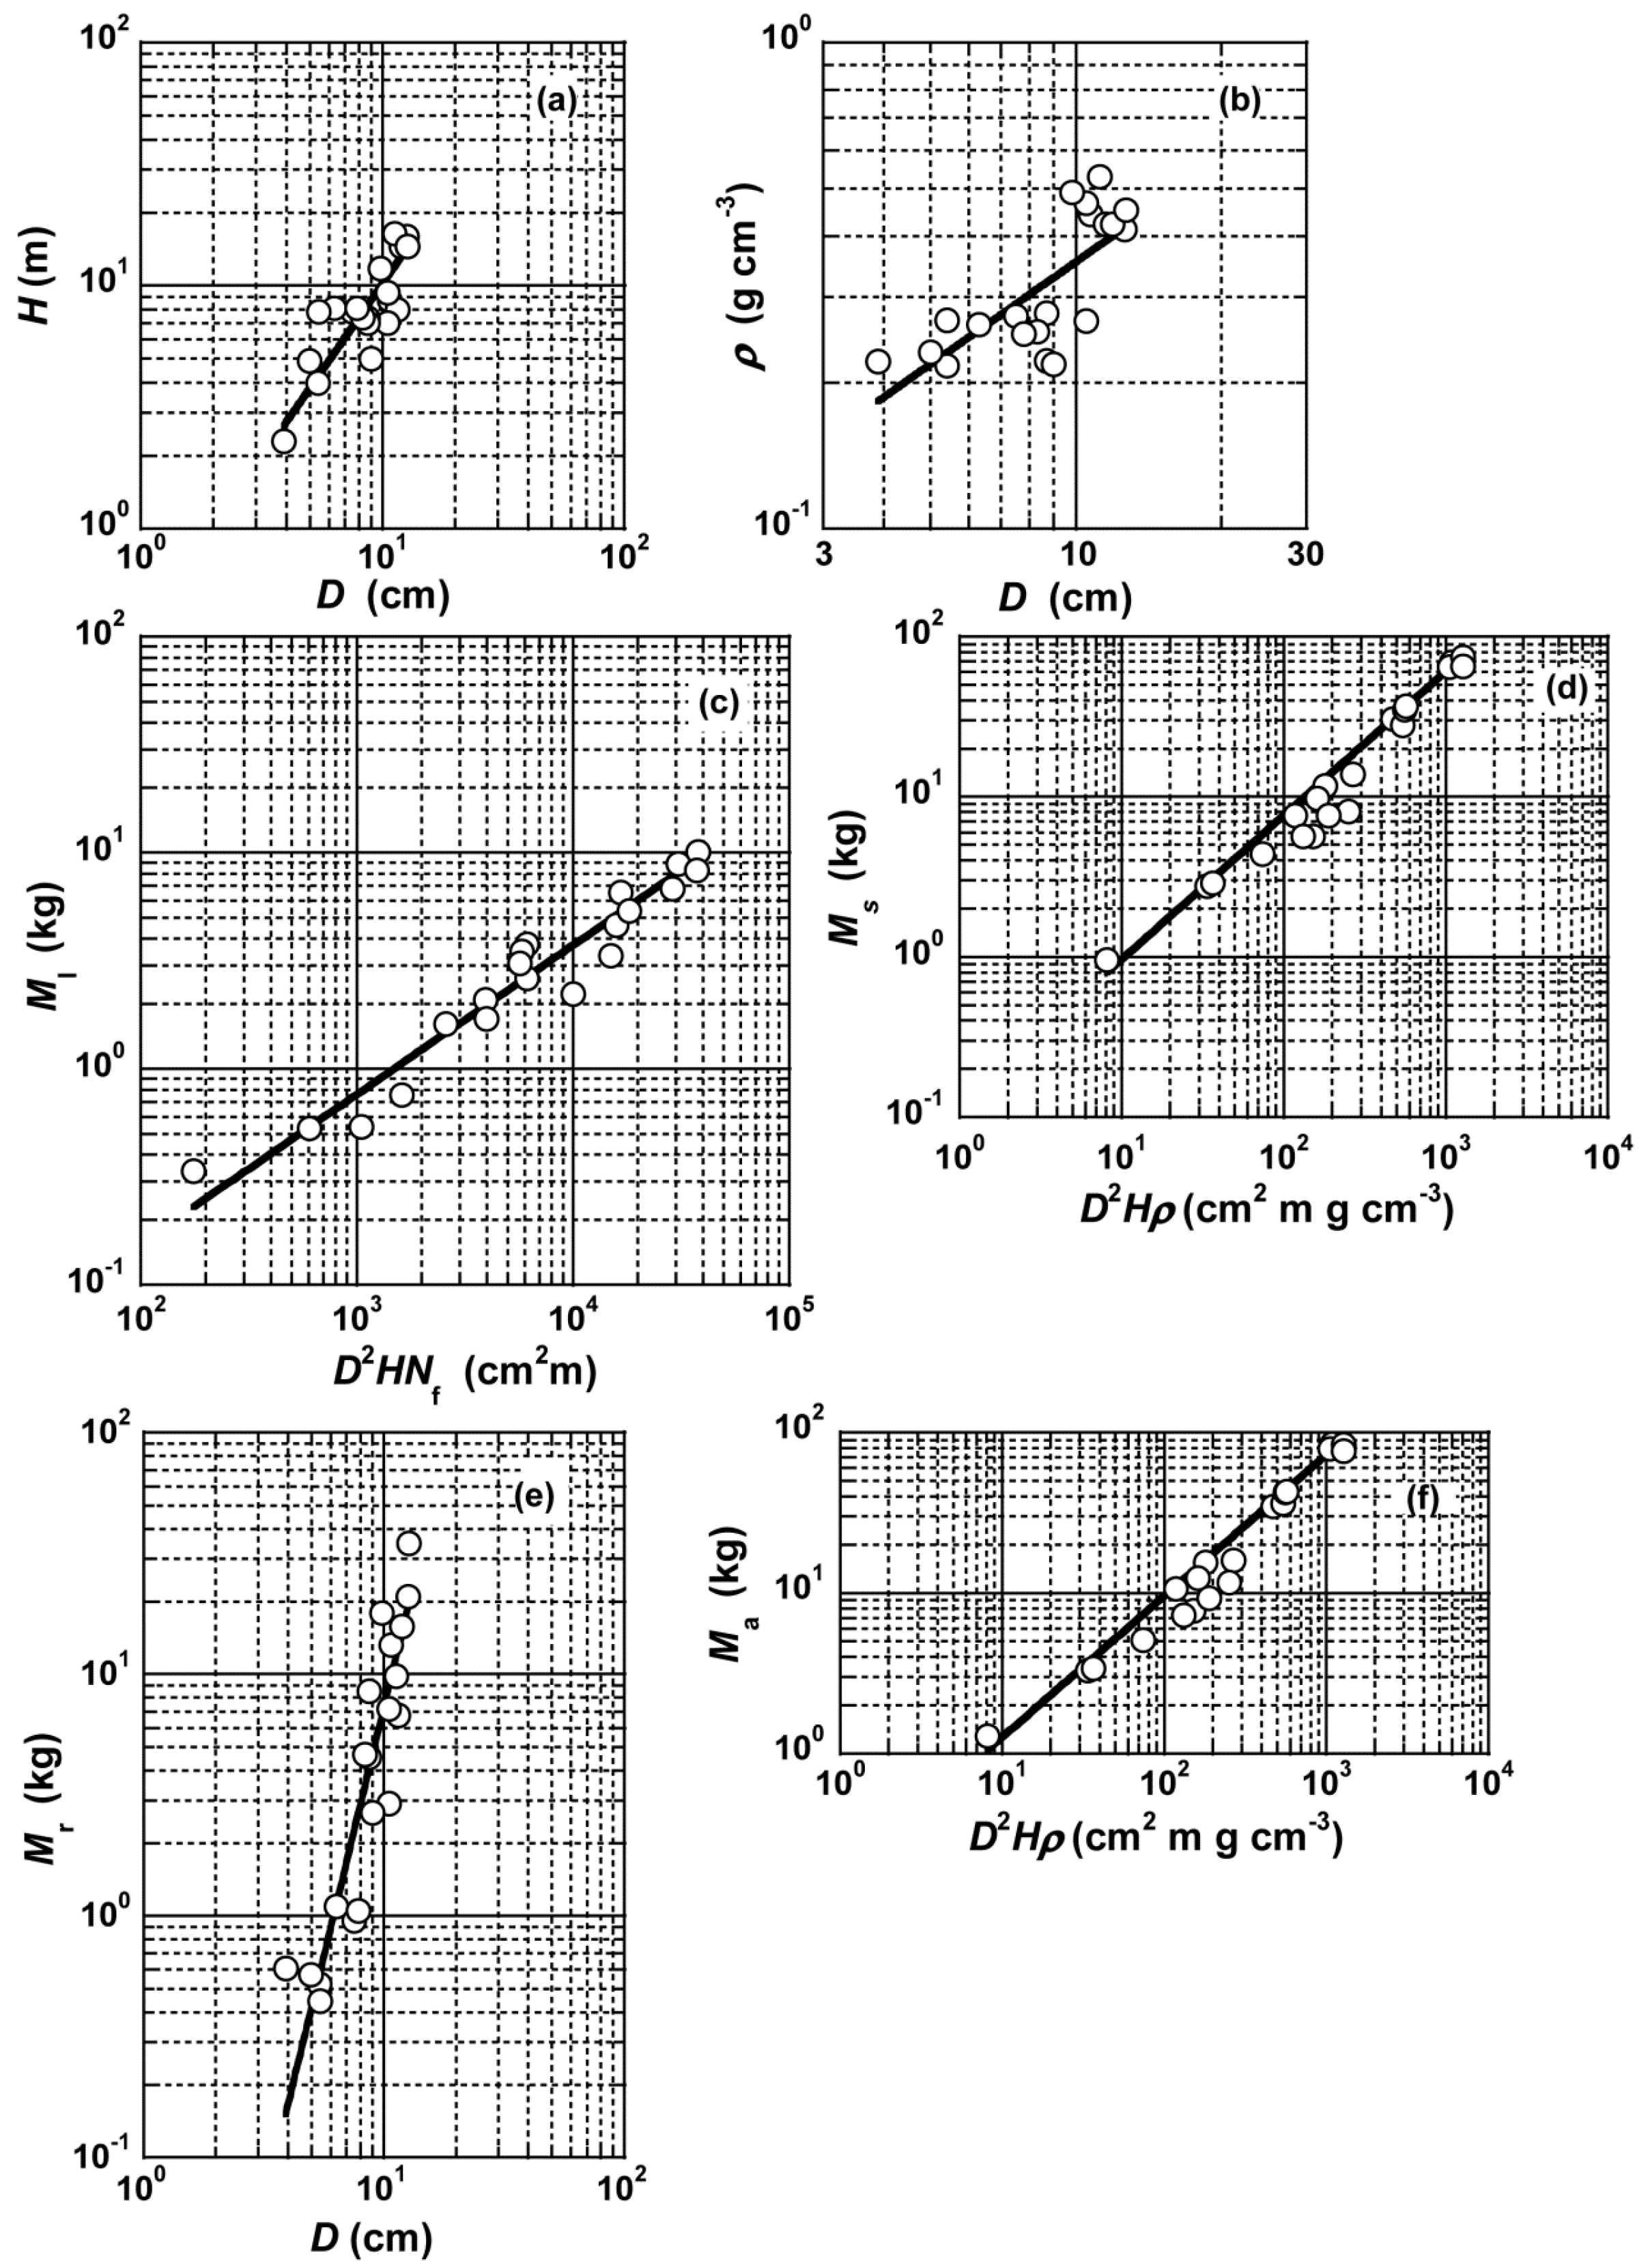
3.1. Stem Height and Specific Gravity

The stem diameter (D or D0)-H relationships were established (Table 1), and the D showed better fitting result with higher R2adj than D0 (Figure 1a) (see Supplementary Table S2 for details). The values of allometric exponent h in Equation (2) were estimated as 1.43 for D-based model. The estimated h value was significantly higher than unity derived from the geometric similarity model (p < 0.001) and 2/3 derived from the elastic similarity model and the fractal geometry model (p < 0.01). The significant difference of h from unity indicates a size dependence of slenderness index as H/D ratio, and the slender index increased with D, i.e., HD1.4H/DD0.4. Avalos and Otárola [22] also reported that the h ranged from 1.13–1.35 for E. precatoria (H > 1 m) in Costa Rica, and the estimated h was apparently higher than unity. Similar results were reported for a cogeneric species E. edulis in an Atlantic forest, Brazil (h = 1.22 for D-H relationship; h = 1.89 for D0-H relationship) [29] and the palms Welfia georgii, Cryosophia albida, Prestoea decurrens, Iriartea gigantea, Socratea exorrhiza, Euterpe precatoria var. longivaginata in a Costa Rican tropical wet forest (h > 1.0 for all species) [14].
Table 1. As dependent variable y, tree height H (m), stem specific gravity ρ (g·cm−3) and biomass components (kg) including leaf mass Ml, stem mass Ms, root mass Mr and above-ground mass Ma are assigned to Equation (2). As independent variable x, stem diameter at breast height D (cm), H (m), stem diameter at ground basis D0 (cm), crown diameter CD (m), ρ (g·cm−3), number of fronds Nf and their combined variables are assigned. The lng and h are coefficients in Equation (2), and their 95% confidence intervals are shown in parentheses. The values of adjusted coefficient of determination Radj2 are also shown.
yxLng h Radj2
HD−0.97(−1.86–−0.08)1.43(1.07–1.90)0.658
ρD−0.36(−0.60–0.12)0.32(0.23–0.45)0.515
MlD2HNf−5.04(−5.80–−4.28)0.69(0.61–0.78)0.937
MsD2−2.11(−2.43–−1.79)0.90(0.84–0.96)0.982
MrD2−3.97(−5.21–−2.72)1.01(0.81–1.27)0.787
MaD2−1.79(−2.10–−1.48)0.88(0.83–0.94)0.983
Figure 1. The best allometric models for estimating (a) stem height H; (b) stem specific gravity ρ; (c) leaf mass Ml; (d) stem mass Ms; (e) root mass Mr and (f) above-ground mass Ma, where D and Nf represent stem diameter at breast height (cm) and number of fronds (dimensionless), respectively.
Forests 06 00450 g001
The slenderness indices as the ratio of H to D or D0 scaled with increasing H (rs = 0.72, p < 0.01 for H/D; rs = 0.87, p < 0.01 for H/D0). Thus, the indices of slenderness as well as the estimates of h in the stem diameter-H models suggested that the unstableness of the plant shape increases with individual size in E. precatoria.
A comparison between the stem diameter (D or D0)-ρ relationships suggested that D showed better fitting result with higher R2adj than D0 (Table 1 and Figure 1b). The values of allometric exponent h in Equation (2) were estimated as 1.43 and 1.69 for D- and D0-based models, respectively. The estimated h values were significantly higher than zero (p < 0.001), which indicates a size dependency of ρ, although ρ showed a drastic increase at ca. 10 cm in D.

3.2. Allometric Models for Estimating Leaf Mass

In estimating leaf mass Ml, the model based on D2HNf was selected as the best model (Figure 1c) with higher R2adj than the other predictors (Table 1) (see Table S2 for details). The Nf can be easily measured in some palm species, and has been often used for estimating their biomass component and leaf area as a part of combined predictor of D2HNf [11,16]. Although CD was also a direct measure of foliage size as well as Nf, the CD showed the worst fitting for the variables examined alone. Interestingly, in estimating Ml, D showed some extent of superiority to the direct measures of foliage size such as Nf and CD, which could be due to the relationship of the stem diameter to functions which physically support foliage mass and limit the water transportation from roots to foliage.

3.3. Allometric Models for Estimating Stem Mass

For estimating stem mass Ms, the model based on D2 was selected as the best model, i.e., D2 showed higher R2adj than the other predictors (Figure 1d and Table 1). Although D0 was also expected to show a similar effect as D, D0 showed poor fitting compared to D (see Table S2 for details). This would be partly ascribed to the presence of a butt swell near the ground basis, even though the D0 was measured above the part of stilt root formation.

3.4. Allometric Models for Estimating Root Mass

All developed models for estimating root mass Mr showed poor accuracy compared to those for the other organs (R2adj < 0.799) (see Table S2 for details) and thus D was selected as the best predictor with the highest R2adj (Table 1 and Figure 2e). The root/shoot ratio is often used for estimating root biomass in forest ecosystems (e.g., [3,30,31,32,33,34,35]). In the present study, an apparent size dependence of the root/shoot ratio was not confirmed, and the average root/shoot ratio was estimated as 0.26 ± 0.03 (SE). In other words, ca. 20% of whole individual mass was allocated to root mass, which is higher than the 12% reported for the non-palm tree species in the Amazon [3].
Thus, the present study found that E. precatoria showed higher root proportion than the non-palm tree species in the Amazon. Furthermore, we also observed the development of stilt roots especially for large individuals (D > ca. 8 cm). It has been reported that some palm species including E. precatoria develop stilt roots to structurally support its slender-shaped stem [22,36]. Euterpe precatoria may need the large root portion accompanied by the stilt root development for support under physically unstable habitat conditions on sandy soils with seasonal inundation. The large root portion of this species may also be interpreted as one of the physiological adaptations to inundated environments where the plants are often exposed to root oxygen deficiencies. Euterpre precatoria had a sponge-like root structure with well-developed aerenchyma formations (data is not shown), and the large root portion could maintain sufficient oxygen for a healthy growth of new roots even under inundated conditions. Similarly, mangrove plants which have been known as the tree species well adapted to inundated environments, also have a large root portion (e.g., 48% of biomass allocation to roots was reported for Kandelia obovata [37]) with well-developed aerenchyma formations.
Figure 2. The residuals as percentage are shown for different models for estimating above-ground biomass Ma. Open circles and a solid line represent the best model developed in the present study. Closed circles and a long dashed line represent the model developed by Cole and Ewel [16]. Open triangles represent the model developed by Hughes [13]. Closed triangles represent the model developed by Saldarriaga et al. [9]. Open squares represent the model for E. precatoria developed by Goodman et al. [12]. Closed squares represent the common model developed by Goodman et al. [12]. The trend lines corresponding to the models were determined using a lowess procedure (locally weighted scatter plot smoothing). Some data points were plotted out of the scales, and those points are shown with a small sub-figure inside the main figure.
Forests 06 00450 g002

3.5. Allometric Models for Estimating Above-Ground Mass

The D2 was selected as the best predictor for estimating Ma (Table 1 and Figure 2f). The result of model selection was similar to that for Ms (see Table S2 for details) since Ms occupied a large portion of Ma (ca. 81%) and highly influences Ma. The allometric exponent h for the D-Ma relationship was 3.59 which was marginally significantly higher than 3 (p = 0.026) predicted by the geometric similarity model [26] and significantly higher than 8/3 (p < 0.001) predicted by both of the elastic similarity and fractal geometry models ([26,27], respectively). This is a notable result as the value of h rarely exceeds three in non-palm tree species. For example, Zianis and Mencuccini [38] reviewed 277 published D-Ma relationships, and only two cases (for Eucalyptus marginata by Todd [39]) showed higher h values than three.
Alternately, the h value for the D-Ma relationship can be interpreted as an integration of the h values in the D2-Ma, and the D-ρ relationships as follows: Ma ∝ (D2)0.88 = (D2 × D1.43 × D0.32)0.88 = D3.30. The directly estimated h (= 3.59) was insignificantly different from 3.30 (p > 0.05).
Thus, both of the increasing tendencies of slenderness and ρ can result in a higher h value of the D-Ma relationship than those expected by the geometric similarity model [26], elastic similarity model [26] and fractal geometry model [27]. The geometric similarity, elastic similarity and fractal geometry models assumed that ρ is homogeneous, which is inconsistent with an existence of size dependence of ρ in palm species. As revealed in the present study, the size dependencies of slenderness and ρ are quite important to develop allometric models for estimating palm biomass, and for understanding the uniqueness of palm species. The size dependence of the slenderness indicated an increase of unstableness as the individual size increased. On the other hand, the increasing tendency of ρ indicated a stiffening of stem tissue, and may reduce the risk of buckling owing to the unstableness.

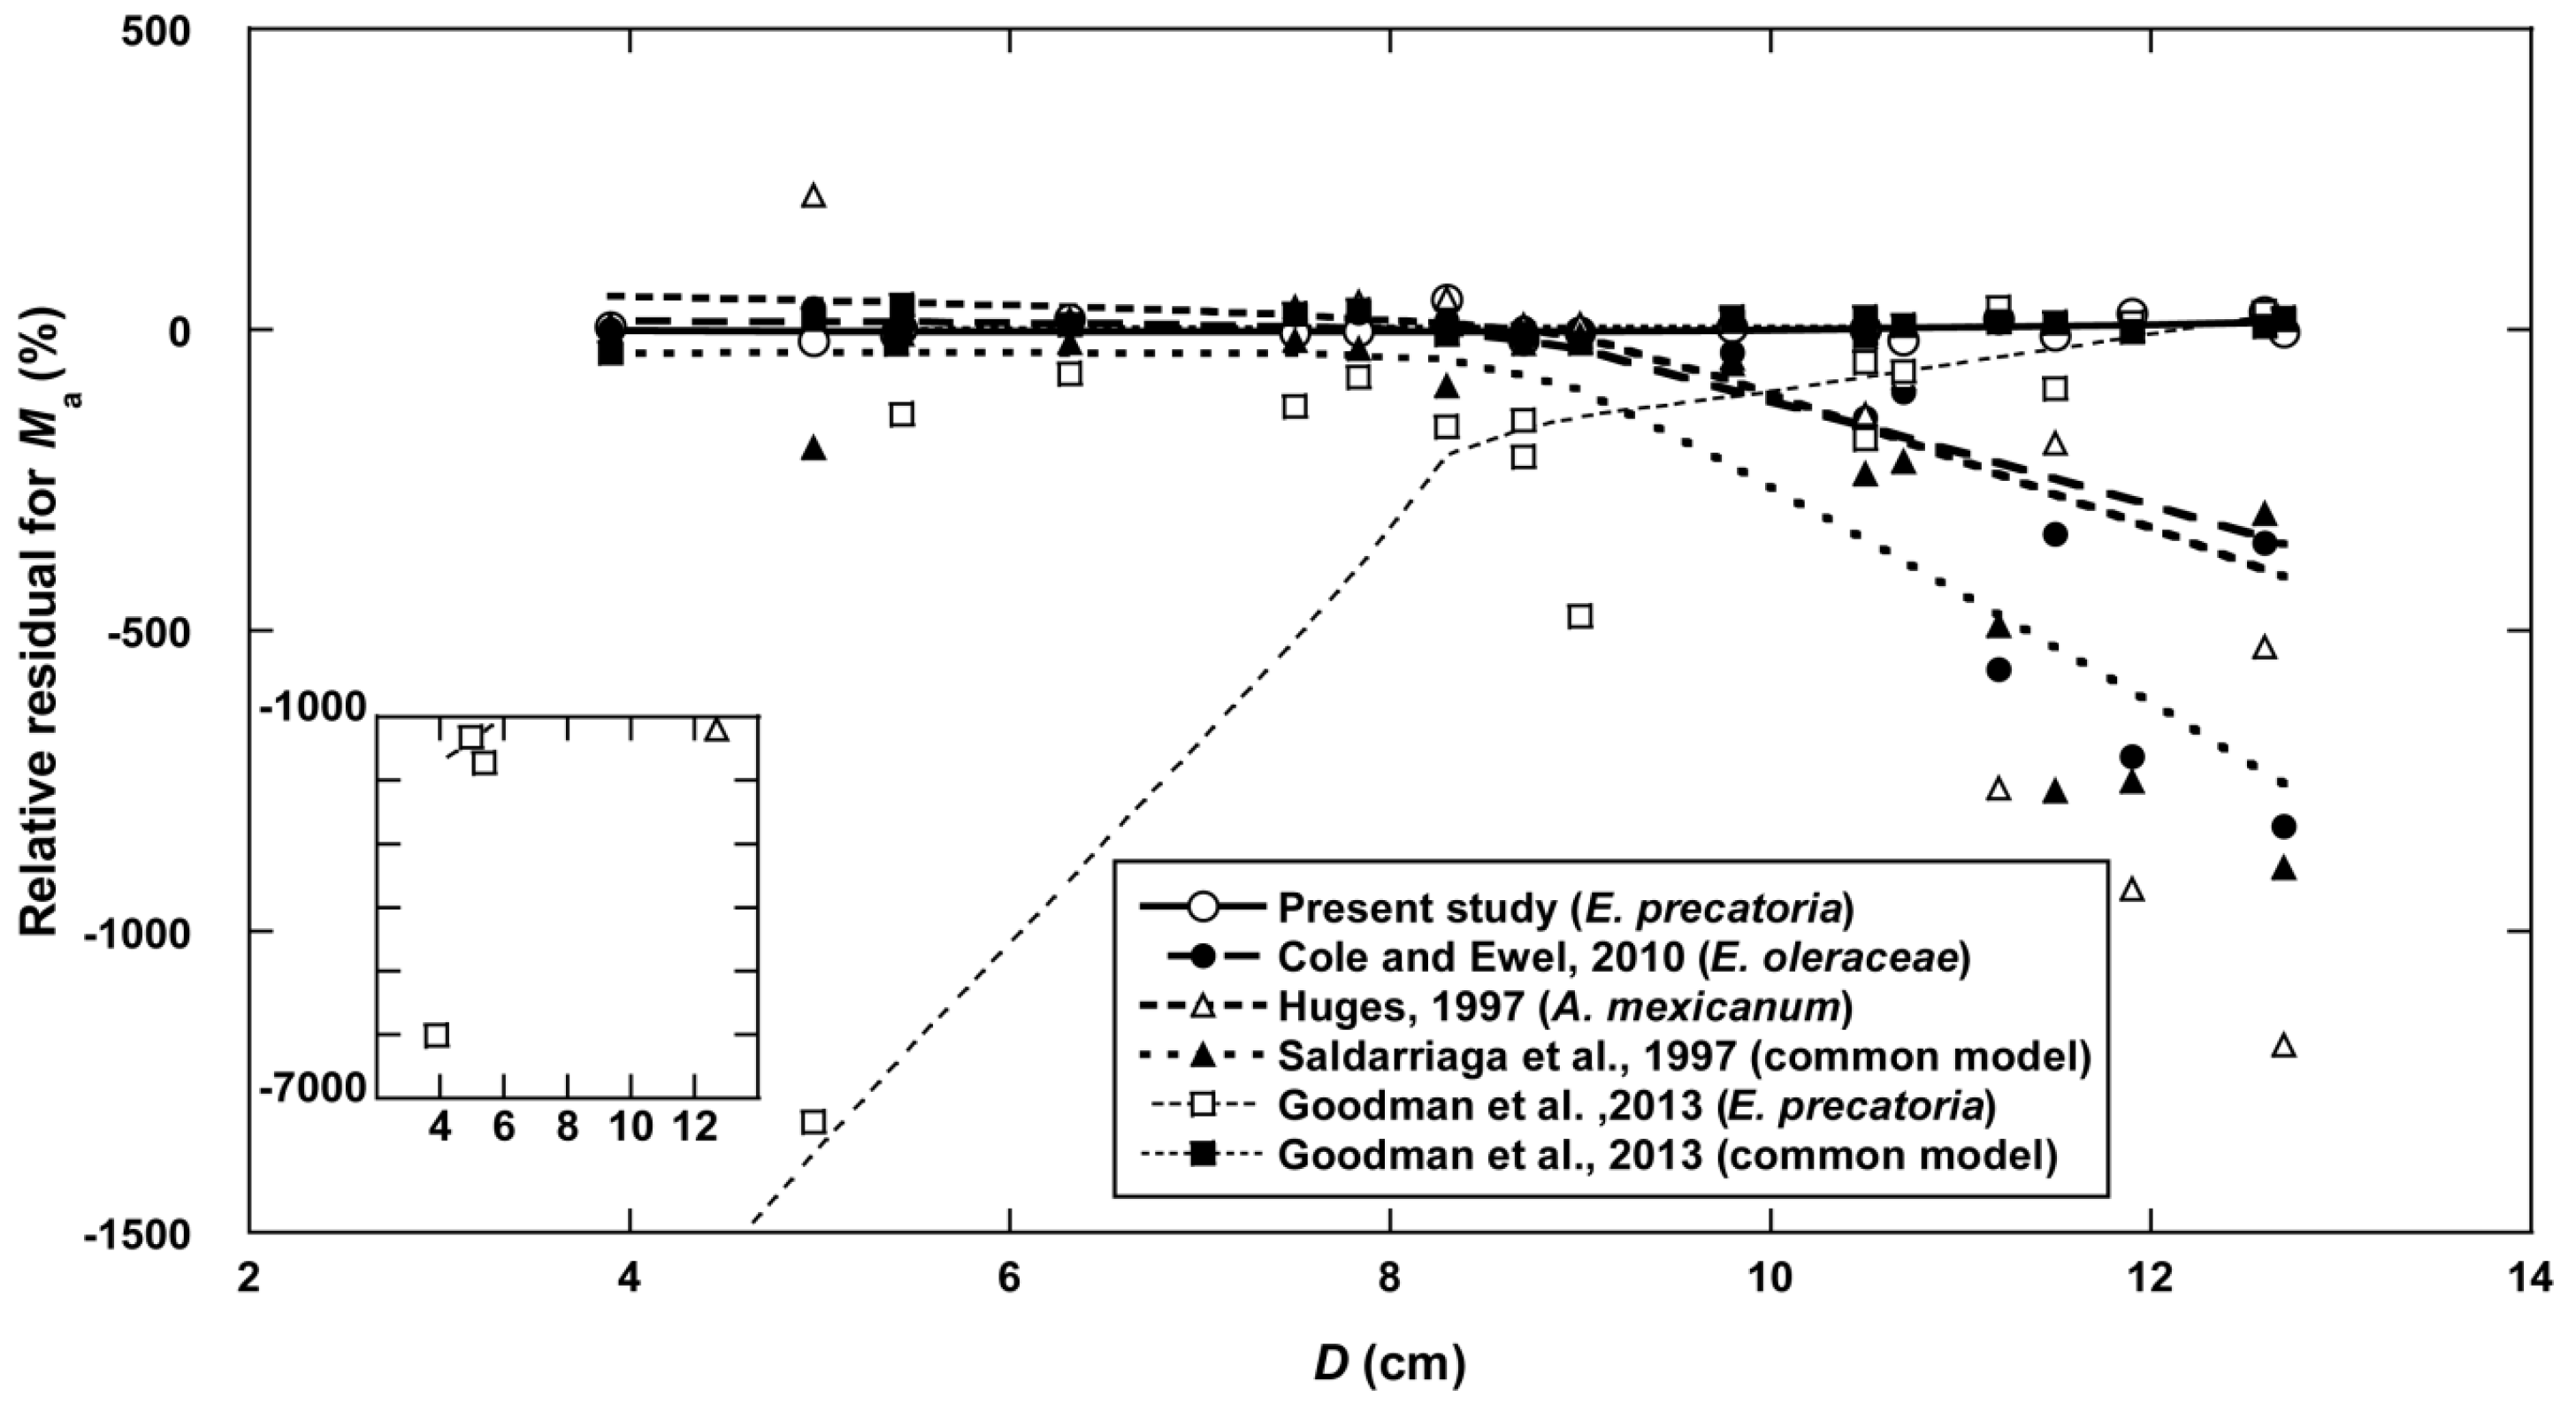
3.6. Comparison of Models for Estimating Above-Ground Mass in Palm Species

The allometric models for estimating Ma were previously reported for E. precatoria in Peru [12], a cogeneric species E. oleraceae in a plantation in Costa Rica [16], Astrocaryum mexicanum in Mexico [13], and a common allometry for several palm species in Costa Rica [9] and in Peru [12]. Those previous models were fitted to the present dataset to examine a variation of allometry in palm species (Table 2). As a result, almost all previous models, except for a common model developed by Goodman et al. [12], showed much higher residual sum of squares RSS than 397 kg2 in the best model (the D2-based power function model) established by the present study. As shown in Figure 2, the underestimations of Ma for large individuals (D >ca. 9 cm) resulted in the large RSS values for the models by Hughes [13], Cole and Ewel [16] and Saldarriaga et al. [9]. Hughes [13] developed the model on the basis of the small palm individuals (Astrocaryum mexicanum, n = 15, 4.1 < D < 6.2 cm, and 1.5 < H < 5.8 m), which can be a possible reason why this model showed poor prediction for the large sized samples in the present study. On the other hand, the size range of the samples used for the models developed by Cole and Ewel [16] was comparable (Euterpe oleraceae, n = 197, 1.3 < H < 20 m) to that of the present dataset. However, their samples might be composed of younger ones than ours since they collected the samples from a plantation in Costa Rica and the maximum age of individuals in the samples was 13 years old, though the exact ages of samples in the present study were unclear. Unfortunately, the species and size range of the samples used by Saldarriaga et al. [9] were not described. Surprisingly, the previous model developed for E. precatoria [12] showed the largest error in the compared models. Hence, even within a same species, the allometry showed a notable variation depending on environments, which can be mainly ascribed to the variation in the relationships among D, H and ρ (e.g., [28]). Goodman et al. [12] constructed their model for E. precatoria with H as a single variable which may not be capable to cover the heterogeneity of the allometry in E. precatoria. On the other hand, the Goodman’s common model involved D, H and dry mass/fresh mass ratio dmf of a stem as explanatory variables, and was accurately fitted to the present dataset. The moisture content (1–dmf) has been known to be negatively correlated with stem specific gravity (e.g., [40,41]), i.e., the dmf tends to show a positive relationship to ρ. Thus, the variations of D and ρ (or dmf) would be important to capture the variation in palm allometry among the different habitats even within a species. Although the palms do not show secondary growth with development of vascular cambium, the palm species show significant variation in D because of secondary thickening characterized by division and enlargement of parenchyma cells (e.g., [14,42,43]). Furthermore, the ρ varies depending on the height where the disk was collected [14], which results in an increasing tendency of mean ρ with individual size as confirmed in the present study (Figure 1b). The increase of ρ can be mainly explained by thickening of cell walls with age [43,44].
Table 2. The comparisons of allometric models for estimating above-ground mass Ma of palm species among the models developed in different regions, and the residual sum of squares RSS was calculated for each model.
Equations for Estimating MaFocal SpeciesRSS kg2References
Ma = Ms + Ml + Mrachis,E. oleraceae5823Cole and Ewel [16] *
where Ms = 0.0314 × (D2H)0.917 × 1.040
Ml = 0.0237 × (D2HNf)0.512 × 1.036
Mrachis = 0.0458 × (D2HNf)0.388 × 1.036
Ma = 0.3060 × D1.837 × 1.035A. inexicanwn10,642Hughes [13]
Ma = 1.697 × 10⁻³ × D1.754 × H2.151Common7606Saldarriaga et al. [9]
Ma = 13.59H − 108.8E. precatoria236,389Goodman et al. [12]
Ma = 0.0950 (dmf D2H)Common486Goodman et al. [12] **
Ma = 0.167 × (D2) 0.883E. precatoria397The present study
* In the model of Cole and Ewel [16], Ml was separated from the mass of rachis Mrachis; ** in the common model by Goodman et al. [12], dmf represents dry mass/fresh mass ratio.
Almost all previous models showed poor fittings to the present dataset of E. precatoria, possibly caused by the different size range, species, and environments. Furthermore, the previous model specific to E. precatoria showed the worst fitting to the present dataset, which suggested that the palm allometry varies significantly even within the same species. On the other hand, a common model developed by Goodman et al. [12] showed a comparable fitting result to that of the best model in the present study, which implies an important point that the variations of the D-H relationship and size dependence of ρ should be considered for developing the allometric models for estimating biomass of palm species. It should be noted that the ρ showed a size dependence, which means a necessity to model the size dependence to apply the allometric models involving ρ (or dmf) as a part of its variable because ρ cannot be measured individually for estimating palm biomass at a large scale study. This is the first study examining the common allometric model [12] for estimating palm biomass. Although several common models for non-palm tropical tree species have been proposed [28,45], those models reportedly show poor accuracy for some regions (e.g., [3,46]). On the other hand, the common model for palm species [12] was accurately fitted to the present dataset for E. precatoria, which may be because of simplicity of the tree architecture specific to palm species. However, the applicability of the common allometry should be further examined with different palm species and regions.

4. Conclusions

The established allometric equations for each biomass component suggested the uniqueness of palm species. For estimating Ml, D2HNf was selected as the best predictor, and the usefulness of Nf is specific to palm species since Nf can't be generally measured for non-palm species. For estimating Ms and Ma, D2 was selected as the best predictor. The present study found that E. precatoria showed higher root proportion than the non-palm tree species in the Amazon, which was partly explained by stilt root formation of this species. It should be noted that ρ showed an apparent size dependency, and the stem shape becomes more slender with increasing D, which were reflected in the analysis result of the D2-Ma relationship. A comparative analysis of the allometric relationships for estimating Ma, suggested that the variations of the D-H relationship and size dependence of ρ should be considered for developing the allometric models for estimating biomass of palm species.

Acknowledgments

The authors thank all members of the international cooperative research project of Carbon Dynamics of Amazonian Forests, and Susan Trumbore and Masahiro Saitoh for their valuable suggestions. Special thanks to Alida Mercado Cárdenas for English editing, and anonymous reviewers for their valuable suggestions on the early version of this manuscript. This study was financially supported by the Science and the Technology Research Partnership for Sustainable Development program of the Japan Science and Technology Agency and the Japan International Cooperation Agency. We also want to thank the Brewery Bohemia for brewing some decent pilsener which gave us the inspiration to initiate the Amazon Palm Experiment (APE) project during some pleasant nights sitting in front of the Amazon Theatre.

Author Contributions

Da Silva Fernando, Kunert Norbert and Suwa Rempei contributed equally to the field work, analysis and writing of the manuscript. Kajimoto Takuya, Ishizuka Moriyoshi and Higuchi Niro contributed to the logistics and financial arrangement under the CADAF project.

Conflicts of Interest

The authors declare no conflict of interest.

References

  1. Chambers, J.Q.; dos Santos, J.; Ribeiro, R.J.; Higuchi, N. Tree damage, allometric relationships, and above-ground net primary production in central Amazon forest. For. Ecol. Manag. 2001, 152, 73–84. [Google Scholar] [CrossRef]
  2. Houghton, R.A. Aboveground forest biomass and the global carbon balance. Glob. Chang. Biol. 2005, 11, 945–958. [Google Scholar] [CrossRef]
  3. Lima, J.N.A.; Suwa, R.; Ribeiro, H.P.G.M.; Kajimoto, T.; Santos, J.; Silva, P.R.; Souza, S.A.C.; Barros, C.P.; Noguchi, H.; Ishizuka, M.; et al. Allometric models for estimating above- and below-ground biomass of tropical rainforests at São Gabriel da Cachoeira in upper Rio Negro, Brazilian Amazon. For. Ecol. Manag. 2012, 277, 163–172. [Google Scholar] [CrossRef]
  4. Kunert, N.; Barros, P.; Higuchi, N. Do palm water use characteristics explain the spatial distribution of palms in the Central Amazon? Acta Hortic. 2013, 991, 197–204. [Google Scholar]
  5. Fearnside, P.M. Biomassa das florestas Amazônicas brasileiras. In Emissão × Seqüestro de CO2: Uma Oportunidade de Negócios Para o Brasil; Companhia Vale do Rio Doce: Rio de Janeiro, Brazil, 1994; pp. 95–124. [Google Scholar]
  6. Henderson, A. The Palms of the Amazon; Oxford University Press: Oxford, UK, 1995; p. 380. [Google Scholar]
  7. Castilho, C.V.; Magnusson, W.E.; de Araujo, R.N.O.; Luizao, R.C.C.; Luizao, F.J.; Lima, A.P.; Higuchi, N. Variation in aboveground tree live biomass in a central Amazonian Forest: Effects of soil and topography. For. Ecol. Manag. 2006, 234, 85–96. [Google Scholar] [CrossRef]
  8. Laurance, W.F.; Fearnside, P.M.; Laurance, S.G.; Delamonica, P.; Lovejoy, T.E.; Rankin-de-Merona, J.M.; Chambers, J.; Gascon, C. Relationship between soils and Amazon forest biomass: A landscape-scale study. For. Ecol. Manag. 1999, 118, 127–138. [Google Scholar] [CrossRef]
  9. Saldarriaga, J.G.; West, D.C.; Tharp, M.L.; Uhl, C. Long-term chronosequence of forest succession in the upper Rio Negro of Colombia and Venezuela. J. Ecol. 1988, 76, 938–958. [Google Scholar] [CrossRef]
  10. Cummings, D.L.; Kauffman, J.B.; Perry, D.A.; Hughes, R.F. Aboveground biomass and structure of rainforests in the southwestern Brazilian Amazon. For. Ecol. Manag. 2002, 163, 293–307. [Google Scholar] [CrossRef]
  11. Avalos, G.; Sylvester, O. Allometric estimation of total leaf area in the neotropical palm Euterpe oleracea at La Selva, Costa Rica. Trees 2010, 24, 969–974. [Google Scholar] [CrossRef]
  12. Goodman, C.R.; Phillips, L.O.; del Castillo, T.D.; Freitas, L.; Cortese, T.S.; Monteagudo, A.; Baker, R.T. Amazon palm biomass and allometry. For. Ecol. Manag. 2013, 310, 994–1004. [Google Scholar] [CrossRef]
  13. Hughes, R.F. Effects of Deforestation and Land Use on Biomass, Carbon and Nutrient Polls in the Los Tuxtlas Region, Mexico. Ph.D. Thesis, Oregon State University, Corvallis, OR, USA, 1997. [Google Scholar]
  14. Rich, P.M. Mechanical architecture of arborescent rain forest palms. Principes 1986, 30, 117–131. [Google Scholar]
  15. Ter Steege, H.; Nigel, C.A.; Sabatier, D.; Baraloto, C.; Salomao, R.P.; Guevara, J.E.; Phillips, O.L.; Castilho, C.V.; Magnusson, W.E.; Molino, J.F.; et al. Hyperdominance in the Amazonian tree flora. Science 2013, 342. [Google Scholar] [CrossRef]
  16. Cole, T.G.; Ewel, J.J. Allometric equations for four valuable tropical tree species. For. Ecol. Manag. 2006, 229, 351–360. [Google Scholar] [CrossRef]
  17. Rich, P.M. Mechanical structure of the stem of arborescent palms. Bot. Gaz. 1987, 148, 42–50. [Google Scholar] [CrossRef]
  18. Kunert, N.; Laboratory for Forest Management, Manaus, Brazil. Micrometeorological Tower Measurements from the ZF-2 site at km 32, Digital Media, Large-Scale Biosphere—Atmosphere Experiment in Amazonia INPA Manaus. Unpublished data. 2013. [Google Scholar]
  19. Bravard, S.; Righi, D. Geochemical differences in an Oxisol—Spodosol toposequence of Amazonia, Brazil. Geoderma 1989, 44, 29–42. [Google Scholar] [CrossRef]
  20. Ferraz, J.; Ohta, S.; Salles, P.C. Distribuição dos Solos ao Longo de Dois Transectos em Floresta Primária ao Norte de INPA, Manaus, AM. In Pesquisas Florestais para Conservação da Floresta e Reabilitação de Áreas Degradadas da Amazônia; Higuchi, N., Campos, M.A.A., Sampaio, P.T.B., dos Santos, J., Eds.; CT-INPA/JICA: Manaus, Brazil, 1998; pp. 111–143. [Google Scholar]
  21. Lorenzi, H.; Bacher, L.; Lacerida, M.; Sartori, S. Frutas Brasileiras e Exóticas Cultivadas (de Consumo in Natura); Instituto Plantarum de Estudos das Flora: Nova Odessa, Brazil, 2006; p. 81. [Google Scholar]
  22. Avalos, G.; Otárola, M.F. Allometry and stilt root structure of the neotropical palm Euterpe precatoria (Arecaceae) across sites and successional stages. Am. J. Bot. 2010, 97, 388–394. [Google Scholar] [CrossRef] [PubMed]
  23. Avalos, G.; Schneider, A.R. Quantification of ramet production in the neotropical palm Euterpe precatoria (Areacaceae) in Costa Rica. Ecotropica 2011, 17, 31–38. [Google Scholar]
  24. Clay, J.W.; Clement, C.R. Selected Species and Strategies to Enhance Income Generation from Amazonian Forests; Forestry Working Paper FO: Misc/93/6; FAO: Rome, Italy, 1993. [Google Scholar]
  25. R Core Team. R: A Language and Environment for Statistical Computing. R Foundation for Statistical Computing, Vienna, Austria. 2014. Available online: http://www.R-project.org/ (accessed on 10 April 2014).
  26. McMahon, T.A.; Kronauer, R.E. Tree structures: Deducing the principle of mechanical design. J. Theor. Biol. 1976, 59, 443–466. [Google Scholar] [CrossRef] [PubMed]
  27. West, G.B.; Brown, J.H.; Enquist, B.J. A general model for the origin of allometric scaling laws in biology. Science 1997, 276, 122–126. [Google Scholar] [CrossRef] [PubMed]
  28. Chave, J.; Brown, A.C.S.; Cairns, M.A.; Cahmbers, J.Q.; Eamus, D.; Fölster, H.; Fromad, F.; Higuchi, N.; Kira, T.; Lescure, J.P.; et al. Tree allometry and improved estimation of carbon stocks and balance in tropical forests. Oecologia 2005, 145, 87–99. [Google Scholar] [CrossRef] [PubMed]
  29. Alves, L.F.; Martins, F.R.; Santos, F.A.M. Allometry of a neotropical palm, Euterpe edulis Mart. Acta Bot. Bras. 2004, 18, 369–374. [Google Scholar] [CrossRef]
  30. Cairns, M.A.; Brown, S.; Helmer, E.H.; Baumgardner, G.A. Root biomass allocation in the world’s upland forests. Oecologia 1997, 111, 1–11. [Google Scholar] [CrossRef]
  31. Houghton, R.A.; Laurence, K.T.; Hackers, J.L.; Brown, S. The spatial distribution of forest biomass in Brazilian Amazon: A comparison of estimates. Glob. Chang. Biol. 2001, 7, 731–746. [Google Scholar] [CrossRef]
  32. Brown, S. Measuring carbon in forests: Current status and future challenges. Environ. Pollut. 2002, 116, 363–372. [Google Scholar] [CrossRef] [PubMed]
  33. Malhi, Y.; Wood, D.; Baker, T.R.; Wright, J.; Phillips, O. Regional variation of above-ground live biomass in old-growth Amazonian forests. Glob. Chang. Biol. 2006, 12, 1–32. [Google Scholar] [CrossRef]
  34. Mokany, K.; Raison, R.J.; Prokushkin, A.S. Critical analysis of root: Shoot ratios in terrestrial biomes. Glob. Chang. Biol. 2006, 12, 84–96. [Google Scholar] [CrossRef]
  35. Nogueira, E.M.; Fearnside, P.M.; Nelson, B.W.; Barbosa, R.I.; Keizer, E.W.H. Estimates of forest biomass in the Brazilian Amazon: New allometric equations and adjustments to biomass from wood-volume inventories. For. Ecol. Manag. 2008, 256, 1853–1867. [Google Scholar] [CrossRef]
  36. Avalos, G.; Salazar, D.; Araya, L.A. Stilt root structure in the neotropical palms Iriartea deltoidea and Socratea exorrhiza. Biotropica 2005, 37, 44–53. [Google Scholar] [CrossRef]
  37. Khan, M.N.I.; Suwa, R.; Hagihara, A. Carbon and nitrogen pools in a mangrove stand of Kandelia obovata (S., L.) Yong: Vertical distribution in the soil-vegetation system. Wetl. Ecol. Manag. 2007, 15, 141–153. [Google Scholar] [CrossRef]
  38. Zianis, D.; Mencuccini, M. On simplifying allometric analysis of forest biomass. For. Ecol. Manag. 2004, 187, 311–332. [Google Scholar] [CrossRef]
  39. Todd, M.C. The Role of Nutrient Cycling in the Sustainability of Young Plant Communities on Mined Sites. Ph.D. Thesis, University of Western Australia, Perth, WA, Australia, 2000. [Google Scholar]
  40. Simpson, W.T. Specific Gravity, Moisture Content, and Density Relationship for Wood; General Technical Report, FPL-GTR-76; USDA Forest Service, Forest Products Laboratory: Madison, WI, USA, 1993. [Google Scholar]
  41. Colgan, S.M.; Swemmer, T.; Asner, P.G. Structural relationships between form factor, wood density, and biomass in African savanna woodlands. Trees 2014, 28, 91–102. [Google Scholar] [CrossRef]
  42. Botânico, M.P.; Angyalossy, V. Is the secondary thickening in palms always diffuse? An. Acad. Bras. Cienc. 2014, 85, 1461–1472. [Google Scholar] [CrossRef]
  43. Tomlinson, P.B. The uniqueness of palms. Bot. J. Linn. Soc. 2006, 151, 5–14. [Google Scholar] [CrossRef]
  44. Rich, P.M. Developmental anatomy of the stem of Welfia georgii, Iriartea gigantea, and other arborescent palms—Implications for mechanical support. Am. J. Bot. 1987, 74, 792–802. [Google Scholar] [CrossRef]
  45. Brown, S. Estimating Biomass and Biomass Change of Tropical Forests: A Primer; FAO Forestry Paper 134; FAO: Rome, Italy; p. 55.
  46. Ngomanda, A.; Obiang, L.E.N.; Lebamba, J.; Mavouroulou, M.Q.; Gomat, H.; Mankou, S.G.; Loumeto, J.; Iponga, M.D.; Ditsouga, K.F.; Koumba, Z.R.; et al. Site-specific versus pantropical allometric equations: Which option to estimate the biomass of a moist central African forest? For. Ecol. Manag. 2014, 312, 1–9. [Google Scholar] [CrossRef]

