
Effects of Climate Change on Scots Pine (Pinus sylvestris L.) Growth across Europe: Decrease of Tree-Ring Fluctuation and Amplification of Climate Stress
 , , , , ,
Abstract
:1. Introduction
2. Materials and Methods
2.1. Study Areas
2.2. Data Collection
2.3. Data Processing
3. Results
3.1. Stand Structure and Production
3.2. Diversity of Tree Layer
3.3. Interactions between Production, Structure and Diversity
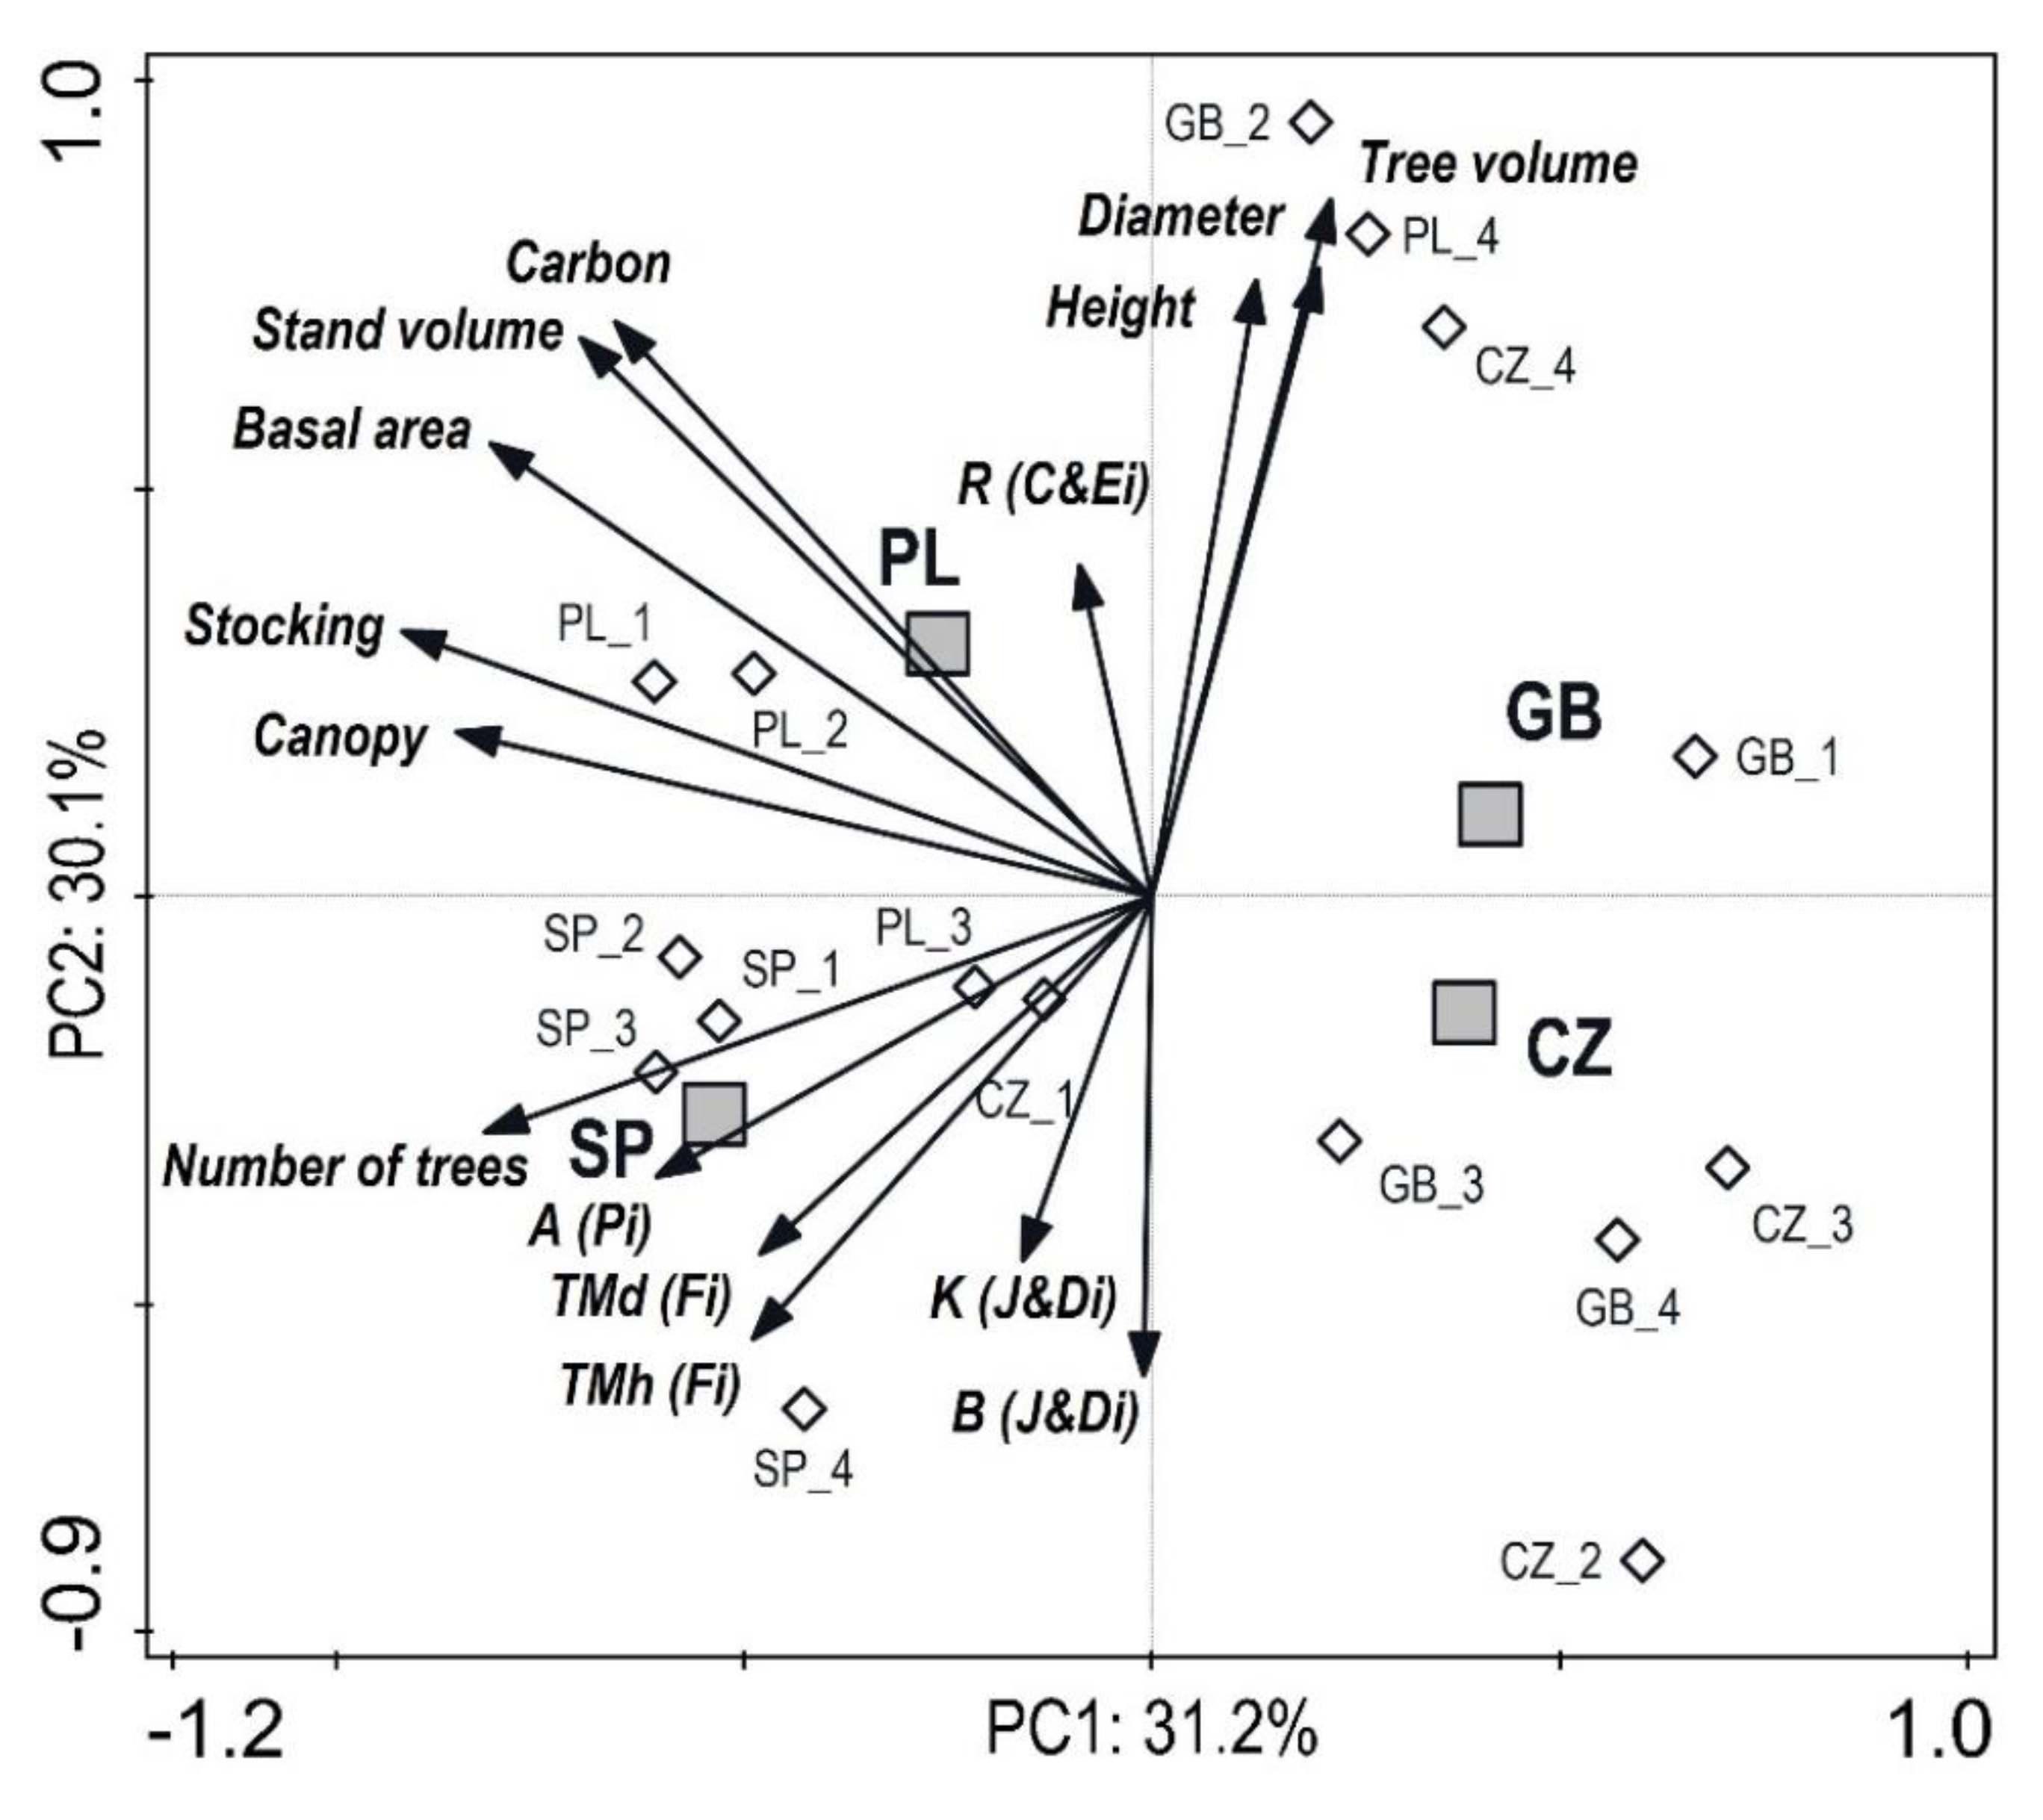
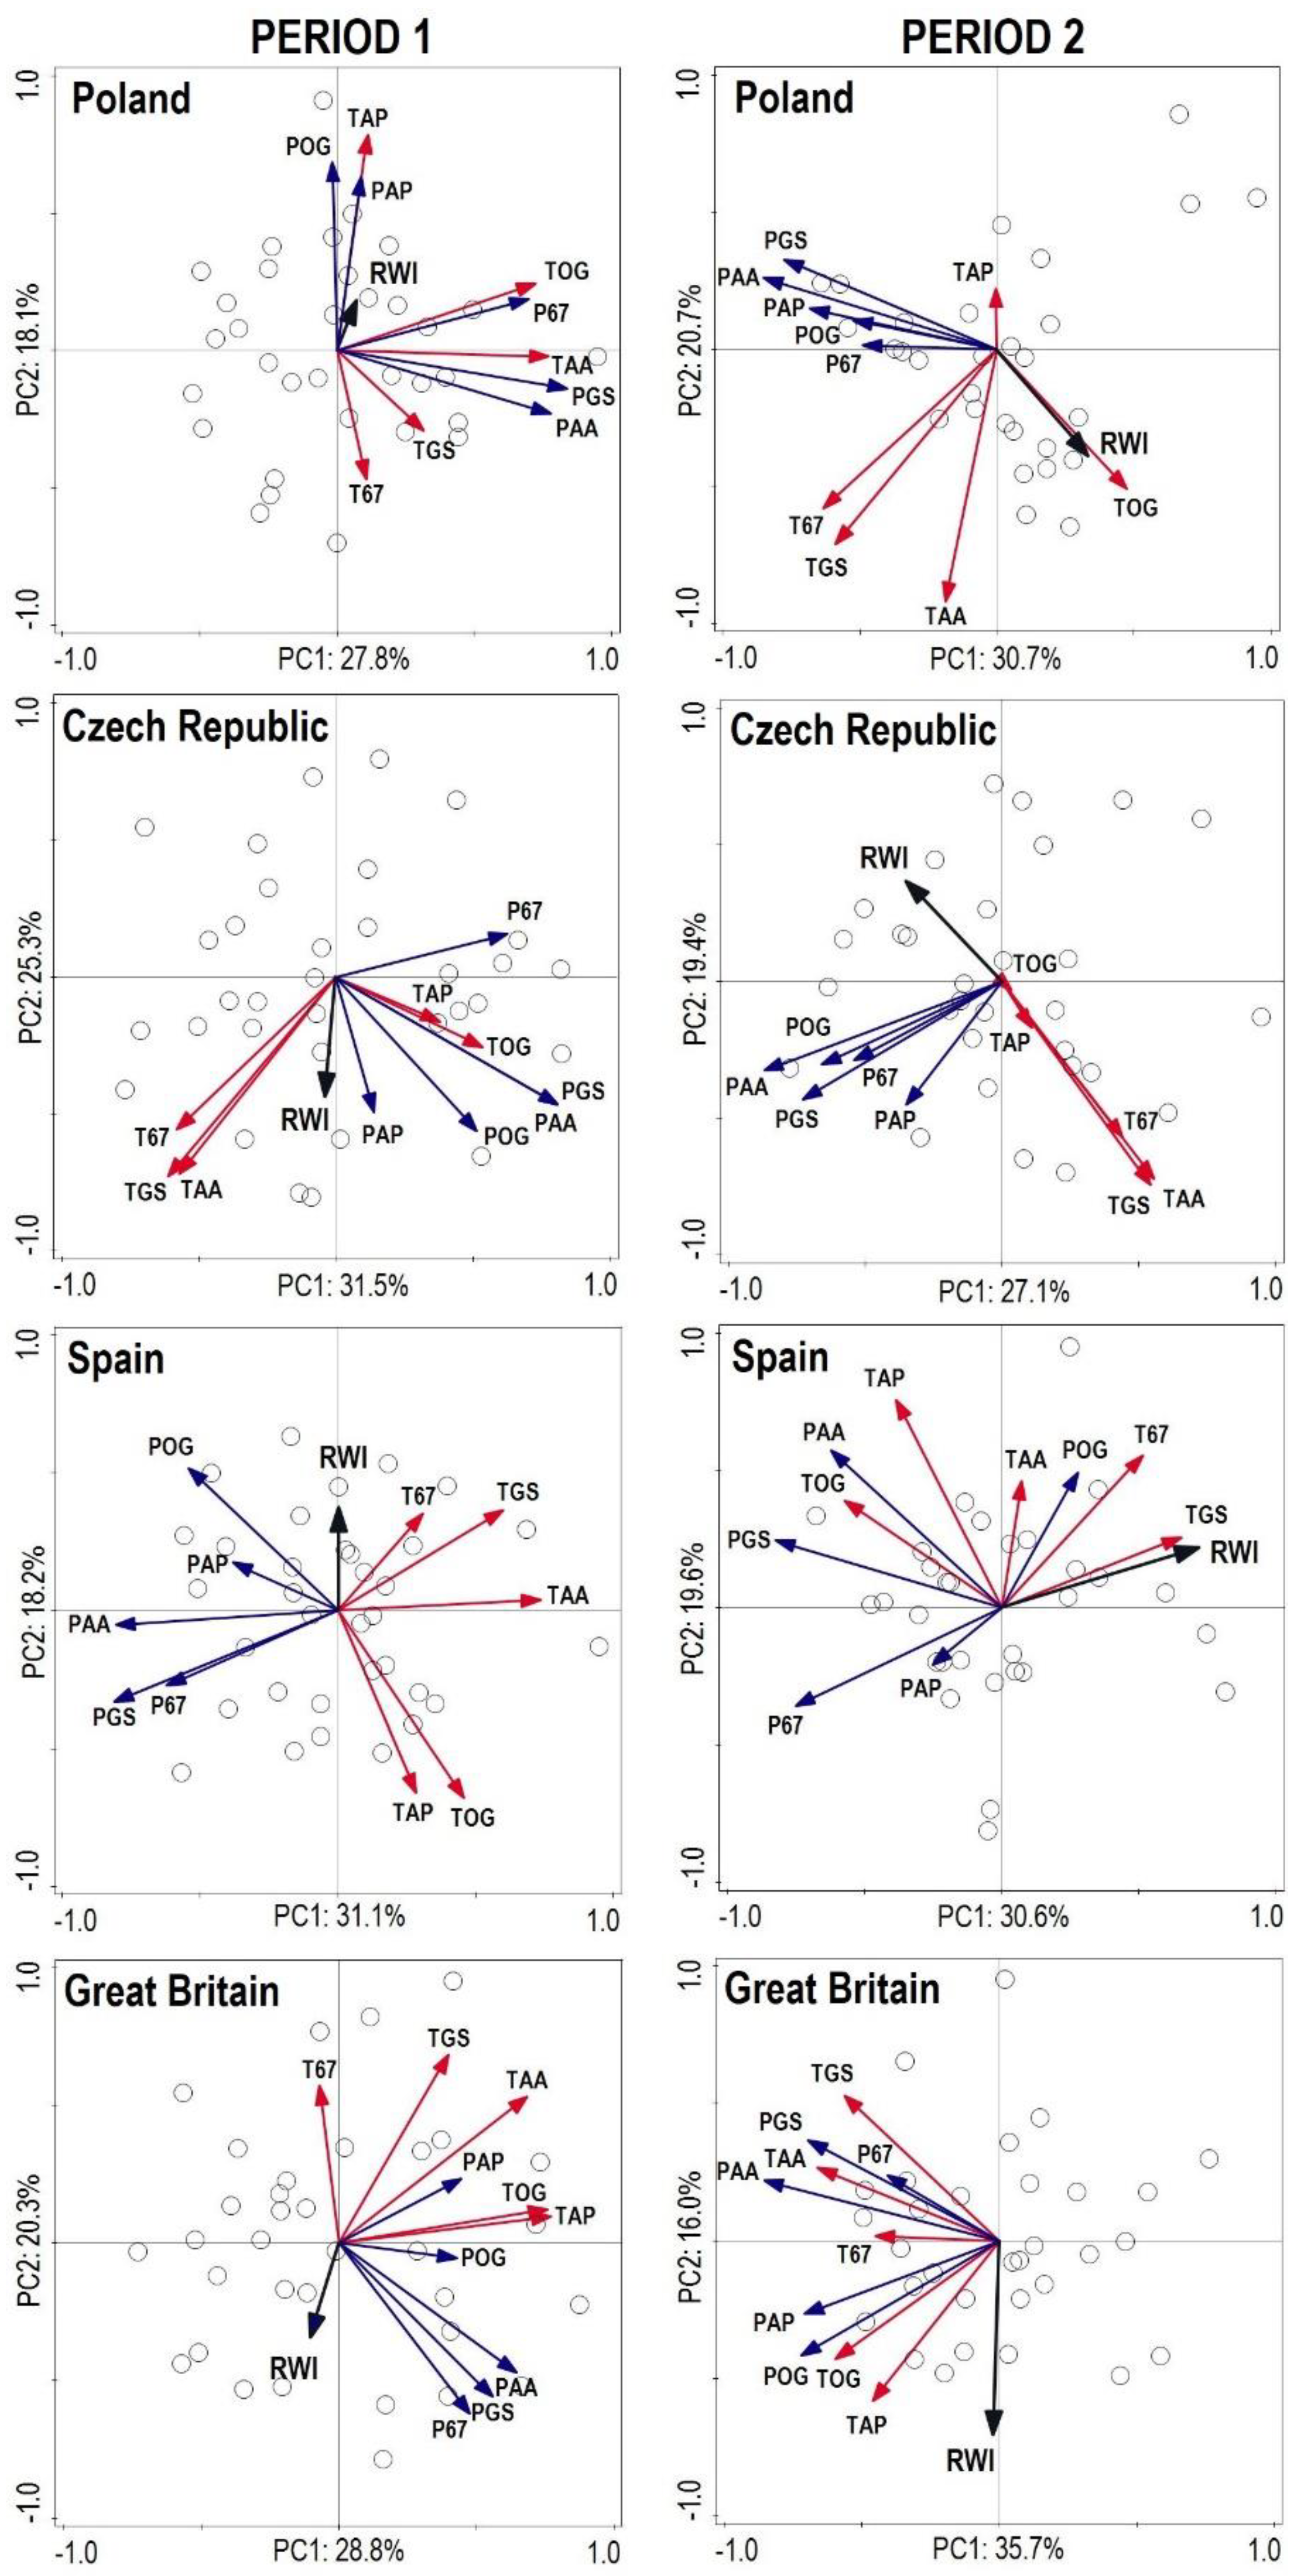
 from each record were relatively distant from one another, except for Great Britain and the Czech Republic (similarity between the two countries). The lower part of the diagram was typical for stands with high structural and overall diversity, while the upper part of the graph represents areas with a high production potential and carbon sequestration.
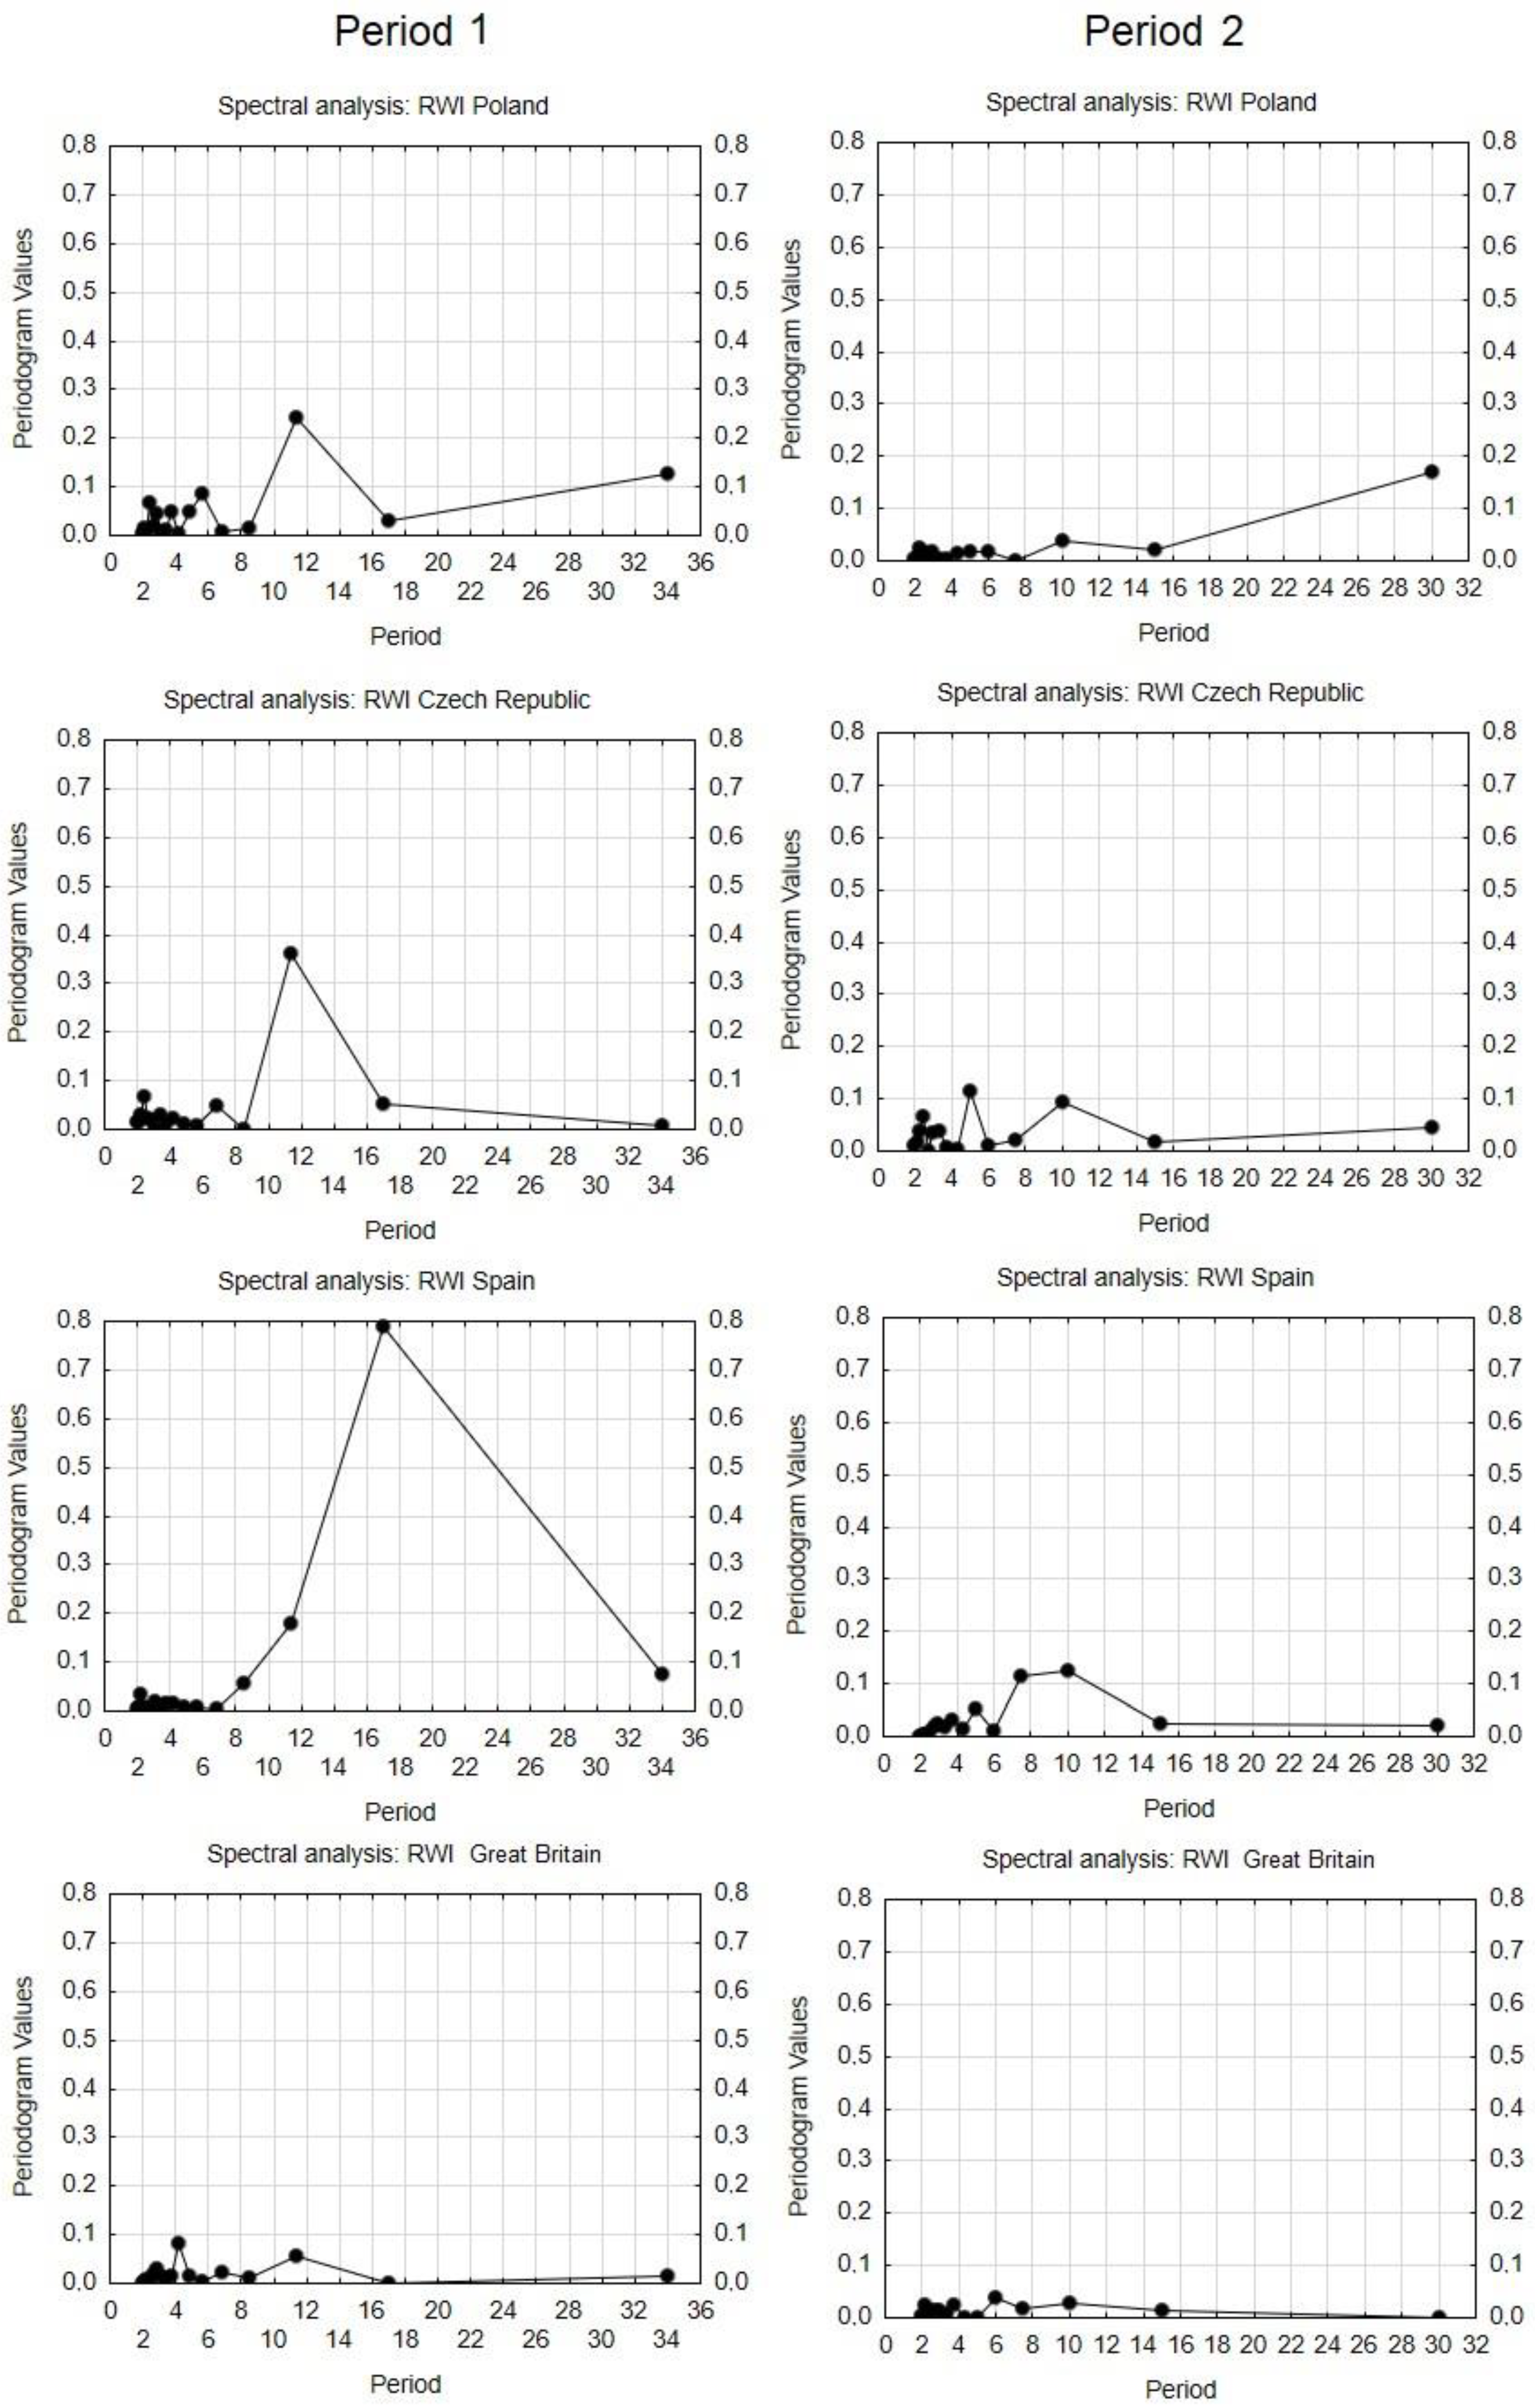
3.4. Dynamics and Spectral Analysis of Radial Growth
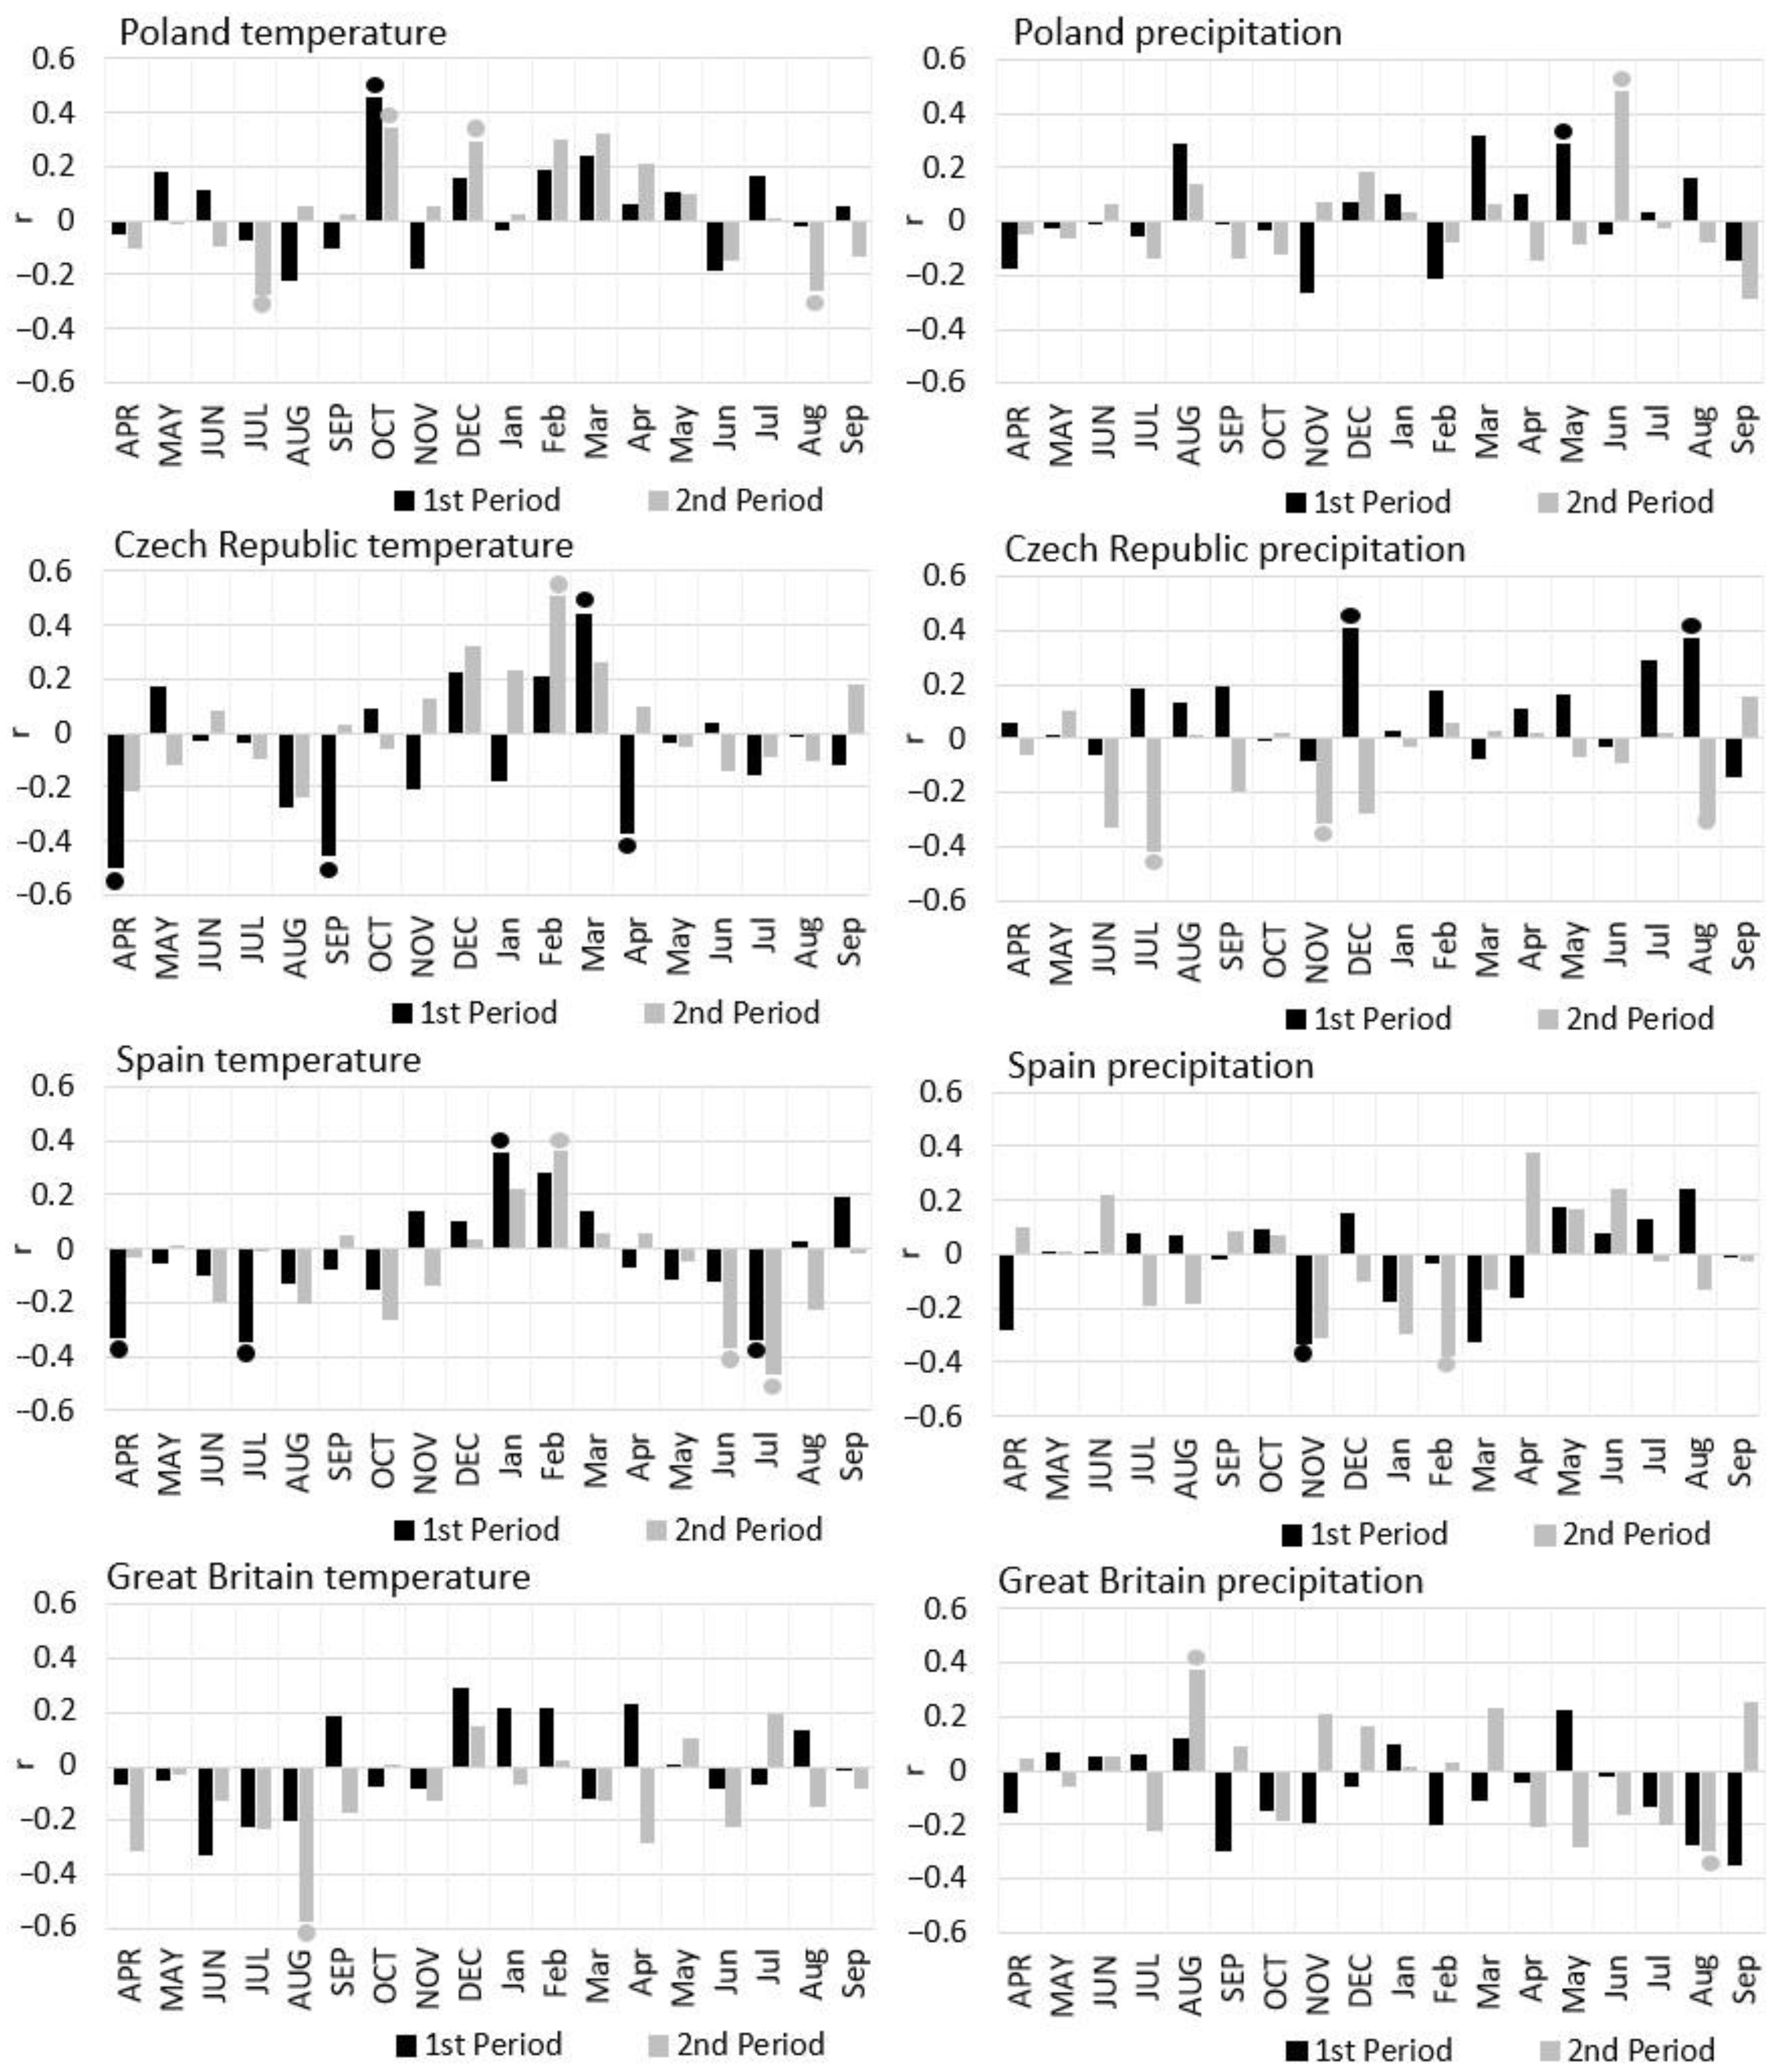
3.5. Effect of Temperature and Precipitation on Radial Growth
4. Discussion
4.1. Stand Production
4.2. Stand Structure
4.3. The Effect of Climate on the Radial Growth of Pine
4.4. Cyclic Tree-Ring Growth of Pine Trees
5. Conclusions
Author Contributions
Funding
Data Availability Statement
Acknowledgments
Conflicts of Interest
References
- Füssel, E.M. Climate Change, Impacts and Vulnerability in Europe 2016; European Environment Agency: Copenhagen, Denmark, 2016.
- Seidl, R.; Thom, D.; Kautz, M.; Martin-Benito, D.; Peltoniemi, M.; Vacchiano, G.; Wild, J.; Ascoli, D.; Petr, M.; Honkaniemi, J.; et al. Forest disturbances under climate change. Nat. Clim. Chang. 2017, 7, 395–402. [Google Scholar] [CrossRef] [PubMed]
- IPCC. Climate Change and Land: An IPCC Special Report. Climate Change and Land: An IPCC Special Report on Climate Change, Desertification, Land Degradation, Sustainable Land Management, Food Security, and Greenhouse Gas Fluxes in Terrestrial Ecosystems; IPCC: Geneva, Switzerland, 2019. [Google Scholar]
- Hassan, W.H.; Nile, B.K. Climate change and predicting future temperature in Iraq using CanESM2 and HadCM3 modeling. Model. Earth Syst. Environ. 2021, 7, 737–748. [Google Scholar] [CrossRef]
- Allen, C.D.; Macalady, A.K.; Chenchouni, H.; Bachelet, D.; McDowell, N.; Vennetier, M.; Kitzberger, T.; Rigling, A.; Breshears, D.D.; Hogg, E.H.; et al. A global overview of drought and heat-induced tree mortality reveals emerging climate change risks for forests. For. Ecol. Manag. 2010, 259, 660–684. [Google Scholar] [CrossRef]
- Wermelinger, B.; Rigling, A.; Schneider Mathis, D.; Dobbertin, M. Assessing the role of bark- and wood-boring insects in the decline of Scots pine (Pinus sylvestris L.) in the Swiss Rhone valley. Ecol. Entomol. 2008, 33, 239–249. [Google Scholar] [CrossRef]
- Lundqvist, L.; Ahlström, M.A.; Axelsson, P.; Mörling, T.; Valinger, E. Multi-layered Scots pine forests in boreal Sweden result from mass regeneration and size stratification. For. Ecol. Manag. 2019, 441, 176–181. [Google Scholar] [CrossRef]
- Sánchez-Salguero, R.; Navarro-Cerrillo, R.M.; Camarero, J.J.; Fernández-Cancio, Á. Selective drought-induced decline of pine species in southeastern Spain. Clim. Chang. 2012, 113, 767–785. [Google Scholar] [CrossRef]
- Camarero, J.J.; Gazol, A.; Sangüesa-Barreda, G.; Oliva, J.; Vicente-Serrano, S.M. To die or not to die: Early warnings of tree dieback in response to a severe drought. J. Ecol. 2015, 103, 44–57. [Google Scholar] [CrossRef]
- Šrámek, V.; Hellebrandová, K.N. Mapy ohrožení smrkových porostů suchem jako nástroj identifikace rizikových oblastí: Odborné sdělení. Zpravy Lesn. Vyzk. 2016, 61, 305–309. [Google Scholar]
- Gao, Y.; Markkanen, T.; Aurela, M.; Mammarella, I.; Thum, T.; Tsuruta, A.; Yang, H.; Aalto, T. Response of water use efficiency to summer drought in a boreal Scots pine forest in Finland. Biogeosciences 2017, 14, 4409–4422. [Google Scholar] [CrossRef]
- Buras, A.; Schunk, C.; Zeitrg, C.; Herrmann, C.; Kaiser, L.; Lemme, H.; Straub, C.; Taeger, S.; Gößwein, S.; Klemmt, H.J.; et al. Are Scots pine forest edges particularly prone to drought-induced mortality? Environ. Res. Lett. 2018, 13, 025001. [Google Scholar] [CrossRef]
- Etzold, S.; Ziemińska, K.; Rohner, B.; Bottero, A.; Bose, A.K.; Ruehr, N.K.; Zingg, A.; Rigling, A. One century of forest monitoring data in Switzerland reveals species- and site-specific trends of climate-induced tree mortality. Front. Plant. Sci. 2019, 10, 307. [Google Scholar] [CrossRef]
- Brichta, J.; Vacek, S.; Vacek, Z.; Cukor, J.; Mikeska, M.; Bílek, L.; Štefančík, I. Importance and potential of Scots pine in 21 century. Cent. Eur. For. J. 2023, 69, 3–20. [Google Scholar]
- Oberhuber, W. The role of climate in the mortality of Scots pine (Pinus sylvestris L.) exposed to soil dryness. Dendrochronologia 2001, 19, 45–55. [Google Scholar]
- Bigler, C.; Bräker, O.U.; Bugmann, H.; Dobbertin, M.; Rigling, A. Drought as an inciting mortality factor in Scots pine stands of the Valais, Switzerland. Ecosystems 2006, 9, 330–343. [Google Scholar] [CrossRef]
- Spinoni, J.; Vogt, J.; Naumann, G.; Barbosa, P.; Dosio, A. Will drought events become more frequent and severe in Europe? Int. J. Climatol. 2018, 38, 1718–1736. [Google Scholar] [CrossRef]
- Flexas, J.; Medrano, H. Drought-inhibition of photosynthesis in C3 plants: Stomatal and non-stomatal limitations revisited. Ann. Bot. 2002, 89, 183–189. [Google Scholar] [CrossRef]
- Reddy, A.R.; Chaitanya, K.V.; Vivekanandan, M. Drought-induced responses of photosynthesis and antioxidant metabolism in higher plants. J. Plant. Physiol. 2004, 161, 1189–1202. [Google Scholar] [CrossRef]
- Gruber, A.; Strobl, S.; Veit, B.; Oberhuber, W. Impact of drought on the temporal dynamics of wood formation in Pinus sylvestris (L.). Tree Physiol. 2010, 30, 490–501. [Google Scholar] [CrossRef]
- Dobbertin, M.; Wermelinger, B.; Bigler, C.; Bürgi, M.; Carron, M.; Forster, B.; Gimmi, U.; Rigling, A. Linking increasing drought stress to Scots pine mortality and bark beetle infestations. Sci. World J. 2007, 7, 231–239. [Google Scholar] [CrossRef] [PubMed]
- Aguadé, D.; Poyatos, R.; Gómez, M.; Oliva, J.; Martínez-Vilalta, J. The role of defoliation and root rot pathogen infection in driving the mode of drought-related physiological decline in Scots pine (Pinus sylvestris L.). Tree Physiol. 2015, 35, 229–242. [Google Scholar] [CrossRef]
- Rigling, A.; Eilmann, B.; Koechli, R.; Dobbertin, M. Mistletoe-induced crown degradation in Scots pine in a xeric environment. Tree Physiol. 2010, 30, 845–852. [Google Scholar] [CrossRef] [PubMed]
- Zweifel, R.; Bangerter, S.; Rigling, A.; Sterck, F.J. Pine and mistletoes: How to live with a leak in the water flow and storage system? J. Exp. Bot. 2012, 63, 2565–2578. [Google Scholar] [CrossRef]
- Mutlu, S.; Osma, E.; Ilhan, V.; Turkoglu, H.I.; Atici, O. Mistletoe (Viscum album) reduces the growth of the Scots pine by accumulating essential nutrient elements in its structure as a trap. Trees Struct. Funct. 2016, 30, 815–824. [Google Scholar] [CrossRef]
- Vilà-Cabrera, A.; Rodrigo, A.; Martínez-Vilalta, J.; Retana, J. Lack of regeneration and climatic vulnerability to fire of Scots pine may induce vegetation shifts at the southern edge of its distribution. J. Biogeogr. 2012, 39, 488–496. [Google Scholar] [CrossRef]
- Castagneri, D.; Bottero, A.; Motta, R.; Vacchiano, G. Repeated spring precipitation shortage alters individual growth patterns in Scots pine forests in the Western Alps. Trees Struct. Funct. 2015, 29, 1699–1712. [Google Scholar] [CrossRef]
- Vacek, S.; Vacek, Z.; Bílek, L.; Simon, J.; Remeš, J.; Hůnová, I.; Král, J.; Putalová, T.; Mikeska, M. Structure, regeneration, and growth of Scots pine (Pinus sylvestris L.) stands with respect to changing climate and environmental pollution. Silva Fenn. 2016, 50, 1564. [Google Scholar] [CrossRef]
- Woziwoda, B.; Krzyżanowska, A.; Dyderski, M.K.; Jagodziński, A.M.; Stefańska-Krzaczek, E. Propagule pressure, presence of roads, and microsite variability influence dispersal of introduced Quercus rubra in temperate Pinus sylvestris forest. For. Ecol. Manag. 2018, 428, 35–45. [Google Scholar] [CrossRef]
- Leuschner, C.; Förster, A.; Diers, M.; Culmsee, H. Are northern German Scots pine plantations climate smart? The impact of large-scale conifer planting on climate, soil and the water cycle. For. Ecol. Manag. 2022, 507, 120013. [Google Scholar] [CrossRef]
- Brabec, P.; Brichta, J.; Vacek, Z.; Vacek, S.; Šimůnek, V.; Hájek, V. Potential of mixed Picea abies (L.) Karst. and Pinus sylvestris (L.) forests in lowland areas of Central Bohemia. J. For. Sci. 2023, 69, 470–484. [Google Scholar] [CrossRef]
- O’Hara, K.L. What is close-to-nature silviculture in a changing world? Forestry 2016, 89, 1–6. [Google Scholar] [CrossRef]
- Giuggiola, A.; Bugmann, H.; Zingg, A.; Dobbertin, M.; Rigling, A. Reduction of stand density increases drought resistance in xeric Scots pine forests. For. Ecol. Manag. 2013, 310, 827–835. [Google Scholar] [CrossRef]
- Aleksandrowicz-Trzcińska, M.; Drozdowski, S.; Wołczyk, Z.; Bielak, K.; Zybura, H. Effects of reforestation and site preparation methods on early growth and survival of Scots pine (Pinus sylvestris L.) in South-Eastern Poland. Forests 2017, 8, 421. [Google Scholar] [CrossRef]
- Ameztegui, A.; Cabon, A.; de Cáceres, M.; Coll, L. Managing stand density to enhance the adaptability of Scots pine stands to climate change: A modelling approach. Ecol. Model. 2017, 356, 141–150. [Google Scholar] [CrossRef]
- Gessler, A.; Schaub, M.; McDowell, N.G. The role of nutrients in drought-induced tree mortality and recovery. New Phytol. 2017, 214, 513–520. [Google Scholar] [CrossRef] [PubMed]
- Hevia, A.; Sánchez-Salguero, R.; Camarero, J.J.; Querejeta, J.I.; Sangüesa-Barreda, G.; Gazol, A. Long-term nutrient imbalances linked to drought-triggered forest dieback. Sci. Total Environ. 2019, 690, 1254–1267. [Google Scholar] [CrossRef] [PubMed]
- Grossiord, C.; Granier, A.; Gessler, A.; Jucker, T.; Bonal, D. Does Drought Influence the Relationship between Biodiversity and Ecosystem Functioning in Boreal Forests? Ecosystems 2014, 17, 394–404. [Google Scholar] [CrossRef]
- Forrester, D.I.; Bonal, D.; Dawud, S.; Gessler, A.; Granier, A.; Pollastrini, M.; Grossiord, C. Drought responses by individual tree species are not often correlated with tree species diversity in European forests. J. Appl. Ecol. 2016, 53, 1725–1734. [Google Scholar] [CrossRef]
- Bottero, A.; D’Amato, A.W.; Palik, B.J.; Bradford, J.B.; Fraver, S.; Battaglia, M.A.; Asherin, L.A. Density-dependent vulnerability of forest ecosystems to drought. J. Appl. Ecol. 2017, 54, 1605–1614. [Google Scholar] [CrossRef]
- Valladares, F.; Matesanz, S.; Guilhaumon, F.; Araújo, M.B.; Balaguer, L.; Benito-Garzón, M.; Cornwell, W.; Gianoli, E.; van Kleunen, M.; Naya, D.E.; et al. The effects of phenotypic plasticity and local adaptation on forecasts of species range shifts under climate change. Ecol. Lett. 2014, 17, 1351–1364. [Google Scholar] [CrossRef]
- Granda, E.; Gazol, A.; Camarero, J.J. Functional diversity differently shapes growth resilience to drought for co-existing pine species. J. Veg. Sci. 2018, 29, 265–275. [Google Scholar] [CrossRef]
- Serra-Maluquer, X.; Mencuccini, M.; Martínez-Vilalta, J. Changes in tree resistance, recovery and resilience across three successive extreme droughts in the northeast Iberian Peninsula. Oecologia 2018, 187, 343–354. [Google Scholar] [CrossRef] [PubMed]
- Linares, J.C.; Tíscar, P.A. Climate change impacts and vulnerability of the southern populations of Pinus nigra subsp. salzmannii. Tree Physiol. 2010, 30, 795–806. [Google Scholar] [CrossRef] [PubMed]
- Uria-Diez, J.; Pommerening, A. Crown plasticity in Scots pine (Pinus sylvestris L.) as a strategy of adaptation to competition and environmental factors. Ecol. Model. 2017, 356, 117–126. [Google Scholar] [CrossRef]
- Rouvinen, S.; Kuuluvainen, T. Structure and asymmetry of tree crowns in relation to local competition in a natural mature Scots pine forest. Can. J. For. Res. 1997, 27, 890–902. [Google Scholar] [CrossRef]
- Ikonen, V.P.; Kellomäki, S.; Peltola, H. Sawn timber properties of Scots pine as affected by initial stand density, thinning and pruning: A simulation based approach. Silva Fenn. 2009, 43, 411–431. [Google Scholar] [CrossRef]
- del Río Gaztelurrutia, M.; Bravo-Oviedo, A.; Pretzsch, H.; Löf, M.; Ruiz-Peinado, R. A review of thinning effects on Scots pine stands: From growth and yield to new challenges under global change. For. Syst. 2017, 26, eR03S. [Google Scholar] [CrossRef]
- Heike, K. Encyklopedie Jehličnatých Stromů a Keřů, 3rd ed.; CPress: Brno, Czech Republic, 2022. [Google Scholar]
- Gayer, K. Der gemischte Wald, seine Begründung und Pflege, insbesondere durch Horst- und Gruppenwirtschaft. In Der gemischte Wald, Seine Begründung und Pflege, Insbesondere Durch Horst- und Gruppenwirtschaft; P. Parey: Berlin, Germany, 1886. [Google Scholar] [CrossRef]
- Mielikäinen, K.; Timonen, M. Growth Trends of Scots Pine (Pinus sylvestris L.) in Unmanaged and Regularly Managed Stands in Southern and Central Finland. In Growth Trends in European Forests: Studies from 12 Countries; Springer: Berlin/Heidelberg, Germany, 1996. [Google Scholar] [CrossRef]
- Bílek, L.; Remeš, J.; Švec, O.; Vacek, Z.; Štícha, V.; Vacek, S.; Javůrek, P. Ekologicky Orientované Pěstování Borových Porostů v Podmínkách Nižších až Středních Poloh: Certifikovaná Metodika; Lesnický Průvodce; VÚLHM: Jíloviště-Strnady, Czech Republic, 2017; Volume 9. [Google Scholar]
- Vacek, S.; Vacek, Z.; Remeš, J.; Bílek, L.; Hůnová, I.; Bulušek, D.; Putalová, T.; Král, J.; Simon, J. Sensitivity of unmanaged relict pine forest in the Czech Republic to climate change and air pollution. Trees 2017, 31, 1599–1617. [Google Scholar] [CrossRef]
- Stefańska-Krzaczek, E.; Staniaszek-Kik, M.; Szczepańska, K.; Szymura, T.H. Species diversity patterns in managed Scots pine stands in ancient forest sites. PLoS ONE 2019, 14, e0219620. [Google Scholar] [CrossRef]
- Brichta, J.; Bílek, L.; Linda, R.; Vítámvás, J. Does shelterwood regeneration on natural Scots pine sites under changing environmental conditions represent a viable alternative to traditional clear-cut management? For. J. 2020, 66, 104–115. [Google Scholar] [CrossRef]
- Stagge, J.H.; Kingston, D.G.; Tallaksen, L.M.; Hannah, D.M. Observed drought indices show increasing divergence across Europe. Sci. Rep. 2017, 7, 14045. [Google Scholar] [CrossRef]
- Vacek, Z.; Vacek, S.; Cukor, J. European forests under global climate change: Review of tree growth processes, crises and management strategies. J. Environ. Manag. 2023, 332, 117353. [Google Scholar] [CrossRef] [PubMed]
- Arkle, J.; Nixon, C. Structure and growth characteristics of Scots pine (Pinus sylvestris L.) in long-term monitoring plots within the Black Wood of Rannoch native pinewood. Scott. For. 1996, 50, 145–150. [Google Scholar]
- Edwards, C.; Mason, W.L. Stand structure and dynamics of four native Scots pine (Pinus sylvestris L.) woodlands in northern Great Britain. Forestry 2006, 79, 261–277. [Google Scholar] [CrossRef]
- Montes, F.; Sanchez, M.; del Rio, M.; Canellas, I. Using historic management records to characterize the effects of management on the structural diversity of forests. For. Ecol. Manag. 2005, 207, 279–293. [Google Scholar] [CrossRef]
- Pardos, M.; Pérez, S.; Calama, R.; Alonso, R.; Lexer, M.J. Ecosystem service provision, management systems and climate change in Valsaín forest, central Spain. Reg. Environ. Chang. 2017, 17, 17–32. [Google Scholar] [CrossRef]
- Madrigal-González, J.; Ballesteros-Cánovas, J.A.; Zavala, M.A.; Morales-Molino, C.; Stoffel, M. Forest stocks control long-term climatic mortality risks in Scots pine dry-edge forests. Ecosphere 2020, 11, e03201. [Google Scholar] [CrossRef]
- Köppen, A. Das geographica System der Klimate. In Handbuch der Klimatologie; Köppen, W., Geier, G., Gebr, C., Eds.; Verlag von Gebrüder Borntraeger: Berlin, Germany, 1936; pp. 1–44. [Google Scholar]
- George, S.S. An overview of tree-ring width records across the Northern Hemisphere. Quat. Sci. Rev. 2014, 95, 132–150. [Google Scholar] [CrossRef]
- Di Filippo, A.; Biondi, F.; Čufar, K.; De Luis, M.; Grabner, M.; Maugeri, M.; Piovesan, G. Bioclimatology of beech (Fagus sylvatica L.) in the Eastern Alps: Spatial and altitudinal climatic signals identified through a tree-ring network. J. Biogeogr. 2007, 34, 1873–1892. [Google Scholar] [CrossRef]
- Tumajer, J.; Altman, J.; Štěpánek, P.; Treml, V.; Doležal, J.; Cienciala, E. Increasing moisture limitation of Norway spruce in Central Europe revealed by forward modelling of tree growth in tree-ring network. Agric. For. Meteorol. 2017, 247, 56–64. [Google Scholar] [CrossRef]
- Rodwell, J.S.; Cooper, E.A. Scottish pinewoods in a European context. In Our Pine Wood Heritage; Aldhous, J.R., Ed.; Forestry Commission, The Royal Society for the Protection of Birds, Scottish Natural Heritage: Inverness, UK, 1995; pp. 4–22. [Google Scholar]
- Kraft, G. Beiträgezur zur Lehre von den Durchforstungen, Schlagstellungen und Lichtungshieben; Klindworth’s Verlag: Hanover, Germany, 1884. [Google Scholar]
- Met Office. Met Office Gridded Land Surface Climate Observations—Monthly Climate Variables at 5 km Resolution; Met Office: Exeter, UK, 2017. [Google Scholar]
- Perry, M.; Hollis, D. The generation of monthly gridded datasets for a range of climatic variables over the UK. Int. J. Clim. 2005, 25, 1041–1054. [Google Scholar] [CrossRef]
- Fabrika, M.; Ďurský, J. Algorithms and software solution of thinning models for SIBYLA growth simulator. For. Sci. J. 2005, 51, 431–445. [Google Scholar] [CrossRef]
- Clark, P.J.; Evans, F.C. Distance to Nearest Neighbor as a Measure of Spatial Relationships in Populations. Ecology 1954, 35, 445–453. [Google Scholar] [CrossRef]
- Pretzsch, H. Wissen nutzbar machen für das Management von Waldökosystemen. Allg. Forstz. Wald. 2006, 61, 1158–1159. [Google Scholar]
- Füldner, K. Strukturbeschreibung in Mischbeständen. Forestarchiv 1995, 66, 235–606. [Google Scholar]
- Jaehne, S.; Dohrenbusch, A. Ein Verfahren zur Beurteilung der Bestandesdiversität. Forstwiss. Cent. 1997, 116, 333–345. [Google Scholar] [CrossRef]
- Petráš, R.; Pajtík, J.C. Sústava česko-slovenských objemových tabuliek drevín. Lesn. Časopis 2005, 37, 49–56. [Google Scholar]
- Seifert, T.; Schuck, J.; Block, J.; Pretzsch, H. Simulation von Biomasse- und Nährstoffgehalt von Waldbäumen. Beiträge Jahrestag. Vom 2006, 29, 31. [Google Scholar]
- Drexhage, M.; Colin, F. Estimating root system biomass from breast-height diameters. Forestry 2001, 74, 491–497. [Google Scholar] [CrossRef]
- Bublinec, E. Koncentrácia, Akumulácia a Kolobeh Prvkov v Bukovom a Smrekovom Ekosystéme; Acta Dendrobiologica; Ústav Ekológie Lesa Slovenskej Akadémie Vied: Zvolen, Slovakia, 1994; 85p. [Google Scholar]
- Reineke, L.H. Perfecting a stand-density index for even-aged forests. J. Agric. Res. 1933, 46, 627–638. [Google Scholar]
- Crookston, N.L.; Stage, A.R. Percent Canopy Cover and Stand Structure Statistics from the Forest Vegetation Simulator; US Department of Agriculture, Forest Service, Rocky Mountain Research Station: Fort Collins, CO, USA, 2000.
- Team R Core. A Language and Environment for Statistical Computing; R Foundation for Statistical Computing: Vienna, Austria, 2018. [Google Scholar]
- Bunn, A.; Korpela, M.; Biondi, F.; Campelo, F.; Mérian, P.; Qeadan, F.; Zang, C.; Pucha-Cofrep, D.; Wernicke, J. An Introduction to dplR; R Foundation for Statistical Computing: Vienna, Austria, 2018. [Google Scholar]
- Bunn, A. Chronology Building in dplR; R Foundation for Statistical Computing: Vienna, Austria, 2018; pp. 1–13. [Google Scholar]
- Cook, E.R.; Shiyatov, S.G.; Mazepa, V.S.; Ecology, A.; Branch, U. Methods of Dendrochronology Applications; Cook, E.R., Kairiukstis, L.A., Eds.; Tree-Ring Laboratory, Lamont-Ooherty Geological Observatory, Columbia University: New York, NY, USA, 1990; p. 393. [Google Scholar] [CrossRef]
- Fritts, H.C. Tree Rings and Climate; Academic Press: London, UK, 1976; p. 567. [Google Scholar]
- Shumilov, O. QUANOMAL-Quantifying the Past View project with no project belong to View project. Int. J. Environ. Res. 2011. Available online: https://www.researchgate.net/publication/259079262 (accessed on 1 December 2011).
- Shumilov, O.; Kasatkina, E.A.; Mielikainen, K.; Timonen, M.; Kanatjev, A.G. Palaeovolcanos, Solar activity and pine tree-rings from the Kola Peninsula (northwestern Russia) over the last 560 years Palaeovolcanos. Int. J. Environ. Res. 2011, 5, 855–864. [Google Scholar]
- Biondi, F.; Waikul, K. DENDROCLIM2002: AC++ program for statistical calibration of climate signals in tree-ring chronologies. Comput. Geosci. 2004, 30, 303–311. [Google Scholar] [CrossRef]
- StatSoft Inc. Statistica Electronic Manual; StatSoft Inc.: Tulsa, OC, USA, 2013. [Google Scholar]
- Speer, J.H. Fundamentals of Tree-Ring Research; University of Arizona Press: Tucson, AZ, USA, 2010; Volume 26, pp. 453–455. [Google Scholar] [CrossRef]
- Schweingruber, F.H.; Eckstein, D.; Serre-Bachet, F.; Bräker, O.U. Identification, presentation and interpretation of event years and pointer years in dendrochronology. Dendrochronolgia 1990, 8, 9–38. [Google Scholar]
- Desplanque, C.; Rolland, C.; Schweingruber, F.H. Influence of species and abiotic factors on extreme tree ring modulation: Picea abies and Abies alba in Tarentaise and Maurienne (French Alps). Trees 1999, 13, 218–227. [Google Scholar] [CrossRef]
- Šmilauer, P.; Lepš, J. Multivariate Analysis of Ecological Data Using CANOCO 5; Cambridge University Press: Cambridge, UK, 2014. [Google Scholar]
- Mason, W.L.; Connolly, T.; Pommerening, A.; Edwards, C. Spatial structure of semi-natural and plantation stands of Scots pine (Pinus sylvestris L.) in northern Great Britain. Forestry 2007, 80, 567–586. [Google Scholar] [CrossRef]
- Vacek, S.; Vacek, Z.; Bílek, L.; Remeš, J.; Hůnová, I.; Bulušek, D.; Král, J.; Brichta, J. Stand dynamics in natural Scots pine forests as a model for adaptation management? Dendrobiology 2019, 82, 24–42. [Google Scholar] [CrossRef]
- Ruiz-Peinado, R.; Pretzsch, H.; Löf, M.; Heym, M.; Bielak, K.; Aldea, J.; Barbeito, I.; Brazaitis, G.; Drössler, L.; Godvod, K.; et al. Mixing effects on Scots pine (Pinus sylvestris L.) and Norway spruce (Picea abies (L.) Karst.) productivity along a climatic gradient across Europe. For. Ecol. Manag. 2021, 482, 118834. [Google Scholar] [CrossRef]
- Bielak, K.; Dudzińska, M.; Pretzsch, H. Mixed stands of Scots pine (Pinus sylvestris L.) and Norway spruce (Picea abies (L.) Karst.) can be more productive than monocultures. Evidence from over 100 years of observation of long-term experiments. For. Syst. 2014, 23, 573–589. [Google Scholar] [CrossRef]
- Podrázský, V.; Vacek, Z.; Vacek, S.; Vítámvás, J.; Gallo, J.; Prokůpková, A.; D’Andrea, G. Production potential and structural variability of pine stands in the Czech Republic: Scots pine (Pinus sylvestris L.) vs. introduced pines—Case study and problem review. J. For. Sci. 2020, 66, 197–207. [Google Scholar] [CrossRef]
- Vacek, Z.; Cukor, J.; Vacek, S.; Linda, R.; Prokůpková, A.; Podrázský, V.; Gallo, J.; Vacek, O.; Šimůnek, V.; Drábek, O.; et al. Production potential, biodiversity and soil properties of forest reclamations: Opportunities or risk of introduced coniferous tree species under climate change? Eur. J. For. Res. 2021, 140, 1243–1266. [Google Scholar] [CrossRef]
- Vacek, Z.; Linda, R.; Cukor, J.; Vacek, S.; Šimůnek, V.; Gallo, J.; Vančura, K. Scots pine (Pinus sylvestris L.), the suitable pioneer species for afforestation of reclamation sites? For. Ecol. Manag. 2021, 485, 118951. [Google Scholar] [CrossRef]
- Förster, A.; Culmsee, H.; Leuschner, C. Thinned northern German Scots pine forests have a low carbon storage and uptake potential in comparison to naturally developing beech forests. For. Ecol. Manag. 2021, 479, 118–575. [Google Scholar] [CrossRef]
- Jagodziński, A.M.; Dyderski, M.K.; Gęsikiewicz, K.; Horodecki, P.; Cysewska, A.; Wierczyńska, S.; Maciejczyk, K. How do tree stand parameters affect young Scots pine biomass?—Allometric equations and biomass conversion and expansion factors. For. Ecol. Manag. 2018, 409, 74–83. [Google Scholar] [CrossRef]
- Szmyt, J.; Tarasiuk, S. Species-specific spatial structure, species coexistence and mortality pattern in natural, uneven-aged Scots pine (Pinus sylvestris L.)-dominated forest. Eur. J. For. Res 2018, 137, 1–16. [Google Scholar] [CrossRef]
- Ruiz-Benito, P.; Lines, E.R.; Gómez-Aparicio, L.; Zavala, M.A.; Coomes, D.A. Patterns and Drivers of Tree Mortality in Iberian Forests: Climatic Effects Are Modified by Competition. PLoS ONE 2013, 8, e56843. [Google Scholar] [CrossRef]
- Maltamo, M.; Kangas, A.; Uuttera, J.; Torniainen, T.; Saramäki, J. Comparison of percentile based prediction methods and the Weibull distribution in describing the diameter distribution of heterogeneous Scots pine stands. For. Ecol. Manag. 2000, 133, 263–274. [Google Scholar] [CrossRef]
- Barbeito, I.; Cañellas, I.; Montes, F. Evaluating the behaviour of vertical structure indices in Scots pine forests. Ann. For. Sci. 2009, 66, 710. [Google Scholar] [CrossRef]
- Vitas, A. Influence of droughts to the radial growth of Scots pine (Pinus sylvestris L.). Ekológia 2008, 27, 367–378. [Google Scholar]
- Dauškane, I.; Brūmelis, G.; Elferts, D. Effect of climate on extreme radial growth of Scots pine growing on bogs in Latvia. Est. J. Ecol. 2011, 60, 236. [Google Scholar] [CrossRef]
- Martínez-Vilalta, J.; López, B.C.; Loepfe, L.; Lloret, F. Stand- and tree-level determinants of the drought response of Scots pine radial growth. Oecologia 2012, 168, 877–888. [Google Scholar] [CrossRef]
- Macias, M.; Timonen, M.; Kirchhefer, A.J.; Lindholm, M.; Eronen, M.; Gutiérrez, E. Growth variability of Scots pine (Pinus sylvestris L.) along a west-east gradient across northern Fennoscandia: A dendroclimatic approach. Arct. Antarct. Alp. Res. 2004, 36, 565–574. [Google Scholar] [CrossRef]
- Dawson, A. So Foul and Fair a Day: A History of Great Britain’s Weather and Climate; Birlinn: Edinburgh, UK, 2009. [Google Scholar]
- Palter, J.B. The role of the gulf stream in European climate. Annu. Rev. Mar. Sci. 2015, 7, 113–137. [Google Scholar] [CrossRef] [PubMed]
- Grace, J.; Norton, D.A. Climate and Growth of Pinus sylvestris (L.) at Its Upper Altitudinal Limit in Great Britain: Evidence from Tree Growth-Rings. J. Ecol. 1990, 78, 601–610. [Google Scholar] [CrossRef]
- Aldea, J.; Ruiz-Peinado, R.; del Río, M.; Pretzsch, H.; Heym, M.; Brazaitis, G.; Jansons, A.; Metslaid, M.; Barbeito, I.; Bielak, K.; et al. Species stratification and weather conditions drive tree growth in Scots pine and Norway spruce mixed stands along Europe. For. Ecol. Manag. 2021, 481, 118697. [Google Scholar] [CrossRef]
- Lebedev, A.V. Changes in the growth of Scots pine (Pinus sylvestris L.) stands in an urban environment in European Russia since 1862. J. For. Res. 2023, 34, 1279–1287. [Google Scholar] [CrossRef]
- Kukarskih, V.V.; Devi, N.M.; Bubnov, M.O.; Komarova, A.V.; Agafonov, L.I. Radial growth of Scots pine in urban and rural populations of Ekaterinburg megalopolis. Dendrochronologia 2022, 74, 125974. [Google Scholar] [CrossRef]
- Sensuła, B.; Wilczyński, S. Records of Anthropogenic Pollution in Silesia Captured in Scots pine Tree Rings: Analysis by Radiocarbon, Stable Isotopes, and Basal Area Increment Analysis. Water Air Soil Poll. 2022, 233, 143. [Google Scholar] [CrossRef]
- Metslaid, M.; Köster, K.; Jõgiste, K.; Randveer, T.; Voolma, K.; Moser, W.K. The effect of simulated bark stripping by moose on Scots pine height growth: An experimental treatment. Balt. For. 2013, 19, 61–66. [Google Scholar]
- Matveev, S.M.; Chendev, Y.G.; Lupo, A.R.; Hubbart, J.A.; Timashchuk, D.A. Climatic Changes in the East-European Forest-Steppe and Effects on Scots Pine Productivity. Pure Appl. Geophys. 2017, 174, 427–443. [Google Scholar] [CrossRef]
- Tsonis, A.A.; Swanson, K.; Kravtsov, S. A new dynamical mechanism for major climate shifts. Geophys. Res. Lett. 2007, 34, 1–5. [Google Scholar] [CrossRef]
- Laurenz, L.; Lüdecke, H.J.; Lüning, S. Influence of solar activity changes on European rainfall. J. Atmos. Sol. Terr. Phys. 2019, 185, 29–42. [Google Scholar] [CrossRef]
- Lüdecke, H.J.; Cina, R.; Dammschneider, H.J.; Lüning, S. Decadal and multidecadal natural variability in European temperature. J. Atmos. Sol. Terr. Phy. 2020, 205, 105–294. [Google Scholar] [CrossRef]
- Šimůnek, V.; Hájek, V.; Prokůpková, A.; Gallo, J. Finding an imprint of solar and climatic cycles in tree rings of European beech (Fagus sylvatica L.). J. For. Sci. 2021, 67, 409–419. [Google Scholar] [CrossRef]
- Šimůnek, V.; Sharma, R.P.; Vacek, Z.; Vacek, S.; Hůnová, I. Sunspot area as unexplored trend inside radial growth of European beech in Krkonoše Mountains: A Forest Science from different perspective. Eur. J. For. Res. 2020, 139, 999–1013. [Google Scholar] [CrossRef]
- Šimůnek, V.; Vacek, Z.; Vacek, S.; Ripullone, F.; Hájek, V.; D’andrea, G. Tree rings of European beech (Fagus sylvatica L.) indicate the relationship with solar cycles during climate change in central and southern Europe. Forests 2021, 12, 259. [Google Scholar] [CrossRef]
- Komitov, B. The european beech annual tree ring widths time series, solar–climatic relationships and solar dynamo regime changes. Atmosphere 2021, 12, 829. [Google Scholar] [CrossRef]
- Ahmed, F.; Adnan, S.; Latif, M. Impact of jet stream and associated mechanisms on winter precipitation in Pakistan. Meteorol. Atmos. Phys. 2020, 132, 225–238. [Google Scholar] [CrossRef]

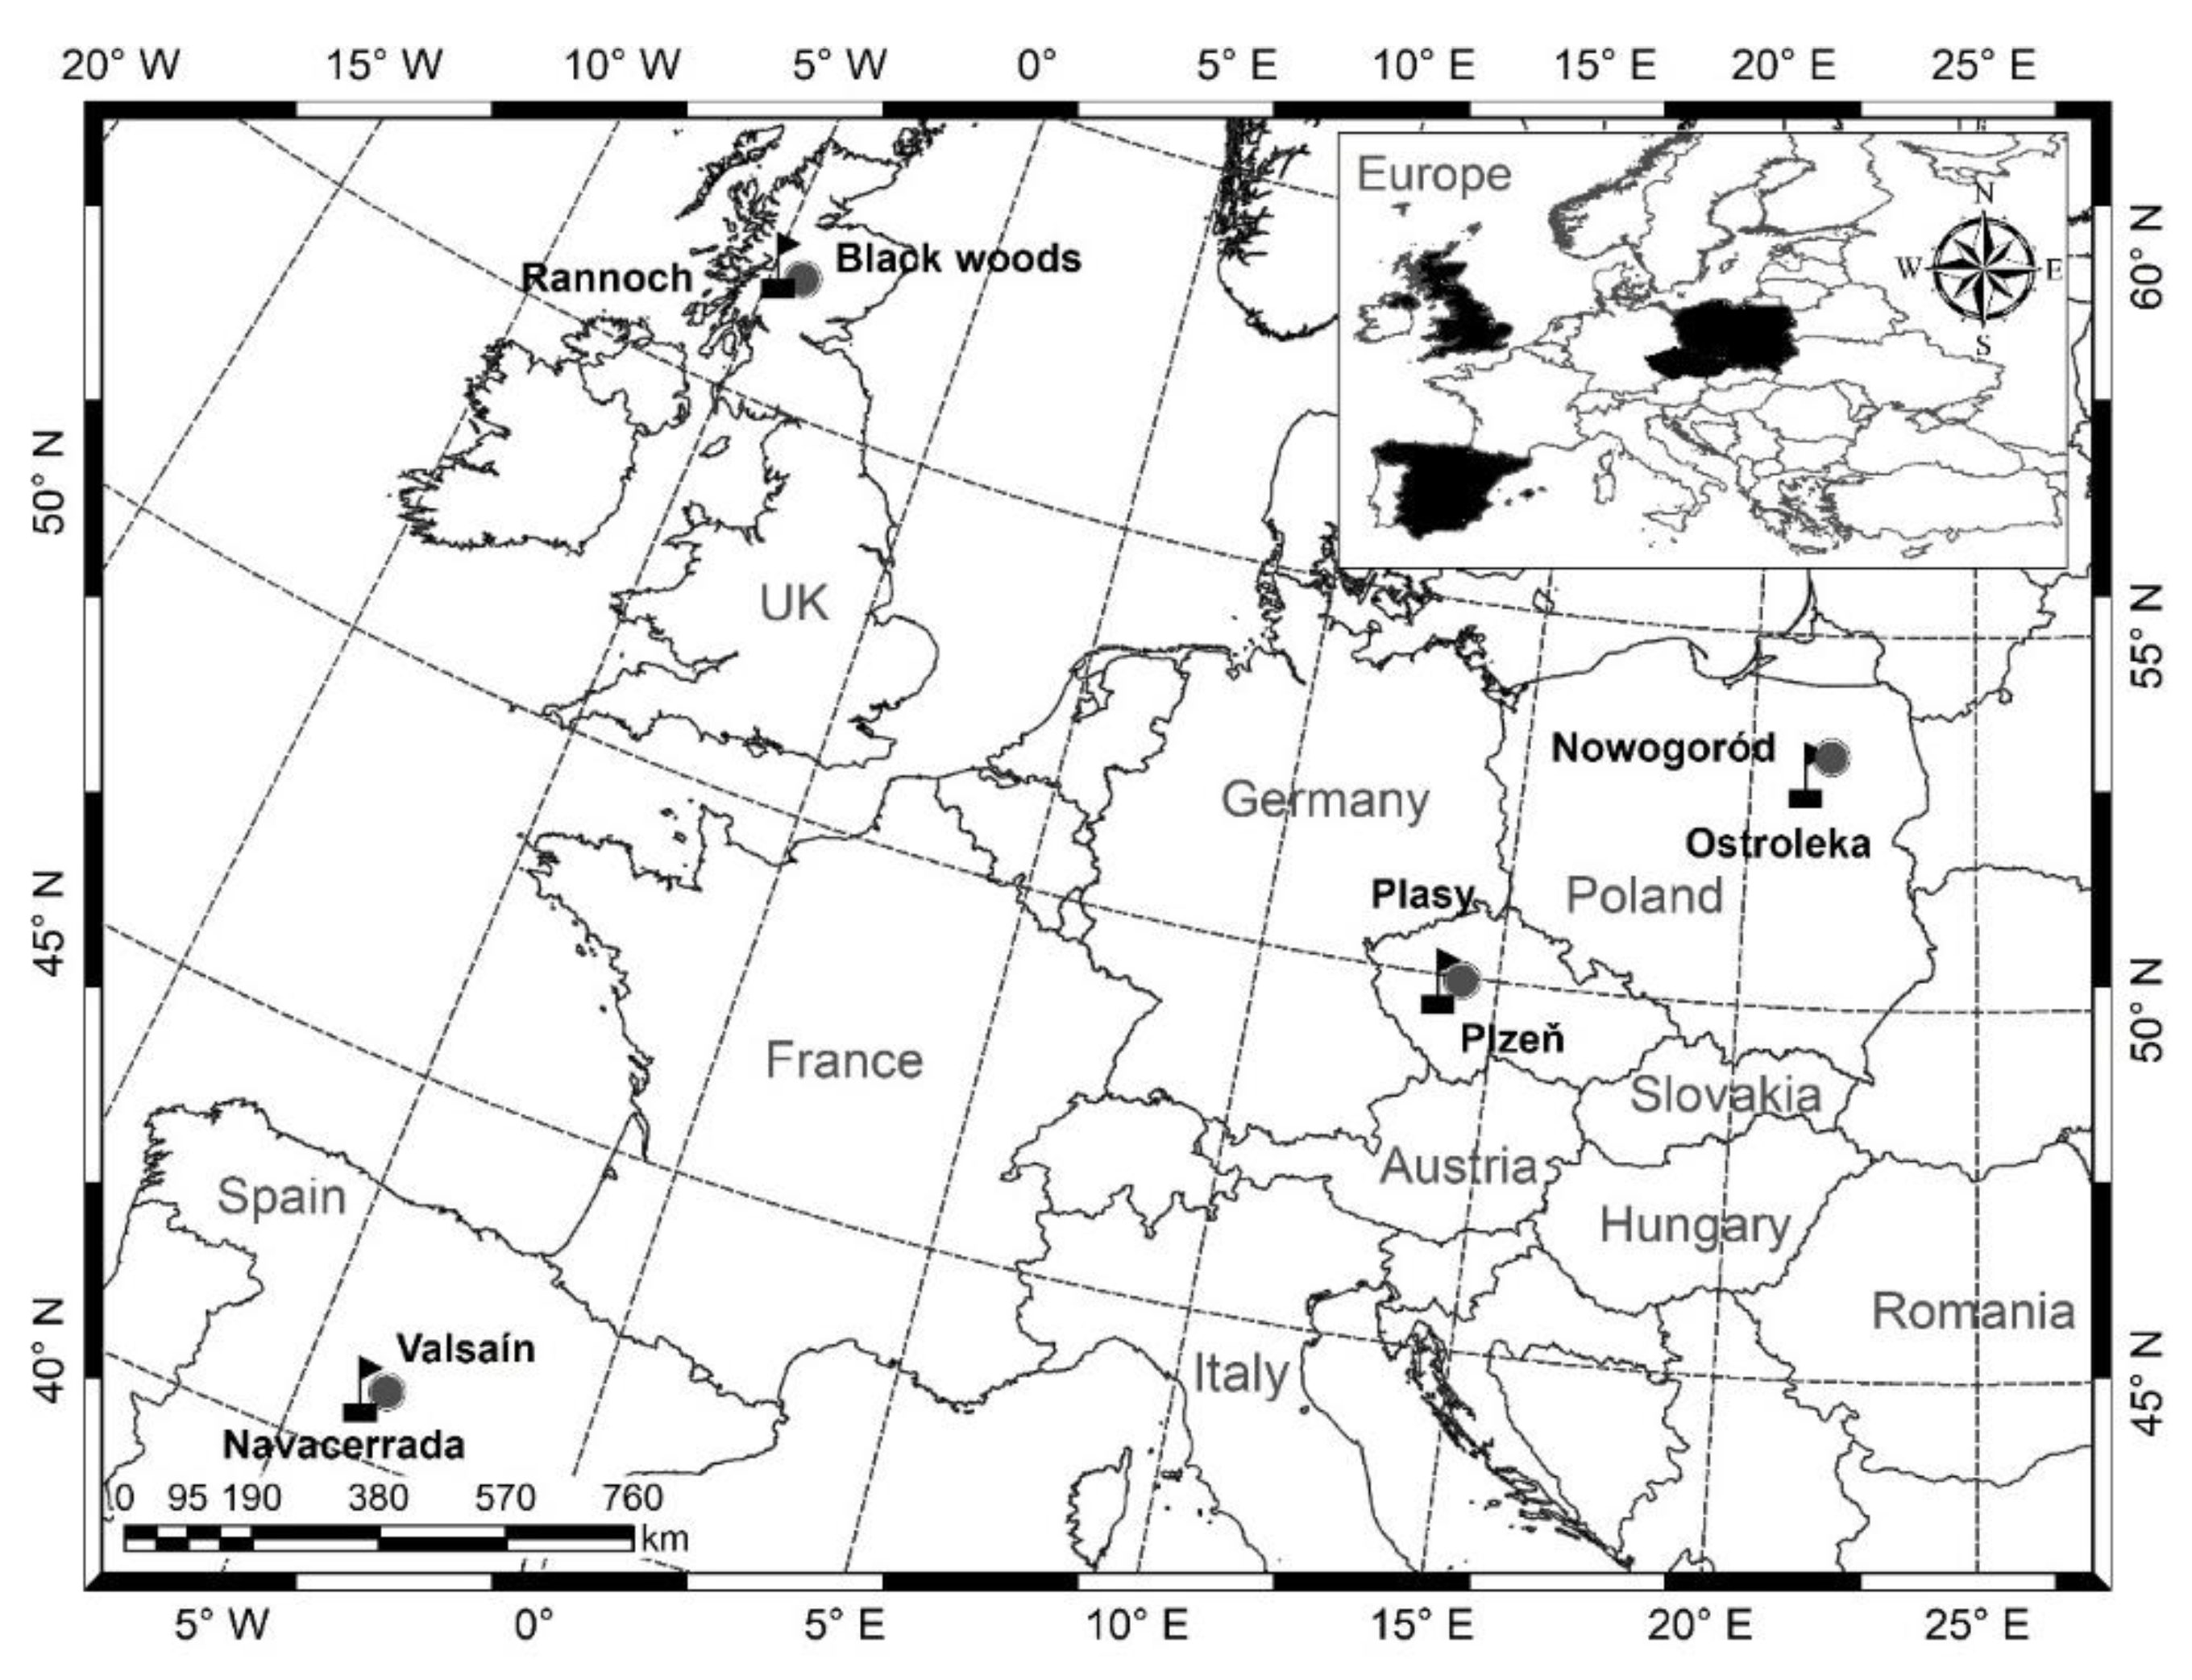
 countries and
  permanent research plots (label: country + number of plot).
countries and permanent research plots (label: country + number of plot).
permanent research plots (label: country + number of plot).
countries and permanent research plots (label: country + number of plot).


| RP ID | Country | GPS Latitude (WGS84) | GPS Longitude (WGS84) | Altitude (m) | Slope | Expo-Sure | Soil Type |
|---|---|---|---|---|---|---|---|
| CZ_1 | Czech Republic | 49°54′35.653″ N | 13°11′59.617″ E | 600 | - | - | Gleyic Podzol |
| CZ_2 | Czech Republic | 49°54′15.779″ N | 13°12′30.546″ E | 580 | 4° | E | Gleyic Podzol |
| CZ_3 | Czech Republic | 49°54′19.548″ N | 13°12′17.456″ E | 600 | 4° | E | Gleyic Podzol |
| CZ_4 | Czech Republic | 49°55′37.037″ N | 13°14′16.646″ E | 580 | 4° | E | Gleyic Podzol |
| SP_1 | Spain | 40°49′2.102″ N | 3°59′8.730″ W | 1580 | 11° | SE | Cambisol—Ferric Luvisols |
| SP_2 | Spain | 40°48′56.365″ N | 3°58′58.343″ W | 1670 | 13° | SE | Cambisol—Ferric Luvisols |
| SP_3 | Spain | 40°48′52.132″ N | 3°58′44.223″ W | 1780 | 20° | SE | Cambisol—Ferric Luvisols |
| SP_4 | Spain | 40°48′58.747″ N | 3°58′55.331″ W | 1670 | 17° | SE | Cambisol—Ferric Luvisols |
| PL_1 | Poland | 53°19′12.130″ N | 21°40′19.159″ E | 130 | - | - | Arenic Podzol |
| PL_2 | Poland | 53°19′25.408″ N | 21°40′17.895″ E | 130 | - | - | Arenic Podzol |
| PL_3 | Poland | 53°19′17.887″ N | 21°39′46.918″ E | 130 | - | - | Arenic Podzol |
| PL_4 | Poland | 53°19′23.354″ N | 21°39′13.084″ E | 130 | - | - | Arenic Podzol |
| GB_1 | Great Britain | 56°40′29.170″ N | 04°20′51.520″ W | 250 | 4° | NW | Gleyic Podzol |
| GB_2 | Great Britain | 56°40′29.170″ N | 04°20′51.520″ W | 250 | 4° | NW | Gleyic Podzol |
| GB_3 | Great Britain | 56°40′19.748″ N | 04°20′32.942″ W | 280 | 4° | NW | Gleyic Podzol |
| GB_4 | Great Britain | 56°40′19.748″ N | 04°20′32.942″ W | 280 | 4° | NW | Gleyic Podzol |
| Czech Republic | Spain | Poland | Great Britain | |
|---|---|---|---|---|
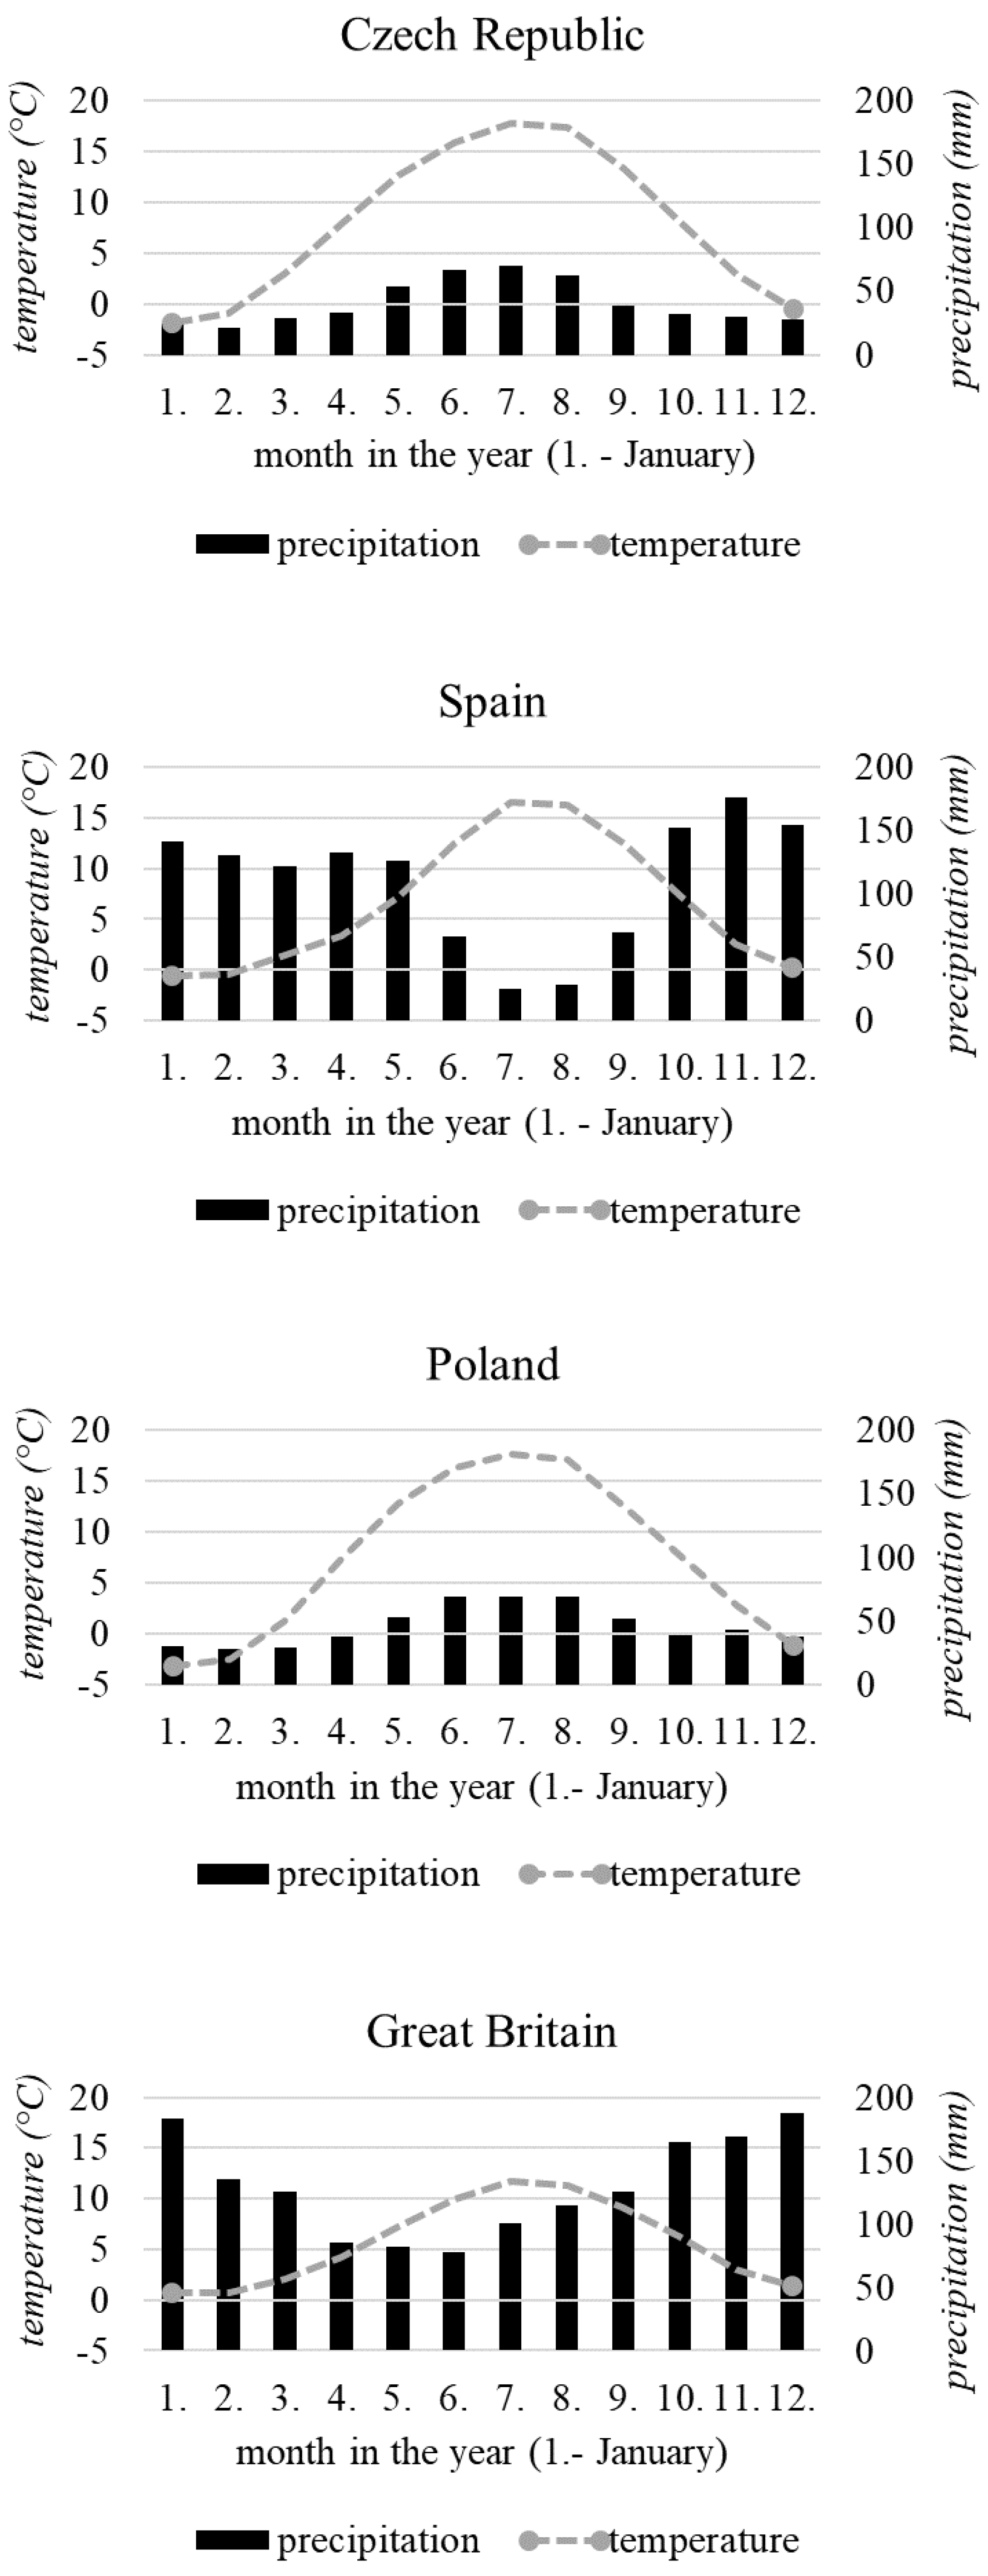
| Köppen–Geiger climate classification | Dfb | Csb | Dfb | Cfb |
| Annual average air temperature (°C) | 7.95 | 6.55 | 7.34 | 5.67 |
| Growing season average air temperature (°C) | 13.98 | 9.02 | 14.18 | 11.30 |
| Growing season average air temperature: Period 1 (°C) | 12.63 | 8.79 | 13.73 | 10.68 |
| Growing season average air temperature: Period 2 (°C) | 13.64 | 9.29 | 14.68 | 12.03 |
| Annual average total precipitation (mm) | 492.28 | 1325.71 | 553.18 | 1552.24 |
| Growing season average total precipitation (mm) | 351.22 | 553.51 | 340.57 | 445.38 |
| Growing season average total precipitation: Period 1 (mm) | 350.66 | 533.08 | 325.24 | 478.06 |
| Growing season average total precipitation: Period 2 (mm) | 351.87 | 577.35 | 357.94 | 407.27 |
| Criterion | Quantifier | Label | Reference | Evaluation |
|---|---|---|---|---|
| Horizontal structure | Aggregation index | R (C&Ei) | Clark and Evans (1954) [72] | mean value R = 1 (random distribution); aggregation R < 1; regularity R > 1 |
| Vertical structure | Arten-profile index | A (Pri) | Pretzsch (2006) [73] | range 0–1; balanced vertical structure A < 0.3, inhomogeneous structure A= 0.3–0.6, multi-layered structure A = 0.6–0.9, selection forest A > 0.9 |
| Vertical diversity | S (J&Di) | Jaehne and Dohrenbusch (1997) [75] | low S < 0.3, medium S = 0.3–0.5, high S = 0.5–0.7, very high diversity S > 0.7 | |
| Structure differentiation | Diameter dif. | TMd (Fi) | Füldner (1995) [74] | range 0–1; low TM < 0.3, medium TM = 0.3–0.5, high TM = 0.5–0.7, very high differentiation TM > 0.7 |
| Height dif. | TMh (Fi) | |||
| Crown dif. | K (J&Di) | Jaehne and Dohrenbusch (1997) [75] | low K < 1.0, medium K = 1.0–1.5, high K = 1.5–2.0, very high differentiation K > 2.0 | |
| Complex diversity | Stand diversity | B (J&Di) | Jaehne and Dohrenbusch (1997) [75] | monotonous structure B < 4, even structure B = 4–6, uneven structure B = 6–8, diverse structure B = 8–9, very diverse structure B > 9 |
| Country | No. Trees | Age Mean | Sampling Year | Increment (mm) | Increment Min–Max (mm) | Std. | R-Bar | SNR | EPS |
|---|---|---|---|---|---|---|---|---|---|
| Poland | 40 | 125 | 2016 | 1.25 | 0.67–2.44 | 0.618 | 0.234 | 9.005 | 0.900 |
| Czech Republic | 42 | 132 | 2015 | 0.95 | 0.47–1.61 | 0.494 | 0.247 | 11.186 | 0.917 |
| Spain | 47 | 119 | 2015 | 1.33 | 0.73–1.92 | 0.664 | 0.314 | 19.172 | 0.950 |
| Great Britain | 34 | 117 | 2016 | 2.22 | 0.82–4.85 | 1.017 | 0.385 | 8.254 | 0.887 |
| RP | DBH | H | v | N | BA | V | HDR | SDI | CC | BIO | Carbon |
|---|---|---|---|---|---|---|---|---|---|---|---|
| (cm) | (m) | (m3) | (trees ha−1) | (m2 ha−1) | (m3 ha−1) | (%) | (t ha−1) | (t ha−1) | |||
| CZ_1 | 25.8 | 17.15 | 0.439 | 596 | 31.2 | 261 | 66.5 | 0.62 | 75.8 | 213 | 111 |
| CZ_2 | 18.2 | 16.95 | 0.215 | 424 | 11.0 | 91 | 93.1 | 0.26 | 59.2 | 76 | 40 |
| CZ_3 | 23.2 | 15.22 | 0.372 | 368 | 15.5 | 137 | 65.6 | 0.33 | 47.6 | 110 | 58 |
| CZ_4 | 34.5 | 25.43 | 1.061 | 316 | 29.6 | 335 | 73.7 | 0.48 | 62.4 | 236 | 124 |
| SP_1 | 28.2 | 16.13 | 0.663 | 556 | 34.7 | 369 | 57.2 | 0.68 | 74.9 | 286 | 150 |
| SP_2 | 27.4 | 14.19 | 0.496 | 752 | 44.5 | 373 | 51.8 | 0.88 | 75.8 | 293 | 154 |
| SP_3 | 24.9 | 14.55 | 0.436 | 740 | 36.1 | 323 | 58.4 | 0.74 | 81.5 | 257 | 135 |
| SP_4 | 24.7 | 10.88 | 0.335 | 676 | 32.2 | 227 | 44.0 | 0.67 | 76.4 | 180 | 94 |
| PL_1 | 28.1 | 19.73 | 0.664 | 768 | 47.6 | 510 | 70.2 | 0.93 | 84.1 | 401 | 210 |
| PL_2 | 27.6 | 18.92 | 0.683 | 716 | 42.8 | 489 | 68.6 | 0.85 | 74.7 | 381 | 200 |
| PL_3 | 31.7 | 19.68 | 0.973 | 384 | 30.2 | 374 | 62.1 | 0.55 | 69.0 | 281 | 147 |
| PL_4 | 38.0 | 27.36 | 1.496 | 304 | 34.5 | 455 | 72.0 | 0.60 | 69.0 | 346 | 181 |
| GB_1 | 43.6 | 15.39 | 1.326 | 144 | 21.4 | 191 | 35.3 | 0.35 | 56.4 | 144 | 75 |
| GB_2 | 50.4 | 19.12 | 1.928 | 196 | 39.0 | 378 | 37.9 | 0.61 | 77.3 | 282 | 148 |
| GB_3 | 34.8 | 13.02 | 0.826 | 248 | 23.5 | 205 | 37.4 | 0.41 | 70.8 | 159 | 83 |
| GB_4 | 29.7 | 14.28 | 0.571 | 232 | 16.1 | 132 | 48.1 | 0.31 | 62.2 | 105 | 55 |
| RP | Horizontal Structure | Vertical Structure | Vertical Diversity | Diameter Differen. | Height Differen. | Crown Differen. | Total Diversity |
|---|---|---|---|---|---|---|---|
| CZ_1 | 1.119 | 0.369 | 0.795 | 0.314 | 0.207 | 1.868 | 7.051 |
| CZ_2 | 0.957 | 0.455 | 0.827 | 0.300 | 0.228 | 1.993 | 6.684 |
| CZ_3 | 1.078 | 0.383 | 0.742 | 0.254 | 0.206 | 1.618 | 5.346 |
| CZ_4 | 1.104 | 0.674 | 0.484 | 0.200 | 0.125 | 1.101 | 5.134 |
| SP_1 | 0.926 | 0.904 | 0.903 | 0.428 | 0.372 | 1.568 | 5.274 |
| SP_2 | 0.943 | 0.789 | 0.875 | 0.327 | 0.243 | 1.926 | 5.548 |
| SP_3 | 0.904 | 0.909 | 0.829 | 0.392 | 0.303 | 1.603 | 5.032 |
| SP_4 | 0.797A | 0.967 | 0.814 | 0.339 | 0.234 | 2.642 | 6.046 |
| PL_1 | 1.079 | 0.398 | 0.786 | 0.367 | 0.227 | 1.791 | 5.995 |
| PL_2 | 1.075 | 0.499 | 0.720 | 0.355 | 0.256 | 1.506 | 5.210 |
| PL_3 | 0.875 | 0.631 | 0.812 | 0.423 | 0.351 | 2.142 | 6.124 |
| PL_4 | 1.191R | 0.168 | 0.805 | 0.217 | 0.136 | 2.095 | 5.957 |
| GB_1 | 0.799A | 0.251 | 0.781 | 0.391 | 0.252 | 1.535 | 4.823 |
| GB_2 | 0.863 | 0.469 | 0.432 | 0.269 | 0.122 | 1.705 | 3.936 |
| GB_3 | 0.655A | 0.425 | 0.834 | 0.400 | 0.252 | 1.797 | 6.279 |
| GB_4 | 0.811 | 0.487 | 0.737 | 0.324 | 0.201 | 1.956 | 6.166 |
| Plot Name | Time Period/Year | Temperature in Veg. Season | Annual Temperature | Precipitation in Veg. Season | Annual Precipitation |
|---|---|---|---|---|---|
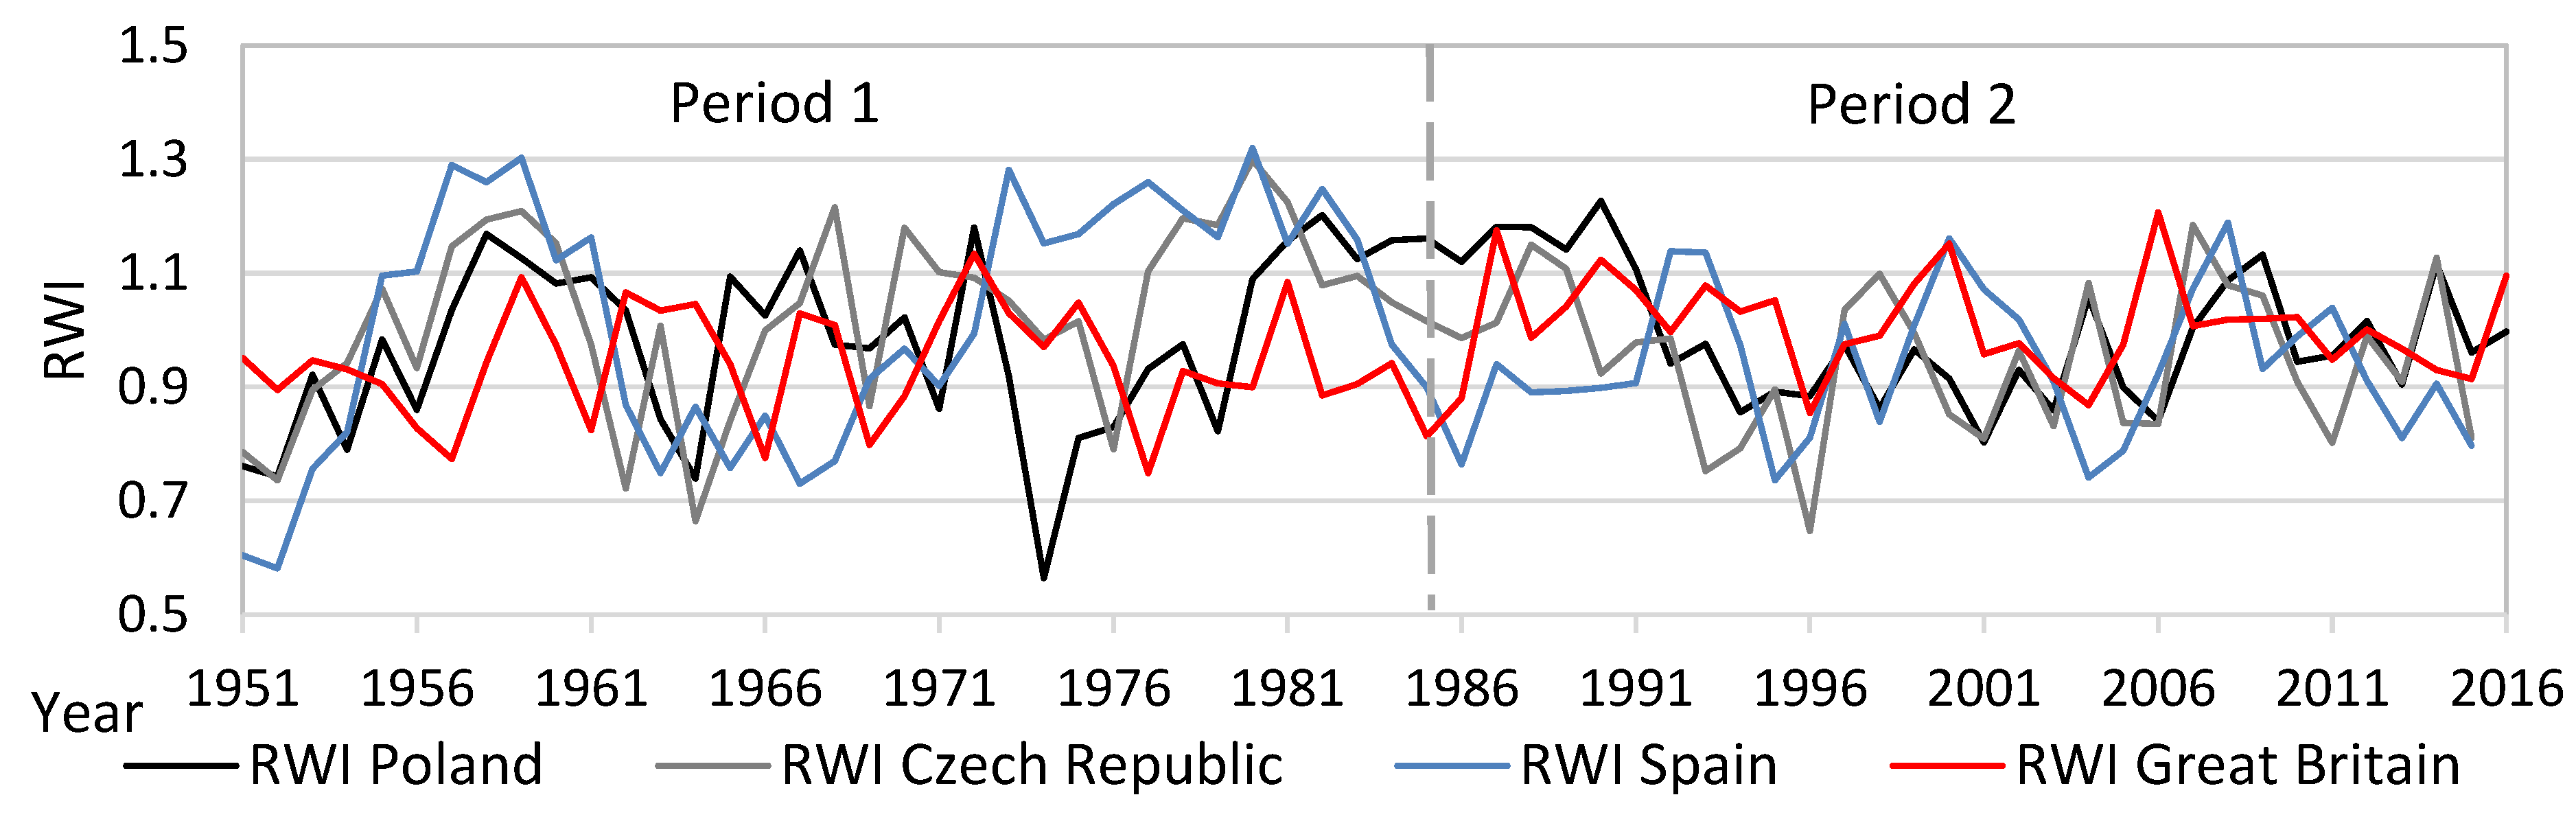
| RWI Poland | Period 1/1951–1985 | 0.03 | 0.15 | 0.21 | −0.02 |
| Period 2/1986–2016 | 0.01 | 0.18 | −0.01 | −0.12 | |
| RWI Czech Republic | Period 1/1951–1985 | −0.29 | −0.01 | 0.40 | 0.38 |
| Period 2/1986–2016 | −0.07 | 0.19 | −0.13 | −0.06 | |
| RWI Spain | Period 1/1951–1985 | −0.07 | 0.12 | 0.02 | −0.16 |
| Period 2/1986–2016 | −0.27 | −0.16 | 0.39 | −0.02 | |
| RWI Great Britain | Period 1/1951–1985 | 0.09 | 0.16 | −0.26 | −0.27 |
| Period 2/1986–2016 | −0.03 | −0.07 | −0.23 | −0.09 |
Disclaimer/Publisher’s Note: The statements, opinions and data contained in all publications are solely those of the individual author(s) and contributor(s) and not of MDPI and/or the editor(s). MDPI and/or the editor(s) disclaim responsibility for any injury to people or property resulting from any ideas, methods, instructions or products referred to in the content. |
© 2024 by the authors. Licensee MDPI, Basel, Switzerland. This article is an open access article distributed under the terms and conditions of the Creative Commons Attribution (CC BY) license (https://creativecommons.org/licenses/by/4.0/).
Share and Cite
Brichta, J.; Šimůnek, V.; Bílek, L.; Vacek, Z.; Gallo, J.; Drozdowski, S.; Bravo-Fernández, J.A.; Mason, B.; Roig Gomez, S.; Hájek, V.; et al. Effects of Climate Change on Scots Pine (Pinus sylvestris L.) Growth across Europe: Decrease of Tree-Ring Fluctuation and Amplification of Climate Stress. Forests 2024, 15, 91. https://doi.org/10.3390/f15010091
Brichta J, Šimůnek V, Bílek L, Vacek Z, Gallo J, Drozdowski S, Bravo-Fernández JA, Mason B, Roig Gomez S, Hájek V, et al. Effects of Climate Change on Scots Pine (Pinus sylvestris L.) Growth across Europe: Decrease of Tree-Ring Fluctuation and Amplification of Climate Stress. Forests. 2024; 15(1):91. https://doi.org/10.3390/f15010091
Chicago/Turabian StyleBrichta, Jakub, Václav Šimůnek, Lukáš Bílek, Zdeněk Vacek, Josef Gallo, Stanisław Drozdowski, José Alfredo Bravo-Fernández, Bill Mason, Sonia Roig Gomez, Vojtěch Hájek, and et al. 2024. "Effects of Climate Change on Scots Pine (Pinus sylvestris L.) Growth across Europe: Decrease of Tree-Ring Fluctuation and Amplification of Climate Stress" Forests 15, no. 1: 91. https://doi.org/10.3390/f15010091