
Whole-Tree Harvest Effects on Macronutrients in an Oak-Dominated System after Seven Years


1
College of Forest Resources and Environmental Science, Michigan Technological University, U.J. Noblet Building, 1400 Townsend Drive, Houghton, MI 49931, USA
2
U.S. Forest Service-Northern Research Station, 410 MacInnes Drive, Houghton, MI 49931, USA
3
U.S. Forest Service-Northern Research Station, 5985 Highway K, Rhinelander, WI 54501, USA
4
U.S. Forest Service-Northern Research Station, 1831 Hwy 169 East, Grand Rapids, MN 55744, USA
*
Author to whom correspondence should be addressed.
Forests 2022, 13(10), 1532; https://doi.org/10.3390/f13101532
Submission received: 17 August 2022
/
Revised: 16 September 2022
/
Accepted: 17 September 2022
/
Published: 20 September 2022
(This article belongs to the Section Forest Ecology and Management)
Abstract
:This study assesses the impacts of whole-tree harvesting (WTH) versus stem-only harvest (SOH) on two oak-dominated stands located in Northern Wisconsin. Specifically, our study follows up on an experiment designed to better understand the impacts of WTH and whether stands are at risk of long-term nutrient losses, which could contribute to declines in productivity. The original study assessed: (i) full biomass removal (referred to as WTH), (ii) partial biomass removal (removal to 5 cm diameter bole), (iii) a traditional SOH (removal to 10 cm bole), and (iv) no harvest (control). Our data were collected 93 months after harvest and showed significant decreases (α = 0.05) in the total (soil, woody debris, litter, and tree) Ca between WTH and SOH and for N and K from all harvest types. P and Mg were not significantly different between any of the treatment types. The woody debris was significantly decreased in the WTH in comparison to the SOH across P, K, Ca, Mg, but not N. The differences in the woody debris were initially detected, but a nutrient budget modeling exercise did not show significant declines for the ecosystem. The nutrient budget model assumptions and scale of input terms are discussed. Revisiting the sites at 93 months post-harvest versus the original 1.75 years allowed for the detection of the differences in total N, K, and Ca pool sizes.
1. Introduction
The lasting effects of whole-tree harvest and stem-only harvest on soil fertility have generally indicated an increased loss in base cations, particularly for coarse-textured soils [1,2,3,4,5]. However, variation among studies is large, and the net effects of harvesting for sustained soil fertility are not universal [6,7]. The differences in results highlight the complexity faced by forest scientists and managers when attempting to determine the lasting effects of removing more mass through whole-tree harvest from a forest.
A study in a northern pin oak (Quercus ellipsoidalis E.J. Hill) and bur oak (Quercus macrocarpa Michx.) dominated system located on a sandy soil showed only phosphorus (P) to have a net depletion across all harvest treatments, whereas the nitrogen (N), potassium (K), calcium (Ca), and magnesium (Mg) were found to be accumulating [8]. The harvest intensity treatments were designed to represent a conventional stem-only harvest (biomass ≤ 4 in./10 cm left on-site; referred to hereafter as SOH), a slightly intensified whole-tree harvest (biomass ≤ 2 in./5 cm left on-site; referred to hereafter as WTH-5 cm), a whole-tree harvest (all biomass removed; referred to hereafter as WTH), and an unharvested reference site, referred to hereafter as CON. In contrast to the nutrient budget results, differences in woody debris post-harvest were observed. The WTH treatment removed an additional 19,500 kg ha−1, and the WTH-5 cm removed an additional 7200 kg ha−1, which is an average of 13 ± 6% and 5 ± 8% of the reported total tree mass, respectively [8]. The differences in gross mass also translated to significant differences across the course woody debris (CWD) macronutrients between the WTH and the SOH + WTH-5 cm [9] (Table A1). Significant differences were not detected in the fine woody debris (FWD) macronutrients [9] (Table A1). The proportion of gross mass and macronutrients removed through harvest intensification appeared to constitute a large treatment signal, but the large variation in pool measurements and model estimates masked the differences.
The complexity of determining the WTH impacts are not only from the variation in harvest species and soil types, but also from the differences in the modeling approaches, nutrient pool definitions, and post-harvest sampling timeframe. In the instance where P was modeled to have a net depletion across harvest treatments, coarse-textured soils were sampled immediately after the harvest and up to 1.75 years post-harvest [8]. In contrast, finer-textured soils were sampled 1, 2, and 5 years post-harvest and determined Ca and Mg would be limiting with successive harvests [1,3]. The finer-textured soils also provide much higher weathering rates of Ca and Mg [10]. Therefore, if Ca and Mg have reported losses due to WTH, it follows that the coarse-textured soil would exaggerate the effect since the supply of Ca and Mg is much less. Moreover, these studies varied in their definitions of nutrient input pools over time [1,3,8], and due to the variation present in each of the input and output terms of the nutrient budget, the harvest intensity signal may require multiple rotations to be detected [11]. Revisiting these harvested sites and evaluating changes in soil nutrient pools in a consistent manner would elucidate potential lasting differences in WTH effects on soil fertility.
The purpose of this study was to revisit the treatments, as described in Wilhelm et al. (2013) [8], and assess changes in the available nutrient pools by harvest type after 93 months. The prior study detected significant differences in the woody debris by harvest type, and modeling efforts showed that P was the only element depleted in the soil [8]. However, these assessments were informed by inputs defined as mineralization combined with weathering and atmospheric deposition in a time frame that may have not allowed for the decomposition of the woody debris to manifest as an input to the mineralization and weathering pool. Therefore, revisiting these same harvest trials and accounting for a longer time frame allows for further decomposition of the woody debris. We hypothesized that significant differences between WTH and SOH would be observed in the (1) woody debris pools and (2) total nutrient pools 93 months after the harvest. Alternatively, the products of mineralization may be immobilized in the soil, maintaining fertility levels after 93 months since harvesting.
2. Materials and Methods
2.1. Original Treatments
The original experiment comparing harvest removals was harvested between November and December of 2009 on oak-dominated stands in the Governor Knowles State Forest, WI USA [8]. The harvest intensity treatments were designed to represent a traditional SOH, with removals to a 10 cm bole; a partial biomass removal, with harvesting to a 5 cm bole (WTH-5 cm); a full biomass removal (WTH); and a no-harvest control (CON). Each harvest treatment area was 0.08 ha, and treatment areas were grouped and located within 500 m of each other. This study design was replicated across five different oak stands within the Governor Knowles State Forest. Ecosystem nutrient values, including deposition through precipitation; living tissues in the herbaceous, shrub, and overstory species; woody debris; soil pools; and leachate, were collected during the growing seasons of 2010 and 2011 (Table 1). Soil mineralization and weathering were assessed at 5 cm and 20 cm in depth by mixed bed exchange resin. The woody debris was categorized as coarse woody debris (CWD) with a minimum total length of 0.9 m and a greater than 2.54 cm diameter, and fine woody debris (FWD) was defined as a less than 2.54 cm diameter. The forest litter or forest floor pool was defined as any non-woody decaying organic matter including fruits, leaves, organisms, or scat decayed beyond recognition up to the mineral soil. A nutrient budget was constructed which consisted of the inputs of precipitation and mineralization combined with weathering and outputs such as leaching and biomass retention. For further site descriptions and methodology see Wilhelm et al. (2013) [8].
2.2. Site Remeasurements and Nutrient Analysis
Three of the five original study sites occurred on Typic Udipsamment soils and were subsequently harvested between the original analysis and our remeasurement. Therefore, those three sites were not included in our analysis. The two resampled sites in our analysis, referred to as Sunrise and Trade River, were located on Entic Haplorthod soils, and between the time of the original study and the resampling period the soils were remapped as Typic Udipsamment Grayling series. The baseline observations from the initial study showed significantly lower K, Ca, and Mg pools in the Sunrise and Trade River sites as compared to the three sites that were harvested between the resampling period, and the N and P soils were not significantly different [12]. The Sunrise and Trade River sites were resampled in August of 2017 for soil cores, forest litter, and fine woody debris at 8 m from the plot center on 45-degree intervals (n = 8), similar to the original study [8]. Soil cores were taken from 0–8 and 8–60 cm with a 2.54 cm diameter AMS soil probe, similar to the original study [8]. Forest floor litter was sampled with a 0.25 m2 frame and all woody debris was sampled in a 1 m2 frame.
Small-diameter cores have been shown to introduce bias concerning the rock content and bulk density of the soil [13]. To avoid any bias in the bulk density core sampling, bulk density values were obtained from the Kellogg Soil Survey Laboratory National Soil Survey Center database. The database was queried on 10 February 2022 for Typic Udipsamment soils in Wisconsin, and a weighted average was calculated for 0–8 cm and 8–60 cm by the depth of the horizon within the sampling ranges. The Tukey honestly significant difference test was used to evaluate significant differences for all nutrient categories among the harvest intensity treatments (α = 0.05) within the R-statistical platform.
Forest litter and FWD were dried at 55 °C until a constant weight was obtained. Forest litter and FWD was transported to the University of Wisconsin Forage Analysis Laboratory, in Marshfield WI, for acid digestion by ICP-OES on a Perkin Elmer 8000 ICP. Soils were transported to the Michigan Technological University and were dried at 55 °C to a constant mass and sieved (no. 10, 0.2 cm mesh) to remove roots, rocks, woody debris, and char. Nutrients K, Ca, and Mg were obtained by shaking 5 g of soil in 20 mL of 1 M NH4OAc for 20 min, filtered by Whatman 42 filter paper, and analyzed by ICP-OES using a Perkin Elmer Optima 7000DV. Available phosphorus was determined spectrophotometrically with the ascorbic acid method [14,15]. Nitrogen was determined with 33.33 g of soil in 100 mL 1M KCl, shaken for 20 min, filtered through Whatman 42 filter paper, and analyzed by a QuikChem 8000 instrument by Lachat with nitrate by the QuikChem Method 12-107-04-1-F and ammonium by the QuikChem Method 12-107-06-1-B [16].
The total nutrient pool was calculated by taking the sum of the soil 0–8 cm, soil 8–60 cm, forest litter, woody debris, and unharvested tree values. The CON remained unharvested during the second observation, so to estimate the macronutrients contained within the tree component, the values from the Entic Haplorthod sites [12] were combined with the average of the annual accumulation [8] multiplied by the number of years since the observation. The estimation is necessary to account for the macronutrients in the tree component and nutrient uptake since the time of the original study.
3. Results
3.1. Woody Debris
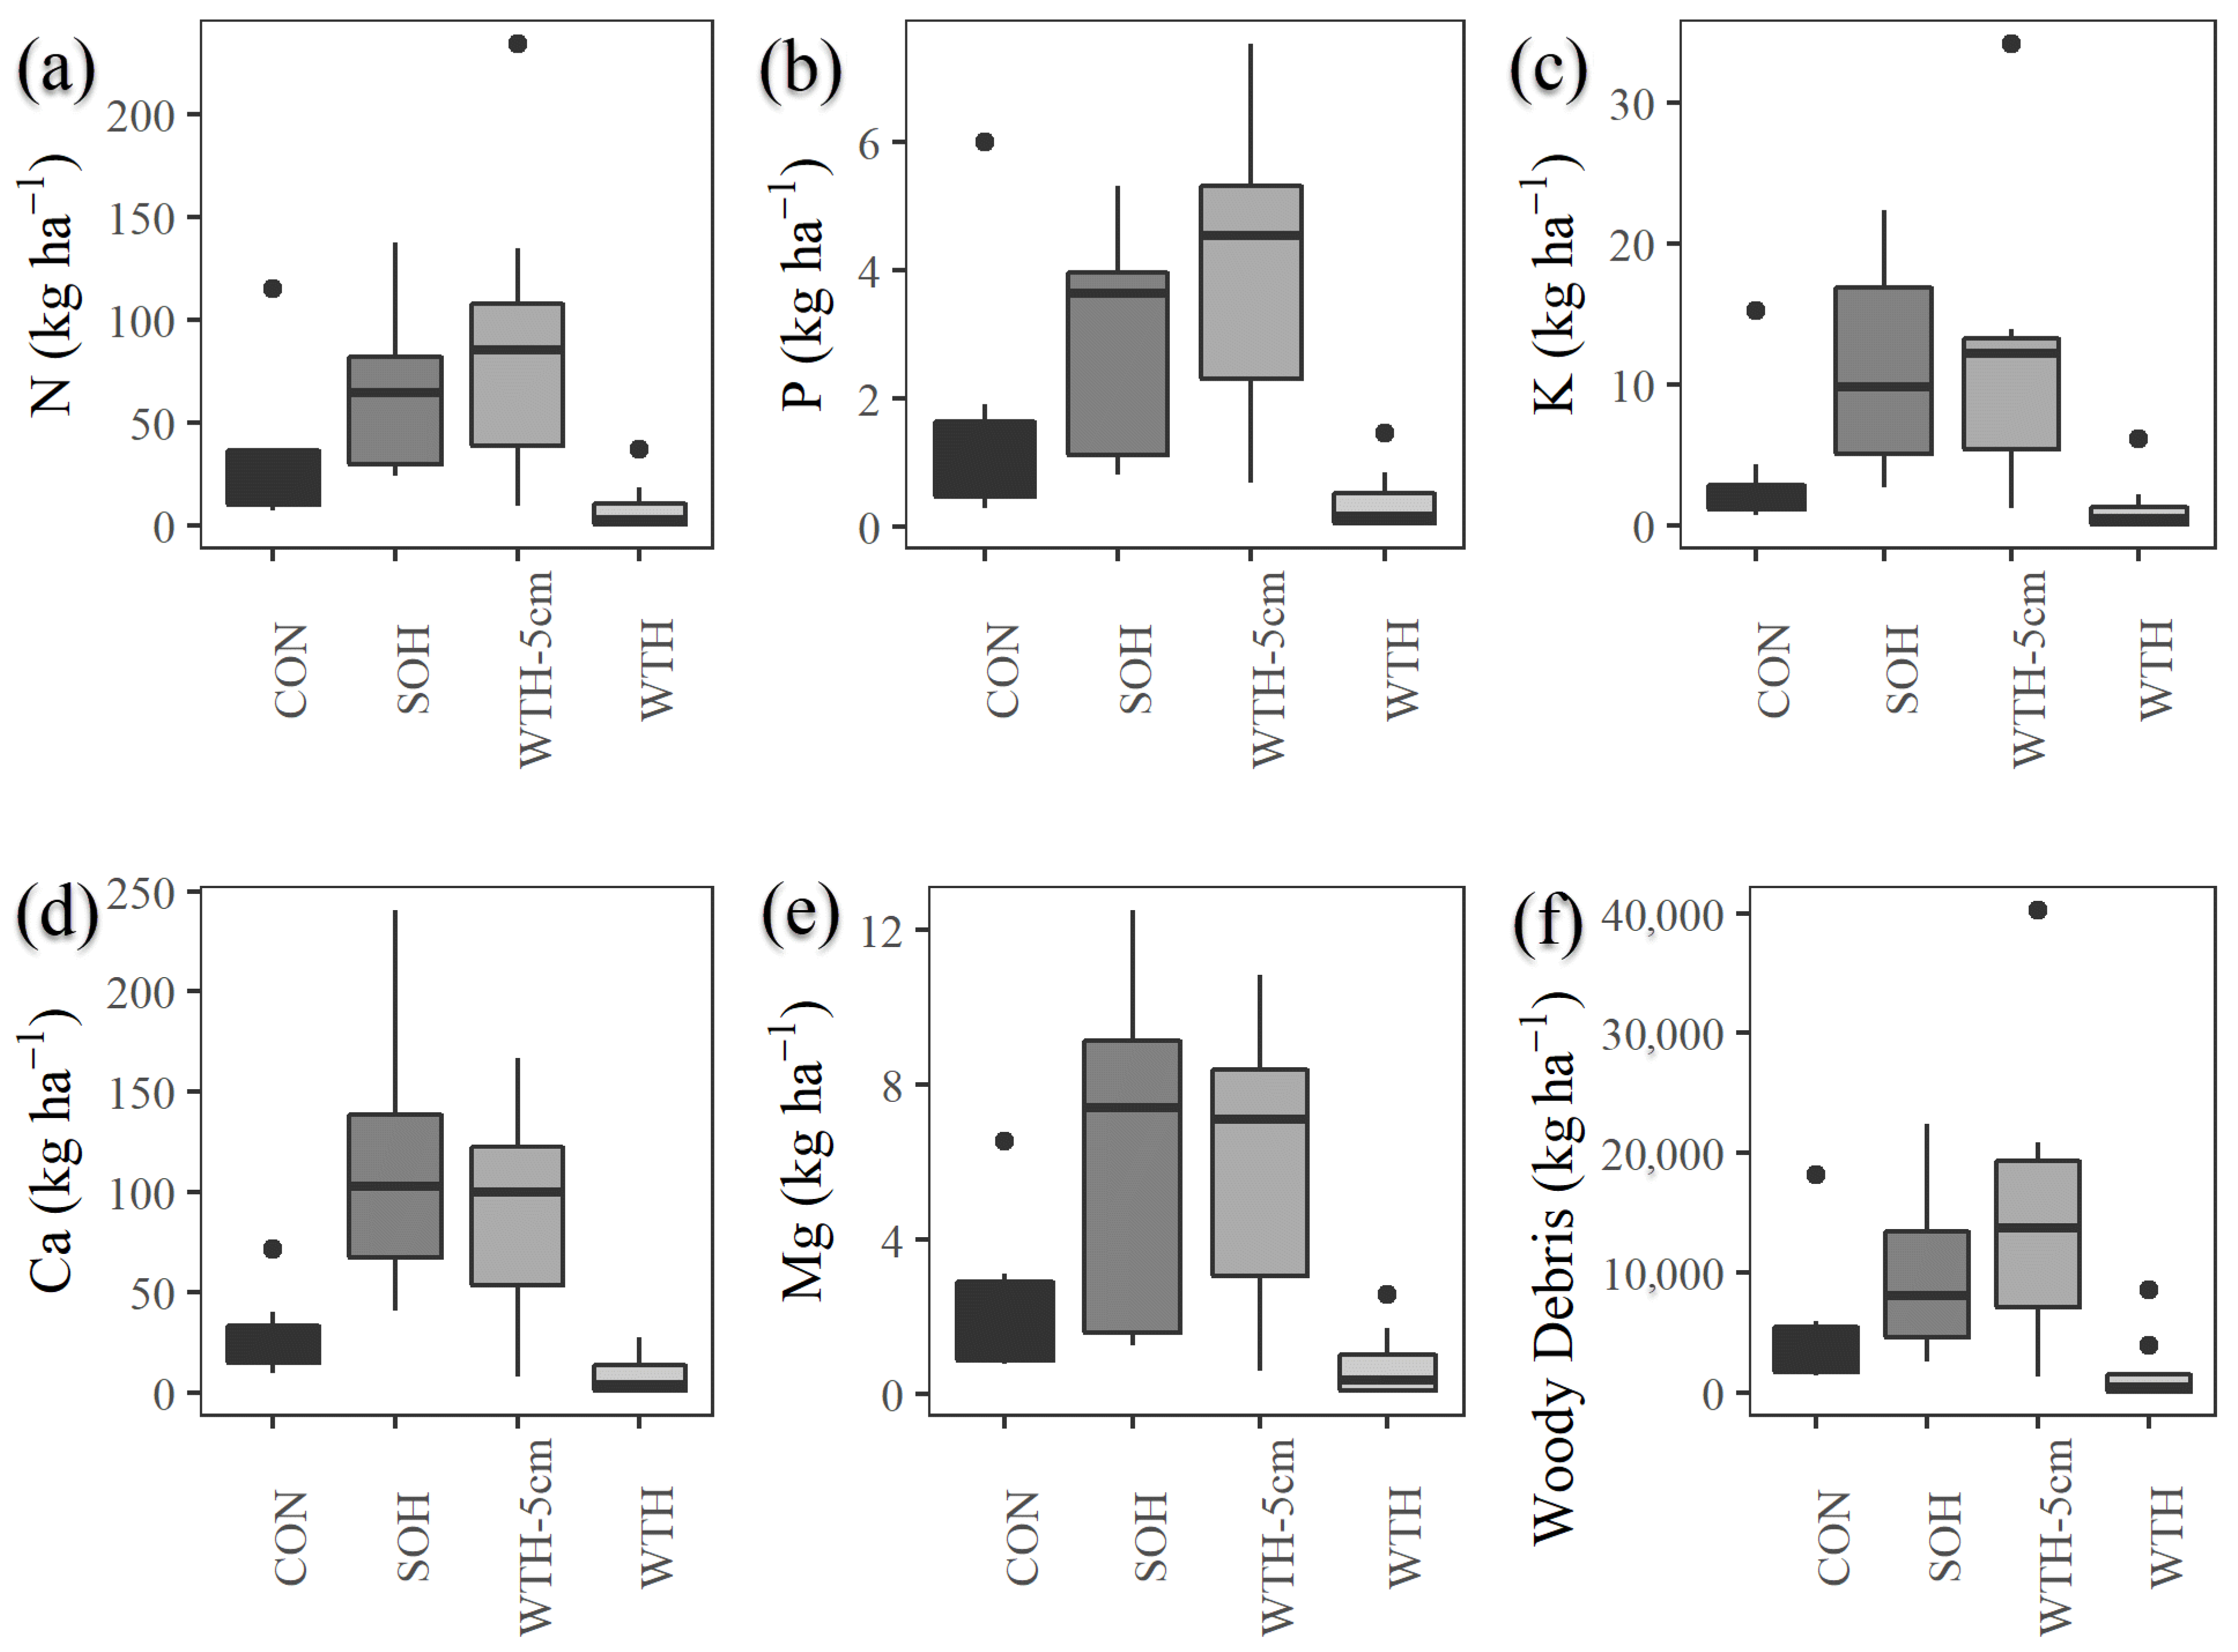
The signal from the original harvest intensity manipulation was only detectable in the amount of the woody debris between the WTH-5 cm and the WTH, and all harvests were no longer significantly different from the control (Figure 1, Table 2). The amount of woody debris significantly declined within the SOH but was not significantly different for all other treatments since the time of the original study. The WTH had significantly lower P, K, Ca, and Mg as compared to the WTH-5 cm and SOH harvest and lower N as compared to the WTH-5 cm but not the SOH. As compared to the SOH, the WTH was on average 57 N, 3 P, 10 K, 105 Ca, and 5 Mg kg ha−1 lower and 80 N, 4 P, 11 K, 81 Ca, and 5 Mg kg ha−1 lower compared to the WTH-5 cm. The forest floor showed no difference between treatments but showed significant declines from the original study across all treatments. The forest litter tended to be similar between all treatments except for the K and Mg pools which showed significantly larger values in the WTH-5 cm as compared to the SOH, with an additional 2 and 1 Mg kg ha−1, respectively.
3.2. Total Macronutrients
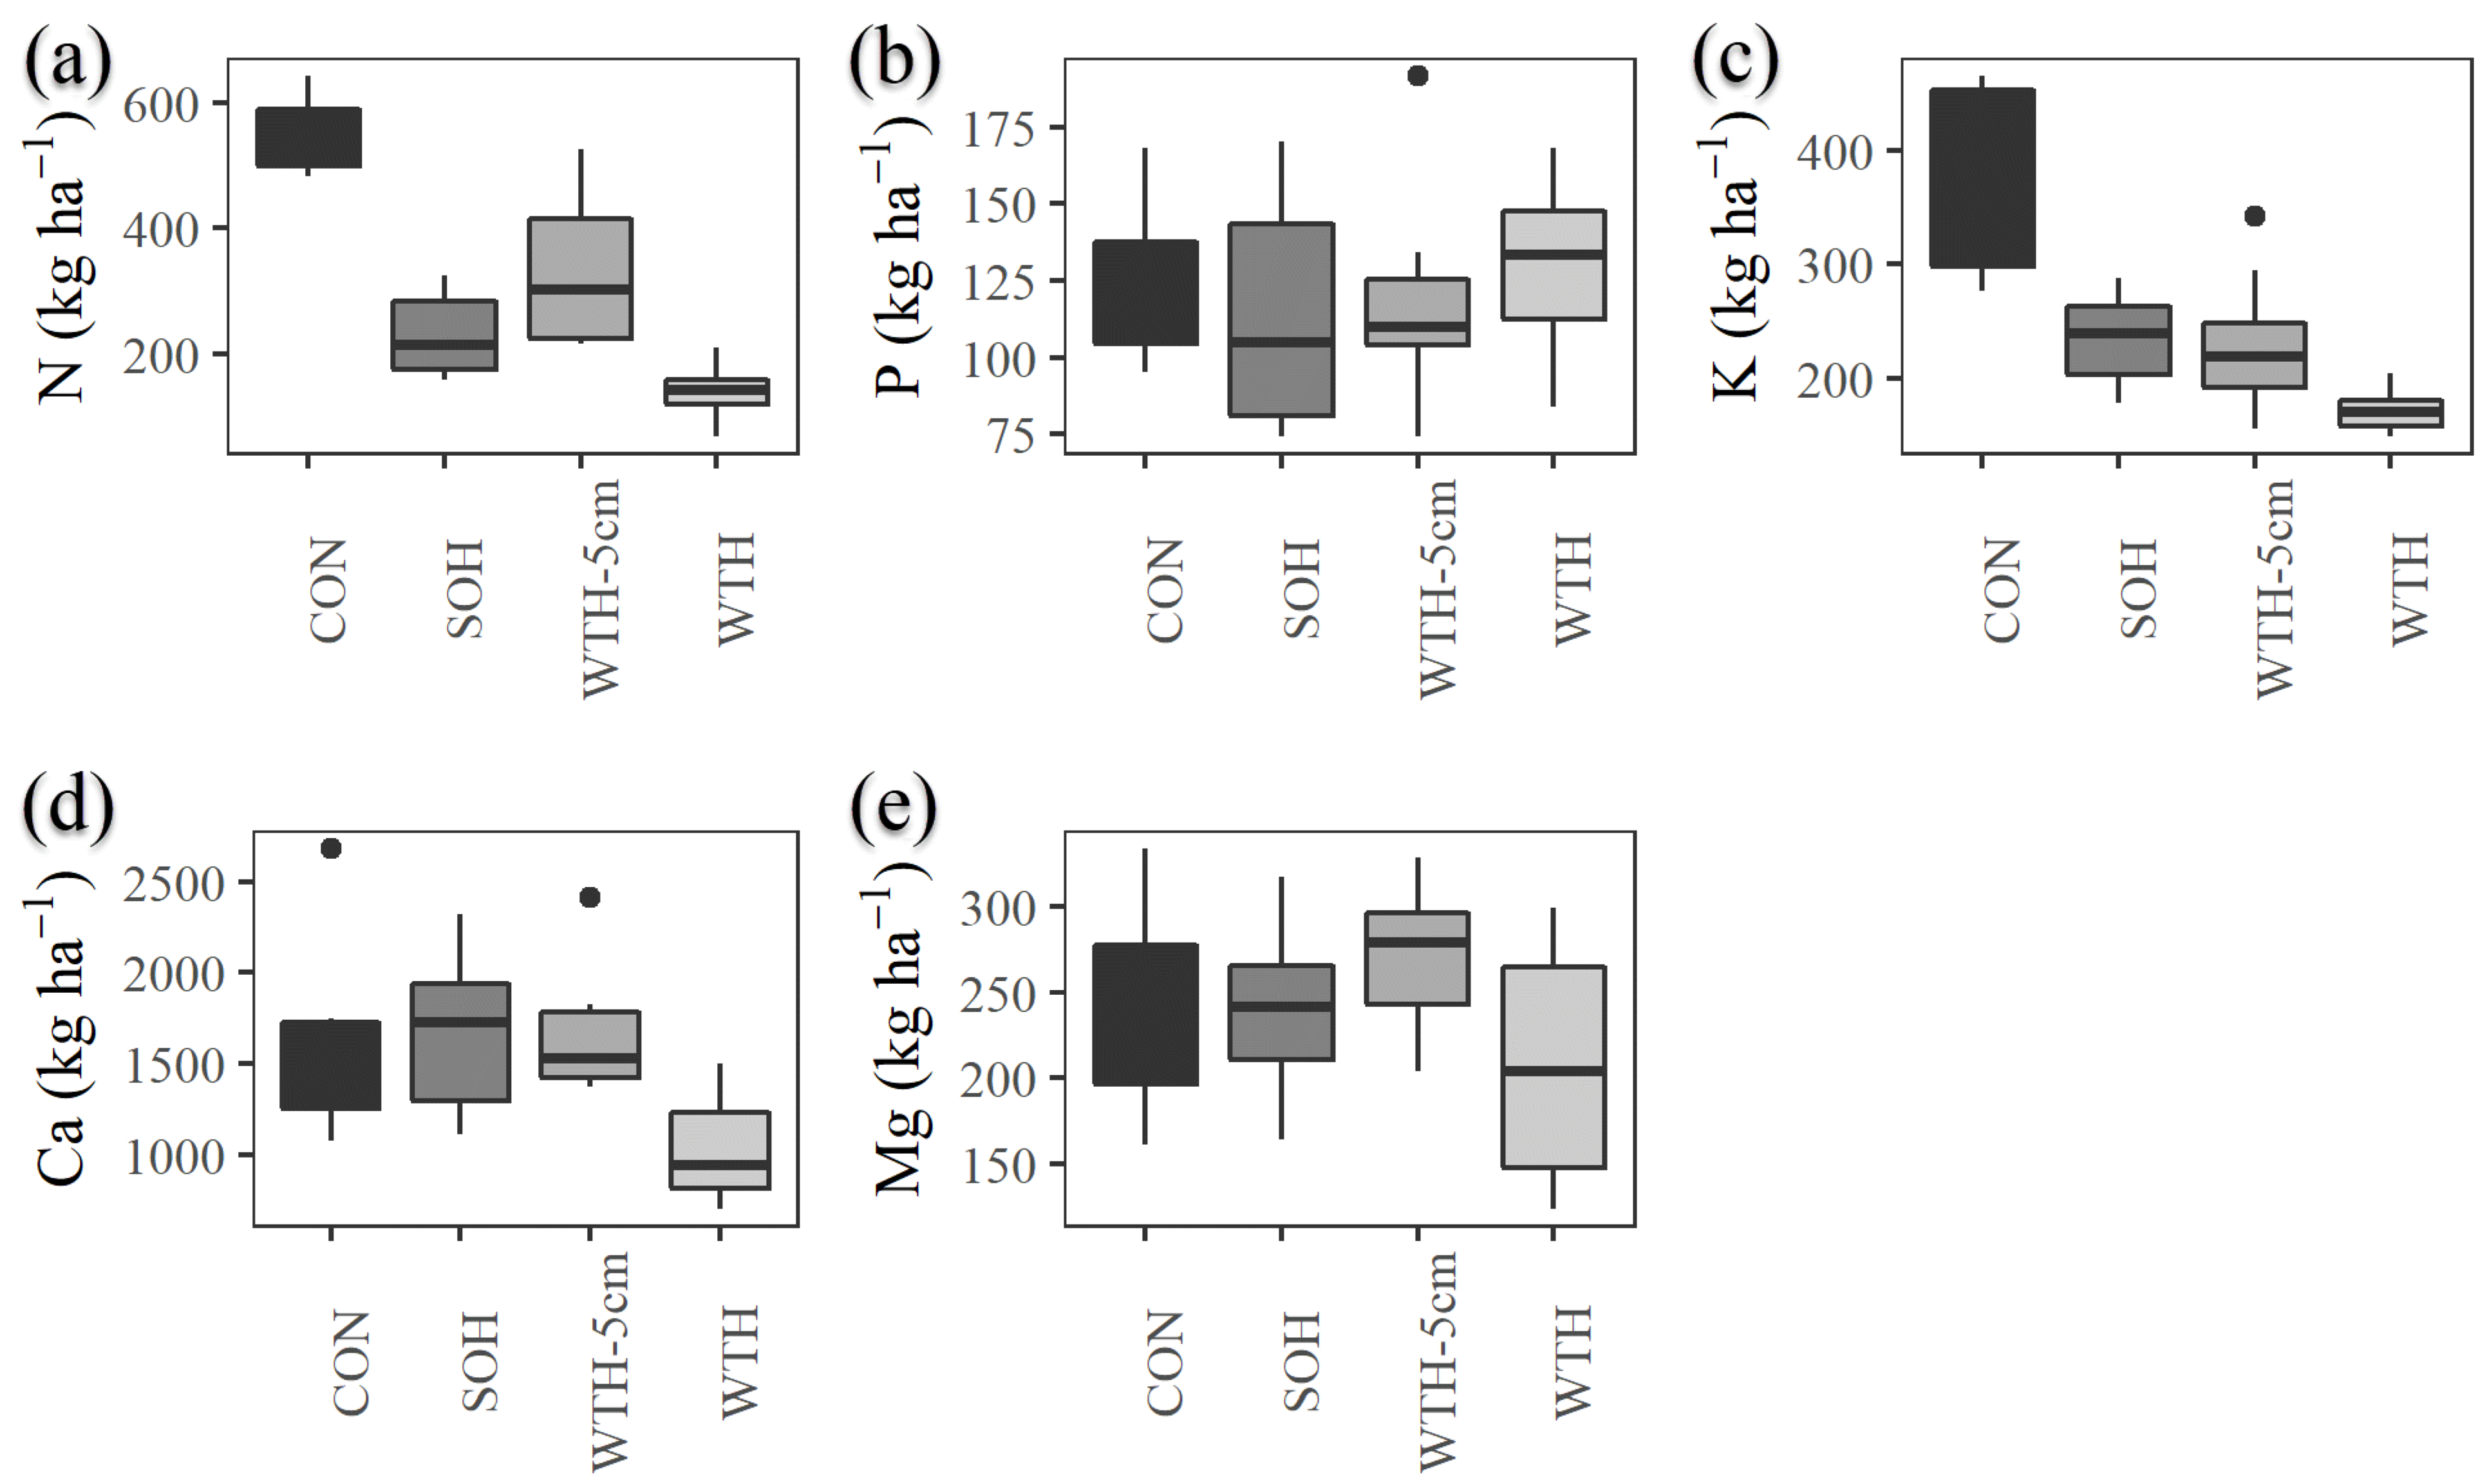
The total nutrient pools consisting of the soil 0–60 cm, forest litter, and woody debris showed no differences across all treatments for P and Mg, between the CON and all harvests for N and K, and between the WTH and all other treatments for Ca (Figure 2, Table 2). The WTH removed an additional 633 Ca kg ha−1 as compared to the SOH and 624 Ca kg ha−1 as compared to the WTH-5 cm. The harvest treatments were not significantly different from each other but removed significant amounts of N and K as compared to the unharvested control. The harvest treatments removed additional N, 313 SOH, 212 WTH-5 cm, and 402 WTH kg ha−1, and K, 131 SOH, 137 WTH-5 cm, and 194 WTH kg ha−1.
3.3. Soil Macronutrients
The soil 0–8 cm showed no differences between all treatments for P, K, or Mg (Figure 3). The soil 0–8 cm depth showed significant differences in N and Ca, with the WTH-5 cm being greater than the CON and WTH, 86 and 76 kg ha−1, respectively, and for Ca, the SOH was greater than the CON and SOH, 405 and 336 kg ha−1, respectively. The soil 8–60 depth interval similarly showed no differences for P, K, and Mg but had significantly greater N in the WTH-5 cm, with 48 kg ha−1 being greater than the CON, and for Ca, WTH-5 cm was larger than the CON and the WTH, 433 and 348 kg ha−1, respectively (Figure 3).
In comparison with the pre-harvest total ecosystem values, a decline in N and K was observed for the SOH and WTH-5 cm, and the WTH decreased the N, K, and Ca pools (Table 3). The largest differences between the pre-harvest total and observations at 93 months were in the woody debris and soil pools. The woody debris of SOH and WTH-5 cm increased and WTH decreased across all nutrients. In the soil 0–8 cm and soil 8–60 cm pools, N and Ca increased, and K decreased across all harvest types.
4. Discussion
4.1. Harvest Intensity Signal
The theoretical difference between the control and the harvest types should be evident in the woody debris immediately after the harvest, and then in the forest floor and soil pools as the debris begin to decompose. As compared to the SOH, the initial study detected an additional 19,500 kg ha−1 of woody debris removed from the WTH and 7200 kg ha−1 from the WTH-5 cm. A decomposition model equation for white oak (Quercus alba) showed that 93 months post-harvest will have decomposed approximately 91%–93% of the FWD located on the soil surface and 60%–86% of the FWD suspended above the soil surface [17]. The decomposition model was developed in North Carolina and as such, would likely be an overestimation for the site in northern Wisconsin as 17% of the WTH, 58% of the WTH-5 cm, 30% of the SOH, and 48% of the CON woody debris mass remained. The woody debris in the SOH showed significant decreases from the original assessment 1.75 years post-harvest, while all other treatments were not significantly different, though decreases were observed. The comparison is not ideal because the 1.75-year post-harvest values are from all five study sites, and the 93-month values are from the two available harvest sites. Significant differences between the soil types [12] could result in productivity and woody debris differences, however, the ratios of the woody debris between the harvests should be consistent. After 93 months, the woody debris was only significantly different between the WTH-5 cm and WTH, and all treatments were not significantly different from the CON pre-harvest levels. In comparison to the unharvested values from the same site, large increases in woody debris were observed in the SOH and WTH-5 cm, and decreases were observed in the WTH across all nutrients. Taken together, the evidence points to the woody debris signal from the harvest remaining in the SOH and WTH-5 cm, while no longer being evident in the WTH.
4.2. Macronutrient Species Differences
Previously, Ca and Mg pools have been identified as potentially at risk of removal by WTH in aspen stands [1,3]. Differences in the chemical composition of the overstory species present may explain why we did not see changes in Mg stocks, as the oak has approximately 53 kg ha−1 less in the total tree than the average aspen value [8,18,19]. However, similar declines in soil K and Ca and increases in soil N were observed in a long-term study of 20 years in aspen stands, similar to the observations at 93 months [20]. Regardless of the complexities involved in modeling forest harvests and the necessity to rely on various assumptions and definitions, the reassessment of the experimental site after 93 months allowed for the direct measurement of the nutrient pools. Resampling the nutrient pools indicated significant declines in the N and K pools from all harvest types, and for Ca, the WTH was significantly smaller than the other harvests.
4.3. Total Macronutrients
Although significant differences in the amounts of woody residues between harvest types were detected, the difference may not be of consequence to the total nutrients available if the annual inputs can match the outputs over a rotation. The total pools showed significant differences between the CON and all harvests for N and K, between the WTH and all treatments for Ca, and showed no differences between all treatments for P and Mg. In other words, all harvest types removed significant amounts of N and K as compared to an unharvested site, and the WTH removed significantly more Ca than the SOH. Because the coarse-textured soils have little ability to retain macronutrients otherwise lost to leaching, and the harvest signal still appears to exist in the woody debris, it will likely take a rotation or more to document the full effects of the harvest intensity experiment. The P and Mg pools remained consistent across all treatments and contradict the modeling exercise results of the original study which showed losses of P in the WTH.
4.4. Magnitude of Differences
The original study detected that the WTH removed an additional 53 ± 17 N, 21 ± 7 P, 149 ± 42 K, 131 ± 53 Ca, and 32 ± 9 Mg kg ha−1, and at 93 months, the WTH was observed to remove an additional 89 ± 200 N, −16 ± 48 P, 63 ± 120 K, 634 ± 1362 Ca, and 32 ± 148 Mg as compared to the SOH. The differences between N and K appear to be consistent with the original study, but the Ca difference in the original study is only 20% of the difference observed after 93 months, which could be indicative of the low retention of this base cation in outwash soils [21].
4.5. Nutrient Model Complications of the Original Study
Although differences were detected in woody residue and the macronutrients between treatments [8,9], the nutrient budget only showed P as a concern for net depletion. The difference in woody residue values was not individually specified as a term to the nutrient budget, which listed the inputs as precipitation and mineralization + mineral weathering and outputs as leaching and biomass retention. The difference in woody debris could be included in the biomass retention or some combination of the leaching and mineralization + mineral weathering terms. However, across all macronutrients there is at least one treatment value larger in the mineralization or biomass retention, which implies that woody debris could not have been directly included unless other ecosystem parameters, such as differences in age or weathering rates, masked the harvest intensity signal. The exclusion or masking of the differences in woody debris in the nutrient model and the size of the atmospheric deposition in comparison to other measurements of the input and leaching pools were notable complications with the harvest model of the original study [8], which we discuss below.
4.6. Model—Woody Residues
The woody debris was not specified as an individual term but theoretically could be present in the biomass retention or mineralization + mineral weathering and leaching pools. The biomass retention output term is specified as the “nutrient content in fully grown trees, pre-harvest/average age (80 years)–based on pre-harvest tree biomass calculations and tree ring dating”, and the mineralization + weathering was measured by a resin at 5 cm and 20 cm depth in the soil [8]. The macronutrient pools in the WTH treatments exceeded the pools measured in the SOH treatments in some cases, implying that the woody debris differences were not sufficiently included in the output term unless age was a confounding factor and masked the harvest intensity signal. The woody debris differences also do not appear to be included in addition to the collected mineralization and mineral weathering and leaching terms, as the WTH fell within the middle of the observations. Given the inability to (i) identify where the woody debris differences were included in the nutrient budget from the stated methods and (ii) to reconcile the provided values with the woody debris differences, we are left to speculate where or if the woody debris values were included.
Whether or not the woody debris pools were assumed to be available within the mineralization term could potentially explain inconsistencies in the inclusion of this pool in the modeling efforts. Nutrients have been found to be immobilized in litter decomposition with N released at approximately 40% mass decomposition [22]. If the woody harvest residues were assumed to be detectable within 0.5–1.75 years and were captured by a resin at 5 cm and 20 cm depth in the soil, the time of observation could explain the differences between the woody debris pools 1.75 years after the harvest, but not in the nutrient budget as the woody debris was decomposing. The decomposition model showed that at 1.75 years, the estimated maximum decomposition would be 8%–10% for FWD located on the soil surface and 0%–11% for FWD suspended above the soil [17], which again is likely an overestimate to what could be expected in northern Wisconsin. If this was the case, the original study would have only had the potential to capture approximately 10% of the inputs from the decomposition of the FWD, which more likely reflected past management history rather than differences between the woody debris harvest intensity experiment.
4.7. Model—Deposition and Leaching
The deposition values reported in the original study from the growing season were generally larger than the combined annual wet and dry depositions estimated from the National Atmospheric Deposition Program (NADP) values for the same years [8,23] (Table A2). Calcium was particularly notable, as the reported value was 19 times higher than the total deposition values [23]. The N values reported in the original study are almost twice that of the estimated values in 2010, but nearly equal in 2011, whereas the Mg values are 2–3 times larger (Table A2). The P values are one-third of that estimated in 2010 but are slightly larger in 2011 (Table A2). The underestimation of P deposition in the year 2010 would mitigate the losses and change the status from depletion to accumulation. However, the 2011 P budget would still be considered in the depletion status with the updated deposition values.
The leaching values were measured at 60 cm and are likely still plant-available since juvenile bur oak (Quercus macrocarpa) have been found to have roots at 1.37 m [24]. If the original leaching values were imputed from the first harvest years until the undisturbed forest values at 80 years, the total lost during one rotation to leaching would be N 243, P 148, K 299, Ca 610, and Mg 630 kg ha−1. In proportion, the imputed leaching values up to 80 years are 321% N, 29% P, 85% K, 25% Ca, and 98% Mg of the observed soil’ pool in the original study. Taken together, assuming nutrients at 60 cm are lost from the soil owing to leaching likely adds to uncertainty in the nutrient budget.
Although significant differences in woody debris were identified by harvest intensity type, the harvest model showed only P at risk of net depletion. Because the woody debris was not specifically identified within the terms of the model and the WTH values fell between treatments that removed less woody debris, we speculate that the debris was either (i) included with the biomass retention and masked by the age of the stands or (ii) assumed to be available for uptake in the mineralization pool. The input term from precipitation tended to be much larger than reported by the NADP for the same years, and the output term through leaching was sampled at a plant-available depth that composed of large percentages of the soil pools. The complexity of establishing a nutrient budget with the assumptions necessary for sampling appears to have masked the signal of the harvest detected in the initial study and resampling at 93 months.
5. Conclusions
Significant decreases in the total nutrient pools of N and K occurred from all harvest types, and Ca in WTH was significantly decreased compared to all other treatments after 93 months in an oak-dominated system; this result differs from the prior study conducted after 1.75 years since harvesting. Although initial findings from 1.75 years after the harvest documented differences in woody debris between treatments, those values did not manifest as differences in the nutrient budget model. This study suggests that differences in treatment could be confounded by changes in the age of the forest at harvest and assumptions of pool availability through mineralization and decomposition models, which indicate only 10% of the debris, would have potentially decomposed. The differences in woody debris were detected in the original study and again at 93 months, as the WTH was significantly smaller for P, K, Ca, and Mg as compared to the other harvests. The harvest intensity signal likely remains in the woody debris for the SOH and WTH-5 cm. We note that these pools are large and highly variable, an indication that long-term observations may be necessary to fully document the harvest intensity effects on coarse-textured soils. To constrain error in future assessments of nutrient budget responses to harvesting, we suggest that the timing of observations and sampling procedures be critically evaluated to minimize the ability of ecosystem variation and budget terms inconsistent with regional patterns to mask the harvest intensity signal. Revisiting the sites at 93 months post-harvest versus the original 1.75 years allowed for the detection of differences in the total N, K, and Ca pool sizes.
Author Contributions
Conceptualization, R.R., E.K., D.B. and R.K.; methodology, R.R., E.K., D.B. and R.K.; software, R.R.; validation, R.R., E.K. and D.B.; formal analysis, R.R., E.K. and D.B.; investigation, R.R., E.K., D.B. and R.K.; resources, E.K. and D.B.; data curation, R.R.; writing—original draft preparation, R.R., E.K. and D.B.; writing—review and editing, R.R., E.K., D.B. and R.K.; visualization, R.R.; supervision, E.K. and D.B.; project administration, E.K. and D.B.; funding acquisition, E.K. and D.B. All authors have read and agreed to the published version of the manuscript.
Funding
This research was funded by the Wisconsin Department of Natural Resources, in-kind support from the U.S. Forest Service, Northern Research Station and the Ecosystem Science Center.
Data Availability Statement
The source data can be found in the public repository https://zenodo.org/record/7093486#.YyiXQ3bMKUk (accessed on 19 September 2022) and DOI: 10.5281/zenodo.7093486.
Acknowledgments
The Wisconsin Department of Natural Resources provided funding, equipment, and field sampling. This project received in-kind support from the USDA Forest Service, Northern Research Station. We thank Stan Vitton for early revision comments and the field and lab technicians that made the project possible: Jake DeVries and Jesse Barta.
Conflicts of Interest
The authors declare no conflict of interest.
Appendix A

Table A1.
Coarse and fine woody debris pools by harvest type (CON = control, SOH = stem-only harvest, WTH-5 cm = whole-tree harvest up to 5 cm, WTH = whole-tree harvest) and forest floor values post-harvest where differences in lower-case letters denote significant differences derived from tables 8, 9, 10 in [9].
| Debris Type | Treatment | N | P | K | Ca | Mg | OM |
|---|---|---|---|---|---|---|---|
| CWD | WTH | 1 a ± <1 | 1 a ± <1 | 13 a ± 4 | 5 a ± <1 | 2 a ± <1 | 1400 a ± 600 |
| WTH-5 cm | 17 b ± 2 | 15 b ± <1 | 125 b ± 22 | 49 b ± 6 | 23 b ± 2 | 13,000 b ± 3500 | |
| SOH | 24 b ± 5 | 20 b ± 5 | 152 b ± 37 | 68 b ± 14 | 30 b ± 7 | 19,000 a ± 3000 | |
| CON | 3 a ± 1 | 3 a ± 1 | 34 a ± 13 | 11 a ± 4 | 5 a ± 2 | 4100 b ± 1500 | |
| FWD | WTH | 40 a ± 7 | 3 a ± <1 | 10 a ± 1 | 67 a ± 7 | 4.8 a ± <1 | 9000 c ± 1300 |
| WTH-5 cm | 55 a ± 9 | 4.2 a ± 1 | 14 a ± 3 | 99 a ± 40 | 7.2 a ± 2 | 13,000 ac ± 2200 | |
| SOH | 70 a ± 9 | 5.3 a ± 1 | 20 a ± 6 | 135 a ± 44 | 9.2 a ± 2 | 14,000 a ± 2400 | |
| CON | 27 a ± 4 | 1.7 a ± <1 | 5.2 a ± 1 | 47 a ± 5 | 3.4 a ± <1 | 6000 b ± 800 | |
| FF | WTH | 212 b ± 113 | 18 b ± 10 | 20 a ± 11 | 233 b ± 104 | 28 b ± 17 | 22,000 a ± 13,000 |
| WTH-5 cm | 223 ab ± 75 | 16 ab ± 2 | 18 a ± 6 | 221 ab ± 74 | 27 ab ± 10 | 22,000 a ± 1800 | |
| SOH | 203 a ± 59 | 17 a ± 7 | 22 a ± 9 | 242 a ± 25 | 30 a ± 16 | 20,000 a ± 13,000 | |
| CON | 240 b ± 36 | 18 ab ± 5 | 20 a ± <1 | 268 ab ± 15 | 31 b ± 11 | 22,000 a ± 11,000 |
Table A2.
Average deposition values in kg ha−1 for the years of 2010–2011 on the harvest intensity study site in northern Wisconsin. The values reported in the Wilhelm study generally overestimate the values in comparison to Schwede & Lear (2014) [24].
Table A2.
Average deposition values in kg ha−1 for the years of 2010–2011 on the harvest intensity study site in northern Wisconsin. The values reported in the Wilhelm study generally overestimate the values in comparison to Schwede & Lear (2014) [24].
| Year | Study | N | P | K | Ca | Mg |
|---|---|---|---|---|---|---|
| 2010 | Wilhelm et al., 2013 [8] | 9.40 | 0.07 | 2.65 | 7.50 | 0.57 |
| Schwede & Lear, 2014 [24] | 5.05 | 0.21 | - | 1.92 | 0.25 | |
| 2011 | Wilhelm et al., 2013 [8] | 4.16 | 0.24 | 16.90 | 34.10 | 0.81 |
| Schwede & Lear, 2014 [24] | 4.60 | 0.20 | - | 1.78 | 0.24 |
References
- Boyle, J.R.; Phillips, J.J.; Ek, A.R. “Whole Tree” Harvesting: Nutrient Budget Evaluation. J. For. 1973, 71, 760–762. [Google Scholar]
- Olsson, B.A.; Bengtsson, J.; Lundkvist, H. Effects of different forest harvest intensities on the pools of exchangeable cations in coniferous forest soils. For. Ecol. Manag. 1996, 84, 135–147. [Google Scholar] [CrossRef]
- Silkworth, D.R.; Grigal, D.F. Determining and Evaluating Nutrient Losses Following Whole-tree Harvesting of Aspen. Soil Sci. Soc. Am. J. 1982, 46, 626–631. [Google Scholar] [CrossRef]
- Sverdrup, H.; Rosen, K. Long-term base cation mass balances for Swedish forests and the concept of sustainability. For. Ecol. Manag. 1998, 110, 221–236. [Google Scholar] [CrossRef]
- Thiffault, E.; Hannam, K.D.; Paré, D.; Titus, B.D.; Hazlett, P.W.; Maynard, D.G.; Brais, S. Effects of forest biomass harvesting on soil productivity in boreal and temperate forests—A review. Environ. Rev. 2011, 19, 278–309. [Google Scholar] [CrossRef]
- Premer, M.I.; Froese, R.E.; Vance, E.D. Whole-tree harvest and residue recovery in commercial aspen: Implications to forest growth and soil productivity across a rotation. For. Ecol. Manag. 2019, 447, 130–138. [Google Scholar] [CrossRef]
- Bowd, E.J.; Banks, S.C.; Strong, C.L.; Lindenmayer, D.B. Long-term impacts of wildfire and logging on forest soils. Nat. Geosci. 2019, 12, 113–118. [Google Scholar] [CrossRef]
- Wilhelm, K.; Rathsack, B.; Bockheim, J. Effects of timber harvest intensity on macronutrient cycling in oak-dominated stands on sandy soils of northwest Wisconsin. For. Ecol. Manag. 2013, 291, 1–12. [Google Scholar] [CrossRef]
- Rathsack, B. Harvest Intensity Impacts on Oak-Dominated Hardwood Ecosystems on Sandy Soil in Northeastern Wisconsin; University of Wisconsin: Madison, WI, USA, 2011. [Google Scholar]
- Kolka, R.; Grigal, D.; Nater, E. Forest soil mineral weathering rates: Use of multiple approaches. Geoderma 1996, 73, 1–21. [Google Scholar] [CrossRef]
- Richard, R.P.; Kane, E.S.; Bronson, D.R.; Kolka, R.K. Long-Term Ecosystem Nutrient Pool Status for Aspen Forest Harvest Simulations on Glacial Till and Sandy Outwash Soils. Forests 2021, 12, 1556. [Google Scholar] [CrossRef]
- Wilhelm, K. Effects of Timber Harvest Intensity on Macronutrient Cycling on Oak-Dominated Sandy Soils in Northwest Wisconsin; University of Wisconsin: Madison, WI, USA, 2011. [Google Scholar]
- Jurgensen, M.F.; Page-Dumroese, D.S.; Brown, R.E.; Tirocke, J.M.; Miller, C.A.; Pickens, J.B.; Wang, M. Estimating Carbon and Nitrogen Pools in a Forest Soil: Influence of Soil Bulk Density Methods and Rock Content. Soil Sci. Soc. Am. J. 2017, 81, 1689–1696. [Google Scholar] [CrossRef]
- Bray, R.H.; Kurtz, L.T. Determination of Total, Organic, and Available Forms of Phosphorus in Soils. Soil Sci. 1945, 59, 39–46. [Google Scholar] [CrossRef]
- Menage, P.; Pridmore, B. Automated determination of phosphate using Bray No 1 Extractant. Notes Soil Tech. 1973, 20, 80–82. [Google Scholar]
- Lachat Instruments. QuikChem Method 12-107-04-1-F and Method 12-107-06-1-B; Lachat Instruments: Milwaukee, WI, USA, 1998. [Google Scholar]
- Fasth, B.G.; Harmon, M.E.; Sexton, J.; White, P. Decomposition of fine woody debris in a deciduous forest in North Carolina. J. Torrey Bot. Soc. 2011, 138, 192–206. [Google Scholar] [CrossRef]
- Pastor, J.; Bockheim, J.G. Distribution and Cycling of Nutrients in an Aspen-Mixed-Hardwood-Spodosol Ecosystem in Northern Wisconsin. Ecology 1984, 65, 339–353. [Google Scholar] [CrossRef]
- Perala, D.A.; Alban, D.H. Biomass, nutrient distribution and litterfall in Populus, Pinus and Picea stands on two different soils in Minnesota. Plant Soil 1982, 64, 177–192. [Google Scholar] [CrossRef]
- Slesak, R.A.; Palik, B.; D’Amato, A.W.; Kurth, V.J. Changes in soil physical and chemical properties following organic matter removal and compaction: 20-year response of the aspen Lake-States Long Term Soil Productivity installations. For. Ecol. Manag. 2017, 392, 68–77. [Google Scholar] [CrossRef]
- Cleavitt, N.L.; Battles, J.J.; Johnson, C.E.; Fahey, T.J. Long-term decline of sugar maple following forest harvest, Hubbard Brook Experimental Forest, New Hampshire. Can. J. For. Res. 2018, 48, 23–31. [Google Scholar] [CrossRef]
- Parton, W.; Silver, W.L.; Burke, I.C.; Grassens, L.; Harmon, M.E.; Currie, W.S.; King, J.Y.; Adair, E.C.; Brandt, L.A.; Hart, S.C.; et al. Global-Scale Similarities in Nitrogen Release Patterns During Long-Term Decomposition. Science 2007, 315, 361–364. [Google Scholar] [CrossRef] [PubMed]
- Schwede, D.B.; Lear, G.G. A novel hybrid approach for estimating total deposition in the United States. Atmospheric Environ. 2014, 92, 207–220. [Google Scholar] [CrossRef] [Green Version]
- Burns, R.M.; Honkala, B.H. Silvics of North America: Volume 2. Hardwoods; Forest Service, Agriculture Handbook 654; United States Department of Agriculture (USDA): Washington, DC, USA, 1990.
Figure 1.
Macronutrients N, P, K, Ca, and Mg (a–e) and woody debris (f) at 93 months after harvest by harvest treatment. The WTH was significantly lower than the SOH and WTH-5 cm for P, K, Ca, and Mg (b–e) (α = 0.05). The SOH and WTH-5 cm tended to not be significantly different from the CON but were larger with more variation (a–f). These indicate that the signal of the harvest intensity experiment is nearing an end in the WTH and is still decomposing in the SOH and WTH-5 cm.

Figure 2.
Boxplots of the total macronutrients N, P, K, Ca, and Mg (a–e) pools consisting of woody debris, forest floor, soil 0–8, soil 8–60, and tree mass by harvest types (CON = control, SOH = stem-only harvest, WTH-5 cm = whole-tree harvest up to 5 cm, WTH = whole-tree harvest). Significant differences were detected for N across all treatments, for K between the CON and the harvests, and for Ca between WTH and other treatments in the Tukey HSD test (α = 0.05).

Figure 3.
Specific nutrient pools by harvest type N, P, K, Ca, and Mg (a–e) (CON = control, SOH = stem-only harvest, WTH-5 cm = whole-tree harvest up to 5 cm, WTH = whole-tree harvest) including woody debris, forest floor, soil 0–8 cm, soil 8–60 cm, and tree component normalized by the proportion to the average total value. The WTH tended to have significantly fewer macronutrients in the woody debris values compared to other harvest types and the control (α = 0.05).

Table 1.
Summary of nutrient observations from the original and current study investigating effects from a harvest in 2009.
Table 1.
Summary of nutrient observations from the original and current study investigating effects from a harvest in 2009.
| Observation | Wilhelm et al., 2013 [8] | Current Study |
|---|---|---|
| Soil 0–8 cm | 2010 | 2017 |
| Soil 8–60 cm | 2010 | 2017 |
| Mineralization + Weathering | 2010–2011 | |
| Leachate | 2010–2011 | |
| Forest Litter | 2010 | 2017 |
| Fine Woody Debris | 2010 | 2017 |
| Herbaceous and Shrub | 2010 | |
| Tree Components | 2009 | |
| Atmospheric Deposition | 2010–2011 |
Table 2.
Average kilograms per hectare and confidence intervals (α = 0.05) of nutrient pools by harvest type (CON = control, SOH = stem-only harvest, WTH-5 cm = whole-tree harvest up to 5 cm, WTH = whole-tree harvest). Wilcoxon signed-rank test p-values by nutrient pool and element, showing significant differences across all elements for woody debris, litter Mg, and N and K for the total pools (α = 0.05). Significant differences reported by differences in lower-case letters.
| Nut. Pool | Type | N | P | K | Ca | Mg | Debris |
|---|---|---|---|---|---|---|---|
| Total | CON | 544 a ± 41 | 123 a ± 17 | 366 a ± 56 | 1599 a ± 352 | 244 a ± 41 | |
| SOH | 231 b ± 46 | 113 a ± 25 | 235 b ± 26 | 1672 a ± 295 | 241 a ± 33 | ||
| WTH-5 cm | 332 b,c ± 85 | 118 a ± 24 | 229 b ± 43 | 1663 a ± 239 | 271 a ± 29 | ||
| WTH | 142 b,d ± 31 | 129 a ± 19 | 172 b ± 13 | 1039 b ± 210 | 209 a ± 47 | ||
| Woody Debris | CON | 30 a,b ± 25 | 1 b,c ± 1 | 4 a,c ± 3 | 29 a ± 14 | 2 b,c ± 1 | 4825 a,b ± 3921 |
| SOH | 66 a,b ± 27 | 3 a,c ± 1 | 11 a ± 5 | 114 b ± 48 | 6 a,c ± 3 | 9772 a,b ± 4769 | |
| WTH-5 cm | 89 a ± 50 | 4 a,c ± 2 | 12 a ± 7 | 90 a,b ± 41 | 6 a,c ± 3 | 14999 a ± 8535 | |
| WTH | 9 b ± 9 | 0 b ± 0 | 1 b,c ± 1 | 9 c ± 8 | 1 b ± 1 | 1758 b ± 2101 | |
| Forest Litter | CON | 22 a ± 6 | 1 a,b ± 0 | 2 a,b ± 1 | 26 a ± 13 | 2 a,b ± 1 | 1556 a ± 626 |
| SOH | 17 a ± 4 | 1 a ± 0 | 1 a ± 0 | 18 a ± 6 | 2 a ± 0 | 842 a ± 241 | |
| WTH-5 cm | 28 a ± 9 | 2 b ± 0 | 3 b ± 1 | 28 a ± 11 | 3 b ± 1 | 1319 a ± 406 | |
| WTH | 21 a ± 5 | 1 a,b ± 0 | 2 a,b ± 1 | 18 a ± 5 | 3 a,b ± 1 | 1017 a ± 291 | |
| Soil (0–8 cm) | CON | 35 a ± 18 | 8 a ± 2 | 78 a ± 29 | 346 a ± 144 | 60 a ± 17 | |
| SOH | 82 a,b ± 21 | 9 a ± 5 | 69 a ± 16 | 751 b ± 191 | 73 a ± 14 | ||
| WTH-5 cm | 121 b ± 59 | 11 a ± 4 | 65 a ± 12 | 602 a,b ± 158 | 65 a ± 14 | ||
| WTH | 45 a ± 12 | 11 a ± 3 | 53 a ± 9 | 415 a ± 154 | 62 a ± 17 | ||
| Soil (8–60 cm) | CON | 47 a ± 16 | 93 a ± 17 | 136 a ± 39 | 511 a ± 209 | 151 a ± 26 | |
| SOH | 66 a,b ± 16 | 100 a ± 25 | 153 a ± 20 | 789 a,b ± 137 | 160 a,b ± 29 | ||
| WTH-5 cm | 95 b ± 21 | 101 a ± 23 | 150 a ± 36 | 944 b ± 149 | 197 b ± 27 | ||
| WTH | 67 a,b ± 24 | 116 a ± 18 | 115 a ± 13 | 596 a ± 120 | 143 a ± 40 |
Table 3.
Percent change from the unharvested site compared to observations at 93 months normalized by the difference between the control groups. The total pool shows decreases in N and K across treatments, and Ca declines in the WTH. The largest differences were in the woody debris and soil pools. Unharvested site information can be found in table 11 [12].
| Nut. Pool | Type | N | P | K | Ca | Mg | Debris |
|---|---|---|---|---|---|---|---|
| Total | SOH | −36 | −2 | −28 | 2 | 0 | |
| WTH-5 cm | −25 | −1 | −29 | 2 | 5 | ||
| WTH | −47 | 2 | −41 | −20 | −6 | ||
| Woody Debris | SOH | 243 | 328 | 184 | 649 | 656 | 101 |
| WTH-5 cm | 398 | 492 | 211 | 466 | 656 | 207 | |
| WTH | −142 | −164 | −79 | −152 | −164 | −62 | |
| Forest Litter | SOH | −2 | 0 | −3 | −2 | 0 | −2 |
| WTH-5 cm | 1 | 4 | 3 | 1 | 2 | −1 | |
| WTH | −1 | 0 | 0 | −2 | 2 | −1 | |
| Soil (0–8 cm) | SOH | 275 | 2 | −17 | 147 | 21 | |
| WTH-5 cm | 503 | 7 | −24 | 93 | 8 | ||
| WTH | 58 | 7 | −46 | 25 | 3 | ||
| Soil (8–60 cm) | SOH | 34 | 2 | 7 | 17 | 2 | |
| WTH-5 cm | 86 | 2 | 5 | 27 | 10 | ||
| WTH | 36 | 6 | −9 | 6 | −2 |
Publisher’s Note: MDPI stays neutral with regard to jurisdictional claims in published maps and institutional affiliations. |
© 2022 by the authors. Licensee MDPI, Basel, Switzerland. This article is an open access article distributed under the terms and conditions of the Creative Commons Attribution (CC BY) license (https://creativecommons.org/licenses/by/4.0/).
Share and Cite
MDPI and ACS Style
Richard, R.; Kane, E.; Bronson, D.; Kolka, R. Whole-Tree Harvest Effects on Macronutrients in an Oak-Dominated System after Seven Years. Forests 2022, 13, 1532. https://doi.org/10.3390/f13101532
AMA Style
Richard R, Kane E, Bronson D, Kolka R. Whole-Tree Harvest Effects on Macronutrients in an Oak-Dominated System after Seven Years. Forests. 2022; 13(10):1532. https://doi.org/10.3390/f13101532
Chicago/Turabian StyleRichard, Robert, Evan Kane, Dustin Bronson, and Randall Kolka. 2022. "Whole-Tree Harvest Effects on Macronutrients in an Oak-Dominated System after Seven Years" Forests 13, no. 10: 1532. https://doi.org/10.3390/f13101532
Note that from the first issue of 2016, this journal uses article numbers instead of page numbers. See further details here.