
Effective and Sustainable Managed Protected Areas: Evaluation and Driving Factors of Eco-Efficiency of China’s Forest Parks


1
Institute of Tibetan Plateau Research, Chinese Academy of Sciences, Beijing 100101, China
2
Institute of Geographic Sciences and Natural Resources Research, Chinese Academy of Sciences, Beijing 100101, China
3
Yunnan Forestry Technological College, Kunming 650224, China
*
Authors to whom correspondence should be addressed.
Forests 2022, 13(9), 1406; https://doi.org/10.3390/f13091406
Submission received: 11 July 2022
/
Revised: 28 August 2022
/
Accepted: 30 August 2022
/
Published: 1 September 2022
(This article belongs to the Section Forest Economics, Policy, and Social Science)
Abstract
:Forest parks are key protected areas that protect biodiversity and important ecosystems with a high efficiency and low cost and have become an international research area of high interest. Eco-efficiency is an important tool to measure the sustainable development of natural protected areas and provides a valuable decision reference for policy-makers. This research constructs a comprehensive performance evaluation system for forest park ecosystems, economic systems, and environmental systems. The undesired output model (SBM), spatial analysis, and panel Tobit regression model are applied to measure and analyze the forest park eco-efficiency in 30 provinces and autonomous regions of the Chinese mainland from 1990 to 2019, as well as the temporal and spatial differentiation characteristics and their driving factors. The results show that (1) both the average level of eco-efficiency and economic efficiency of forest parks show a declining trend; (2) the eco-efficiency of forest parks shows high-efficiency zones in the northeast and northwest, medium-efficiency zones in the west, and low-efficiency zones in the middle region of the Chinese mainland; (3) forest parks in the eastern region with a higher-than-average efficiency are located in Tianjin and Zhejiang Province, while the western region with lower efficiency is located in Xinjiang, Inner Mongolia, Qinghai, and Gansu Province; and (4) the forest park tourism service quality has an important impact on forest parks’ eco-efficiency, but the entertainment activity has a significant negative impact on the eco-efficiency of forest parks. Finally, suggestions are proposed for the sustainable and green development of forest park ecological tourism.
1. Introduction
Protected areas (PAs) are key management areas for protecting biodiversity and ecosystems [1,2,3]. With global climate change and biodiversity conservation issues, PAs and their co-benefits to the economy and the environment, such as the contribution to local economic growth and poverty relief, local residents’ employment, and tourists’ ecological education, have attracted attention from academic experts [4]. Many international scientists and conservation practitioners have called for the expansion of the scope of PAs on a global scale. Brooks (2006) published an article titled ”Global Biodiversity Conservation Priorities” in Science analyzing the prioritizations of conservation practice within the theoretical irreplaceability/vulnerability framework of systematic conservation planning [1]. Watson (2014) published an article titled “The performance and potential of protected areas” in Nature, and found that the amount of land and sea designated as formally protected has markedly increased over the past century, but there was still a major shortfall in political commitments to enhance the coverage and effectiveness of PAs [3]. Since 2010, PAs covering almost 21 million km2 have been added to the global network, with new PAs being added every month as national governments and other stakeholders expand their efforts [5]. By 2020, at least 17% of terrestrial and inland water and 10% of coastal and marine areas, especially areas of particular importance for biodiversity and ecosystem services, were conserved through effective and equitable management [6]. For example, the protected land system and the implementation of protected land protection policies have been established in various countries; moreover, stakeholder networks have been established in some PAs to improve the initiative of stakeholders regarding sustainable development. During the 15th meeting of the Conference of the Parties to the Convention on Biological Diversity (COP15) held in Kunming, China, the Kunming Declaration was adopted and noted the call of many countries to protect and conserve 30 percent of land and sea areas through well-connected systems of PAs and other effective area-based conservation measures by 2030 [7]. PAs vary enormously in their contribution to conserving biodiversity, but the inefficiency of PA systems is widely acknowledged [8]. Therefore, the question of how to protect biodiversity in a high-efficiency and low-cost manner should be given more attention.
Forest parks are an important type of global PA with forest resources and good environmental conditions. Due to the different management systems of PAs in different countries, forest parks serve multiple functions such as resource protection, scientific research, education, and recreation [9]. Forest parks are a key catalogue of the China PA System, which was established in 1980. It was divided into two categories: national and provincial. Forest parks are listed as having co-benefits of ecological, aesthetic, health [10], cultural, and scientific value, as well as poverty relief. Scholars have focused on forest parks’ ecosystem service value [11], tourist perceptual presentation [12,13], land cover and landscape [14,15], and the development performance of the ecotourism industry [16,17]. Most assessments of forest parks’ development focus on only one benefit such as economic value or ecological value [18,19,20,21,22]. There are few assessments on the co-benefits of forest parks, especially including resource consumption and environmental pollution, which need to pay more attention [23,24] to the global Sustainable Development Goals (SDGs).
Eco-efficiency was first proposed by the World Business Council for Sustainable Development (WBCSD) [25,26], which is defined as follows: eco-efficiency is achieved though the delivery of competitively-priced goods and services that satisfy human needs and enhance quality of life, while progressively reducing ecological impacts and resource intensity throughout the life-cycle to a level at least in line with the Earth’s estimated carrying capacity [25]. It is an evaluation of the ecological and environmental impact per unit of production and consumption, where inputs refer to raw materials and energy utilization, and environmental pressures and outputs refer to an increase in life quality and monetary value production. The core connotation of eco-efficiency is to obtain a greater economic output with less of an impact on the ecological environment. It is an indicator of ecological and economic aspects and is an important evaluation tool for sustainable development that emphasizes the co-benefits of ecology, the environment, and the economy. Forest tourism promotes economic growth but exacerbates environmental pollution [27]. Therefore, forest park management urgently needs eco-efficiency for decision-making [28]. In recent years, the eco-efficiency of forest parks has attracted the attention of several scholars, especially in terms of measurement methods, spatial and temporal analysis, and driving influence [29]. However, indicators that consider ecology, economics, and the environment are rare; moreover, driver analysis mainly focuses on the economic and social development conditions of the region where the forest park is located, and few driver analyses focus on the internal policies, systems, and product structure of forest parks.
Therefore, the eco-efficiency evaluation of forest parks is an important tool for sustainable management [27,30,31]. How to consider ecological protection functions and rational utilization functions and to balance the relationship between high-quality construction and sustainable utilization have become challenges for the future sustainable development of forest parks. In view of this dilemma, this paper constructs an eco-efficiency indicator system with multiple inputs and outputs to calculate the input–output rate of forest parks in China [32,33]. The slack-based measure (SBM) and ArcGIS spatial analysis are applied to measure and analyze the dynamic changes in forest park eco-efficiency. The driving factors of the temporal and spatial differentiation characteristics of forest park eco-efficiency are analyzed using panel Tobit regression. The contribution of this study includes the following aspects: first, the ecological and economic value of forest parks was fully considered in terms of the principle of humans and nature developing in harmony; second, the input–output indicator system of the eco-economic system of forest parks was constructed to provide methods and tools to determine the sustainability and effectiveness of forest parks; third, in the analysis on China’s forest parks’ spatial distribution characteristics and driving factors, three evolution stages of eco-efficiency in China’s forest parks were discussed, and the driving mechanism was revealed; then, a reference for sustainable development of PAs was provided. The research results are expected to provide a scientific evaluation of the relationship between ecological protection and the rational utilization of PAs worldwide.
2. Study Area
China’s forest park management has been adjusted in different stages with national ecological protection ideas and institutional mechanisms (Figure 1).
Before 1949, forest parks were built in many places in China, and the outline of forest park establishment regulation was issued. After 1949, forest parks began developing under a new PAs regime system. Zhou Enlai, a former premier of China, suggested establishing the Tu Yun Guan Forest Park in Guiyang, Guizhou Province. Forest parks were managed at the national, provincial, and municipal (county) levels according to resource type, scope of tourism activities, and forestland ownership. In the early stage of China’s reform and opening up, forest parks were a diversified management project of state-owned forest farms [34]. Since the implementation of the natural forest protection project in 1998, it has become an important choice for the transformation of forestry’s main functions. During the “Eleventh Five-Year Plan” (2006–2010), national forest parks were designated as “National Cultural and Natural Heritage Sites of China” and “National Development Prohibited Areas of China” [35]. In 2011, the State Forestry Administration of China promulgated the “Measures of The People’s Republic of China for National Forest Park Management” [36], which further clarified that resource protection is the primary task of forest parks and that the three main functions of national forest parks are protection, education, and recreation. The construction of forest parks has effectively promoted forest tourism and regional economic development.
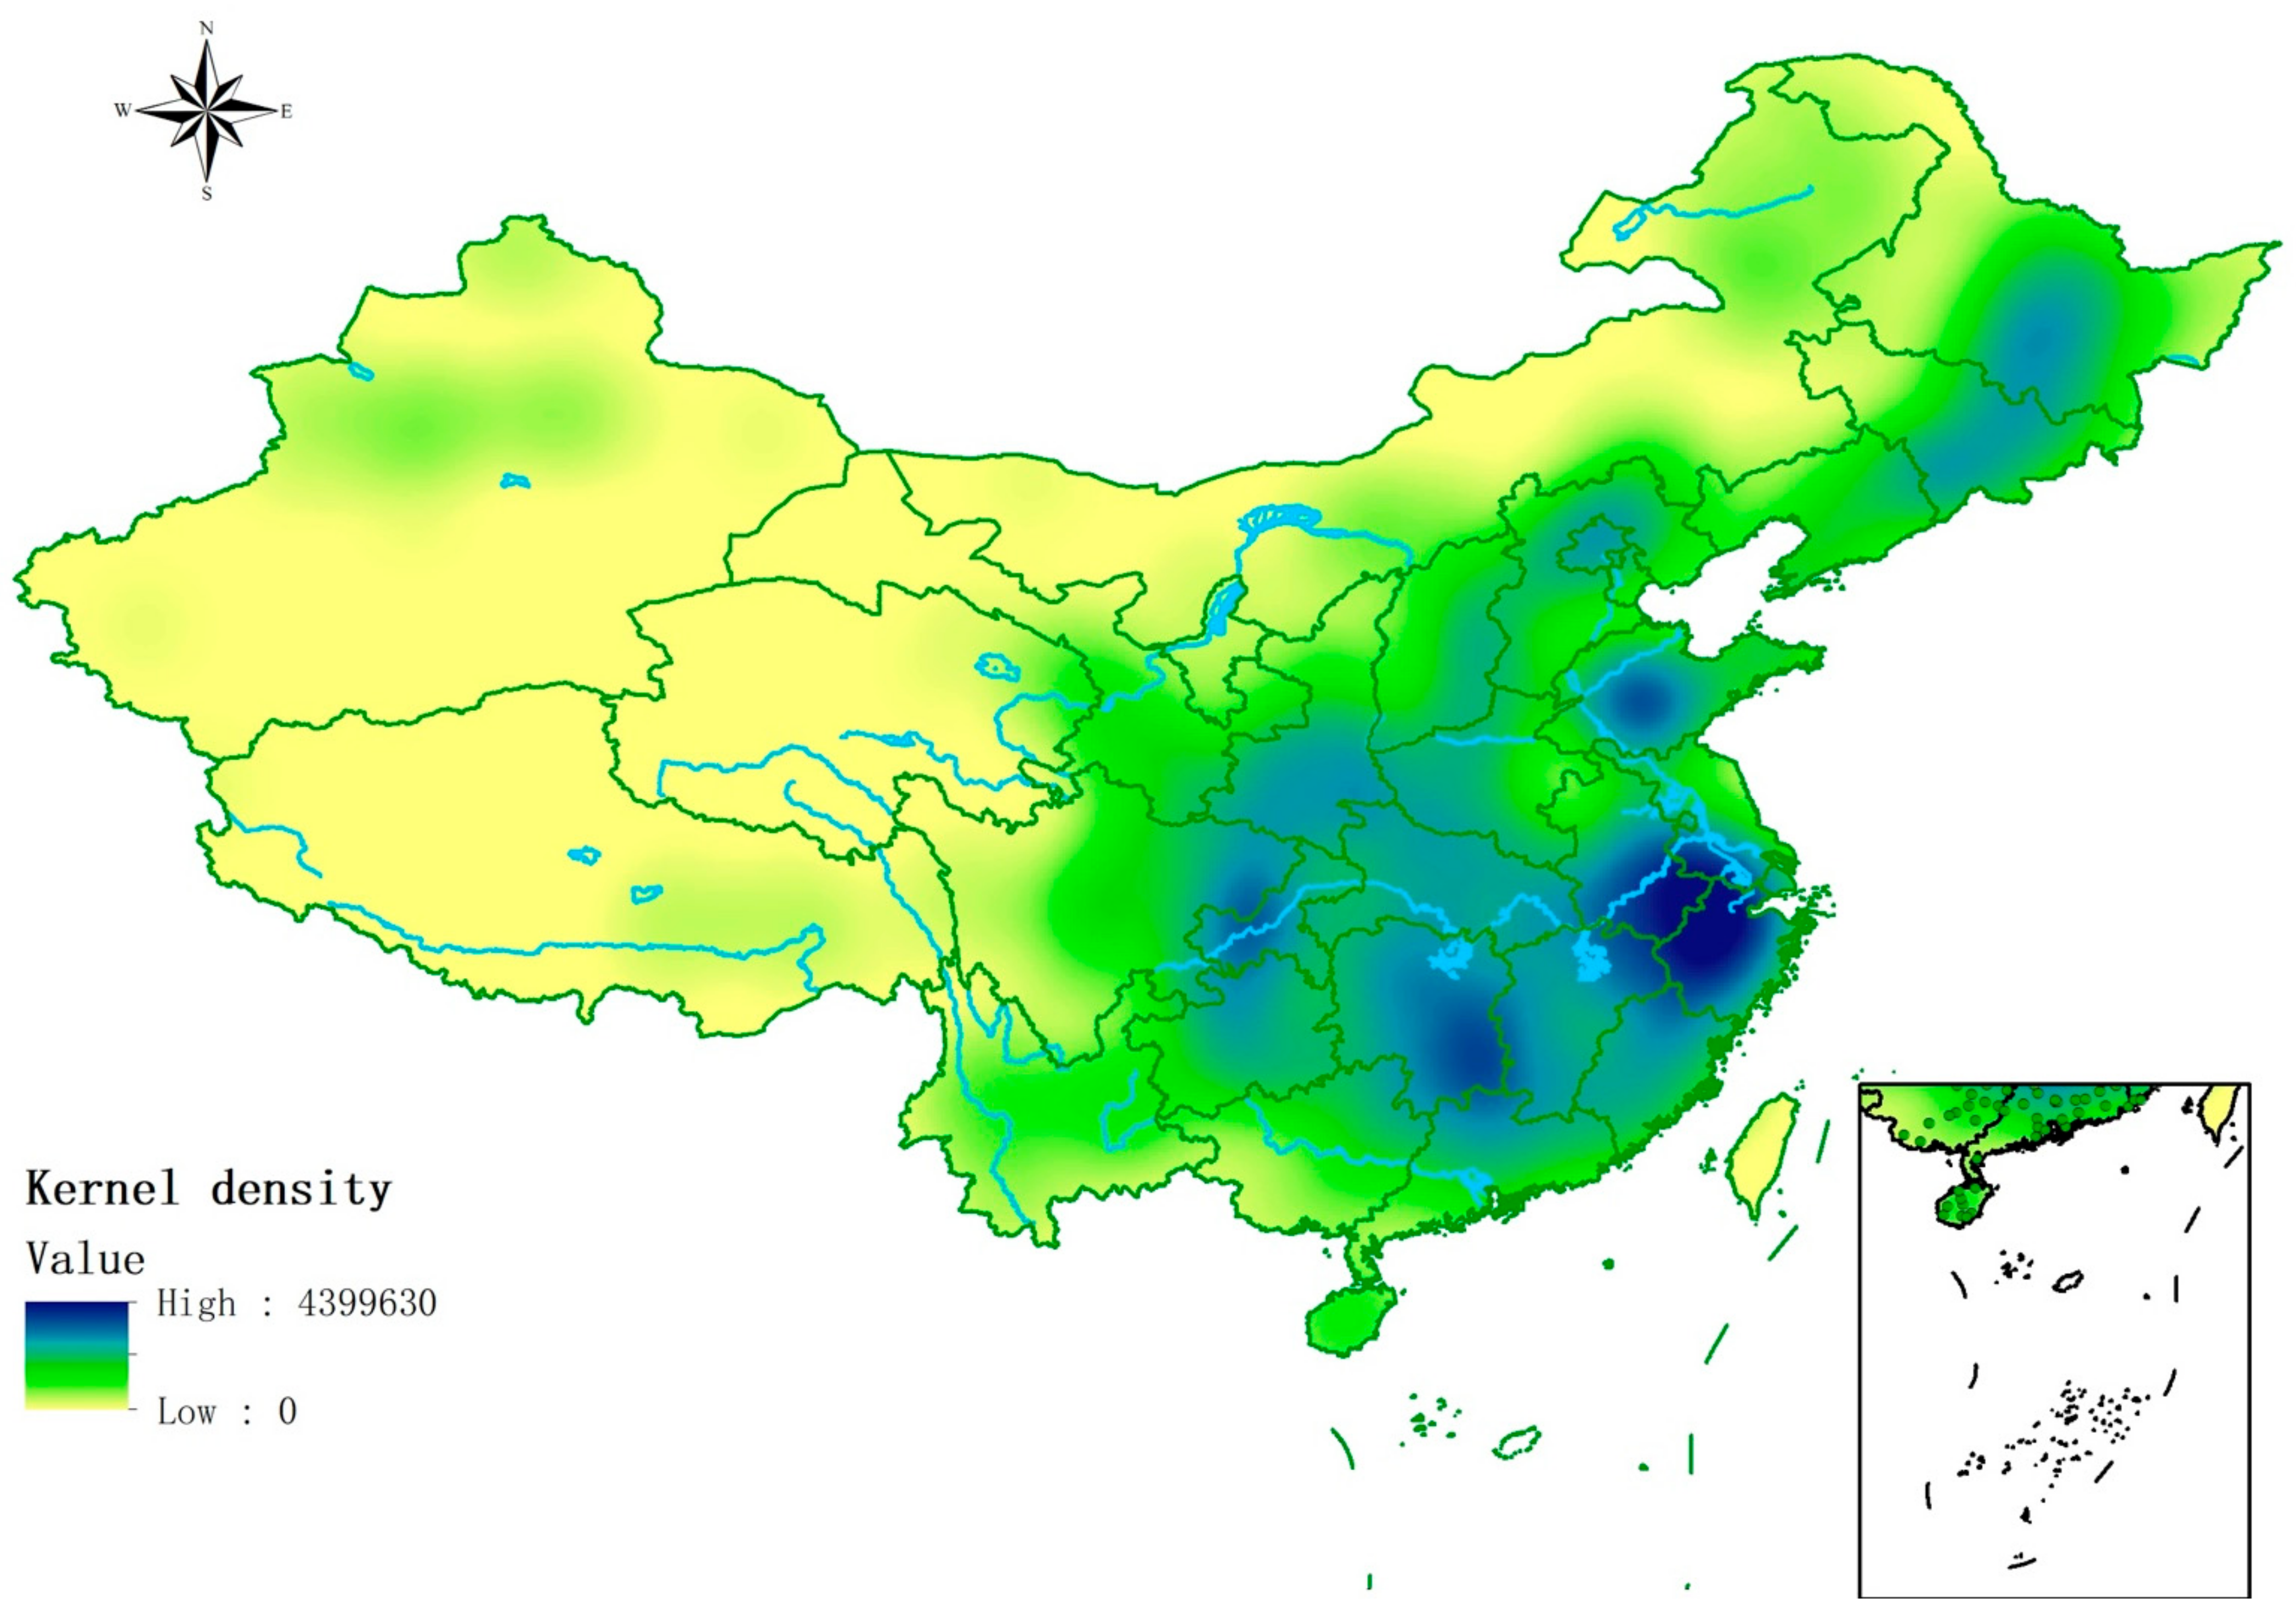
Forest parks entered a new development stage in 2013. China started a pilot national park system in 2013 to explore the overlapping and fragmented problem of protected natural areas [35]. In 2019, the General Offices of the Communist Party of China Central Committee and the State Council issued the “Guidance on Establishing a Protected Area System Composed Mainly of National Parks” [37]. According to the management objectives and efficiency, PAs are divided into three categories: national parks, nature reserves, and nature parks, which are ranked by ecological value and protection intensity. Forest parks are classified into the nature park category, which have the obvious characteristics of sustainable utilization on the premise of protection and attach great importance to eco-efficiency and economic efficiency. By the end of 2019, the total number of national forest parks reached 3564, covering 30 provinces and autonomous regions of the Chinese mainland with a planned area of 18.607 million hm2, including 897 national forest parks with a business area of 12.78 million hm2 [38]. These national forest parks are concentrated in the Yangtze River basin, especially the Yangtze River Delta region. However, they were less distributed in the north of China, especially in the northwest of China (Figure 2).
Recently, China’s forest parks have been in a critical period of transformation and development. Forest tourism strengthened the protection of natural resources, promoted the dissemination of ecological culture, and accelerated regional economic growth. In 2019, CNY 37.03 billion was invested in the construction of forest parks in the whole country, with 67,000 km of tourist trails, 32,400 tourist vehicles and ships, 853,200 reception beds, 1559,300 meal seats, 162,100 employees and 15,700 tour guides [38]. With the scale expansion of forest parks, reducing environmental pollution and resource waste in the process of forest park construction has become a goal. The measurement of eco-efficiency is highly operable, and its conclusion provides a high reference value for policy-makers in environmental management. However, there are few studies on the eco-efficiency of forest parks. Research on the eco-efficiency of forest parks can provide a reference for forestry carbon sequestration measurement and detection and for the government to formulate differential production, construction, and management measures for forest parks.
3. Methods
3.1. Research Framework
This article applied the slack-based measure (SBM) model [39] to evaluate economic efficiency and applied an undesirable-SBM [40] to evaluate the eco-efficiency of forest parks in China. Then, we used the hot spot [41] and gravity center model [42] to analyze the temporal and spatial evolution characteristics and used panel Tobit regression to analyze the influencing factors of eco-efficiency. Finally, we applied the coupling relationship (CR) model to analyze the coupling relationship between the economic efficiency and the eco-efficiency of forest parks in China (Figure 3).
3.2. Models
3.2.1. SBM Model
The data envelopment analysis (DEA) method has some advantages in the evaluation of eco-efficiency [43,44,45]. The model does not have a unified index unit and a clear function relation and does not estimate the parameters. Furthermore, the undesired output indicator can also be included, and the option to add the input–output indicator is flexible. There are many extended models of DEA, and the more widely used ones for evaluating eco-efficiency include traditional CCR and BCC models [46,47], the SBM model with relaxed variables of objective function [48,49,50], the DDF model of directional distance function [51,52], and the network DEA model [53,54,55,56]. In previous studies, the SBM model was widely used to estimate regional and industrial eco-efficiency because it can include undesirable output. Camioto (2016) analyzed the energy efficiency of the G7 (Canada, France, Germany, Italy, Japan, the United Kingdom, and the United States) and the BRICS countries (Brazil, Russia, India, China, and South Africa) under the total factor structure with SBM [57]. Pan (2021) calculated the tourism carbon emissions efficiency based on the super-efficiency SBM defined as a compound system that consists of tourism carbon emissions, tourism economic development, and tourism regional innovation [58]. Therefore, this study used the slack-based measure (SBM) model [59,60,61], which has the advantage of including undesirable outputs. Specifically, we applied the SBM model to measure the economic efficiency of forest parks (S1, Model S1) and applied the undesirable-SBM model with undesirable outputs to measure the eco-efficiency of forest parks (S1, Model S2). The forest park eco-efficiency value in this study (abbreviated as EE) was divided into five levels: 0.00 < EE < 0.40 was a province of inefficiency, 0.41 < EE < 0.60 was a low efficiency province, 0.61 < EE < 0.80 was a province in need of improvement, 0.81 < EE < 0.99 was an efficient province, and EE =1 was a highly efficient province [62].
3.2.2. Getis-Ord (Gi*) Index and Spatial Center of Gravity Analysis
The Getis-ord (Gi*) index, proposed by Getis and Ord, can assess areas of subregions whose attribute values are significantly different from those of others [41], and can also analyze all kinds of data, making it possible to transform multivariate data into multivariate spatial data. For the above advantage, the Getis-ord (Gi*) index was widely applied to analyze the spatial distribution of regional development factors. Su (2021) applied the Getis-ord (Gi*) index to analyze the spatial differences in eco-efficiency of China’s forest parks [32]. Chen (2021) applied the Getis-ord (Gi*) index to analyze regional differences in the industrial water use efficiency of China [63]. In this article, Getis-Ord Gi* was used to measure the eco-efficiency of forest parks spatial agglomeration and identify high-value clusters and low-value clusters at different spatial locations. The mathematical derivations of the Gi* index can be found in S1, Model S3. The Getis-Ord Gi* index was divided into seven categories according to the significance level of spatial positive and negative correlation, which were the cold spot area with a negative correlation significance of 0.01, the subcold spot area with a negative correlation significance of 0.05, the transition area with a negative correlation significance of 0.1, the transition area with an insignificant correlation, and the hot spot area with a positive correlation significance of 0.01. The hot spots and cold spots of forest park eco-efficiency in each province in China can represent high or low concentration regions of the forest park eco-efficiency.
The spatial center of gravity takes a specific feature of the region as the weight and re-determines the center of a feature of the region, which can reflect the evolution trajectory of a feature value in time and estimate the force of a feature between regions [32]. Wang (2021) used the spatial center of gravity to analyze the evolution trajectory of the eco-efficiency of tourism in China [41]. Therefore, we used the spatial center of gravity analysis (S1, Model S4) to find the trajectory and spatial evolutionary law of the forest park eco-efficiency in China [43].
3.2.3. Panel Tobit Regression Model
The panel Tobit regression model proposed by Tobin mainly addresses the construction problem of limited or truncated dependent variables [64]. The Tobit model has been widely used to investigate the influence factors of eco-efficiency. As eco-efficiency evaluated by the undesirable-SBM always has a value from 0 to 1, it is not suitable to use the ordinary least squares (OLS) for coefficient estimation [65]. Moreover, the Tobit regression model with fixed effects makes it difficult to perform conditional maximum likelihood estimation like the logit or counting model with fixed effects due to the inadequate statistics of individual heterogeneity. Moreover, in previous studies, the panel Tobit regression model was widely used to discover the driving factors of regional and industrial eco-efficiency. Ren (2020) used panel Tobit regression to identify the driving factors of eco-efficiency in Chinese prefecture-level cities [66]. Therefore, we selected the panel random effect Tobit regression model (S1, Model S5) to identify the driving factors of the regional eco-efficiency of forest parks.
3.3. Indicators and Data
3.3.1. Economic Efficiency and Eco-Efficiency Indicators
The input–output indicators of economic efficiency were chosen based on the forest parks as a general economic system. Therefore, the input indicators of the efficiency of forest parks are labor and capital, and the output indicator is income (Table 1).
The input–output indicators of eco-efficiency were chosen based on the input–output indicators of economic efficiency. Moreover, the input indicators of the eco-efficiency of forest parks reflect the cost of resources and impact on the ecological environment in the process of production and management, and the output indicators should not only reflect the economic value of forest parks in the process of production or service but also reflect the ecological value of forest parks. Therefore, the input indicators of the eco-efficiency of forest parks include labor, capital, ecology, land, water, and energy; desirable output indicators include income and park area; undesirable output indicators include wastewater discharge and SO2 emissions (Table 1). We selected specific measurement indicators as follows:
Input indicators include six categories: labor, capital, ecology, land, water, and energy. Labor input is represented by employees and guides. Capital input is represented by capital investment. Ecology input is represented by ecological construction investment. Land input is represented by afforestation areas. Water input is represented by water consumption (WC). Energy input is represented by energy consumption (EC).
The output indicators include two categories: desirable output and undesirable output. The desirable output indicators are represented by the output value of the traditional economic system and include two categories: income and park area. The newly increased forest area is the total amount of afforestation and forest phase transformation. Undesirable output indicators include two categories: wastewater discharge and SO2 emissions. Wastewater discharge is represented by wastewater consumption. SO2 emissions are represented by SO2 consumption. The mathematical derivations of water consumption (WC), energy consumption (EC), wastewater emissions (WW), and SO2 emissions (SE) can be found in S1 Model S6.
3.3.2. Indicators of Driving Factors
Environmental regulation: Environmental regulation refers to the specific safeguard measures and policy systems of the government in the operation of forest parks. As a part of the PAs, forest parks have an important function: ecological environmental protection. Considering the system and operation mode of China’s forest parks, public finance, especially ecological investment, has been an important policy tool for the ecological and environmental protection of forest parks in the past 20 years. Therefore, among the driving factors of forest park eco-efficiency, environmental regulation mainly uses ecological inputs to calculate the proportion of total investment.
Demand structure: The demand structure of the consumer market is an important factor affecting forest parks as an economic system, but the impact of this factor on forest parks is not clear. It is temporarily assumed to have a positive impact. This paper mainly uses the proportion of entertainment income to total income to represent the demand structure.
Service quality: Service quality is an important factor of forest parks as an ecological economic system, and a certain number of excellent tour guides in the service can promote the tourism experience and ecological environmental education of forest parks. Therefore, this paper used the proportion of the number of tour guides in the staff as the index to measure service quality.
Resource quality: Resource quality is the basis and foundation of the economic system, ecosystem, and environmental system of forest parks. It is generally believed that resource quality determines the overall development level of forest parks. This paper mainly used the proportion of national forest parks in forest parks to represent the resource quality of forest parks in each province.
Economic benefit: Tourism’s economic benefit is an important output of forest parks as an economic system. It is generally believed that the higher the output is, the higher the economic efficiency of the forest park should be, but the relationship to efficiency varies among different scholars. Some studies suggest that the relationship between the eco-efficiency of tourism and economic growth is a compound environmental Kuznets curve [41]. Therefore, this paper considered the economic benefit of tourism as an important driving factor to explore the relationship between the economic benefit of provinces and regions and the eco-efficiency of forest parks in China.
Tourism scale: The relationship between the tourism scale and forest park ecological environment is similar to the relationship between tourism economic benefits and eco-efficiency. Therefore, this paper also considered it as an important driving factor. This paper mainly expresses the tourism scale of forest parks by the number of tourists.
Three regression models were constructed to explain the driving factors of the eco-efficiency of different types of forest parks. The definitions of the variables are provided in Table 2.
Considering the lagged effect of environmental regulation on forest eco-efficiency, we constructed regression models for the current period (Model 1), one lagged period (Model 2) and two lagged periods (Model 3).
Model 1:
Model 2:
Model 3:
3.4. Data Sources
The employees and guides, capital investment, ecological construction investment, afforestation, income, and park area data were obtained from survey data from 2005 to 2020. Data for per capita water consumption, total energy and added value of other industries, the added value of wholesale and retail accommodation catering industries, total energy of wholesale and retail accommodation catering industries, per capital wastewater discharge, per capital garbage discharge, and per capital SO2 emissions were all extracted from the China Statistical Yearbook [67] and China Environmental Statistics Yearbook [68] from 2005 to 2020.
4. Results
4.1. General Trend of Eco-Efficiency of Forest Parks
The average eco-efficiency and economic efficiency of national forest parks in China from 2004 to 2016 were 0.6365 and 0.3636, respectively. The average level of eco-efficiency and economic efficiency of forest parks in China showed a declining trend, and their evolution and development were similar. This showed that the economic efficiency of forest parks was an important part of eco-efficiency (Figure 4). The lower economic efficiency meant a lower economic output level of the forest parks, indicating a lower marketization of the forest park. It was also shown that under the guidance of national policies, China’s forest parks, as an important part of the National Nature Protected Areas System, had better realized the functions of conservation and sustainable development goals [35]. However, the average value of forest park eco-efficiency was still below 0.8, indicating that there was a large amount of input–output redundancy in China’s forest park ecological economic system, and there was still much room for eco-efficiency to improve.
According to the evolution and development trajectory of forest parks, this paper focused on the most recent 15 years from 2004 to 2019, while the development of forest park eco-efficiency can be divided into three key periods: (1) First is the low-development period (2004–2010), during which both the eco-efficiency and economic efficiency level of forest parks fluctuate downwards. Considering that the construction of forest parks was in the initial development stage before 2010, as shown in Figure 1, the number of forest parks showed a slower growth trend. This was due to the fact that after 1998, forest parks became an important choice for the transformation of forest park functions, the marketization level of forest parks was low, and the low economic efficiency level affected the low eco-efficiency level of forest parks. (2) Second is the rapid development period (2011–2013), during which the eco-efficiency level of forest parks showed a trend of rapid rise. It is considered that in 2011, the “Guidance on Accelerating the Development of Forest Tourism”, and other related policies issued by China, initiated the compilation and formulation of the National Forest Tourism Development Plan and the standards of forest tourism demonstration areas, and explicitly supported forest tourism as one of the top ten forestry industries. The tourism development of forest parks has a significant positive effect on eco-efficiency. (3) During the high-quality development period (2014–2019), China started a pilot national park system in 2013 to explore the overlapping and fragmented problem of PAs. However, the eco-efficiency and economic efficiency of forest parks began to decline, which indicates that China’s national parks system needs to be further improved, and policy dividends need to be further released. Under the guidance and supervision of policies, market-oriented reforms should be continuously intensified, and land use methods of forest parks should be optimized to steadily improve the eco-efficiency of forest parks.
4.2. Temporal and Spatial Patterns of Forest Park Eco-Efficiency
4.2.1. Spatial Distribution Characteristics
In this study, the eco-efficiency level of each forest park was divided into five levels from low to high. The results are shown in Figure 4.
On average, from 2004 to 2019, the five provinces with forest park eco-efficiency reaching 1 were Tianjin, Jilin, Heilongjiang, Xinjiang, and Qinghai (Figure 5, left), while the provinces with a relatively high efficiency between 0.8 and 1, which are shown in dark green in Figure 5, left, were Gansu, Sichuan, Hainan, Zhejiang, Inner Mongolia, and Shanxi, and followed by Guangxi with 0.6–0.8, which are43ee shown in light green. Other provinces were low in eco-efficiency. Generally, the eco-efficiency of forest parks showed high-efficiency zones in the northeast and northwest, medium-efficiency zones in the west and low-efficiency zones in the center (Figure 5, right). The areas with high-efficiency forest parks were generally distributed in areas with a good ecological environmental background or high economic development.
In this paper, the spatial distribution characteristics of the eco-efficiency of forest parks in 30 provinces and autonomous regions of the Chinese mainland were analyzed over six years, namely, 2004, 2007, 2010, 2013, 2016, and 2019. It was found that the number of high-efficiency areas in the central and southeastern regions gradually increased during the period 2004–2012, while the number of high-efficiency areas decreased during the period 2014–2019. Over time, there were an increasing number of high-efficiency and relatively high-efficiency areas in Northeast China and Northwest China. In 2013, the eco-efficiency of the whole country was the highest, declining after 2013. From the evolutionary track of different provinces, the evolutionary track of eco-efficiency of forest parks presented four types: the first type was the efficiency improvement type, such as Jiangxi Province; second, the efficiency decline type, such as Jiangsu Province; third, the inverted “N” type of dynamic changes in decline and rise, such as Yunnan Province; fourth, the inverted “V” type with eco-efficiency rising and then falling, such as Shaanxi Province (Figure 6).
4.2.2. Spatial Hotspot Analysis
The Getis-Ord Gi* geospatial statistical method was introduced to analyze the spatial pattern of tourism eco-efficiency. The results are shown in Figure 7. Among them, red is the hot spot area, and blue is the cold spot area.
From the average level from 2004 to 2019, the hot spots were Xinjiang and Qinghai, Xinjiang was the subhot spot whose significance passed the 0.05 test, and Qinghai was the subhot spot whose significance passed the 0.1 test. The cold spot areas that passed the significance 0.01 test were Zhejiang, Jiangsu, Anhui, Jiangxi, Henan, and Hubei, and the subcold spot areas that passed the significance 0.05 test were Fujian, Chongqing, and Shanxi. The subcold spots that passed the significance 0.1 test were Hebei, Shaanxi, and Guizhou Provinces, and the rest were not significant (Figure 7, above). In terms of temporal evolution, the hot spots shifted from Liaoning in Northeast China to Xinjiang in Northwest China. The cold spot area moved from the southwest to the central and southeast coastal areas (Figure 7, bottom). This number of cold spots further showed that the eco-efficiency of forest parks is declining. This declining trend shows that the low eco-efficiency of forest parks has spread across the country.
4.2.3. Spatial Center of Gravity Analysis
Through the barycentric coordinate formula, the barycentric coordinates of the eco-efficiency of forest parks in 30 provinces of the Chinese mainland from 2004 to 2019 were calculated, and the spatial barycentric transfer track of the eco-efficiency of forest parks could be obtained. This can reflect the spatial distribution of the input and output rationalization degree of the forest park eco-economic system and realize the analysis of the spatial evolution process of forest park eco-efficiency in the Chinese mainland area, which has a certain guiding significance for the rational allocation of forest park eco-economic system elements. The research results are shown in Figure 8.
Overall, the center of gravity for the forest parks on the Chinese mainland changed from southeast of the geometric center of gravity of the Chinese mainland in 2004 to Henan, Shanxi, and Shaanxi Provinces in 2019 (Figure 8). The whole track showed a shift from the Central Plains to Northwest China. From the track of the gravity center shift, the eco-efficiency of forest parks in North China has improved in the past 12 years, which has had a strong traction effect on the gravity center.
4.3. Coupled Analysis of the Eco-Efficiency and Economic Efficiency of Forest Parks
According to the level of economic efficiency and eco-efficiency, forest parks can be divided into four categories, and the average of the two efficiencies is taken as a quadrant to define four types of forest parks (Figure 9): type I, which has a higher efficiency than the average; type II, which has a higher eco-efficiency but lower economic efficiency; type III, which has higher economic efficiency but lower eco-efficiency; and type Ⅳ, which has a lower efficiency than the average. Type I (20%) comprises excellent areas, mainly including Tianjin, Zhejiang, Jilin, Sichuan, Hainan, and Guangxi Provinces; type II comprises development-oriented (20%) areas, mainly including Shanxi, Qinghai, Heilongjiang, Xinjiang, Gansu and Inner Mongolia; type III comprises ecologically protected areas (17%), namely, Shanghai, Jiangxi, Jiangsu, Chongqing, and Hunan Provinces; and type Ⅳ areas need to be adjusted (43%) and include 13 provinces, namely, Beijing, Liaoning, Guizhou, Guangdong, Yunnan, Hebei, Fujian, Anhui, Shaanxi, Ningxia, Henan, and Shandong.(Figure 8).
The overall level of forest parks that considered ecological protection and economic development was relatively low, and most of the forest parks in 13 provinces (43%) needed to be adjusted. After comparing the results of the coupling of eco-efficiency and economic efficiency between regions, the eastern provinces and regions with a higher economic development and denser population were clearly ahead of the western regions. This result was consistent with previous research results [29].
4.4. Driving Factors of the Eco-Efficiency of Forest Parks
According to the regression model of driving factors, we obtained the regression results of forest park ecological efficiency, as follows (Table 3).
Forest tourism service quality had a positive effect on the eco-efficiency of forest parks. The impact of environmental regulations on the eco-efficiency of forest parks typically lagged. Therefore, the lag term of environmental regulation was introduced, and Models 2 and 3 were established. The environmental regulation variables of the two lag periods had a positive correlation with the eco-efficiency of the forest parks, with a significance level of less than 5% and an impact coefficient of 0.772. Food and lodging activities had significant positive impact on the eco-efficiency of forest parks. Through the analysis of Models 1, 2, and 3, the proportion of food and lodging income in total income had a significant positive impact on the eco-efficiency of forest parks, with a significance level below 1% and an impact coefficient of up to 0.773. It is worth noting that the quality of tourism services had a positive effect on the improvement of the eco-efficiency of forest parks, among which the contribution of environmental interpretative services was obvious. Through the regression analysis of the three models, it was found that service quality had a positive effect on the eco-efficiency of forest parks, showing a significance level of less than 5% and an impact coefficient of up to 1.449.
Entertainment activity had a significant negative impact on the eco-efficiency of forest parks. Through the analysis conclusions of Models 1 and 2, the proportion of entertainment revenue in total revenue showed a negative correlation with the eco-efficiency of forest parks, with a significance level of 1% or less than 5% and an impact coefficient of up to −1.027. Entertainment activities had a large negative impact on the improvement of forest park eco-efficiency. The grade and quality of forest parks had no significant correlation with the eco-efficiency of forest parks. In Model 1, per capita tourism income had a 5% significant negative impact on the eco-efficiency of forest parks. The number of tourists had a certain positive impact on the eco-efficiency of forest parks. There was a 5% significant positive impact in Models 1 and 2, but the impact coefficient was low, and the impact level was not high.
5. Discussion and Future Applications
5.1. Discussion
The average level of eco-efficiency and economic efficiency of forest parks both showed a declining trend. The general trend of eco-efficiency was consistent with policy guidance. The main reason for this trend could be the marketization combined with the national policies on PAs. It is advisable to promote the market-oriented operation of China’s forest parks, and the development elements and resource allocations need to be further optimized.
The areas with high-eco-efficiency forest parks were generally distributed with a good ecological environment or high economic development [69]. From the average level from 2004 to 2019, the hot spots moved from Liaoning in Northeast China to Xinjiang in Northwest China, and the cold spot area moved from the southwest to the central and southeast coastal areas. The track of the gravity center of forest parks moved from the Central Plains to Northwest China, which showed that the north of China has a strong traction effect on the gravity center.
An interesting result is that the economic efficiency of forest parks was lower than their eco-efficiency. This is distinct from the result of previous research for economic efficiency in regional areas, which is slightly higher than eco-efficiency [70]. The economic development of forest tourism was closely related to the economic development of each province. Forest parks in the eastern region mostly belonged to the high-efficiency type. Forest parks in the western region mostly belonged to the type that required development. The western region’s forest parks had a low level of construction, poor service capacity, and inadequate marketing. The development level of forest tourism was not consistent with the rich forest landscape resources but with the strong forest tourism demand of urban residents. The unbalanced development led to some forest parks being overcrowded during holidays. Moreover, forest parks, as ecological economic systems dominated by ecological systems and supplemented by human activities, showed distinct development rules. Through the analysis, we found that in economically developed areas, such as Zhejiang and Tianjin, the eco-efficiency and economic efficiency of forest parks showed obvious advantages. These provinces in China achieved the forest park co-benefits of economic values, ecological values, and social values, thus improving sustainable management, which matched SDG Goal 15: Mobilize significant resources from all sources and at all levels to finance sustainable forest management and provide adequate incentives to developing countries to advance such management, including conservation and reforestation. Forest parks could optimize the relationship between protection and development through policy guidance. The forest park development model in Zhejiang and Tianjin is of exemplary significance and should serve as a reference for other provinces in the Chinese mainland and other similar regions around the world.
Through the analysis of driving factors, we found that the impact of per capita tourism income and the number of tourists on the eco-efficiency of forest parks was distinct from the results of previous studies on tourism [71]. According to the results, the increasing number of forest park tourists had no significant impact on eco-efficiency. This showed that the operation rule of the forest park eco-economic system was distinct from that of tourism and even different from that of tourist scenic spots. Moreover, due to the impact of accommodation and entertainment activities on the eco-efficiency of forest parks, the economic structure of forest parks played an important role in balancing economic growth and ecological environmental protection. In addition, forest parks need to integrate high-quality resources with ecotourism modes to strengthen natural education and to expand the scale of tourist arrivals, which could improve eco-efficiency [72]. Entertainment activities had a significant negative impact on the eco-efficiency of forest parks. Some entertainment facility establishments caused environmental pollution and landscape damage. It is suggested that the flow of provincial factors should be strengthened and the investment proportion of forest park tourism construction should be optimized to promote the output performance of forest park input resources. Under the imbalanced situation of economic development between provinces, increasing the input of labor and investment in forest parks in the central and western provinces of China, as well as providing support for policies to improve the green and low-carbon technology of forest parks, should be encouraged.
5.2. Applications
The development trend of China’s forest parks is effective, but the trends among provinces are quite different. It is suggested for forest park development to combine functional roles with the diversified requirements of the economy and society, including national development strategies and quality of life regarding forestry. It should focus on the construction of legal systems and standards, resource surveys, investment channels, talent training, international exchanges and other regulations.
On the one hand, the cross-regional cooperation of China’s forest parks should be strengthened while improving the overall level of eco-efficiency. Differentiated development strategies should be adopted to reduce regional differences. The infrastructure and public service system should be improved to promote high-quality development.
On the other hand, China’s forest park tourism development has been significantly improved, but it cannot effectively meet the rapidly growing tourism market demand and faces severe challenges of tourism demand. The development of forest tourism should further highlight sustainable development and improve the public service system and the ecological compensation mechanism [35].
In this study, the analysis on the driving factors of eco-efficiency of forest parks in China focused on internal economic influence factors of the forest parks. However, the external influence factors, especially the ecological and natural geographical environment, as well as climate change factors, have not yet been considered in revealing the driving forces. The above factors may also be important drivers of forest parks’ eco-efficiency. Therefore, in future research, we will apply geographic information systems (GIS), remote sensing, and in-depth data to collect and process the ecological and natural geographical environmental data that are relevant to the eco-efficiency of forest parks, as well as to reveal the driving factors of the spatial differentiation of forest parks’ eco-efficiency in multiple dimensions.
6. Conclusions
This study established the ecological economic system of forest parks based on the slack-based measure (SBM); constructed the ecological economic indicators system of forest parks with multiple inputs and outputs to measure and analyze the forest park eco-efficiency in 30 provinces of the Chinese mainland from 1990 to 2019; and found that the eco-efficiency and economic efficiency of forest parks both showed a declining trend. The development of forest park eco-efficiency was divided into three key periods, namely, the low-development period (2004–2010), the rapid-development period (2011–2013), and the high-quality development period (2014–2019). Through spatial hotspot analysis and central analysis, the spatial evolution pattern of eco-efficiency of forest parks in China was discussed, and it was found that high-eco-efficiency zones were distributed in the northeast and northwest, medium-eco-efficiency zones were distributed in the west, and low- eco-efficiency zones were distributed in the middle areas of China. Through the panel Tobit regression model, the driving factors of the eco-efficiency of forest parks were analyzed, and it was found that the tourism service quality, such as food and lodging services, played an important role in improving the forest parks’ eco-efficiency.
Supplementary Materials
The following supporting information can be downloaded at: https://www.mdpi.com/article/10.3390/f13091406/s1, Model S1: SBM model; Model S2: Undesirable-SBM model; Model S3: Getis-ord Gi* index; Model S4: Spatial Center of Gravity; Model S5: Panel Tobit Regression Model; Model S6: The calculation of Input-output indicator.
Author Contributions
Conceptualization, M.Z. and B.X.; data curation, M.Z. and W.C.; formal analysis, B.X.; funding acquisition, M.Z., S.D. and B.X.; investigation, M.Z.; methodology, B.X.; resources, Z.L. and Y.L.; software, B.X.; supervision, S.D. and Y.L.; writing—original draft, M.Z. and B.X.; writing—review and editing, M.Z. and B.X. All authors have read and agreed to the published version of the manuscript.
Funding
This work was supported by the National Natural Science Foundation of China (grant number 32161143029), the China Postdoctoral Science Foundation (grant number 2021M703179), and the National Natural Science Foundation of China (grant number 42011530079, 41801220).
Institutional Review Board Statement
Not applicable.
Informed Consent Statement
Not applicable.
Acknowledgments
The authors would like to thank the editor and reviewers for their insightful comments and suggestions.
Conflicts of Interest
The authors declare no conflict of interest.
References
- Brooks, T.M.; Mittermeier, R.A.; da Fonseca, G.A.; Gerlach, J.; Hoffmann, M.; Lamoreux, J.F.; Mittermeier, C.G.; Pilgrim, J.D.; Rodrigues, A.S. Global biodiversity conservation priorities. Science 2006, 313, 58–61. [Google Scholar] [CrossRef] [PubMed]
- Butchart, S.H.; Walpole, M.; Collen, B.; van Strien, A.; Scharlemann, J.P.; Almond, R.E.; Baillie, J.E.; Bomhard, B.; Brown, C.; Bruno, J.; et al. Global biodiversity: Indicators of recent declines. Science 2010, 328, 1164–1168. [Google Scholar] [CrossRef] [PubMed]
- Watson, J.E.M.; Dudley, N.; Segan, D.B.; Hockings, M. The performance and potential of protected areas. Nature 2014, 515, 67–73. [Google Scholar] [CrossRef] [PubMed]
- Pecl, G.T.; Araújo, M.B.; Bell, J.D.; Blanchard, J.; Bonebrake, T.C.; Chen, I.C.; Clark, T.D.; Colwell, R.K.; Danielsen, F.; Evengård, B.; et al. Biodiversity redistribution under climate change: Impacts on ecosystems and human well-being. Science 2017, 355, eaai9214. [Google Scholar] [CrossRef]
- UNEP-WCMC and IUCN. Protected Planet Report 2020; Cambridge UK; UNEP-WCMC and IUCN: Gland, Switzerland, 2021. [Google Scholar]
- UNEP-WCMC and IUCN. The Protected Planet Report 2019; Cambridge UK; UNEP-WCMC and IUCN: Gland, Switzerland, 2020. [Google Scholar]
- COP15. Kunming Declaration Adopted at COP15. In Proceedings of the Conference of the Parties to the Convention on Biological Diversity Kunming, Kunming, China, 11–15 October 2021. [Google Scholar]
- Fuller, R.A.; McDonald-Madden, E.; Wilson, K.A.; Carwardine, J.; Grantham, H.S.; Watson, J.E.M.; Klein, C.J.; Green, D.C.; Possingham, H.P. Replacing underperforming protected areas achieves better conservation outcomes. Nature 2010, 466, 365–367. [Google Scholar] [CrossRef]
- Maxwell, S.L.; Cazalis, V.; Dudley, N.; Hoffmann, M.; Rodrigues, A.S.; Stolton, S.; Visconti, P.; Woodley, S.; Kingston, N.; Lewis, E. Area-based conservation in the twenty-first century. Nature 2020, 586, 217–227. [Google Scholar] [CrossRef]
- Tsao, T.M.; Hwang, J.S.; Lin, S.T.; Wu, C.; Tsai, M.J.; Su, T.C. Forest bathing is better than walking in urban park: Comparison of cardiac and vascular function between urban and forest parks. Int. J. Environ. Res. Public Health 2022, 19, 3451. [Google Scholar] [CrossRef]
- Wang, Y.; Yang, Y.N.; Li, J.; Zhao, M.Y.; Gong, H.; Wang, L.; Zhao, L.X.; Huang, M. Analysis on the change of ecosystem service value of national forest park and its coupling with social economy in the past 40 years. Pol. J. Environ. Stud. 2022, 31, 1377–1387. [Google Scholar] [CrossRef]
- Kang, N.N.; Wang, E.R.; Yu, Y.; Duan, Z.H. Valuing recreational services of the national forest parks using a tourist satisfaction method. Forests 2021, 12, 1688. [Google Scholar] [CrossRef]
- Zhang, J.R.; Zhao, Z.B. Tourists’ perceptual presentation of national forest park—A case study of Wujin mountain national forest park. J. For. Res. 2022, 27, 15–19. [Google Scholar]
- Liu, P.; Liu, M.N.; Xia, T.T.; Wang, Y.T.; Guo, P. The relationship between landscape metrics and facial expressions in 18 urban forest parks of Northern China. Forests 2021, 12, 1619. [Google Scholar] [CrossRef]
- Morin, N.; Masse, A.; Sannier, C.; Siklar, M.; Kiesslich, N.; Sayadyan, H.; Faucqueur, L.; Seewald, M. Development and application of earth observation based machine learning methods for characterizing forest and land cover change in Dilijan national park of Armenia between 1991 and 2019. Remote Sens. 2021, 13, 2942. [Google Scholar] [CrossRef]
- Yue, Y. 5G network-oriented machine learning and national forest park ecotourism management. Neural Comput. Appl. 2022, 34, 9353–9368. [Google Scholar] [CrossRef]
- Kolodziejczyk, K. Tourism management in national parks: Sumava and Bayerischer Wald (Bavarian Forest) in the Czech-German borderland. J. Mt. Sci. 2021, 18, 2213–2239. [Google Scholar] [CrossRef] [PubMed]
- Ashrafi, A.; Seow, H.V.; Lee, L.S.; Lee, C.G. The efficiency of the hotel industry in Singapore. Tour. Manag. 2013, 37, 31–34. [Google Scholar] [CrossRef]
- Chiang, W.E.; Tsai, M.H.; Wang, L.S.M. A DEA evaluation of Taipei hotels. Ann. Tour. Res. 2004, 31, 712–715. [Google Scholar] [CrossRef]
- Corne, A. Benchmarking and tourism efficiency in France. Tour. Manag. 2015, 51, 91–95. [Google Scholar] [CrossRef]
- Holden, A. Environment and Tourism; Routledge: New York, NY, USA, 2016. [Google Scholar]
- Stabler, M.J.; Papatheodorou, A.; Sinclair, M.T. The Economics of Tourism; Routledge: New York, NY, USA, 2009. [Google Scholar]
- Castellani, V.; Sala, S. Ecological footprint and life cycle assessment in the sustainability assessment of tourism activities. Ecol. Indic. 2012, 16, 135–147. [Google Scholar] [CrossRef]
- Kelly, J.; Haider, W.; Williams, P.W.; Englund, K. Stated preferences of tourists for eco-efficient destination planning options. Tour. Manag. 2007, 28, 377–390. [Google Scholar] [CrossRef]
- Ehrenfeld, J.R. Eco-efficiency—philosophy, theory, and tools. J. Ind. Ecol. 2005, 9, 6–8. [Google Scholar] [CrossRef]
- Schmidheiny, S. Changing Course: A Global Business Perspective on Development and the Environment; MIT Press: Cambridge, MA, USA, 1992. [Google Scholar]
- Forrest, J.L.; Mascia, M.B.; Pailler, S.; Abidin, S.Z.; Araujo, M.D.; Krithivasan, R.; Riveros, J.C. Tropical deforestation and carbon emissions from protected area downgrading, downsizing, and degazettement (PADDD). Conserv. Lett. 2015, 8, 153–161. [Google Scholar] [CrossRef]
- Qiu, X.; Fang, Y.; Yang, X.; Zhu, F. Tourism eco-efficiency measurement, characteristics, and its influence factors in China. Sustainability 2017, 9, 1634. [Google Scholar] [CrossRef]
- Su, L.; Ji, X.R. Spatial-temporal differences and evolution of eco-efficiency in China’s forest park. Urban For. Urban Green. 2021, 57, 11. [Google Scholar] [CrossRef]
- Banks-Leite, C.; Pardini, R.; Tambosi, L.R.; Pearse, W.D.; Bueno, A.A.; Bruscagin, R.T.; Condez, T.H.; Dixo, M.; Igari, A.T.; Martensen, A.C. Using ecological thresholds to evaluate the costs and benefits of set-asides in a biodiversity hotspot. Science 2014, 345, 1041–1045. [Google Scholar] [CrossRef] [PubMed]
- Qian, W.; Suryani, A.W.; Xing, K. Does carbon performance matter to market returns during climate policy changes? Evidence from Australia. J. Clean. Prod. 2020, 259, 10. [Google Scholar] [CrossRef]
- Butler, R.W. Tourism: An evolutionary perspective. In Tourism and Sustainable Development: Monitoring, Planning, Managing; Nelson, J.G., Butler, R.W., Wall, G., Eds.; Department of Geography Publication Series: Ontario, ON, Canada, 1993; Volume 37, pp. 27–43. [Google Scholar]
- Gössling, S.; Peeters, P.; Ceron, J.P.; Dubois, G.; Patterson, T.; Richardson, R.B. The eco-efficiency of tourism. Ecol. Econ. 2005, 54, 417–434. [Google Scholar] [CrossRef]
- Li, S.D. Study on the deveoping track of china’s forest parks and forest tourism. Tour. Trib. 2007, 22, 66–72. [Google Scholar]
- Zhao, M.Y.; Chen, X.F. The development and management of forest parks in China. Sci. Silvae Sincae 2016, 52, 118–127. [Google Scholar]
- State Forestry Administration of China (Ed.) Measures of The People’s Republic of China for National Forest Park Management; State Forestry Administration of China: Beijing, China, 2011.
- General Offices of the Communist Party of China Central Committee and The State Council (Ed.) Guidance on Establishing a Protected Area System Composed Mainly of National Parks; General Offices of the Communist Party of China Central Committee and The State Council: Beijing, China, 2019.
- China National Forestry and Grassland Administration (Ed.) China Forestry and Grassland Statistical Yearbook; China Forestry Publishing House: Beijing, China, 2019. [Google Scholar]
- Cooper, W.W.; Tone, K.; Seiford, L.M. Data Envelopment Analysis: A Comprehensive Text with Models, Applications References, and DEA-Solver Software with Cdrom; Kluwer Academic Publishers: Alphen aan den Rijn, The Netherlands, 1999; pp. 145–156. [Google Scholar]
- Tone, K.; Seiford, L.M.; Cooper, W.W. Data Envelopment Analysis a Comprehensive Text with Models, Applications, References and DEA-Solver Software, 2nd ed.; Springer Science + Business Media, LLC: New York, NY, USA, 2007. [Google Scholar]
- Wang, R.; Xia, B.; Dong, S.C.; Li, Y.; Li, Z.H.; Ba, D.X.; Zhang, W.B. Research on the Spatial Differentiation and Driving Forces of Eco-Efficiency of Regional Tourism in China. Sustainability 2021, 13, 280. [Google Scholar] [CrossRef]
- Xia, B.; Dong, S.C.; Ba, D.X.; Li, Y.; Li, F.J.; Liu, H.M.; Li, Z.H.; Zhao, M.Y. Research on the Spatial Differentiation and Driving Factors of Tourism Enterprises’ Efficiency: Chinese Scenic Spots, Travel Agencies, and Hotels. Sustainability 2018, 10, 901. [Google Scholar] [CrossRef]
- Färe, R.; Crosskopf, S.; Knox Lovell, C.A. Production Frontiers; Cambridge University Press: Cambridge, UK, 1994. [Google Scholar]
- Zhou, H.; Yang, Y.; Chen, Y.; Zhu, J. Data envelopment analysis application in sustainability: The origins, development and future directions. Eur. J. Oper. Res. 2018, 264, 1–16. [Google Scholar] [CrossRef]
- Li, Y.L.; Zuo, Z.L.; Xu, D.Y.; Wei, Y. Mining Eco-Efficiency Measurement and Driving Factors Identification Based on Meta-US-SBM in Guangxi Province, China. Int. J. Environ. Res. Public Health 2021, 18, 5397. [Google Scholar] [CrossRef] [PubMed]
- Richa, K.; Babbitt, C.W.; Gaustad, G. Eco-Efficiency Analysis of a Lithium-Ion Battery Waste Hierarchy Inspired by Circular Economy. J. Ind. Ecol. 2017, 21, 715–730. [Google Scholar] [CrossRef]
- Rossi, S.; Colicchia, C.; Cozzolino, A.; Christopher, M. The logistics service providers in eco-efficiency innovation: An empirical study. Supply Chain. Manag. Int. J. 2013, 18, 583–603. [Google Scholar] [CrossRef]
- Pishgar-Komleh, S.H.; Zylowski, T.; Rozakis, S.; Kozyra, J. Efficiency under different methods for incorporating undesirable outputs in an LCA plus DEA framework: A case study of winter wheat production in Poland. J. Environ. Manag. 2020, 260, 10. [Google Scholar] [CrossRef]
- Zhou, Y.; Kong, Y.; Zhang, T. The spatial and temporal evolution of provincial eco-efficiency in China based on SBM modified three-stage data envelopment analysis. Environ. Sci. Pollut. Res. 2020, 27, 8557–8569. [Google Scholar] [CrossRef]
- Zhou, Y.; Kong, Y.; Wang, H.K.; Luo, F. The impact of population urbanization lag on eco-efficiency: A panel quantile approach. J. Clean. Prod. 2020, 244, 11. [Google Scholar] [CrossRef]
- Molinos-Senante, M.; Gemar, G.; Gomez, T.; Caballero, R.; Sala-Garrido, R. Eco-efficiency assessment of wastewater treatment plants using a weighted Russell directional distance model. J. Clean. Prod. 2016, 137, 1066–1075. [Google Scholar] [CrossRef]
- Ramli, N.A.; Munisamy, S.; Arabi, B. Scale directional distance function and its application to the measurement of eco-efficiency in the manufacturing sector. Ann. Oper. Res. 2013, 211, 381–398. [Google Scholar] [CrossRef]
- Ouyang, W.D.; Yang, J.B. The network energy and environment efficiency analysis of 27 OECD countries: A multiplicative network DEA model. Energy 2020, 197, 16. [Google Scholar] [CrossRef]
- Shao, L.G.; Yu, X.; Feng, C. Evaluating the eco-efficiency of China’s industrial sectors: A two-stage network data envelopment analysis. J. Environ. Manag. 2019, 247, 551–560. [Google Scholar] [CrossRef] [PubMed]
- Li, Z.J.; Wei, Y.G.; Li, Y.; Wang, Z.C.; Zhang, J.M. China’s Provincial Eco-Efficiency and Its Driving Factors-Based on Network DEA and PLS-SEM Method. Int. J. Environ. Res. Public Health 2020, 17, 8702. [Google Scholar] [CrossRef]
- Sarkhosh-Sara, A.; Tavassoli, M.; Heshmati, A. Assessing the sustainability of high-, middle-, and low-income countries: A network DEA model in the presence of both zero data and undesirable outputs. Sustain. Prod. Consump. 2020, 21, 252–268. [Google Scholar] [CrossRef]
- Camioto, F.D.; Moralles, H.F.; Mariano, E.B.; do Rebelatto, D.A. Energy efficiency analysis of G7 and BRICS considering total-factor structure. J. Clean. Prod. 2016, 122, 67–77. [Google Scholar] [CrossRef]
- Pan, Y.; Weng, G.; Li, C.; Li, J. Coupling Coordination and Influencing Factors among Tourism Carbon Emission, Tourism Economic and Tourism Innovation. Int. J. Environ. Res. Public Health 2021, 18, 1601. [Google Scholar] [CrossRef] [PubMed]
- Peng, B.H.; Wang, Y.Y.; Wei, G. Energy eco-efficiency: Is there any spatial correlation between different regions? Energy Policy 2020, 140, 12. [Google Scholar] [CrossRef]
- Quintano, C.; Mazzocchi, P.; Rocca, A. Examining eco-efficiency in the port sector via non-radial data envelopment analysis and the response based procedure for detecting unit segments. J. Clean. Prod. 2020, 259, 19. [Google Scholar] [CrossRef]
- Yue, L.; Xue, D.; Draz, M.U.; Ahmad, F.; Li, J.; Shahzad, F.; Ali, S. The Double-Edged Sword of Urbanization and Its Nexus with Eco-Efficiency in China. Int. J. Environ. Res. Public Health 2020, 17, 446. [Google Scholar] [CrossRef] [PubMed]
- Xia, B.; Dong, S.; Li, Y.; Li, Z.; Sun, D.; Zhang, W.; Li, W. Evolution characters and influencing factors of regional eco-efficiency in a developing country: Evidence from Mongolia. Int. J. Environ. Res. Public Health 2021, 18, 10719. [Google Scholar] [CrossRef]
- Chen, Y.; Yin, G.; Liu, K. Regional differences in the industrial water use efficiency of China: The spatial spillover effect and relevant factors. Resour. Conserv. Recycl. 2021, 167, 105239. [Google Scholar] [CrossRef]
- Diaz-Villavicencio, G.; Didonet, S.R.; Dodd, A. Influencing factors of eco-efficient urban waste management: Evidence from Spanish municipalities. J. Clean. Prod. 2017, 164, 1486–1496. [Google Scholar] [CrossRef]
- Cheng, Y.Y.; Shao, T.Y.; Lai, H.L.; Shen, M.H.; Li, Y. Total-Factor Eco-Efficiency and Its Influencing Factors in the Yangtze River Delta Urban Agglomeration, China. Int. J. Environ. Res. Public Health 2019, 16, 3814. [Google Scholar] [CrossRef] [PubMed]
- Ren, Y.F.; Fang, C.L.; Li, G.D. Spatiotemporal characteristics and influential factors of eco-efficiency in Chinese prefecture-level cities: A spatial panel econometric analysis. J. Clean. Prod. 2020, 260, 11. [Google Scholar] [CrossRef]
- National Bureau of Statistics of China (Ed.) China Statistical Yearbook; China Statistical Publishing House: Beijing, China, 2005–2020. [Google Scholar]
- National Bureau of Statistics of China (Ed.) China Environmental Statistics Yearbook; China Statistical Publishing House: Beijing, China, 2005–2020. [Google Scholar]
- Liao, J.; Yu, C.; Feng, Z.; Zhao, H.; Wu, K.; Ma, X. Spatial differentiation characteristics and driving factors of agricultural eco-efficiency in Chinese provinces from the perspective of ecosystem services. J. Clean. Prod. 2021, 288, 125466. [Google Scholar] [CrossRef]
- Yu, S.W.; Liu, J.; Li, L.X. Evaluating provincial eco-efficiency in China: An improved network data envelopment analysis model with undesirable output. Environ. Sci. Pollut. Res. 2020, 27, 6886–6903. [Google Scholar] [CrossRef]
- Peng, H.S.; Zhang, J.H.; Lu, L.; Tang, G.R.; Yan, B.J.; Xiao, X.; Han, Y. Eco-efficiency and its determinants at a tourism destination: A case study of Huangshan national park, China. Tour. Manag. 2017, 60, 201–211. [Google Scholar] [CrossRef]
- Buckley, R.; Brough, P.; Hague, L.; Chauvenet, A.; Fleming, C.; Roche, E.; Sofija, E.; Harris, N. Economic value of protected areas via visitor mental health. Nat. Commun. 2019, 10, 5005. [Google Scholar] [CrossRef] [Green Version]
Figure 1.
Development stages of China’s forest parks.

Figure 2.
Spatial kernel density of national forest parks in China.

Figure 3.
Research framework.

Figure 4.
Temporal trend chart of the eco-efficiency and economic efficiency of forest parks from 2004–2019.
Figure 4.
Temporal trend chart of the eco-efficiency and economic efficiency of forest parks from 2004–2019.

Figure 5.
Radar map and of the forest parks eco-efficiency of provinces and its spatial distribution.
Figure 5.
Radar map and of the forest parks eco-efficiency of provinces and its spatial distribution.

Figure 6.
Eco-efficiency trajectory of each province and its spatial distribution in different periods.
Figure 6.
Eco-efficiency trajectory of each province and its spatial distribution in different periods.

Figure 7.
Spatial hot spot distribution of the eco-efficiency of forest parks.

Figure 8.
Trajectory of the eco-efficiency center of gravity of forest parks.

Figure 9.
Coupled analysis of the eco-efficiency and economic efficiency of forest parks.


Table 1.
Input-output indicators of economic efficiency and eco-efficiency of forest park.
| Efficiency | First Level | Second-Level | Third-Level | Unit |
|---|---|---|---|---|
| economic efficiency | Input | Labour | Employees and Guides | Person |
| Capital | Capital investment | 104 yuan | ||
| Output | Income | Income | 104 yuan | |
| eco-efficiency | Input | Labour | Employees and Guides | Person |
| Capital | Capital investment | 104 yuan | ||
| Ecology | Ecological construction investment | 104 yuan | ||
| Land | Afforestation | Hectare | ||
| Water | Water consumption | Ton | ||
| Energy | Energy consumption | Tons of standard coal | ||
| Output | Desirable | Income | 104 yuan | |
| Park area | Hectare | |||
| Undesirable | Wastewater emissions | Ton | ||
| SO2 emissions | Ton |
Table 2.
The definition of variables in the panel Tobit regression model.
| Variable | Abbreviations | Definition | Unit |
|---|---|---|---|
| Eco-efficiency | EE | Calculated by SBM model with undesirable outputs | - |
| Environmental regulation | ER | The proportion of the cost of the environmental and ecological protection | % |
| Entertainment consumption | EC | Entertainment revenue as a percentage of total revenue | % |
| Vacation consumption | VC | Food and lodging income as a proportion of total revenue | % |
| Service quality | SQ | The proportion of tour guides in the total number of employees | % |
| Resource quality | RQ | The proportion of national forest parks in forest parks | % |
| Tourism income | TI | Average tourism income (Forest Park income/Tourist number) | CNY |
| Tourist number | TN | Tourist number | people |
Table 3.
Tobit regression results of the eco-efficiency of forest parks.
| Variable | Abbreviations of Variable | Model 1 | Model 2 | Model 3 | ||||||
|---|---|---|---|---|---|---|---|---|---|---|
| Eco-Efficiency | EE | Coef. | z | p > z | Coef. | z | p > z | Coef. | z | p > z |
| Environmental regulation | ER | 0.278 | 1.250 | 0.211 | ||||||
| ER2 | 0.289 | 1.310 | 0.190 | |||||||
| ER3 | 0.772 | 3.020 | 0.003 | |||||||
| Entertainment consumption | EC | −1.027 | −2.650 | 0.008 | −0.925 | −2.300 | 0.022 | −0.558 | −1.360 | 0.175 |
| Vacation consumption | VC | 0.592 | 3.000 | 0.003 | 0.617 | 2.970 | 0.003 | 0.773 | 3.590 | 0.000 |
| Service quality | SQ | 1.187 | 1.890 | 0.059 | 1.359 | 2.100 | 0.036 | 1.449 | 2.180 | 0.029 |
| Resource quality | RQ | −0.220 | −0.710 | 0.478 | −0.225 | −0.700 | 0.485 | −0.326 | −0.970 | 0.332 |
| Tourism income | lnTI | −0.062 | −1.980 | 0.047 | −0.041 | −1.220 | 0.223 | −0.029 | −0.790 | 0.427 |
| Tourist number | lnTNA | 0.083 | 1.850 | 0.064 | 0.095 | 1.980 | 0.047 | 0.081 | 1.590 | 0.112 |
| _cons | 0.898 | 2.650 | 0.008 | 0.669 | 1.840 | 0.066 | 0.536 | 1.410 | 0.160 | |
| log likehood | −245.652 | −229.098 | −207.996 | |||||||
Publisher’s Note: MDPI stays neutral with regard to jurisdictional claims in published maps and institutional affiliations. |
© 2022 by the authors. Licensee MDPI, Basel, Switzerland. This article is an open access article distributed under the terms and conditions of the Creative Commons Attribution (CC BY) license (https://creativecommons.org/licenses/by/4.0/).
Share and Cite
MDPI and ACS Style
Zhao, M.; Dong, S.; Xia, B.; Li, Y.; Li, Z.; Chen, W. Effective and Sustainable Managed Protected Areas: Evaluation and Driving Factors of Eco-Efficiency of China’s Forest Parks. Forests 2022, 13, 1406. https://doi.org/10.3390/f13091406
AMA Style
Zhao M, Dong S, Xia B, Li Y, Li Z, Chen W. Effective and Sustainable Managed Protected Areas: Evaluation and Driving Factors of Eco-Efficiency of China’s Forest Parks. Forests. 2022; 13(9):1406. https://doi.org/10.3390/f13091406
Chicago/Turabian StyleZhao, Minyan, Suocheng Dong, Bing Xia, Yu Li, Zehong Li, and Wuqiang Chen. 2022. "Effective and Sustainable Managed Protected Areas: Evaluation and Driving Factors of Eco-Efficiency of China’s Forest Parks" Forests 13, no. 9: 1406. https://doi.org/10.3390/f13091406
Note that from the first issue of 2016, this journal uses article numbers instead of page numbers. See further details here.