Article

The Imprint of Droughts on Mediterranean Pine Forests

by
Maria Royo-Navascues
1,2,*,
Edurne Martínez del Castillo
3,
Ernesto Tejedor
4,
Roberto Serrano-Notivoli
5,
Luis Alberto Longares
1,2,
Miguel Angel Saz
1,2,
Klemen Novak
6 and
Martin de Luis
1,2
1
Department of Geography and Regional Planning, University of Zaragoza, C/Pedro Cerbuna 12, 50009 Zaragoza, Spain
2
Environmental Sciences Institute (IUCA), University of Zaragoza, 50009 Zaragoza, Spain
3
Department of Geography, Johannes Gutenberg University, 55099 Mainz, Germany
4
Department of Atmospheric and Environmental Sciences, University at Albany (SUNY), Albany, NY 12222, USA
5
Department of Geography, Universidad Autónoma de Madrid, C/Francisco Tomás y Valiente 1, 28049 Madrid, Spain
6
Department of Wood Science and Technology, Biotechnical Faculty, University of Ljubjana, Rozna Dolina, Cesta VIII/34, 1000 Ljubljana, Slovenia
*
Author to whom correspondence should be addressed.
Forests 2022, 13(9), 1396; https://doi.org/10.3390/f13091396
Submission received: 30 June 2022 / Revised: 22 August 2022 / Accepted: 25 August 2022 / Published: 31 August 2022
(This article belongs to the Special Issue Tree Growth in Limiting Environments)

Abstract

:
Triggered by frequent high temperatures and scarce precipitation, droughts are a recurrent phenomenon in the Mediterranean Basin, causing significant impacts on forests. We analyzed the effects of drought intensity, duration, and seasonality on tree growth by investigating the relationship between the Standardized Precipitation-Evapotranspiration Index (SPEI) at different time scales and tree-ring width (TRW) in three pine species (Pinus halepensis Mill., P. sylvestris L, and P. uncinata Ramond ex A.DC) throughout a dense dendrochronological network in the Mediterranean Basin. We used generalized linear mixed models to predict such values over the entire distribution of the analyzed species. Furthermore, in areas where the species coexist, we analyzed the same parameters to highlight differences in their responses to similar climatic conditions. Our results showed that the maximum intensity of drought-affected conifers occurred more in the southern areas of the Spanish Mediterranean coast, especially P. halepensis, with maximum values of r = 0.67, while in the rest of the study area, the intensity decreased with elevation; we obtained maximum values of r = 0.40 and r = 0.33 for P. sylvestris and P. uncinata, respectively. This spatial distribution was also related to the duration of the drought impacts, showing that areas with lower intensity had shorter durations (2–4 months). We observed a latitudinal pattern in the seasonality of the drought impacts, with earlier growing seasons at high elevations (June–August) and later ones in the semi-arid Mediterranean. Similar intensity impacts were found in P. halepensis and P. sylvestris coexistence zones, although P. halepensis had a much longer duration and an earlier beginning of seasonality. Higher intensity, duration, and seasonality of drought effects were observed for P. sylvestris in areas where P. sylvestris and P. uncinata are distributed sympatrically. Understanding the plasticity and climatic response of these common southern European species to different types of droughts is crucial in the context of climate change where droughts are increasing in frequency and intensity.

1. Introduction

The Mediterranean Basin is a complex climatic area driven by a seasonal cycle linked to wet temperate circulation in the winter and subtropical circulation in the summer, which produces high precipitations in the winter and dry summers [1]. Extreme events, such as torrential rain or heat waves, are relatively frequent, including long periods without significant precipitation, which has a critical influence on forest dynamics [2]. In addition, the persistent high temperatures during the summer increase the atmospheric water demand, triggering the intensification of evapotranspiration, which in turn, leads to water stress scenarios (i.e., drought events).
The spatial extent and temporal persistence of droughts have increased in recent decades, especially in the Mediterranean region [3,4], and future scenarios show a general increase in the severity and duration of droughts over the 21st century [5]. The Mediterranean region is considered a hotspot of both climate change and biodiversity and is expected to face increased challenges due to climatic shifts [6]. This is also confirmed by data provided by regional climate models, the most advanced tools for estimating future climate changes at the local scale. However, recent research has shown that there is a need to explore the advantages of increasing the spatial resolution of regional climate models, especially in forest ecosystems and areas with complex terrains [7,8].
Climate conditions are becoming more extreme [9] and yet, certain forest species have been able to cope with increasing drought frequency and intensity, revealing their ability to adapt [10,11,12]. Nevertheless, other species are currently experiencing a growth decline, especially in the Mediterranean area [13], a trend that is projected to be amplified in the future [14]. Yet, there are few studies involving trend analysis of drought in Mediterranean forest ecosystems using long-term time series from mountainous meteorological stations. This is because of the difficulties involved in the installation and maintenance of meteorological instruments, especially at high elevations in mountainous regions. In a recent analysis conducted by Stefanidis and Alexandridis [15], temporal changes in drought conditions were reported on a seasonal basis.
Pinus halepensis Mill, P. sylvestris L., and P. uncinata Ramond ex A.DC are three of the most common forest trees in the Mediterranean, sometimes coexisting. The three species have different periods of cambial activity [16,17] and degrees of plasticity [11,18,19,20], which may cause diverse responses and sensitivity to drought. In addition, the existence of individuals of the same species in different locations is expected to provide a certain variability associated with the plastic response of the species to droughts throughout its range [12], as well as at different time and seasonal scales.
In this sense, tree-ring records have been effectively used as a proxy to study the effects of droughts in forest populations [21,22,23,24], traditionally centered on the mean response of the species at a particular site. In this paper, we use an approach based on studying the individual response of each of the sampled trees. As described in [25], this approach allows for a more detailed assessment of the effect of climate variability on species growth.
The use of climatic variables such as temperature and precipitation has been the most common approach to studying relationships between climate and tree-ring characteristics (width, density, or stable isotope composition) [26,27,28]. However, there are specific drought indices that have proven to be more effective at explaining the relationship between drought and tree-ring records, such as the Palmer Drought Severity Index (PDSI) [29,30,31], the Standard Precipitation Index (SPI) [2,32,33], or the Standardized Precipitation-Evapotranspiration Index (SPEI) [32].
In fact, by using these indices, several drought reconstructions have been developed enabling a better contextualization of current drought patterns relative to those in past centuries [33,34]. Compared to the other indices, SPEI improves drought detection [35] by considering the water balance through the calculation of evapotranspiration, being the most suitable index for climate-growth analyses. In addition, since it can be calculated using different time scales, it provides a multiscale approach to studying drought behavior, allowing the duration and seasonality in which drought is more closely related to the environmental process under study to be determined.
Our study represents a major advance in the study of the drought-growth relationships of these species in the Mediterranean. This is because first, we used a large and dense dendrochronological network; second, we used an approach based on the response of individual trees to drought rather than using regional chronologies; third, we estimated such responses across the entire distribution of the species using generalized linear mixed models (GLMM), and finally, we included a comparison between different species growing in the same climatic conditions.
In this regard, the objectives of this study were (i) analyzing the response of individual P. halepensis, P. sylvestris, and P. uncinata in the western Mediterranean to droughts, (ii) predicting the effect of droughts on the Mediterranean distribution of these species, and (iii) evaluating this effect in areas of coexistence (i.e., areas where two of the three studied species are present).

2. Materials and Methods

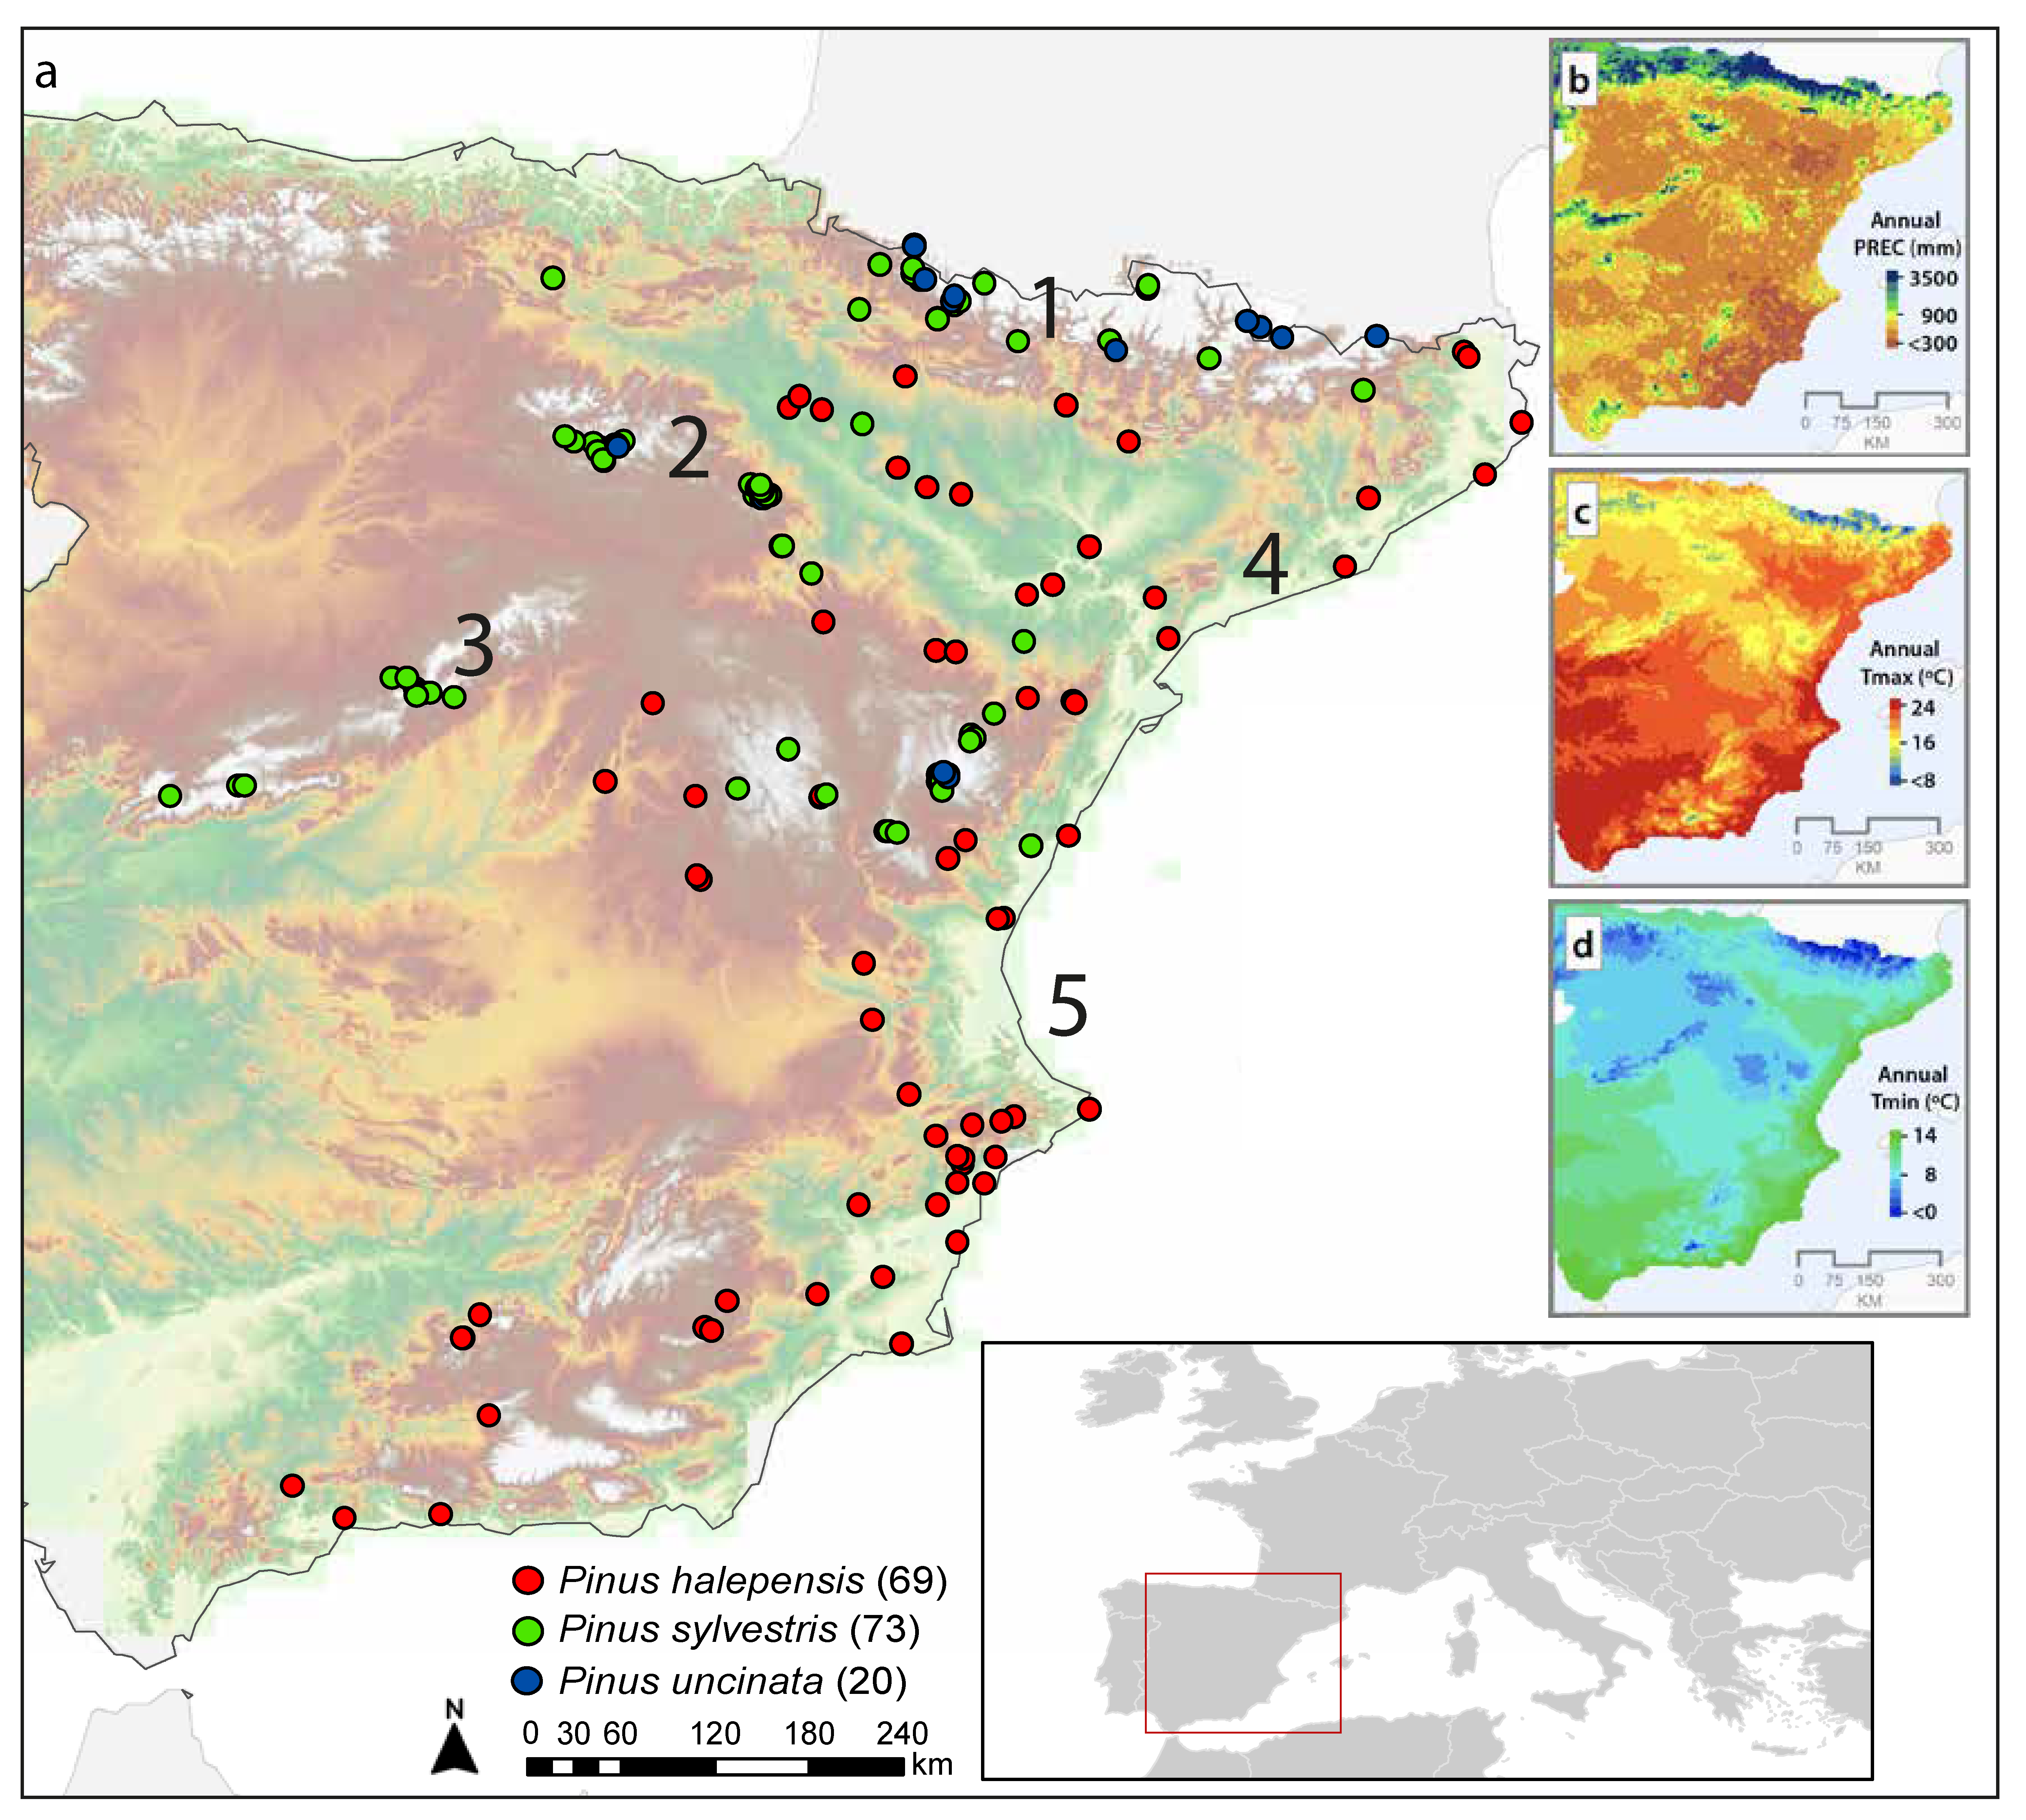
2.1. Dendrochronological Network

The study area includes the current spatial distribution of three species of conifers (P. halepensis, P. sylvestris, and P. uncinata) in the Iberian Peninsula (IP) (Figure 1a). This area has high climatic variability with warm, dry summers and cold, wet winters. Additionally, both the latitudinal and altitudinal (elevation ranges from 1 to 3404 m a.s.l.) climatic gradients produce contrasting temperature and precipitation regimes (Figure 1b–d) that have different effects on pine populations. The northern part of the study area is dominated by the Atlantic influence, with a high average annual precipitation (>1500 mm, Figure 1b) and a low mean maximum and minimum temperatures (<8 °C, Figure 1c,d). This regime is similar to the continental climate of the mountain areas in the interior of the IP, and in all of these areas, the trees begin their growing season later [36] because of the colder temperatures. The rest of the territory has a Mediterranean-like regime with warm, dry summers and relatively mild wet winters. The maximum precipitation, although varying by region, usually occurs in winter–spring, with a secondary peak in the autumn. Additionally, the mild temperatures in both seasons driven by the coastal influence often cause a double growth period [37,38] with the disruption of summertime, when low precipitation inhibits tree growth.
The research was carried out in four stages: (1) Calculation of climatic variables; (2) creation of trend-free tree-ring series; (3) calculation of SPEI for each location, and (4) description, modeling, and estimation of the intensity, duration, and seasonality of SPEI within the spatial distribution of the pine species in the Mediterranean IP.

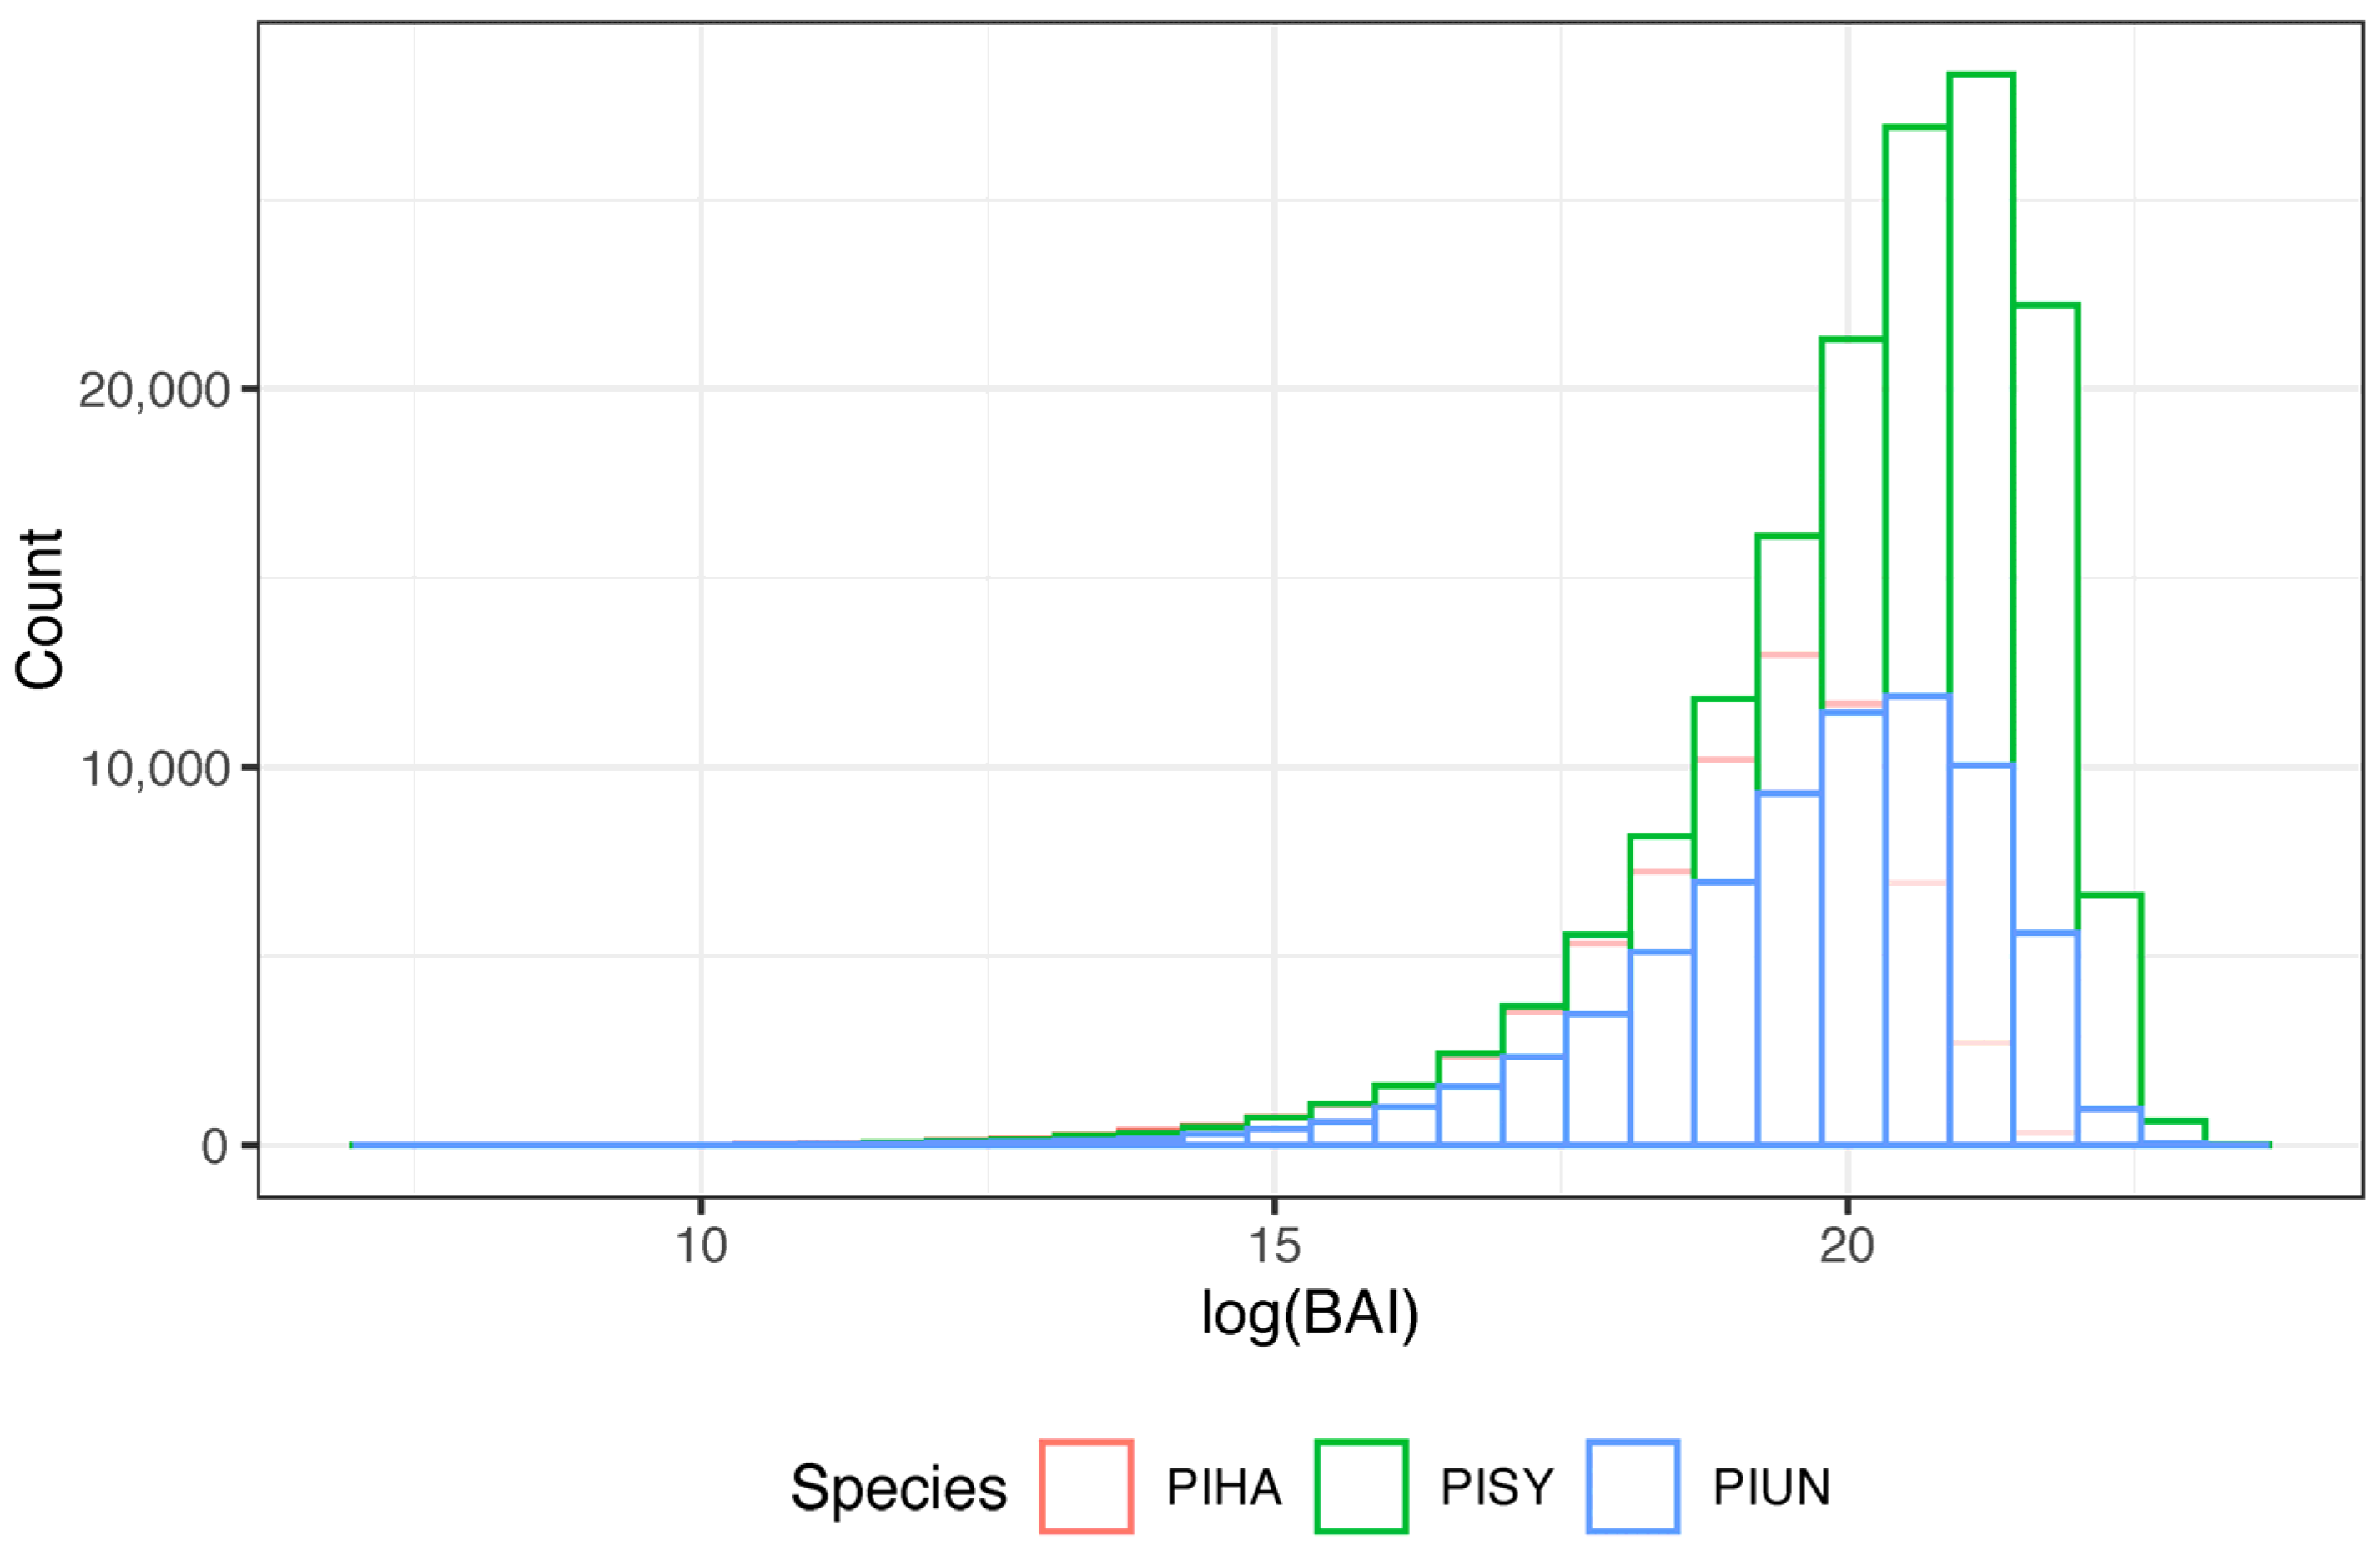
2.2. Creation of the Tree-Ring Basal Increment Chronologies

The dendrochronological dataset contained 162 sites, including 69 for P. halepensis, 73 for P. sylvestris, and 20 for P. uncinata, and a total of 119,520 rings (https://grupoclima.unizar.es/#data). The database was developed for previous research publications (i.e., Royo-Navascues et al. [12,39], and Tejedor et al. [33]). A total of 999 P. halepensis, 1100 P. sylvestris, and 459 P. uncinata individuals were sampled. The sampled trees ranged in age from 21 to 628 years, although for this study, only sites from the period 1950–2012 were selected to match the available climatic data.
Core samples were air-dried, glued onto wooden stands, and successively sanded to facilitate the identification of growth rings. To identify the exact position and dating of each ring, the samples were scanned and synchronized using CoRecorder software [40]. The tree-ring width was then measured to the nearest 0.01 mm using a LIBTAB table. COFECHA [41] was used to verify the cross-dating of all measurement series.
We converted the tree-ring width data into annual basal area increment (BAI) to account for the geometric constraint of adding a cross-sectional area of wood to a stem of increasing radius [14]. We used the diameter at breast height measured at the time of sampling to calculate the BAI using the bai.out function of the R package dplR. Calculating the mean BAI for defined periods allows for comparison over time, as biological trends do not affect it [42]. The BAI obtained for each of the species is shown in Figure 2. The maximum frequency for P. halepensis was between 18 and 20 mm, while for P. sylvestris and P. uncinata it was between 20 and 22 mm. The annual BAI was used as the dependent variable and calculated using the following equation for each of the sampled specimens:
B A I t , y = π ( r t , y 2 r t , y 1 2 )
where rt and r2t, y−1 correspond to the stem radii corresponding to tree (t) for years (y) and y−1, respectively. Finally, we calculated the average of the series of BAIs of the cores corresponding to each specimen.
To remove the low-frequency variability from the BAI tree-ring series and emphasize the high-frequency variability, we applied a double detrending. First, we applied a negative exponential model and then we fitted a cubic spline using a cut-off where the frequency response was 0.5 at a wavelength of 0.67 times the length of the series in years, using the ‘dplR’ package [43]. We then constructed the residual chronologies, which are produced after removing the first-order autoregression for each tree-ring series.
Ascribing to the concept of tree chronology [25,44,45], we shifted from a general analysis of the average climate response of a population to investigating the full range of individual responses among sampled trees, which allowed us to make the results comparable between sites and species. Moreover, it is well-known that climate-growth relationships may vary as trees became older/bigger [46]. As a consequence, since sampled trees in different populations may be of a different age/size structure, growth responses to drought may also differ. To avoid such a bias in our results, the correlation analysis between the tree chronologies and the drought indices calculated at different time windows, was completed using, in all cases, 30-year intervals.

2.3. Drought Definition and SPEI Calculation

A complete daily precipitation data series from 1950 to 2012 was computed for all 166 locations of the chronologies with the R package reddPrec [44]. The data series was constructed in three stages: (1) quality control of the raw original data; (2) reconstruction of the resulting quality-controlled data series by estimating new values at missing days, and (3) the creation of new data series at target locations based on the reconstructed observations. Then, we used the SPREAD and STEAD datasets [45,46] respectively, to calculate monthly precipitation and temperature over the pine distribution (Figure 1A).
Drought severity was quantified with the Standardized Precipitation-Evapotranspiration Index (SPEI) [47] in the SPEI R package [48] using the monthly temperatures and precipitation data as input. The SPEI value includes a lag, indicating the number of months considered to comprise drought conditions and the month of the year when the lag ends. We used Hargreaves’ method [49] with minimum and maximum temperature and precipitation to calculate potential evapotranspiration at a monthly scale because of the absence of additional climatic variables. This approach has been proven to provide more accurate results than other temperature-based methods [50].
The SPEI properly represents the multiscalar-dimension aspect of droughts. Its flexibility through the consideration of different lags provides a more accurate picture of how drought varies between the different components of the hydrologic system. This is especially interesting when the aim is the study of drought-growth relationships because of the plasticity of biological responses to long-term climatic phenomena, such as droughts.

2.4. Drought Effects on Tree Growth

Correlations between each individual BAI tree chronology and SPEI were calculated for each combination of month (1 to 12) and lag (24 scales). The analysis was completed using all possible 30-year intervals for which BAI tree chronology and SPEI series were available.

2.5. Spatialization of Drought-Growth Relationships

Next, we assessed the extent to which the variability in the observed responses between drought and growth followed a distribution pattern along the environmental gradients of the study area, as the objective was to translate this information to the entire extent of the three species distributions. When distribution patterns existed and were modeled, the influence of droughts on species was predicted continuously throughout the species’ range.
The relationship of the different time scales of the SPEI with the tree chronologies provided relevant information regarding the ecological nature of drought-growth relationships. Then, by evaluating several complementary aspects, such as the intensity and duration of drought which limited species growth; seasonality, the periods of the year in which drought started and growth conditions were present, we were able to better understand the likely response of Mediterranean forests to different types of droughts and provide potential adaptation measures for a projected warmer and drier future.
Generalized linear mixed models were used to evaluate the effect of droughts on tree growth in the distribution of species in each month and the lag calculated above. The corresponding values of mean annual precipitation and temperature were used as predictors (fixed factors) and the interaction between them was also considered in the model. We logarithmically transformed the dependent and independent variables before running the model because they had a skewed distribution. Subsequently, to ensure that the predictors used were on the same scale, the log-transformed variables were standardized to obtain a mean of zero and a standard deviation of one. In addition, as the BAI represents repeated measurements of the same individuals, tree identity was included as a random factor in the model. The analyses were performed in the R environment using lme4 [51].
P I N U S _ m o d e l m o n t h i _ l a g n < g l m e r ( C O R R b ~ B A I s t d ( P C P A N N U A L l s t d + T M E A N A N N U A L s t d + P C P A N N U A L s t d : T M E A N A N N U A L s t d ) + ( 1 | T R E E C O D E )
where P I N U S _ m o d e l m o n t h i _ l a g n represents the effect of drought on tree growth in month I and lag n, and B A I s t d represents the basal area of each individual. The independent variables included are annual rainfall ( P C P A N N U A L l s t d ), annual mean temperatures ( T M E A N A N N U A L s t d ), and their interaction ( P C P A N N U A L s t d : T M E A N A N N U A L s t d ), and finally, tree code represents the code of each tree used as a random factor ( 1 T R E E C O D E ) .
The model was applied at time scales from 1 to 24 months and from January to December for each series. In total, 288 correlation coefficients (24 scales * 12 months start) were obtained for each individual 30-year tree chronology.
Three different parameters were then extracted for each individual tree:
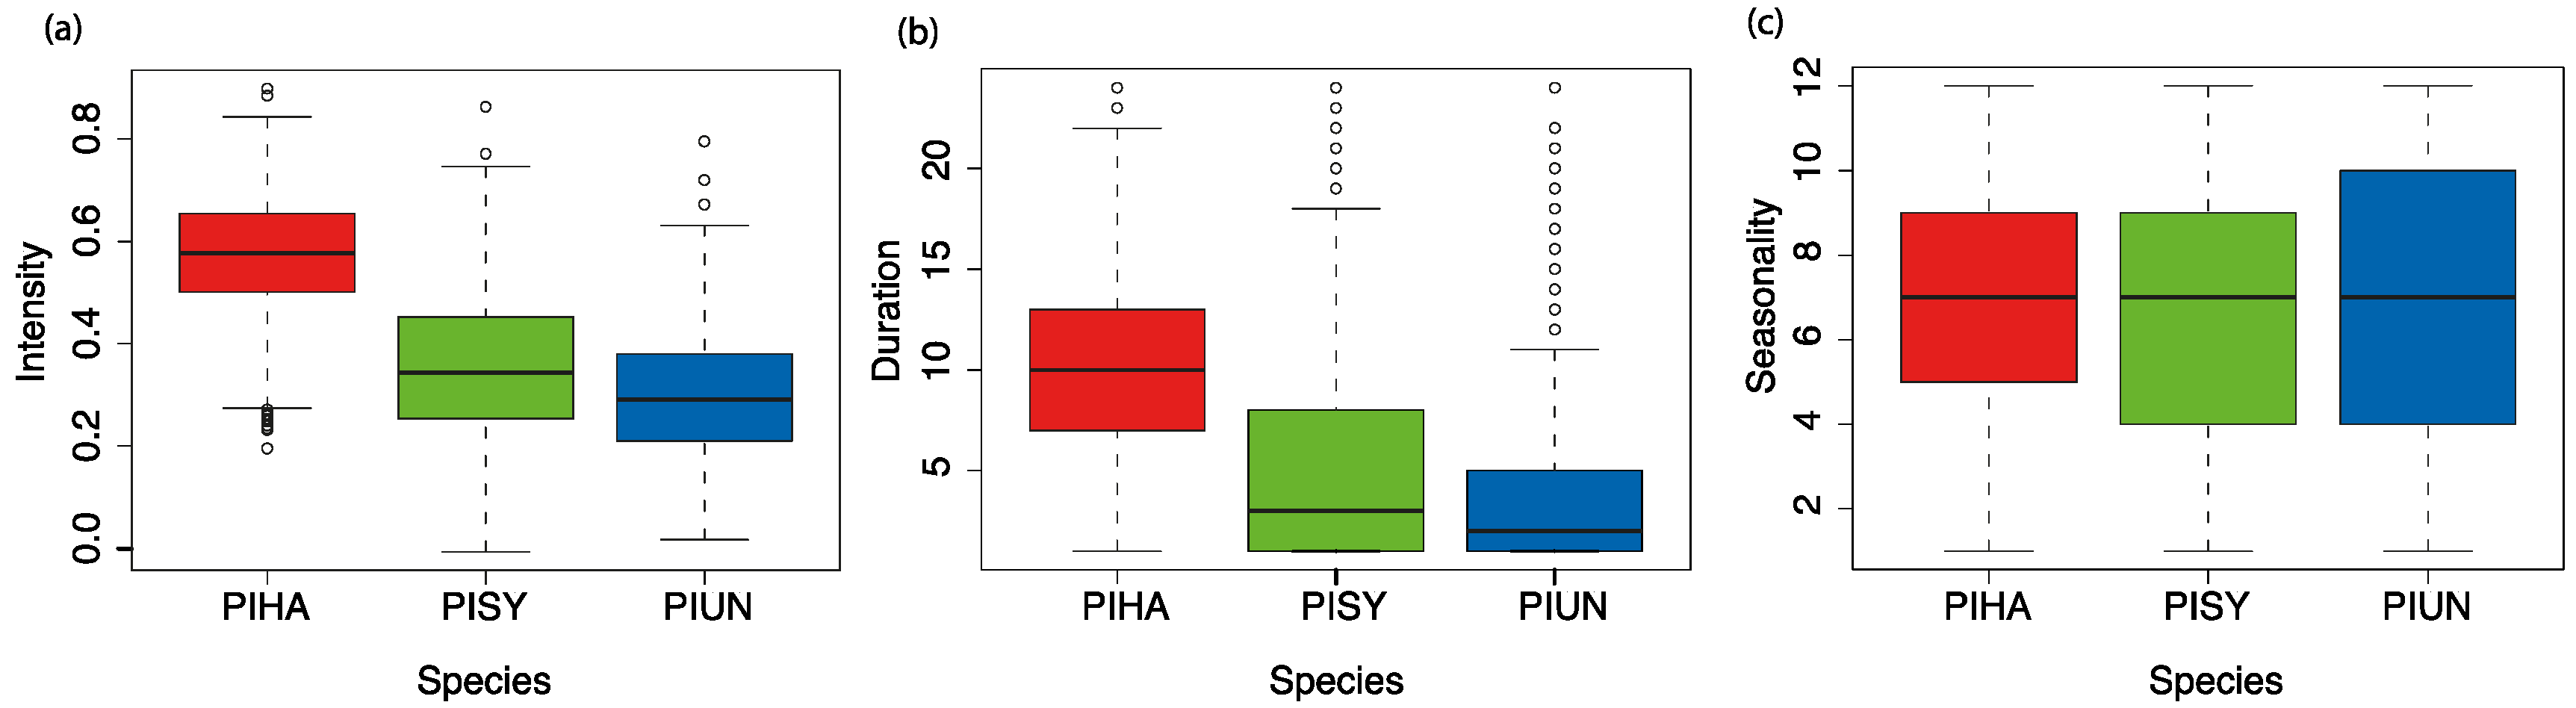
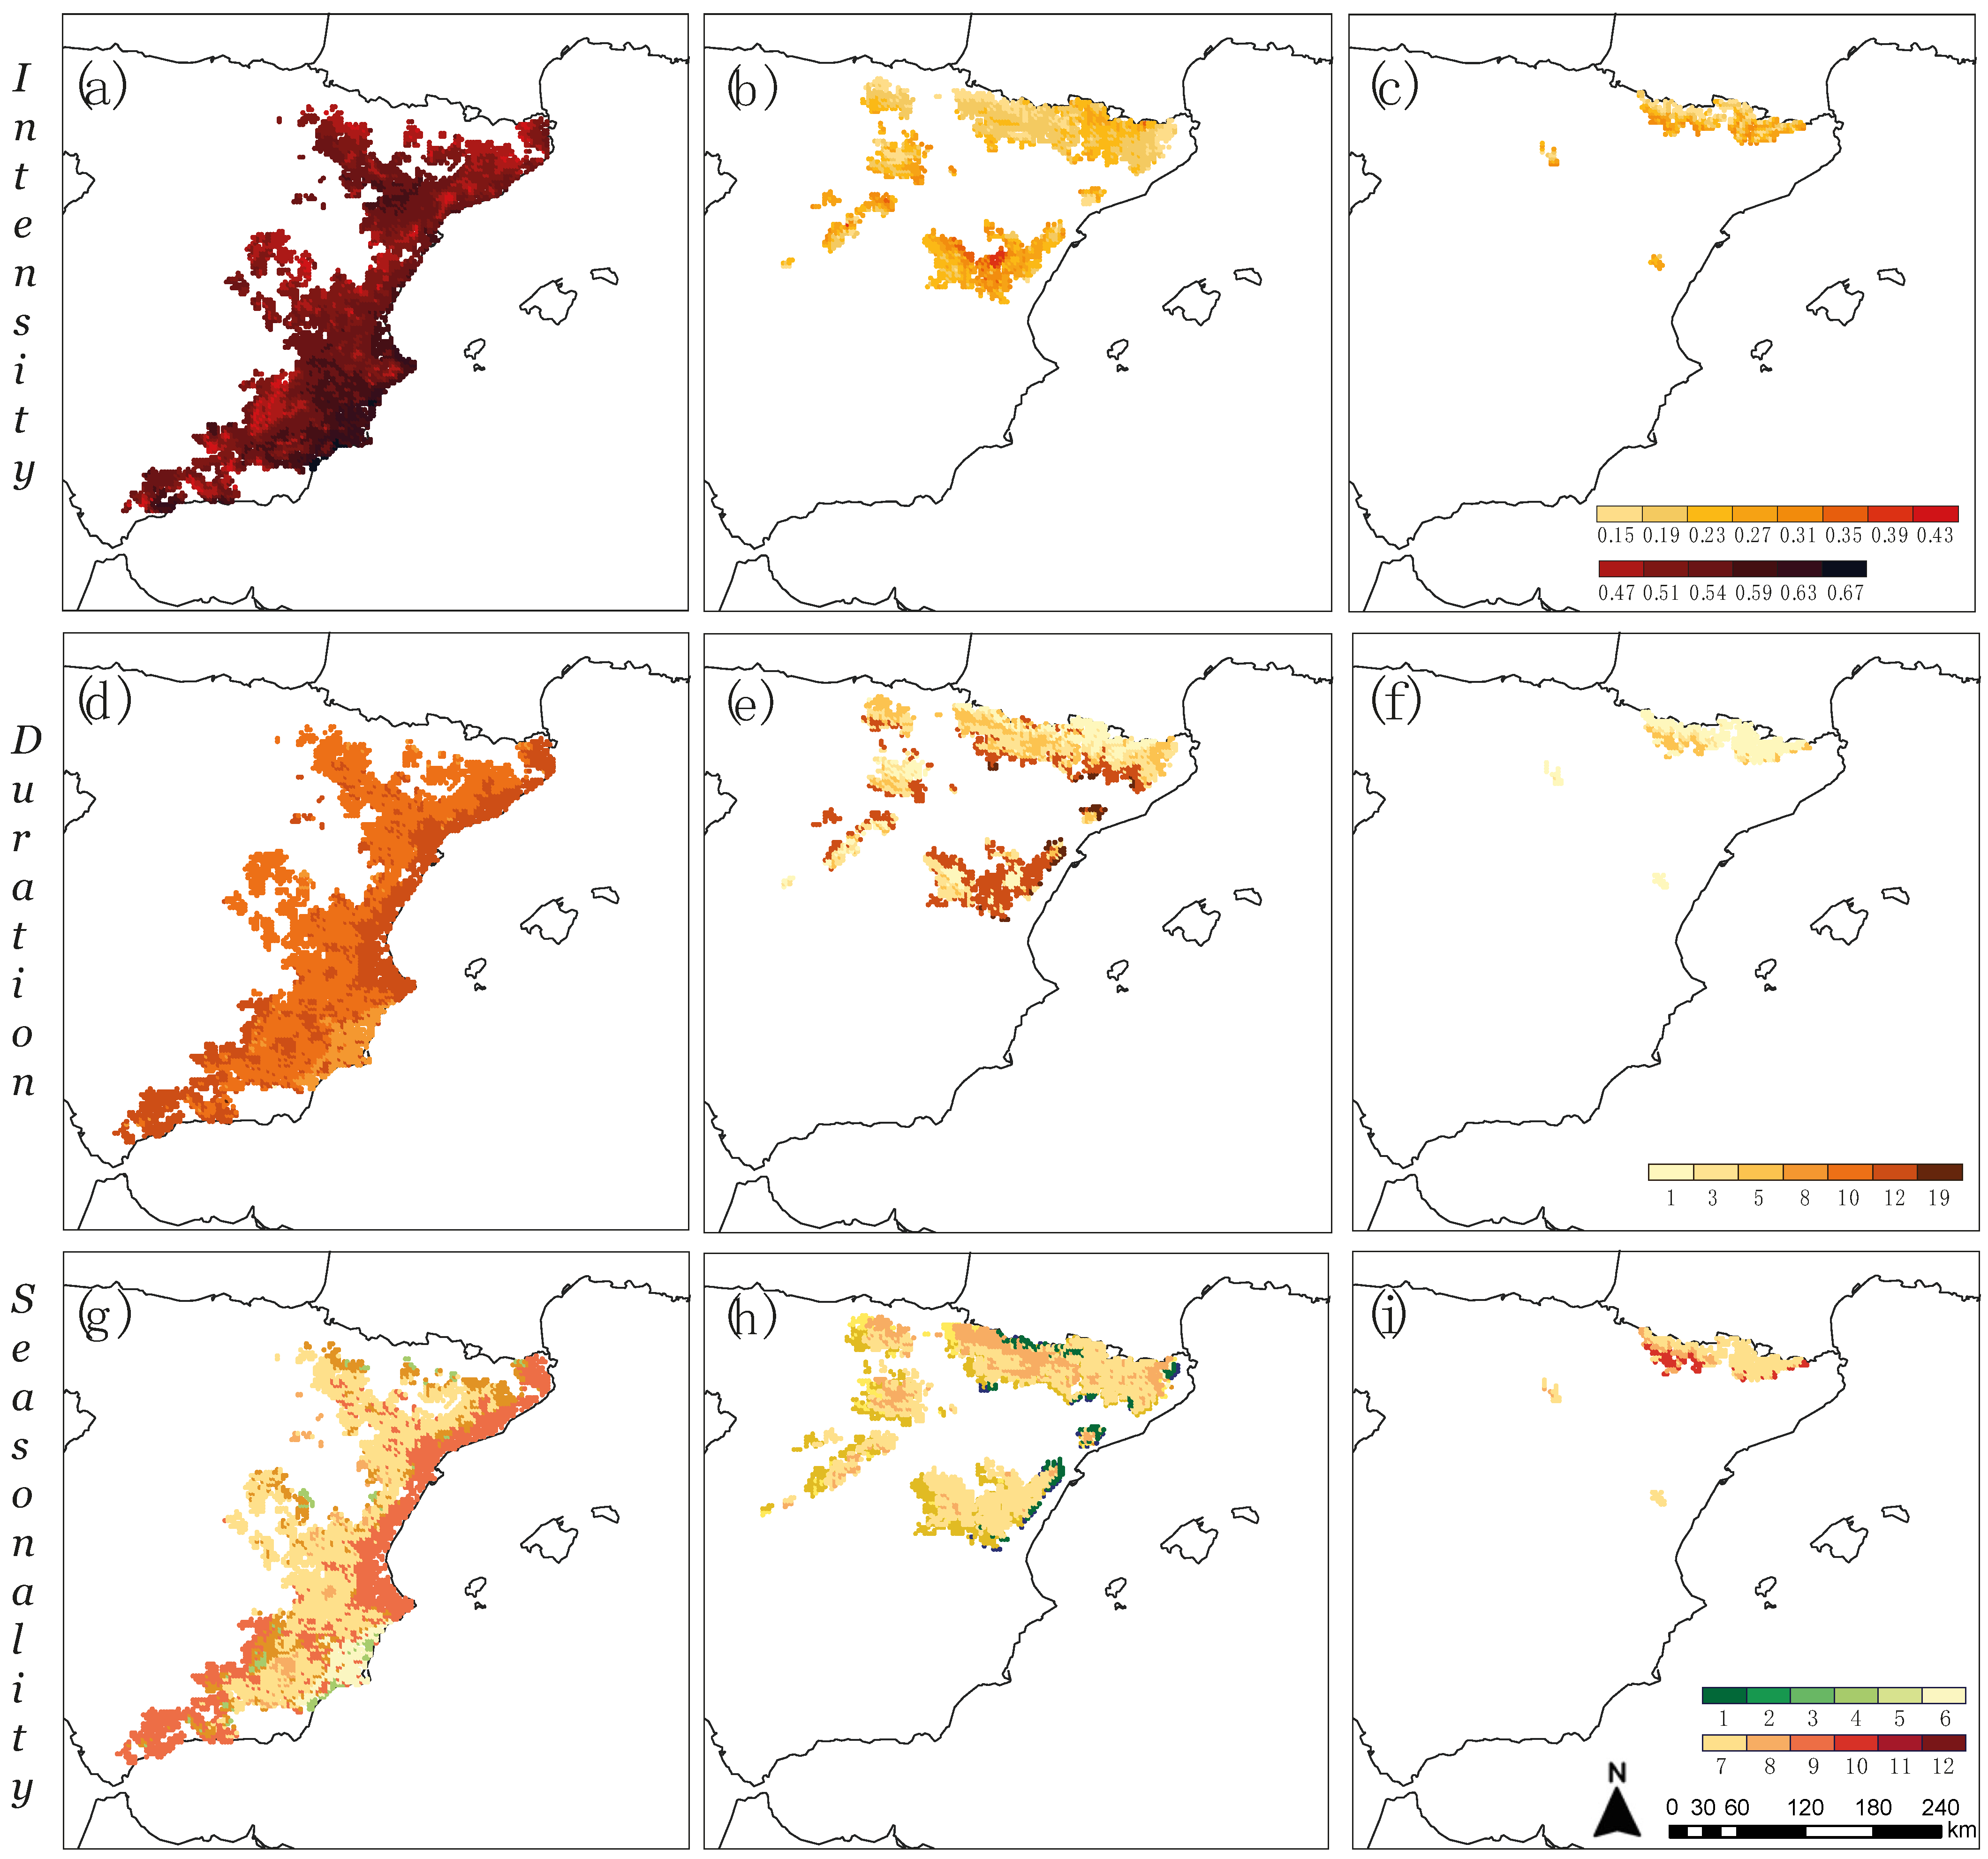
  • The intensity: magnitude of maximum correlation as an indicator of the impact of drought in explaining the year-to-year variability in tree growth.
  • The duration: the cumulative time scale at which such correlations were maximized (i.e., the lag at which drought had the most significant effects on tree growth).
  • The seasonality: initial month at which such correlations were maximized (the month at which the effects of drought started to affect tree growth).
The prediction of drought-growth relationships within species’ ranges was carried out in two steps: (1) a GLMM model was created based on the observations, with the BAI depending on the climatic variables (defining drought), and (2) the model was applied to all grid points covering the range of the three species using their individual climatic information.
Lastly, we then explored the variability and distribution patterns of this parameter set across the species’ range, and finally, we focused specifically on the analysis of the predicted parameters for areas in which P. sylvestris vs. P. halepensis and P. sylvestris vs. P. uncinate occur in sympatry.

3. Results

The relationship between growth and SPEI for each tree sampled was translated into intensity, duration, and seasonality by species (Figure 3). As shown in Figure 3a, P. halepensis responded with the highest correlations, compared to P. sylvestris and P. uncinata, obtaining a median of 0.57, a value well above those obtained for the other two species (0.34 for P. sylvestris and 0.30 for P. uncinata). P. halepensis suffered drought effects for between 8 and 12 months, while P. sylvestris and P. uncinata experienced them for between 1 and 9 months and 1 and 5 months, respectively (Figure 3b). The three species generally started to experience drought effects in July (Figure 3c).
The models obtained for each of the species produced correlation values that allowed us to establish which variable had the greatest influence on growth. For P. halepensis, significant correlations were obtained for precipitation and mean temperature as well as for their interaction, indicating a strong hydroclimatic influence on growth (Supplementary Material Tables S1–S3). In the case of P. sylvestris, the highest correlations were obtained for precipitation (Table S4), while mean temperatures had a higher influence on P. uncinata (Table S5). These results demonstrate that the response to drought is consistent with existing climatic gradients in the range, and therefore, allowed us to create predictions for the species within their distributions.

3.1. Intensity, Duration, and Seasonality of Drought Effects on Tree Growth across Species Distributions

The highest values for the intensity of drought impacts (up to 0.67) predicted for the Mediterranean distribution of P. halepensis (Figure 4a,d,g) occurred in the southeast of the Iberian Peninsula, with a gradual decrease towards higher latitudes and elevations. The maximum duration was found in the mountain ranges near the Mediterranean Sea, although the response of trees to droughts exceeding 10 months was generalized across their distribution. There was a gradient in seasonality towards earlier onset of drought response in the interior of the Iberian Peninsula (before August), although it started between November and July of the previous year at all sites.
The predicted intensity for P. sylvestris had a wide range throughout its distribution (Figure 4b,e,h), showing the highest values (approaching 0.40) in the southeast of the Iberian System, while in the high Pyrenean elevations, we found values close to zero. According to the expected duration, we found the longest duration in the areas close to the Mediterranean (up to 21 months), while we found periods ranging between 1 and 8 months in the higher areas such as the Pyrenees and the Iberian System. Seasonality was limited to the months of July and August of the current year.
Low-intensity values (below r = 0.3) were observed throughout P. uncinata´s distribution. Duration over most of its distribution ranged from 0 to 3 months, with the exception of lower elevations extending up to 5 months, and with a define onset between July and August over much of its distribution (Figure 4c,f,i). The supplementary material shows the behavior of the three components (intensity, duration, and seasonality) as a function of the essential climatic elements (Supplementary Material Figures S6–S8).

3.2. Intensity, Duration, and Seasonality of Drought Effects on Tree Growth in Coexistence Zones

The intensity of drought effects on P. halepensis was higher throughout the areas where it occurs in sympatry with P. sylvestris (Figure 5). Duration for the two species was similar, especially in the Pyrenees and in some points west of the Iberian System, although it was generally greater for P. halepensis. Seasonality was also very similar between the two species, except for some points in the Catalan Coastal Range.
P. uncinata suffered a greater intensity of drought effects in the southern part of the Pyrenees while P. sylvestris showed a greater intensity in the northern part of their sympatric distribution (Figure 6). The duration of drought effects they suffered in the sympatric areas was similar, although at low elevations, P. uncinata had a longer duration exceeding 6 months. Conversely, in the eastern Pyrenees, P. sylvestris had higher durations than P. uncinata (more than 6 months). The peak of the drought occurred later in P. uncinata, east of the Pyrenees. In the western Pyrenees, we found seasonality of up to 6 months.

4. Discussion

We described how the three pines species responded to droughts at different intensities, scales, and seasonality. It is possible to explain such responses with the environmental gradients of the study area by extending the individual tree information to the whole distribution area of the three species. Spatial generalization of this type of impact has great potential for forest and land management.
The arid and semi-arid Mediterranean areas where P. halepensis prevails are characterized by high average temperatures and relatively low rainfall (250–300 mm annually). In these areas, droughts were more intense, had stronger effects on its growth, and lasted longer (from nine to twelve months). In general, secondary growth patterns and cambial phenology in P. halepensis are mainly related to variations in precipitation [12], although several studies have shown that temperature variations can also influence growth [11,52,53,54].
The sensitivity and seasonality of climatic influences on P. halepensis vary across climatic gradients, as the earlywood and latewood proportion within tree-rings varies depending on the climatic conditions in which it grows [12]. This highlights the plasticity in its growth as it adapts to different environments throughout its distribution. On the other hand, different scientific studies have shown that the cambial activity of P. halepensis begins in February and ends approximately in November of the current year of ring formation [11,18,52,55]. Furthermore, in coastal areas of the Mediterranean, its cambial activity may be continuous, without a real latency period in the cold season [56,57]. Therefore, droughts affecting this species in the arid and semi-arid Mediterranean are important on an annual scale, including rainfall across all four seasons.
The areas where P. halepensis and P. sylvestris occur in sympatry in the central part of the Iberian Peninsula are at higher altitudes than the semi-arid areas. The intensity of drought impacts was lower in sympatric areas, having less influence on their growth. We found that both species responded equally, reducing their activity in winter [53]. Both species also showed similar sensitivity to drought effects with a more seasonal effect (three months) limited to spring and summer.
Above 1000 m a.s.l., the presence of P. halepensis decreases and P. sylvestris becomes the dominant species. The typical semi-arid Mediterranean climatic characteristics change, becoming more humid and temperate and providing favorable conditions for P. sylvestris growth. Previous works studied wood formation dynamics along climatic gradients in P. sylvestris [58], although research has proved it to be a plastic species in the Mediterranean [27]. The xylogenesis shown by the species at sites in the Iberian System confirms that climatic conditions influence the beginning and end of the growth period of P. sylvestris. For example, mild temperatures in early autumn can lead to an extension of its growth period [36]. In addition, other works showed significant inter-annual correlations in earlywood and latewood with climatic factors implying the effect of climatic conditions on tracheid formation [59,60]. Therefore, P. sylvestris demonstrates plasticity in its xylogenesis strategies depending on local climatic conditions and in agreement with our findings, undergoes short, seasonal droughts limited to the summer months.
The sympatric areas of the distribution of P. sylvestris and P. uncinata showed a clear pattern of lower temperatures and higher rainfall, in contrast to the semi-arid Mediterranean coastal areas. Our results showed drought had lesser effects on tree growth there; they have a monthly-scale effect and are restricted to summer. These results are in line with previous studies showing a temperature rather than a precipitation signal in the high-altitude forests of the Pyrenees [61,62] and the northern Iberian System [33].
A similar pattern was found in areas dominated by P. uncinata, which are much more humid and cooler than the rest of the study area. Inhabiting colder environments, P. uncinata is a species adapted to frost, tolerating it better than other species, such as P. halepensis. Based on the results obtained here, droughts had less influence on the growth of P. uncinata because of its occurrence on an almost monthly scale within summer. The growth of this species in the Pyrenees and the Iberian System is mainly influenced by thermal factors [63]. The high temperatures recorded in the summer limit the duration of cambial activity in this species.
Our results also reveal the potential for developing hydroclimatic reconstructions at different scales based on the duration, intensity, and seasonality of tree-growth responses to drought across species and environments. Several reconstructions of such areas have advanced our understanding of past hydroclimatic variability (i.e., [33,64,65,66]), although these were of a regional scale and focused on a fixed hydroclimatic variable only (i.e., SPI at twelve months). However, considering the plasticity of the different species, and within species as a function of altitude, there is a potential to develop more complex hydroclimatic reconstructions using dynamic drought indices (e.g., SPEI at three, six, and twelve months), including the spatialization or gridding of the reconstruction.

5. Conclusions

We found clear and significant patterns in the distribution of the parameters studied (intensity, duration, and seasonality of drought impacts), significantly related to an environmental gradient associated with climatic conditions. Pinus spp. populations in the arid and semi-arid Mediterranean (especially P. halepensis) showed a very high response to long-term droughts, confirming their high capacity to cope with long periods of water deficit [67]. However, P. sylvestris and P. uncinata, which grow under more humid and temperate climatic conditions in mountains and transition zones, might be more vulnerable to future warmer and drier conditions. The positive trend towards aridity in these wetter sites could endanger the survival of these populations and favor the northward expansion of more drought-adapted species, such as P. halepensis [68]. Such heterogeneous responses among species to climatic variations are related to local adaptation and, above all, to the phenotypic plasticity of each species, and these two factors are fundamental for determining potential adaptability to future climatic conditions [11].

Supplementary Materials

The following supporting information can be downloaded at: https://www.mdpi.com/article/10.3390/f13091396/s1, Table S1: Precipitation correlation values for Pinus halepensis, Table S2: Mean temperature correlation values for Pinus halepensis, Table S3: Precipitation and mean temperature correlation values for Pinus halepensis, Table S4: Precipitation correlation values for Pinus sylvestris, Table S5: Mean temperature correlation values for Pinus uncinata, Figure S6: Intensity behavior as a function of mean annual temperature and annual precipitation, Figure S7: Duration behavior as a function of mean annual temperature and annual precipitation.

Author Contributions

Conceptualization, M.R.-N. and M.d.L.; Formal analysis, M.R.-N., E.M.d.C., R.S.-N., E.T. and M.d.L.; Investigation, M.R.-N., E.M.d.C., R.S.-N., K.N., L.A.L., M.A.S. and M.d.L.; Methodology, M.R.-N., E.M.d.C., R.S.-N. and M.d.L.; Visualization, M.R.-N.; Writing—original draft, M.R.-N. and M.d.L.; Writing—review & editing, M.R.-N., E.M.d.C., R.S.-N., E.T., K.N., L.A.L., M.A.S. and M.d.L. All authors have read and agreed to the published version of the manuscript.

Funding

This research received no external funding.

Data Availability Statement

https://grupoclima.unizar.es/#data. Here you can download "Ring width" (RW), "Latewood width" (LW) and "Earlywood width" (EW) and raw data from Pinus sylvestris and Pinus uncinata from northeastern Spain. A catalog with information on existing dendro sites is available here.

Conflicts of Interest

The authors declare no conflict of interest.

References

  1. Martin-Vide, J.; Lopez-Bustins, J.-A. The western Mediterranean oscillation and rainfall in the Iberian Peninsula. Int. J. Climatol. 2006, 26, 1455–1475. [Google Scholar] [CrossRef]
  2. Pasho, E.; Camarero, J.J.; de Luis, M.; Vicente-Serrano, S.M. Impacts of drought at different time scales on forest growth across a wide climatic gradient in north-eastern Spain. Agric. For. Meteorol. 2011, 151, 1800–1811. [Google Scholar] [CrossRef]
  3. Caloiero, T.; Veltri, S.; Caloiero, P.; Frustaci, F. Drought analysis in Europe and in the Mediterranean basin using the standardized precipitation index. Water 2018, 10, 1043. [Google Scholar] [CrossRef]
  4. Spinoni, J.; Naumann, G.; Vogt, J.V. Pan-European seasonal trends and recent changes of drought frequency and severity. Glob. Planet. Change 2017, 148, 113–130. [Google Scholar] [CrossRef]
  5. Forzieri, G.; Feyen, L.; Rojas, R.; Flörke, M.; Wimmer, F.; Bianchi, A. Ensemble projections of future streamflow droughts in Europe. Hydrol. Earth Syst. Sci. 2014, 18, 85–108. [Google Scholar] [CrossRef]
  6. Diffenbaugh, N.S.; Giorgi, F. Climate change hotspots in the CMIP5 global climate model ensemble. Clim. Change 2012, 114, 813–822. [Google Scholar] [CrossRef]
  7. Tolika, K.; Anagnostopoulou, C.; Velikou, K.; Vagenas, C. A comparison of the updated very high resolution model RegCM3_10km with the previous version RegCM3_25km over the complex terrain of Greece: Present and future projections. Theor. Appl. Climatol. 2016, 126, 715–726. [Google Scholar] [CrossRef]
  8. Stefanidis, S.P. Ability of different spatial resolution regional climate model to simulate air temperature in a forest ecosystem of central Greece. J. Environ. Prot. Ecol. 2021, 22, 1488–1495. [Google Scholar]
  9. Fischer, E.M.; Knutti, R. Anthropogenic contribution to global occurrence of heavy-precipitation and high-temperature extremes. Nat. Clim. Chang. 2015, 5, 560–564. [Google Scholar] [CrossRef]
  10. Campelo, F.; Nabais, C.; Freitas, H.; Gutiérrez, E. Climatic significance of tree-ring width and intra-annual density fluctuations in Pinus pinea from a dry Mediterranean area in Portugal. Ann. For. Sci. 2007, 64, 229–238. [Google Scholar] [CrossRef]
  11. De Luis, M.; Cufar, K.; Di Filippo, A.; Novak, K.; Papadopoulos, A.; Piovesan, G.; Rathgeber, C.; Raventós, J.; Saz, M.; Smith, K. Plasticity in dendroclimatic response across the distribution range of Aleppo pine (Pinus halepensis). PLoS ONE 2013, 8, e83550. [Google Scholar] [CrossRef] [PubMed] [Green Version]
  12. Royo-Navascues, M.; del Castillo, E.M.; Serrano-Notivoli, R.; Tejedor, E.; Novak, K.; Longares, L.A.; Saz, M.A.; de Luis, M. When Density Matters: The Spatial Balance between Early and Latewood. Forests 2021, 12, 818. [Google Scholar] [CrossRef]
  13. Camarero, J.J.; Linares, J.C.; Sangüesa-Barreda, G.; Sánchez-Salguero, R.; Gazol, A.; Navarro-Cerrillo, R.M.; Carreira, J.A. The multiple causes of forest declinein spain: Drought, historical logging, competition and biotic stressors. In Dendroecology: Tree-Ring Analyses Applied to Ecological Studies; Amoroso, M.M., Daniels, L.D., Backer, P.J., Camarero, J.J., Eds.; Springer International Publishing AG: Cham, Switzerland, 2017; pp. 307–323. [Google Scholar] [CrossRef]
  14. Martinez del Castillo, E.; Zang, C.S.; Buras, A.; Hacket-Pain, A.; Esper, J.; Serrano-Notivoli, R.; Hartl, C.; Weigel, R.; Klesse, S.; Resco de Dios, V.; et al. Climate-change-driven growth decline of European beech forests. Commun. Biol. 2022, 5, 163. [Google Scholar] [CrossRef] [PubMed]
  15. Stefanidis, S.; Alexandridis, V. Precipitation and potential evapotranspiration temporal variability and their relationship in two forest ecosystems in greece. Hydrology 2021, 8, 160. [Google Scholar] [CrossRef]
  16. Gruber, A.; Strobl, S.; Veit, B.; Oberhuber, W. Impact of drought on the temporal dynamics of wood formation in Pinus sylvestris. Tree Physiol. 2010, 30, 490–501. [Google Scholar] [CrossRef]
  17. De Luis, M.; Novak, K.; Raventós, J.; Gričar, J.; Prislan, P.; Čufar, K. Climate factors promoting intra-annual density fluctuations in Aleppo pine (Pinus halepensis) from semiarid sites. Dendrochronologia 2011, 29, 163–169. [Google Scholar] [CrossRef]
  18. De Luis, M.; Novak, K.; Raventós, J.; Gričar, J.; Prislan, P.; Čufar, K. Cambial activity, wood formation and sapling survival of Pinus halepensis exposed to different irrigation regimes. For. Ecol. Manage. 2011, 262, 1630–1638. [Google Scholar] [CrossRef]
  19. Baquedano, F.J.; Valladares, F.; Castillo, F.J. Phenotypic plasticity blurs ecotypic divergence in the response of Quercus coccifera and Pinus halepensis to water stress. Eur. J. For. Res. 2008, 127, 495–506. [Google Scholar] [CrossRef]
  20. Cochard, H.; Froux, F.; Mayr, S.; Coutand, C. Xylem Wall Collapse in Water-Stressed Pine Needles. Plant Physiol. 2004, 134, 401–408. [Google Scholar] [CrossRef] [PubMed]
  21. Eilmann, B.; Rigling, A. Tree-growth analyses to estimate tree species’ drought tolerance. Tree Physiol. 2012, 32, 178–187. [Google Scholar] [CrossRef] [PubMed] [Green Version]
  22. Griffin, D.; Anchukaitis, K.J. How unusual is the 2012-2014 California drought? Geophys. Res. Lett. 2014, 41, 9017–9023. [Google Scholar] [CrossRef]
  23. Gazol, A.; Camarero, J.J.; Sánchez-Salguero, R.; Zavala, M.A.; Serra-Maluquer, X.; Gutiérrez, E.; de Luis, M.; Sangüesa-Barreda, G.; Novak, K.; Rozas, V.; et al. Tree growth response to drought partially explains regional-scale growth and mortality patterns in Iberian forests. Ecol. Appl. 2022, 1–17. [Google Scholar] [CrossRef] [PubMed]
  24. Camarero, J.J.; Gazol, A.; Sangüesa-Barreda, G.; Cantero, A.; Sánchez-Salguero, R.; Sánchez-Miranda, A.; Granda, E.; Serra-Maluquer, X.; Ibáñez, R. Forest growth responses to drought at short- and long-term scales in Spain: Squeezing the stress memory from tree rings. Front. Ecol. Evol. 2018, 6, 1–11. [Google Scholar] [CrossRef]
  25. Carrer, M. Individualistic and Time-Varying Tree-Ring growth to climate sensitivity. PLoS ONE 2011, 6. [Google Scholar] [CrossRef] [PubMed]
  26. Guada, G.; Camarero, J.J.; Sánchez-Salguero, R.; Cerrillo, R.M.N. Limited growth recovery after drought-induced forest dieback in very defoliated trees of two pine species. Front. Plant Sci. 2016, 7, 418. [Google Scholar] [CrossRef] [PubMed]
  27. Sánchez-Salguero, R.; Camarero, J.J.; Hevia, A.; Madrigal-González, J.; Linares, J.C.; Ballesteros-Canovas, J.A.; Sánchez-Miranda, A.; Alfaro-Sánchez, R.; Sangüesa-Barreda, G.; Galván, J.D.; et al. What drives growth of Scots pine in continental Mediterranean climates: Drought, low temperatures or both? Agric. For. Meteorol. 2015, 206, 151–162. [Google Scholar] [CrossRef]
  28. Navarro-Cerrillo, R.M.; Sánchez-Salguero, R.; Manzanedo, R.D.; Camarero, J.J.; Fernández-Cancio, Á. Site and age condition the growth responses to climate and drought of relict Pinus nigra subsp. salzmannii populations in southern Spain. Tree-Ring Res. 2014, 70, 145–155. [Google Scholar] [CrossRef]
  29. Nicault, A.; Alleaume, S.; Brewer, S.; Carrer, M.; Nola, P.; Guiot, J. Mediterranean drought fluctuation during the last 500 years based on tree-ring data. Clim. Dyn. 2008, 31, 227–245. [Google Scholar] [CrossRef]
  30. Esper, J.; Konter, O.; Krusic, P.J.; Saurer, M.; Holzkämper, S.; Büntgen, U. Long-term summer temperature variations in the Pyrenees from detrended stable carbon isotopes. Geochronometria 2015, 42, 53–59. [Google Scholar] [CrossRef]
  31. Cook, B.I.; Ault, T.R.; Smerdon, J.E. Unprecedented 21st century drought risk in the American Southwest and Central Plains. Sci. Adv. 2015, 1, 1–8. [Google Scholar] [CrossRef] [PubMed] [Green Version]
  32. Serrano-Notivoli, R.; Tejedor, E.; Sarricolea, P.; Meseguer-Ruiz, O.; Vuille, M.; Fuentealba, M.; de Luis, M. Hydroclimatic variability in Santiago (Chile) since the 16th century. Int. J. Climatol. 2021, 41, E2015–E2030. [Google Scholar] [CrossRef]
  33. Tejedor, E.; Saz, M.A.; Esper, J.; Cuadrat, J.M.; de Luis, M. Summer drought reconstruction in northeastern Spain inferred from a tree ring latewood network since 1734. Geophys. Res. Lett. 2017, 44, 8492–8500. [Google Scholar] [CrossRef]
  34. Seftigen, K.; Linderholm, H.W.; Drobyshev, I.; Niklasson, M. Reconstructed drought variability in southeastern Sweden since the 1650s. Int. J. Climatol. 2013, 33, 2449–2458. [Google Scholar] [CrossRef]
  35. Vicente-Serrano, S.M.; Beguería, S.; Lorenzo-Lacruz, J.; Camarero, J.J.; López-Moreno, J.I.; Azorin-Molina, C.; Revuelto, J.; Morán-Tejeda, E.; Sanchez-Lorenzo, A. Performance of drought indices for ecological, agricultural, and hydrological applications. Earth Interact. 2012, 16, 1–27. [Google Scholar] [CrossRef]
  36. Martinez del Castillo, E.; Longares, L.A.; Gričar, J.; Prislan, P.; Gil-Pelegrín, E.; Čufar, K.; de Luis, M. Living on the edge: Contrasted wood-formation dynamics in Fagus sylvatica and pinus sylvestris under mediterranean conditions. Front. Plant Sci. 2016, 7, 1–10. [Google Scholar] [CrossRef]
  37. Novak, K.; de Luis, M.; Saz, M.A.; Longares, L.A.; Serrano-Notivoli, R.; Raventós, J.; Čufar, K.; Gričar, J.; Di Filippo, A.; Piovesan, G.; et al. Missing rings in pinus halepensis—The missing link to relate the tree-ring record to extreme climatic events. Front. Plant Sci. 2016, 7, 1–11. [Google Scholar] [CrossRef]
  38. Zalloni, E.; de Luis, M.; Campelo, F.; Novak, K.; De Micco, V.; Di Filippo, A.; Vieira, J.; Nabais, C.; Rozas, V.; Battipaglia, G. Climatic signals from intra-annual density fluctuation frequency in mediterranean pines at a regional scale. Front. Plant Sci. 2016, 7, 579. [Google Scholar] [CrossRef]
  39. Martínez del Castillo, E.; Tejedor, E.; Serrano-Notivoli, R.; Novak, K.; Saz, M.Á.; Longares, L.A.; de Luis, M. Contrasting patterns of tree growth of Mediterranean pine species in the Iberian Peninsula. Forests 2018, 9, 416. [Google Scholar] [CrossRef]
  40. Larsson, L.A. CoRecorder&CDendro Program; Cybis Elektron; Data AB; Version 7.6; 2012. [Google Scholar]
  41. Holmes, R. Computer-Assisted Quality Control in Tree-Ring Dating and Measurement. Tree-Ring Bull. 1983, 43, 69–78. [Google Scholar]
  42. Biondi, F.; Qeadan, F. Removing the tree-ring width biological trend using expected basal area increment. In Proceedings of the Fort Valley Experimental Forest-A Century of Research 1908–2008. Conference Proceedings, RMRS-P-55, Flagstaff, AZ, USA, 7–9 August 2008; Olberding, S.D., Moore, M.M., Eds.; U.S. Department of Agriculture, Forest Service, Rocky Mountain Research Station: Fort Collins, CO, USA, 2008; pp. 124–131. [Google Scholar]
  43. Bunn, A.; Korpela, M.; Biondi, F.; Campelo, F.; Merian, P.; Qeadan, F.; Zang, C.; Buras, A.; Cecile, J.; Mudelsee, M.; et al. Package “dplR” Dendrochronology Program Library in R; 2021; ISBN 9780792305866; Available online: https://cran.r-project.org/web/packages/dplR/index.html (accessed on 29 June 2022).
  44. Serrano-Notivoli, R.; de Luis, M.; Beguería, S. An R package for daily precipitation climate series reconstruction. Environ. Model. Softw. 2017, 89, 190–195. [Google Scholar] [CrossRef]
  45. Serrano-Notivoli, R.; Beguería, S.; Saz, M.Á.; Longares, L.A.; de Luis, M. SPREAD: A high-resolution daily gridded precipitation dataset for Spain—An extreme events frequency and intensity overview. Earth Syst. Sci. Data 2017, 9, 721–738. [Google Scholar] [CrossRef] [Green Version]
  46. Serrano-Notivoli, R.; Beguería, S.; De Luis, M. STEAD: A high-resolution daily gridded temperature dataset for Spain. Earth Syst. Sci. Data Discuss. 2019, 11, 1171–1188. [Google Scholar] [CrossRef]
  47. Vicente-Serrano, S.M.; Beguería, S.; López-Moreno, J.I. A multiscalar drought index sensitive to global warming: The standardized precipitation evapotranspiration index. J. Clim. 2010, 23, 1696–1718. [Google Scholar] [CrossRef]
  48. Beguería, S.; Vicente-Serrano, S.M. Package “SPEI.” R-Package 2017, 16. Available online: https://cran.r-project.org/web/packages/SPEI/SPEI.pdf (accessed on 29 June 2022).
  49. Hargreaves, B.G.H. REFERENCE EVAPOTRANSPIRATION By George H. Hargreaves, 1 Fellow, ASCE. J. Irrig. Drain. Eng. 1994, 120, 1132–1139. [Google Scholar] [CrossRef]
  50. Moeletsi, M.E.; Walker, S.; Hamandawana, H. Comparison of the Hargreaves and Samani equation and the Thornthwaite equation for estimating dekadal evapotranspiration in the Free State Province, South Africa. Phys. Chem. Earth 2013, 66, 4–15. [Google Scholar] [CrossRef]
  51. Bates, D.; Mächler, M.; Bolker, B.M.; Walker, S.C. Fitting linear mixed-effects models using lme4. J. Stat. Softw. 2015, 67. [Google Scholar] [CrossRef]
  52. Camarero, J.J.; Collado, E.; Martínez-de-Aragón, J.; de-Miguel, S.; Büntgen, U.; Martinez-Peña, F.; Martín-Pinto, P.; Ohenoja, E.; Romppanen, T.; Salo, K.; et al. Associations between climate and earlywood and latewood width in boreal and Mediterranean Scots pine forests. Trees - Struct. Funct. 2021, 35, 155–169. [Google Scholar] [CrossRef]
  53. Prislan, P.; Gričar, J.; de Luis, M.; Novak, K.; Martinez Del Castillo, E.; Schmitt, U.; Mrak, P.; Koch, G.; Štrus, J.; Žnidarič, M.T.; et al. Annual cambial rhythm in Pinus halepensis and Pinus sylvestris as indicator for climate adaptation. Front. Plant Sci. 2016, 7, 1923. [Google Scholar] [CrossRef]
  54. Novak, K.; de Luís, M.; Raventós, J.; Čufar, K. Climatic signals in tree-ring widths and wood structure of Pinus halepensis in contrasted environmental conditions. Trees-Struct. Funct. 2013, 27, 927–936. [Google Scholar] [CrossRef]
  55. De Luis, M.; Novak, K.; Čufar, K.; Raventós, J. Size mediated climate-growth relationships in pinus halepensis and pinus pinea. Trees - Struct. Funct. 2009, 23, 1065–1073. [Google Scholar] [CrossRef]
  56. Cherubini, P.; Gartner, B.L.; Tognetti, R.; Bräker, O.U.; Schoch, W.; Innes, J.L. Identification, measurement and interpretation of tree rings in woody species from mediterranean climates. Biol. Rev. Camb. Philos. Soc. 2003, 78, 119–148. [Google Scholar] [CrossRef] [PubMed] [Green Version]
  57. De Micco, V.; Balzano, A.; Čufar, K.; Aronne, G.; Gričar, J.; Merela, M.; Battipaglia, G. Timing of false ring formation in Pinus halepensis and arbutus Unedo in southern Italy: Outlook from an analysis of xylogenesis and tree-ring chronologies. Front. Plant Sci. 2016, 7, 705. [Google Scholar] [CrossRef] [PubMed]
  58. Zhirnova, D.F.; Belokopytova, L.V.; Barabantsova, A.E.; Babushkina, E.A.; Vaganov, E.A. What prevails in climatic response of Pinus sylvestris in-between its range limits in mountains: Slope aspect or elevation? Int. J. Biometeorol. 2020, 64, 333–344. [Google Scholar] [CrossRef]
  59. Popkova, M.I.; Vaganov, E.A.; Shishov, V.V.; Babushkina, E.A.; Rossi, S.; Fonti, M.V.; Fonti, P. Modeled tracheidograms disclose drought influence on Pinus sylvestris tree-rings structure from Siberian forest-steppe. Front. Plant Sci. 2018, 9, 1144. [Google Scholar] [CrossRef]
  60. De Micco, V.; Carrer, M.; Rathgeber, C.B.K.; Julio Camarero, J.; Voltas, J.; Cherubini, P.; Battipaglia, G. From xylogenesis to tree rings: Wood traits to investigate tree response to environmental changes. IAWA J. 2019, 40, 155–182. [Google Scholar] [CrossRef]
  61. Büntgen, U.; Frank, D.; Grudd, H.; Esper, J. Long-term summer temperature variations in the Pyrenees. Clim. Dyn. 2008, 31, 615–631. [Google Scholar] [CrossRef]
  62. Büntgen, U.; Krusic, P.J.; Verstege, A.; Sangüesa-Barreda, G.; Wagner, S.; Camarero, J.J.; Ljungqvist, F.C.; Zorita, E.; Oppenheimer, C.; Konter, O.; et al. New tree-ring evidence from the pyrenees reveals western mediterranean climate variability since medieval times. J. Clim. 2017, 30, 5295–5318. [Google Scholar] [CrossRef]
  63. Ruiz-Flano, P. Dendroclimatic series of Pinus uncinata R. in the central Pyrenees and in the Iberian system, Spain. A comparative study. Pirineos 1988, 132, 49–64. [Google Scholar]
  64. Tejedor, E.; de Luis, M.; Cuadrat, J.M.; Esper, J.; Saz, M.Á. Tree-ring-based drought reconstruction in the Iberian Range (east of Spain) since 1694. Int. J. Biometeorol. 2016, 60, 361–372. [Google Scholar] [CrossRef]
  65. Esper, J.; Großjean, J.; Camarero, J.J.; García-Cervigón, A.I.; Olano, J.M.; González-Rouco, J.F.; Domínguez-Castro, F.; Büntgen, U. Atlantic and Mediterranean synoptic drivers of central Spanish juniper growth. Theor. Appl. Climatol. 2015, 121, 571–579. [Google Scholar] [CrossRef]
  66. Tejedor, E.; Serrano-Notivoli, R.; de Luis, M.; Saz, M.A.; Hartl, C.; St. George, S.; Büntgen, U.; Liebhold, A.M.; Vuille, M.; Esper, J. A global perspective on the climate-driven growth synchrony of neighbouring trees. Glob. Ecol. Biogeogr. 2020, 29, 1114–1125. [Google Scholar] [CrossRef]
  67. Gazol, A.; Ribas, M.; Gutiérrez, E.; Camarero, J.J. Aleppo pine forests from across Spain show drought-induced growth decline and partial recovery. Agric. For. Meteorol. 2017, 232, 186–194. [Google Scholar] [CrossRef]
  68. Serra-Varela, M.J.; Grivet, D.; Vincenot, L.; Broennimann, O.; Gonzalo-Jiménez, J.; Zimmermann, N.E. Does phylogeographical structure relate to climatic niche divergence? A test using maritime pine (Pinus pinaster Ait.). Glob. Ecol. Biogeogr. 2015, 24, 1302–1313. [Google Scholar] [CrossRef]
Figure 1. (a) Location of the dendrochronological network (162 sites). (b) Annual mean precipitation for the 1950–2012 period. (c) Annual mean maximum temperature. (d) Annual mean minimum temperature. Numbers refer to different toponyms: (1) Pyrenees, (2) Iberian System, (3) Central System, (4) Catalan Coastal Range, and (5) the Mediterranean Sea.
Forests 13 01396 g001
Figure 2. Variability in annual basal area for P. halepensis Mill, P. sylvestris L, and P. uncinata Ramond ex A.
Forests 13 01396 g002
Figure 3. Boxplot of observed (a) intensity, (b) seasonality (in months), and (c) duration of drought effects (in months) of all analyzed sites. The central lines of boxplots indicate the median value, the vertical hinges indicate the first and third quartiles, the error bars indicate the 95% confidence interval of the median, and the small circles indicate values beyond the 95% confidence interval threshold. PIHA: P. halepensis; PISY: P. sylvestris; PIUN: P. uncinata.
Forests 13 01396 g003
Figure 4. Predicted intensity, duration (in months), and seasonality (in months) of drought effects on P. halepensis (a,d,g), P. sylvestris (b,e,h), and P. uncinata (c,f,i) based on the current distribution of each species.
Forests 13 01396 g004
Figure 5. Differences in intensity (a), duration (in months) (b), and seasonality (in months) (c) between P. halepensis and P. sylvestris across coexistence distribution area. Positive values (or months) indicate that P. halepensis shows higher values (or months) than P. sylvestris.
Forests 13 01396 g005
Figure 6. Differences in intensity (a), duration (in months) (b), and seasonality (in months) (c) between P. uncinata and P. sylvestris across coexistence distribution area. Positive values (or months) indicate that P. uncinata shows higher values (or months) than P. sylvestris.
Forests 13 01396 g006
Publisher’s Note: MDPI stays neutral with regard to jurisdictional claims in published maps and institutional affiliations.

