Article

Interactive Effects of Light Quality during Day Extension and Temperature on Bud Set, Bud Burst and PaFTL2, PaCOL1-2 and PaSOC1 Expression in Norway Spruce (Picea abies (L.) Karst.)

by
Camilo Chiang
1,
Marcos Viejo
1,2,
Oda Toresdatter Aas
1,
Katharina T. Hobrak
1,
Christian Bianchi Strømme
3,
Inger Sundheim Fløistad
2 and
Jorunn E. Olsen
1,*
1
Department of Plant Sciences, Faculty of Biosciences, Norwegian University of Life Sciences, P.O. Box 5003, NO-1432 Aas, Norway
2
Division of Forestry and Forest Resources, Norwegian Institute of Bioeconomy Research (NIBIO), P.O. Box 115, NO-1431 Aas, Norway
3
Department of Biological Sciences, University of Bergen, P.O. Box 7803, NO-5020 Bergen, Norway
*
Author to whom correspondence should be addressed.
Forests 2021, 12(3), 337; https://doi.org/10.3390/f12030337
Submission received: 29 January 2021 / Revised: 2 March 2021 / Accepted: 9 March 2021 / Published: 13 March 2021

Abstract

:
Light and temperature are crucial factors for the annual growth rhythm of tree seedlings of the boreal and temperate zone. Dormant, vegetative winter buds are formed under short days (SD) and altered light quality. In the conifer Norway spruce, expression of FTL2 increases and PaCOL1-2 and PaSOC1 decrease under light regimes, inducing bud set. Although temperature is known to modulate the timing of bud set, information about combined effects of light climate and temperature on bud phenology and gene expression is limited. We studied the interactive effects of temperature (18, 22/24 °C) and day extension with blue (B), red (R) or far-red (FR) light or different R:FR ratios compared to SD on growth–dormancy cycling and expression of FTL2, PaCOL1-2 and PaSOC1 in Norway spruce seedlings. Day-extension with B light and all treatments involving FR light sustained shoot elongation, with increased growth at higher temperature. The R light treatment resulted in delayed/prevented bud set compared to SD, with more delay/prevented bud set at 24 °C than 18 °C. This was associated with lower PaFTL2-transcript levels at 24 °C and more rapid subsequent bud burst. For the growth-sustaining treatments (long days, FR and B light), the PaFTL2-transcript levels were generally lower and those of PaCO1-2 and PaSOC1 higher compared with SD and R light. In conclusion, our results demonstrate more reduced/prevented bud set and faster bud burst with increased temperature under day extension with R light, indicating less deep dormancy than at lower temperature. Also, sustained shoot elongation under the B light treatment (27 µmol m−2 s−1) in contrast to the lower B light-irradiances tested previously (≤13 µmol m−2 s−1), demonstrates an irradiance-dependent effect of day extension with B light.

1. Introduction

There is growing interest in efficient year-round production of high-quality forest tree seedlings under semi-controlled or controlled conditions prior to planting in the field. Recent years’ developments in light-emitting diode (LED) technology have increased the efforts in tailoring the light climate for production of plants with desirable physiological traits. However, the production of high-quality forest tree seedlings using such lighting systems requires improved knowledge about the responses of the plants to the light and temperature climate during the growth–dormancy cycling.
For a wide range of tree species of the boreal and temperate zone, phenological transitions marking the end of the growing season occur in response to shifting light conditions. Shortening of the photoperiod (short days; SD) to a day length shorter than a critical one, has long been known to induce growth cessation and formation of dormant winter buds [1,2,3,4,5]. The critical photoperiod is also well known to increase with higher northern latitude of origin [1,2,3,4,5].
Furthermore, a range of studies has shown that light quality (spectral composition) influences autumn phenology in temperate and boreal trees. In seedlings of Norway spruce (Picea abies (L.) H. Karst.), silver birch (Betula pendula Roth) and bay willow (Salix pentandra L.), sustained growth depends on the presence of sufficient FR photons (700–800 nm) in the light spectrum [6,7,8,9,10,11]. The requirement for FR light depends on latitudinal origin, and northern provenances require higher irradiances of FR than more southern ones for sustained shoot elongation [10,11,12,13].
Other parts of the light spectrum have been shown to affect tree growth, including interactions between different wavelengths. A study using narrow-bandwidth LEDs with wavelengths corresponding to the absorption maxima of the relevant photoreceptors, indicated that a red R: FR light ratio of 1 (peaking at 660 and 730 nm, respectively) provided as day extension was more efficient in preventing bud set in seedlings of northern provenances of Norway spruce than FR only (provenances from 59 °N (Halden), 64 °N (Snåsa) and 66 °N (Rana); all from Norway) [10]. Also, day extension with R light at 0.6–18 µmol m−2 s−1 (0.1–3.3 W m−2; lower not tested) or B light (peaking at 460 nm) at 6 and 13 µmol m−2 s−1 (1.5 and 3.3 W m−2; lower not tested) delayed bud set, but did not prevent it, with more delay in southern than northern provenances [10,11]. The different provenances in these studies showed different sensitivity to different irradiances during day extension with R light [10,11]. When the R light was provided for 12 h following the main 12 h light period from fluorescent tubes, the southernmost Halden provenance showed delayed bud set from 0.6 µmol m−2 s−1 (0.1 W m−2) of R light and the intermediate Snåsa provenance from 9 µmol m−2 s−1 (1.7 W m−2), while all plants of the northernmost Rana provenance developed terminal buds [10]. When the R light was given both during the 12 h main light period and as a 12 h day extension, even the Rana plants showed delayed bud set from 10 µmol m−2 s−1 (1.8 W m−2) [10]. Furthermore, a night interruption with R light at 22 µmol m−2 s−1 delayed or reduced formation of terminal buds in Norway spruce seedlings with more delay in a more southern (61 °N) than northern (64 °N) provenance [14]. Also, a night break with combined R and FR light (22 µmol m−2 s−1 and 3.3 µmol m−2 s−1, respectively) was more efficient in preventing bud set than the R light only [14].
In Subalpine fir (Abies lasiocarpa (Hook.) Nutt.), day extension with FR light at 42 µmol m−2 s−1 (7 W m−2) increased shoot elongation and delayed bud set, although it was not generally prevented [15]. In Scots pine (Pinus sylvestris L.) seedlings, FR-enriched light spectra enhanced shoot and needle elongation, increased shoot dry mass and stem diameter, and stimulated secondary needle formation [16,17]. Furthermore, addition of FR light to supplementary B and R light increased the number of branches in Norway spruce seedlings but not in Scots pine, but the effect of FR light on shoot elongation was less clear in Norway spruce than Scots pine [17].
Although the photoperiod and light quality are considered the primary environmental cues controlling phenological transitions in trees, temperature has been shown to modulate their timing references in [4,5,18,19,20]. In a number of deciduous and coniferous tree species grown under controlled conditions, higher temperature under SD was shown to accelerate bud set and development of deep dormancy, as compared to lower temperature [21,22,23,24,25,26]. Oppositely, field studies of Populus have shown a delay in bud development at higher compared to lower autumn temperature [27,28,29]. The inconsistency of temperature effects between field experiments and experiments under controlled conditions may be due to climatic differences, including different light spectra. Under field conditions, photoperiod, light quality, irradiance and temperature shift gradually, while under controlled conditions, shifts in light parameters and temperature are typically more abrupt or constant conditions are used.
In Norway spruce, bud set in response to SD is associated with strong upregulation of the transcript level of the FLOWERING LOCUS T-TERMINAL FLOWER I-LIKE 2 (PaFTL2) gene, and bud burst with decreased FTL2 expression [11,30,31,32]. Similar results were found for Scots pine [33]. Furthermore, for Norway spruce, very low transcript levels were reported under day extension with growth-sustaining FR light [11]. That study also demonstrated some accumulation of the PaFTL2 transcript under day extension with R or B light treatments at 18 and 13 µmol m−2 s−1, respectively (3.3 W m−2). Consistent with delayed growth cessation and bud set under these conditions compared to SD, the FTL2 transcript levels then accumulated more slowly and to lower levels than under SD. These results, and the notion that FTL2-overexpression in Norway spruce causes early bud set [32], indicate that FTL2 acts as a growth inhibitor. The degree and rate of its accumulation seem to depend on the strength of the signal leading to growth cessation and bud set [10,11,30,31,32].
In Populus species, a CONSTANS (CO)-FLOWERING LOCUS T (FT)-regulon is involved in control of winter bud formation [34]. A high CO-expression at the end of a long day induces FT-expression and thus sustained elongation growth in such species [34]. In Norway spruce, no such CO-FT regulon has been found, but two CO-LIKE (COL) genes were characterised; PaCOL1 and PaCOL2 [35]. Furthermore, a homologous gene to a floral integrator in Arabidopsis thaliana ((L.) Heynh.), SUPRESSOR OF OVEREXPRESSION OF CONSTANS 1 (PaSOC1), was identified in Norway spruce [11,36]. The PaCOL1, PaCOL2 and PaSOC1 genes showed decreased transcript levels under SD-induced growth cessation, as compared to long days (LD) [11,35]. These genes also had reduced expression under day-extension treatments with R or B light, which delay bud formation, as compared to growth-sustaining LD and FR light treatments [11]. Similarly, two SOC1-like genes in white spruce (Picea glauca (Moench) Voss) showed reduced expression under SD but another SOC1-like gene showed increased transcript levels in developing buds [37].
To contribute to improved knowledge about responses of forest tree seedlings to light and temperature conditions, we aimed to investigate interactive effects of temperature and light quality during day-extension treatments on growth cessation, bud set and subsequent bud burst in Norway spruce seedlings. In this respect, day-extension treatments with B, R or FR light or different R:FR light ratios were provided to plants grown at 18 °C or 22/24 °C. Furthermore, to shed light on effects of the irradiance of the day-extension treatments, higher irradiances were used than those tested previously in the same provenance (Halden, 59 °N) [10,11]. In addition, we aimed to investigate the sensitivity of this and a more northern provenance (Rana, 66 °N) to interactive effects of temperature and photoperiod (SD, LD). The control of the winter bud formation by light quality and temperature was also addressed by analyses of the transcript levels of PaFTL2, PaCOL1-2 and PaSOC1, which were previously shown to change under bud set.

2. Materials and Methods

2.1. Growth Chambers, Recordings of Environmental Conditions and Plant Fertilization

All experiments (pregrowing and experimental treatments) were performed in closed growth chambers manufactured by the Centre for plant research in controlled climate (SKP) at the Norwegian University of Life Sciences (NMBU, Ås, Norway). The temperature and relative air humidity (RH) were recorded and controlled using a Priva computer system (Priva, De Lier, The Netherlands). In all experiments, the %RH was adjusted to correspond to a water vapour deficit (vpd) of 0.5 kPa (detailed %RH below). The variation in temperature and %RH was ≤ 1 °C and ≤ 5%, respectively. The photosynthetic photon flux density (PPFD) at 400–740 nm during the main light phase was measured at the top of the plant canopy using a LI-COR quantum sensor model Li-250 (LI-COR, Lincoln, NE, USA) and the R:FR light ratio was measured by a Skye R:FR-sensor (Skye Instruments, Llandrindod Wells, UK). The variation was ≤ 5% for both the PPFD and R:FR ratio. Details about the day-extension treatments with different light qualities are described below.
The plants were watered as required and fertilized twice a week with a complete nutrition solution. This consisted of a mixture of Calcinit and Kristalon Indigo (Yara, Oslo, Norway) and contained 14.3 mM nitrogen, 1 mM phosphorus, 5.1 mM potassium and the other essential macro- and microelements, at an electrical conductivity (EC) of 1.5 mS cm−1, as measured with a ScanGrow EC meter (ScanGrow, Slangerup, Denmark).

2.2. Plant Materials and Pre-Growing Conditions

Seeds of Norway spruce from the provenance CØ1, originating from 59 °N latitude, in Halden, Norway (seed lot 98063; Skogfrøverket, Hamar, Norway) and the provenance P1, originating from 66 °N latitude, in Rana, Norway (seed lot 4145; Skogfrøverket) were used. Two seeds were sown in each pot (Vefi, Drammen, Norway) of 5.5 × 5.5 × 4.5 cm to ensure the presence of at least one plant since the germination rate was about 60%. The seeds were sown in a 3:1 mixture of fertilised peat (pH 6; S-soil, Hasselfors, Oslo, Norway) and perlite. After germination, thinning to one plant per pot was done using scissors to avoid root disturbance. The seedlings were grown for 7 weeks before starting the experimental treatments.
The plants were grown at a constant temperature of 18 °C and RH of 76%. LD of 24 h was used to ensure a photoperiod longer that the critical one, allowing continued growth for the northern provenances. In experiment 1–4, a PPFD of 200 μmol m−2 s−1 from high pressure sodium (HPS) lamps (Gavita 400W HPS GAN 400 AL, Gavita, Aalsmeer, Netherlands) was used, with the R:FR light ratio adjusted to 1.7 with low-intensity light from incandescent lamps (Narva 60W, Germany and Philips Electronics, Amsterdam, Netherlands). In experiment 5–6, a PPFD of 250 μmol m−2 s−1 μmol was applied with quartz metal halide lamps (Master HPI-T Plus 400W/645 E40 1SL, Phillips, Amsterdam, Netherlands). In these two experiments, the plants were placed on 50 cm × 50 cm trolleys with the HPI-T lamps mounted at 1 m distance above the trolleys. A R:FR ratio of 1.8 was then achieved using incandescent lamps.

2.3. Experimental Design and Conditions

2.3.1. The Main Light Phase Conditions during the Experimental Period

Table 1 provides an overview of the experimental conditions, including the pregrowing conditions, in the six different experiments performed. Experiment 1–2 investigated interactive effects of temperature and photoperiod in the Halden and Rana provenances. Experiment 3–6 tested combined effects of temperature and light quality in the Halden provenance.
In all experiments, the main light period was provided for 12 h daily from HPS lamps (Lucalox 400W, General electric, New York, NY, USA). In experiment 1–2, the main light period had a PPFD of 200 μmol m−2 s−1, whereas in experiment 3–4, a PPFD of 160 μmol m−2 s−1 was used. The R:FR light ratio during this period was adjusted with incandescent lamps to 1.7 and 2 in experiments 1–2 and 3–4, respectively. The reasons for these differences were the following: Experiment 1–2 was performed in small (not walk-in) growth chambers enabling 200 μmol m−2 s−1 and a R:FR ratio of 1.7. Experiment 3 and 4 were performed in larger walk-in chambers, where day extension with different light qualities was provided on 50 cm × 50 cm trollies enclosed by reflecting plastic curtains (described below). In both chamber types, the lamps used for the main photoperiod in experiment 1–4 were mounted in the ceiling of the chambers. The highest irradiance that could be obtained at the top of the canopy in each plastic-enclosed trolley in experiment 3–4 was 160 μmol m−2 s−1 and the lowest possible R:FR ratio obtained was 2.0 (incandescent lamps above the plastic curtains). In experiments 5 and 6, the HPS lamps were mounted 1 m above each trolley to enable higher irradiance than possible with lamps at the top of the growth chamber. Thus, in experiment 5–6, a PPFD of 260 μmol m−2 s−1 was used. To ensure sufficient FR light in the spectrum of the main light phase for the northern provenance used, the R:FR ratio was modified to 2.5 (lower was not possible) using five FR light-emitting diode panels (LEDs) with 5 diodes in each for each trolley (1 m above the trolleys), with a band width between 680 nm and 750 nm and a maximum at 725 nm. Since the main light was closer to the plants in these two experiments, heat-generating incandescent lamps could not be used for the adjustment of the R:FR ratio during the main light phase.

2.3.2. Temperature and Day-Extension Treatments during the Experimental Period

In experiments 1 and 2, seedlings from the Halden and Rana provenances were exposed to either SD of 12 h or LD of 24 h photoperiod using a main light period of 12 h, followed by 12 h darkness or day extension to 24 h with low-intensity incandescent light, respectively (light sources described above). For each photoperiod, three subsets of seedlings, with 20 plants in each, were exposed to 12, 18 or 24 °C. Due to chamber capacity, the experiments with the two provenances were performed in sequence, using the same 6 chambers for both experiments.
In experiment 3–6, different subsets of seedlings, with 18–20 plants from the Halden provenance in each treatment, were exposed to day extensions with different light qualities from LEDs (Philips GreenPower LED research module, Phillips, Amsterdam, Netherlands) at 18 °C or 22 °C in experiment 3, and at 18 °C or 24 °C in experiment 4–6. The idea was to test temperatures commonly occurring during the summer in nursery greenhouses in Scandinavia. The different light treatments were given on individual trolleys properly isolated with non-transparent, reflecting plastic curtains. The airflow in the chambers came from below, ensuring equal temperature in all trolleys. The different temperature treatments in each experiment were given in separate growth chambers.
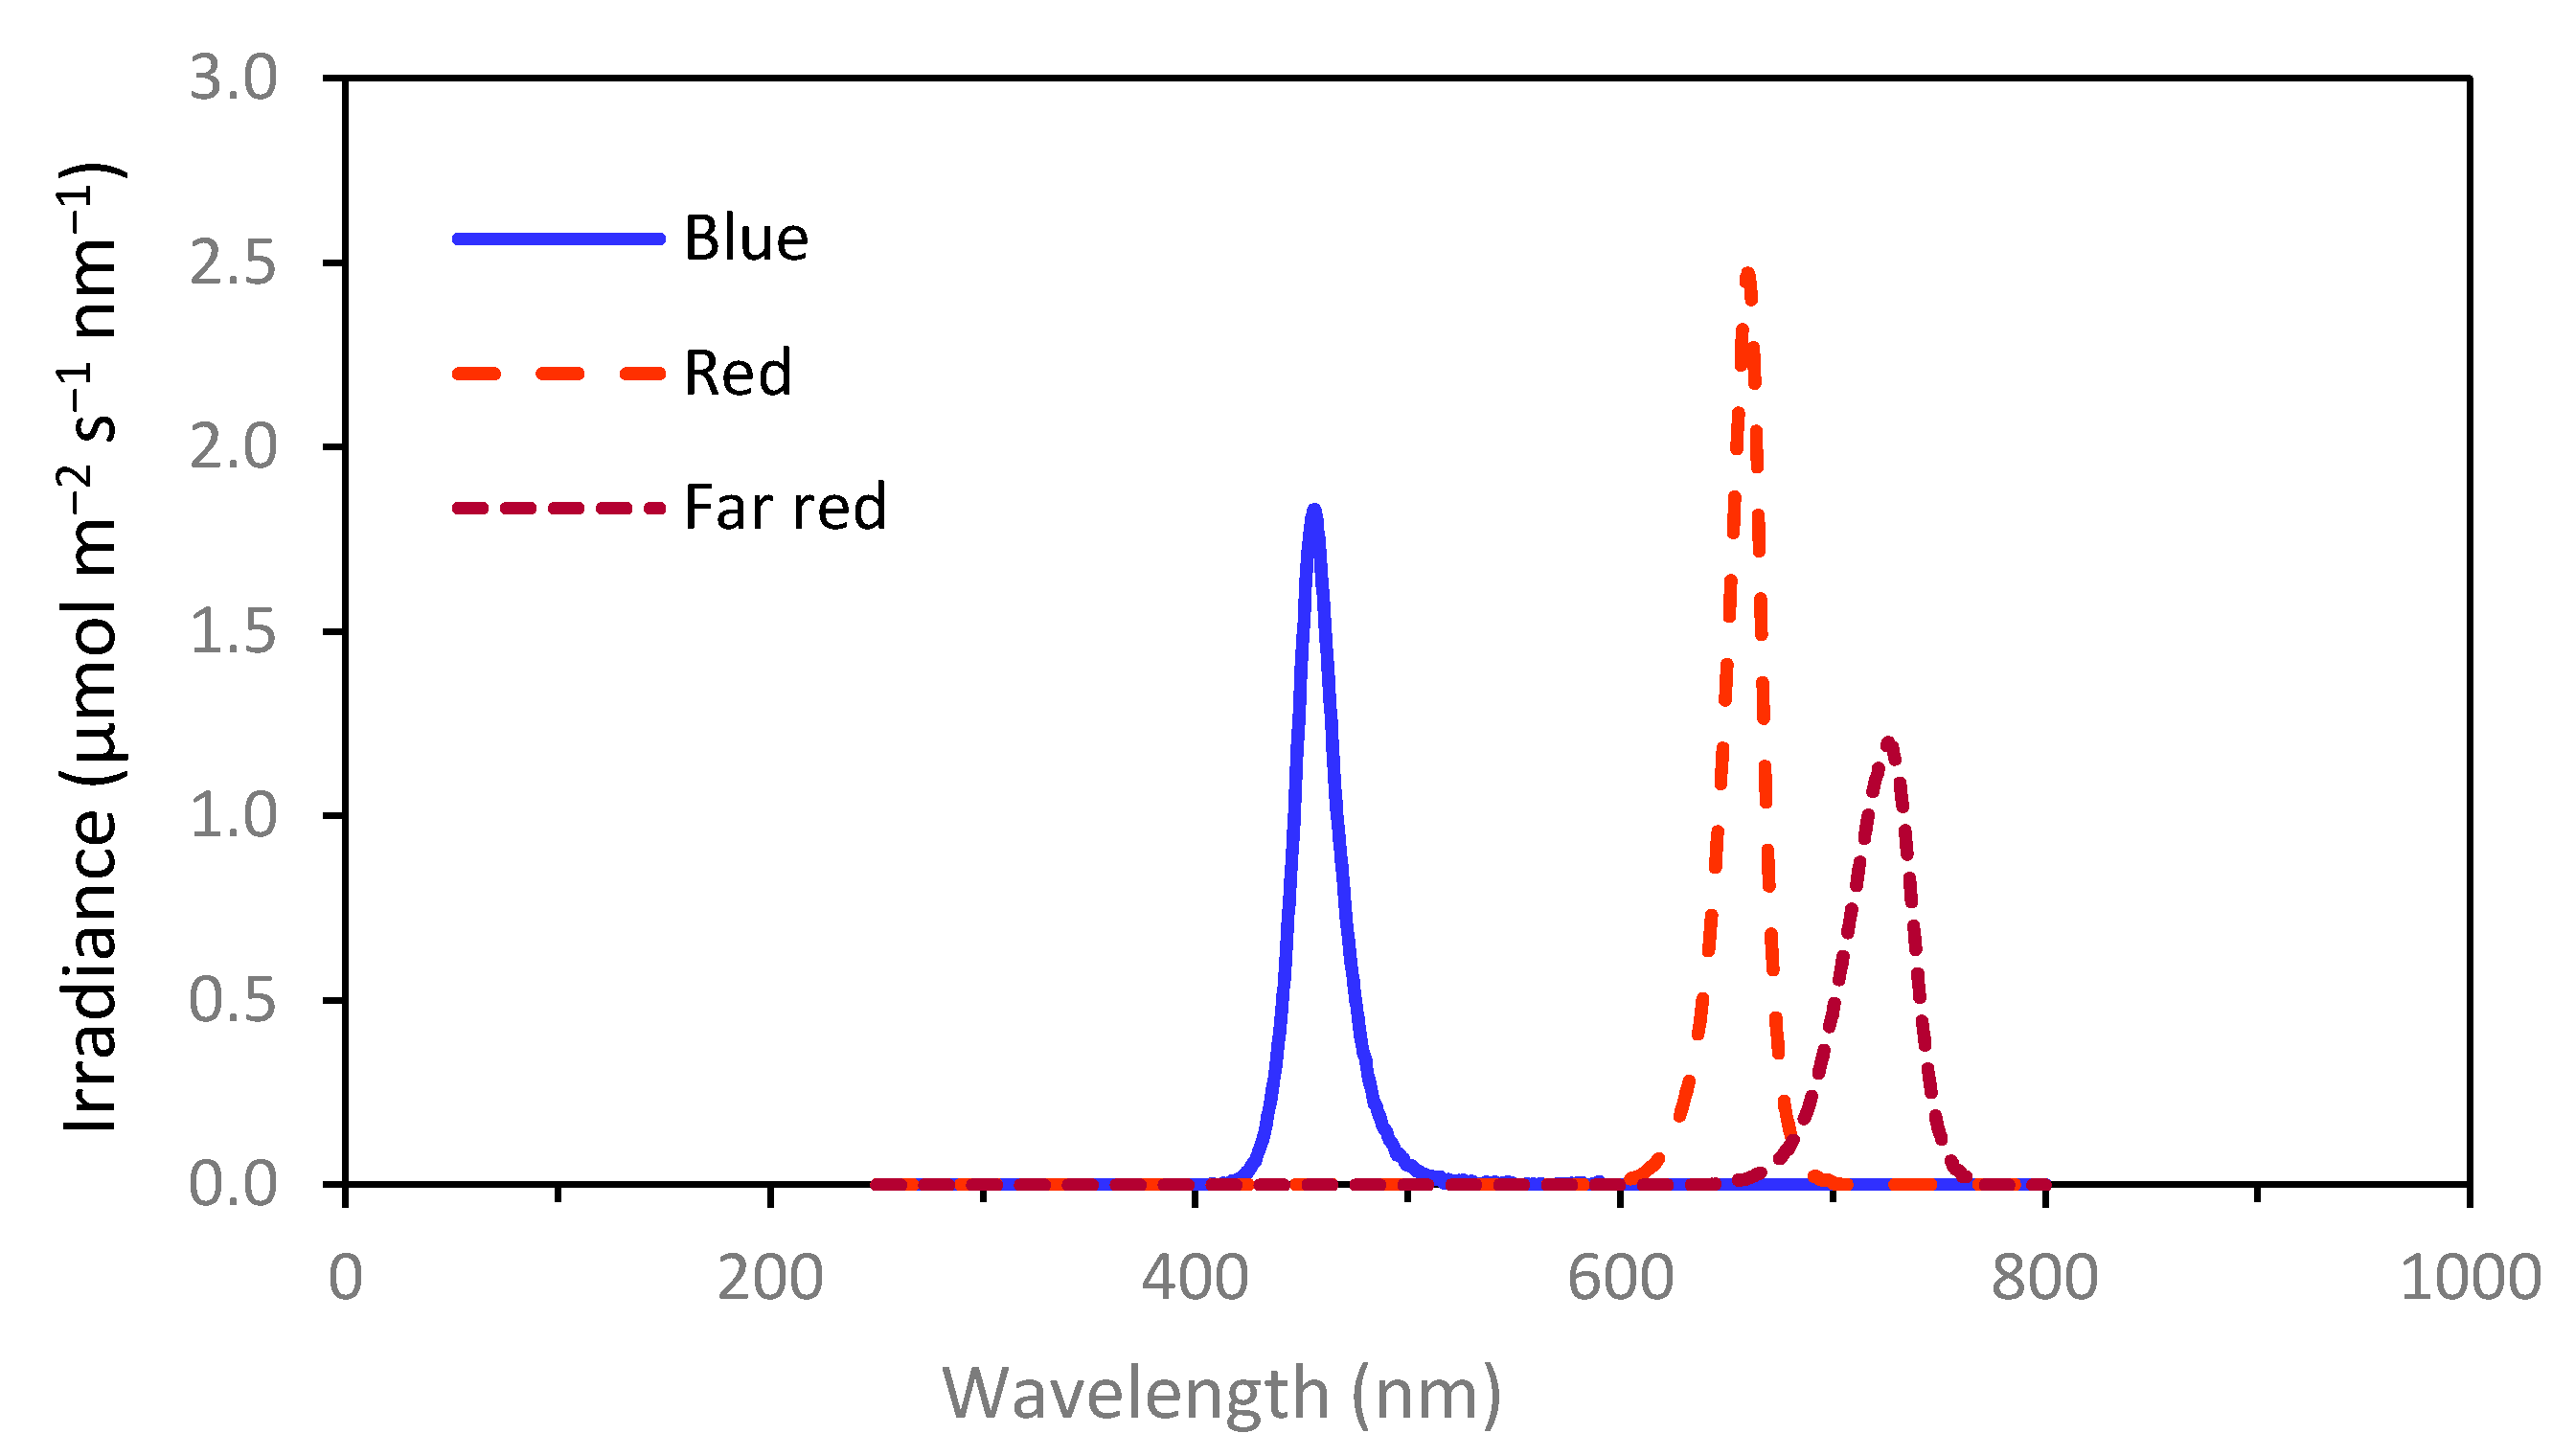
The different light qualities were applied as a 12 h extension of the 12 h main daily light period. In addition, an overlap between the LED light and the main light phase of 30 min at the start and end of the main photoperiod was used to ensure that there was no gap in the lighting. A SD treatment with 12 h darkness following the 12 h main light period was also established as a control treatment (no day extension). For all light quality treatments, an equal amount of energy, i.e., 7 W m−2, was used, as measured at the top of the canopy with a SD2000 Miniature Fiber Optic Spectrometer (Ocean Optics, Orlando, FL, USA). This was calculated to correspond to 27, 38 and 42 µmol m−2 s−1 for the B, FR and R LED light, respectively. These calculations employed conversion factors obtained by later measurements of the LED spectra (Figure 1) in W m−2 and µmol m−2 s−1, using an Optronic model 756 spectroradiometer (Optronic laboratories, Orlando, FL, USA). The peak wavelengths were 460 nm for the B light, 660 nm for the R light and 730 nm for the FR light.
Experiments 3 and 4 included day-extension treatments with B, R or FR light. Experiment 5 employed day extension with FR light (phytochrome photostationary state; PPS = 0.24), R: FR ratio 0.5, 1 or 2 (PPS = 0.72, 0.78 and 0.81, respectively) or R light (PPS = 0.88). In experiment 6, day extension with the FR light, R: FR ratio 0.1, 0,2 or 0.5 (PPS = 0.4, 0.56 and 0.72, respectively) or the R light was used. The PPS value is defined as the ratio of the FR light-absorbing form of phytochrome (Pfr) to the total phytochrome, i.e., the R light-absorbing form of phytochrome (Pr) + Pfr at equilibrium. This was calculated according to [38] by multiplying the irradiance at each wavelength with the relative absorption for each phytochrome form, with the absorption data derived from [38]. In experiment 6, the idea was to provide a more equally distributed range of PPS values (orthogonal treatments) than in experiment 5.
In experiment 1–2, the RH values used were 64%, 76%, and 83% for 12 °C, 18 °C and 24 °C, respectively. In experiment 3–6, the RH values were 76%, 81% and 83% for 18 °C, 22 °C and 24 °C, respectively.

2.3.3. Environmental Conditions during Forcing to Bud Burst

After 6–8 weeks of exposure to the different temperature and light quality/photoperiod treatments in experiments 1, 2 and 4, seedlings were retransferred to growth chambers with environmental conditions as during the pregrowth; 18 °C, vpd 0.5 kPa, and 24 photoperiod (12 h main light period + 12 h low-intensity light from incandescent lamps) with a PPFD of 200 μmol m−2 s−1 and a R:FR ratio of 1.7 during the 12 h main light period.

2.4. Recordings of Growth and Stages of Bud Set and Bud Burst

For each treatment, the height of each plant was measured once a week in all experiments, as total height from the base of the stem to the shoot apical meristem. The increase in height (cumulative shoot elongation) was calculated. Since height measurements for the day of transfer to the different treatments (day 0) are lacking for the Rana provenance in experiment 2, plant height is shown for both studied provenances in experiments 1 and 2. The winter bud development was recorded three times per week using codes where growing plants without buds were coded as 0, light green buds as 1 and brown buds as 2 (Figure S1). It should be noted that in seedlings of Norway spruce, only vegetative buds are formed and that the generation time of this conifer species is about 25 years. In all experiments, 18–20 plants were used per treatment. After transfer of 18–20 plants per bud-inducing treatment to the forcing conditions, bud burst was recorded with the following bud stages; 2: closed bud, 1: opening in bud, 0: regrowth with needles protruding from the bud (Figure S2).

2.5. Studies of Gene Expression

2.5.1. Sample Collection

To assess the effect of light quality/photoperiod and temperature treatments on the transcript levels of PaFTL2, PaCOL1, PaCOL2 and PaSOC1, 4 and 3 repeated samples were harvested per treatment in time courses from experiments 1–2 and 5, respectively. Each sample consisted of about 5 mm of the shoot tips without elongated needles from 3 pooled plants. In experiment 1–2, samples were harvested from all treatments and in experiment 5, from the R and FR light, the R: FR ratio 1 and the SD treatment. The samples were collected at the start of the experimental treatments (day 0), at day 5 (experiment 1–2) or 7 (experiment 5) and at day 51, 49 and 48 in experiments 1, 2 and 5, respectively. The samples were harvested in the middle of the photoperiod into liquid nitrogen (N2) and kept at −80 °C until analysis.

2.5.2. RNA Extraction and Purification and Analyses of Transcript Levels

Total RNA was extracted and purified using Masterpure Plant RNA Purification Kit (Epicentre, Madison, WI, USA) and PureLink RNA Mini kit (Thermo Fisher Scientific, Waltham, MA, USA), according to the manufacturer’s instructions. RNA quality was assessed using an Agilent 2100 Bioanalyzer with an RNA 144000 NanoKit (Agilent technologies, Palo Alto, CA, USA) and the quantity of isolated RNA was measured with a NanoDrop ND-1000 Spectrophotometer (Thermo Scientific, Wilmington, DE, USA). cDNA was synthesized from 1 µg RNA in a 20 μL reaction volume using reverse transcriptase Superscript VILO cDNA Synthesis (Life Technologies, Thermo Fisher Scientific).
Gene-specific primers for the target genes PaFTL2, PaCOL1, PaCOL2 and PaSOC1 and the genes used as internal reference genes, Paα-TUBULIN, PaACTIN (PaACT) and PaELONGATION FACTOR 1α (PaEF1α), were designed using the Primer3 software and the melting points and product lengths were assessed as described previously [11,39; primers in 11]. The transcript levels were analysed using a 7500 Fast Real-Time PCR system (Applied Biosystems, Foster City, CA, USA) and the relative transcript levels quantified on basis of the threshold cycle (CT) values from the quantitative PCR analyses, all according to [39]. All samples were analysed in triplicate and the transcript levels of the target genes were normalised to the mean values of the internal reference genes that all had stable transcript levels under the experimental conditions, and thereafter related to the day 0 samples. A non-template control was run for each primer pair.

2.6. Statistical Analyses

To evaluate the effect of the photoperiod, temperature and provenance in experiments 1 and 2 on shoot height increase in the overall experiments (entire time courses), a three-way analysis of variance (ANOVA) was performed. To evaluate the effect of temperature and provenance on bud set stages and subsequent bud burst stages in these experiments, a two-way ANOVA was done. Furthermore, to evaluate the effect of light quality provided as day-extension and temperature on shoot elongation, bud set and bud burst stages in experiment 3–6, a two-way ANOVA was used. A linear model for the shoot elongation and a generalized linear model for the bud set and bud burst stages were used. Plant and time were treated as random effects according to [40], because the recordings were performed on the same plants in time courses, which violates the assumption of independence of the data. To evaluate the effects of photoperiod, temperature and provenance on the transcript levels of PaFTL2, PaSOC1, PaCOL1 and PaCOL2 at the end of experiment 1–2, a three-way ANOVA was used. To assess the effects of light quality and temperature on transcript levels at the end of experiment 5, a two-way ANOVA was used.
To facilitate the visual comparison of the effects of the different treatments on shoot elongation, bud set and bud burst as well as transcript levels additional ANOVAs were performed for the values at the end of the experiments within one figure, followed by a Tukey’s post hoc test.
An exponential model was fitted using the bud set stage or shoot elongation for the different treatments to predict the transcript levels of the previously mentioned genes at the end of the experiments. Although the bud set category or shoot elongation in several cases were either not the best fit or not the only variable explaining the best fit for each regression, these were used for the visual representation, except that models with an R2 value lower than 0.2 were not added. All statistical analyses were done using the R software, version 3.6 (www.r-project.org; accessed on 24 December 2020).

3. Results

3.1. Provenance Sensitivity to Effects of Temperature and Photoperiod on Shoot Elongation, Bud Set and Bud Burst

Overall analyses of the results in experiments 1 and 2 showed that the plant height was significantly affected by photoperiod (p ≤ 0.001), temperature (p ≤ 0.05) and provenance (p ≤ 0.01), and there was a significant interactive effect of temperature and photoperiod (p ≤ 0.0001) as well as temperature and provenance (p ≤ 0.0001; Table S1a). Furthermore, terminal bud set under SD was significantly affected by temperature (p ≤ 0.0001) and provenance (p ≤ 0.001), and there was a significant interaction between temperature and provenance (p ≤ 0.01; Table S1b).
At the end of these experiments, the LD-exposed plants from both provenances had grown significantly taller at 24 °C and 18 °C than at 12 °C (Figure 2a,b; p ≤ 0.05). The Halden plants were then 9.5 cm, 8.7 cm and 5.4 cm tall, respectively, at 24 °C, 18 °C and 12 °C (day 49), and the corresponding values for the Rana plants (day 48) were 5.6 cm, 4.6 cm and 2.5 cm.
Under SD, growth cessation in both provenances was observed within about 10–14 days for all temperatures, with a tendency of earlier growth cessation in the Rana provenance (Figure 2a,b). Despite taller Halden plants at 24 °C than 12 °C at the end of the SD exposure (p ≤ 0.05) (Figure 2a), the development of terminal buds was more rapid at 24 °C and 18 °C than 12 °C (Figure 2c). These plants were then 4.7 and 3.5 cm tall at 24 °C and 12 °C, respectively, and had grown 1.4 cm and 0.6 cm relative to day 0. Their average time to bud set stage 1 was 19, 22 and 40 days at 24 °C, 18 °C and 12 °C, respectively. Bud set stage 2 was reached after 30 and 42 days at 24 °C and 18 °C, respectively. At 12 °C, bud set stage 2 had not been reached at the end of the SD exposure (day 50). The average bud set stage was then 1.6, which was significantly lower (p ≤ 0.05) than at 24 °C and 18 °C. In contrast to the Halden plants, the Rana plants did not differ significantly in their overall growth at the different temperatures (Figure 2b). The Rana plants were 2–2.2 cm tall at the end of the SD exposure, which was significantly shorter than the Halden plants (Figure 2b; Table S1a; p ≤ 0.05). Bud set stage 1 was reached in the Rana plants after 19 and 18 days at 24 °C and 18 °C, and after 28 days at 12 °C, whereas bud set stage 2 was reached after 27 days at 24 °C and 40 days at 18 °C and 12 °C (Figure 2d).
Overall, subsequent bud burst after re-transfer to LD at 18 °C, was significantly affected by temperature during the SD-induced bud set (p ≤ 0.0001), and there was a significant difference (p ≤ 0.0001) between provenances in this respect. Furthermore, there was a significant interaction between temperature and provenance (p ≤ 0.0001; Table S1c). For both provenances, bud burst occurred faster in plants from 12 °C than from 24 °C (Figure 2e,f). Also, the bud burst following SD at 18 °C appeared slightly faster and slower than after SD at 24 °C and 12 °C, respectively. This effect was statistically significant (p ≤ 0.05) in the Halden plants at the end of the experiment (day 27), but not in the Rana plants (day 26). In the Halden plants from 12 °C, which showed bud set stage 1.6 at the end of the SD treatment, complete bud burst and regrowth were observed at the end of the forcing experiment (Figure 2e). The Halden plants from 18 °C and 24 °C, which both had bud set stage 2 at end of the SD exposure, had then reached bud burst stage 0.9 and 1.4, respectively. The onset of bud burst was more rapid in the Rana plants (Figure 2f). At the end of the experiment at day 26 after the retransfer to LD at 18 °C, their bud burst stages were 0.5, 0.9 and 1.2 for plants from 12 °C, 18 °C and 24 °C, respectively.

3.2. Effects of Light Quality during Day-Extension and Temperature on Shoot Elongation, Bud Set and Bud Burst

Overall, the light-quality treatments (SD or day extension with R, B or FR light) affected shoot elongation significantly in experiments 3 and 4, as tested in the Halden provenance (p ≤ 0.0001). There was a significant overall effect of temperature in experiment 3 only (p ≤ 0.001; Table S2a,b). In this experiment, there was no significant interaction between temperature (18 °C, 22 °C) and light quality (Table S2a). However, when a slightly larger temperature difference (18 °C, 24 °C) was used in experiment 4, a significant interaction between temperature and light quality (p ≤ 0.01) was observed (Table S2b).
The R light treatment induced 1.8 cm more shoot growth at 22 °C than 18 °C in experiment 3, and 3.6 cm more shoot elongation at 24 °C than 18 °C in experiment 4 (Figure 3; p ≤ 0.05). At 18 °C, the shoot elongation ceased under the R light, but this was not the case at 22 °C and 24 °C (Figure 3). Regardless of temperature, the FR and B light-treated plants showed 4.2–4.8 cm more shoot elongation at the end of experiment 3 as compared to the SD- and R light-treated plants, and the corresponding values for experiment 4 were 3.9–6.2 cm (Figure 3). There was no significant difference in shoot elongation between FR and B light at any of the temperatures (Figure 3). Also, at 18 °C there was no significant difference between R and SD, but these treatments differed significantly at 22 and 24 °C (Figure 3).
Overall, in experiments 3 and 4, the light quality treatments (p ≤ 0.0001) and temperature (p ≤ 0.0001) affected bud set significantly, and there was a significant interaction between light quality and temperature in both experiments (p ≤ 0.0001; Table S2c,d). Towards the end of experiment 3, there was a trend of slightly reduced bud set under the R light treatment under 22 °C compared to 18 °C (Figure 4a,b). However, due to bud burst in some plants at 18 °C under R light, the bud set stage was 1.8 at day 50 in both temperatures (Figure 4a,b). In experiment 4, the bud set response to R light differed significantly under 24 °C compared to 18 °C (Figure 4c,d). The percentage of plants with terminal buds in response to R light then decreased from 94% at 18 °C to 41% at 24 °C. For these plants to reach bud stage 1, it took 25 and 35 days at 18 °C and 24 °C, respectively (Figure 4c,d). At 18 °C, bud stage 2 was reached after 30 days for both the R and SD-exposed plants, but some of the R light-exposed plants thereafter showed bud burst (from day 40), resulting in average bud stage 1.9 at the end of the experiment (Figure 4c,d). At 24 °C, the final bud stage (day 50) was 0.8 for the R light-treated plants (Figure 4c,d). In both experiment 3 and 4, the B and FR light treatments at both temperatures prevented bud set in the vast majority of the plants (Figure 4a–d). Less than 3% of these plants then formed buds, i.e., mostly in B light (Figure 4a–d).
Subsequent bud burst after retransfer to LD at 18 °C of plants with buds after exposure to SD and the R light treatment at 18 and 24 °C (experiment 4) was overall significantly affected by the light treatment under bud set (p ≤ 0.0001) and there was a significant interactive effect between light treatment and temperature (p ≤ 0.0001; Table S2e). Relative to the plants from SD where bud burst was quicker after 18 °C compared to 24 °C, the bud burst in plants from R light at 18 °C was delayed, and advanced in plants from R light at 24 °C (Figure 4e,f). The plants from SD at 18 °C all showed regrowth at the end of the bud break experiment (51 days), whereas the plants from SD at 24 °C had on average bud burst stage 0.75 (Figure 4e,f). The R light-exposed plants from 18 °C and 24 °C took around 32 and 28 days to reach bud burst stage 1 and at the end of the experiment the bud burst stages were 0.2 and 0 for the respective temperatures (Figure 4e,f).
Overall, in experiments 5 and 6, shoot elongation was affected significantly (p ≤ 0.0001) by the light treatments (SD or day extension with R, FR or R:FR ratio 0.5, 1 or 2 in experiment 5; SD or day extension with R, FR or R:FR ratio 0.1, 0.2 or 0.5 in experiment 6), as tested in the Halden provenance (Table S3a,b). There was also a significant effect of temperature (18 °C–24 °C) in both experiments, and a significant interaction between light treatment and temperature in experiment 5 (p ≤ 0.0001; Table S3a,b). The R light-exposed plants grew 3.7 cm and 1.3 cm more at 24 °C than 18 °C in experiments 5 and 6, respectively (Figure 5; p ≤ 0.05). Furthermore, at 24 °C, the plants exposed to R light grew significantly more than those exposed to SD, i.e., 4.6 cm and 1.4 cm more in experiments 5 and 6, respectively (Figure 5). However, this was not the case under R light at 18 °C, where growth cessation occurred (Figure 5). Furthermore, the FR light and the different R:FR ratio treatments generally resulted in significantly more growth than SD, but the difference was larger at 24 °C than 18 °C (Figure 5). The plants exposed to FR at 18 °C and 24 °C had grown 4 cm and 6.4 cm more than SD in experiment 5, and the corresponding values were 2.3 cm and 5 cm in experiment 6 (Figure 5). In most cases, the shoot elongation under the different R:FR ratios did not differ significantly from FR only, except at 24 °C in experiment 5, where the R:FR ratio 0.5 resulted in more shoot elongation than the FR light and R:FR ratio 2. By contrast, in experiment 6, FR light induced more growth than the R:FR ratio 0.5.
Overall, in experiment 5, the light treatments had a significant effect on the bud set (p ≤ 0.0001), but there was no significant effect of temperature or interaction between light treatment and temperature (Table S3c). Overall, in experiment 6, temperature (p ≤ 0.05) significantly affected bud set, and there was a significant interaction between light treatment and temperature (p ≤ 0.001) (Table S3d). For the day extension with R light, there was far less bud set in 24 °C than 18 °C in both experiments 5 and 6 (Figure 6). At the end of experiment 5, the bud set stage under the R light treatment at 18 °C and 24 °C was 1.3 and 0.4, respectively (Figure 6a,b), and the percentage of plants with terminal buds were 72% and 27%. At the end of experiment 6, the corresponding values for the bud set stages in the R light-exposed plants at 18 °C and 24 °C were 1.7 and 0.9, respectively (Figure 6c,d), and 88% and 44% of the plants then had buds at these temperatures. In these two experiments, no bud set was observed in the plants exposed to FR or different R:FR ratios (Figure 6).

3.3. Effect of Temperature and Photoperiod on Transcript Levels of FTL2, COL1-2 and SOC1

At all temperatures in experiments 1 and 2, the COL1 transcript levels were lower in both provenances under SD than LD at both day 5 and the end of the experiment (day 51/49; Figure 7a,b; Table S4a). For COL2, the transcript levels were also lower under SD than LD in both provenances at day 5 at all temperatures, except in the Halden provenance at 12 °C, which was similar to 24 °C (Figure 7c,d; Table S4b). At day 51/49 this pattern was not observed. No unequivocal temperature effect on COL1 and COL2 was observed. The SOC1 transcript level was generally higher under LD at 24 °C than the other treatments (Figure 7e,f; Table S4c). Furthermore, at all tested temperatures, the FTL2 transcript levels were strongly affected by photoperiod in both provenances, with substantially higher transcript levels under SD than LD (Figure 7g,h; Table S4d). The overall statistical analyses showed effects of photoperiod and temperature as well as interactive effects of temperature and photoperiod for all genes (Table S4), but the relationship between temperature and transcript level was variable (Figure 7). Analyses of the correlation between transcript level and bud set stage on one hand, and transcript level and shoot elongation on the other hand (Figure 8, Tables S5 and S6), revealed the highest correlations between the COL1 transcript level and bud set (R2 0.76–0.93) and the FTL2 transcript level and bud set (R2 0.97–0.98).

3.4. Effect of Temperature and Light Quality on Transcript Level of FTL2, COL1-2 and SOC1

Overall, the statistical analyses of transcript levels of COL1, COL2 and SOC1 in experiment 5 did not reveal any significant effect of temperature (18 °C and 24 °C) (Table S7a–c; Figure 9a–f). By contrast, the overall statistical analyses showed significant effects of the light treatments (SD and day extension with R, FR or R:FR ratio 1) (Table S7a–c). In most cases, except for COL1 at 18 °C, the SD-exposed plants had the lowest transcript levels (Figure 9a–f). For FTL2, there was a significant overall effect of light treatment and a significant interaction between light treatment and temperature on the transcript levels (Table S7d; Figure 9g,h). At 18 °C, the FTL2 transcript level at day 7 under SD was higher than under the FR light and R:FR 1 ratio. At this temperature, the R light-exposed plants then had higher FTL2 transcript levels than both the FR-containing treatments, and similar transcript level to the SD-treated plants. At 24 °C, such a difference between the treatments was not clearly observed at day 7. At day 48, the FTL2 transcript level was substantially higher under SD than the other treatments, irrespective of temperature. Also, under the R light treatment the transcript levels were generally higher at 18 °C as compared to 24 °C both at day 7 and 48. Analyses of the correlation between the transcript level and bud set on one hand, and the transcript levels and shoot elongation on the other hand (Figure 10, Tables S8 and S9), showed significant correlations only between the FTL2 transcript level and bud set (R2 = 0.84) as well as shoot elongation (R2 = 0.79), but not the other genes.

4. Discussion

The light climate, particularly photoperiod, is well known to affect the growth–dormancy cycling in seedlings of forest trees. However, climatic regulation of coniferous tree growth has been little studied in terms of interactive effects between climatic parameters. Here we provide information about interactive effects of temperature and light quality under day extensions, as compared to SD, on growth and terminal, vegetative bud development as well as subsequent bud burst in young seedlings of Norway spruce.
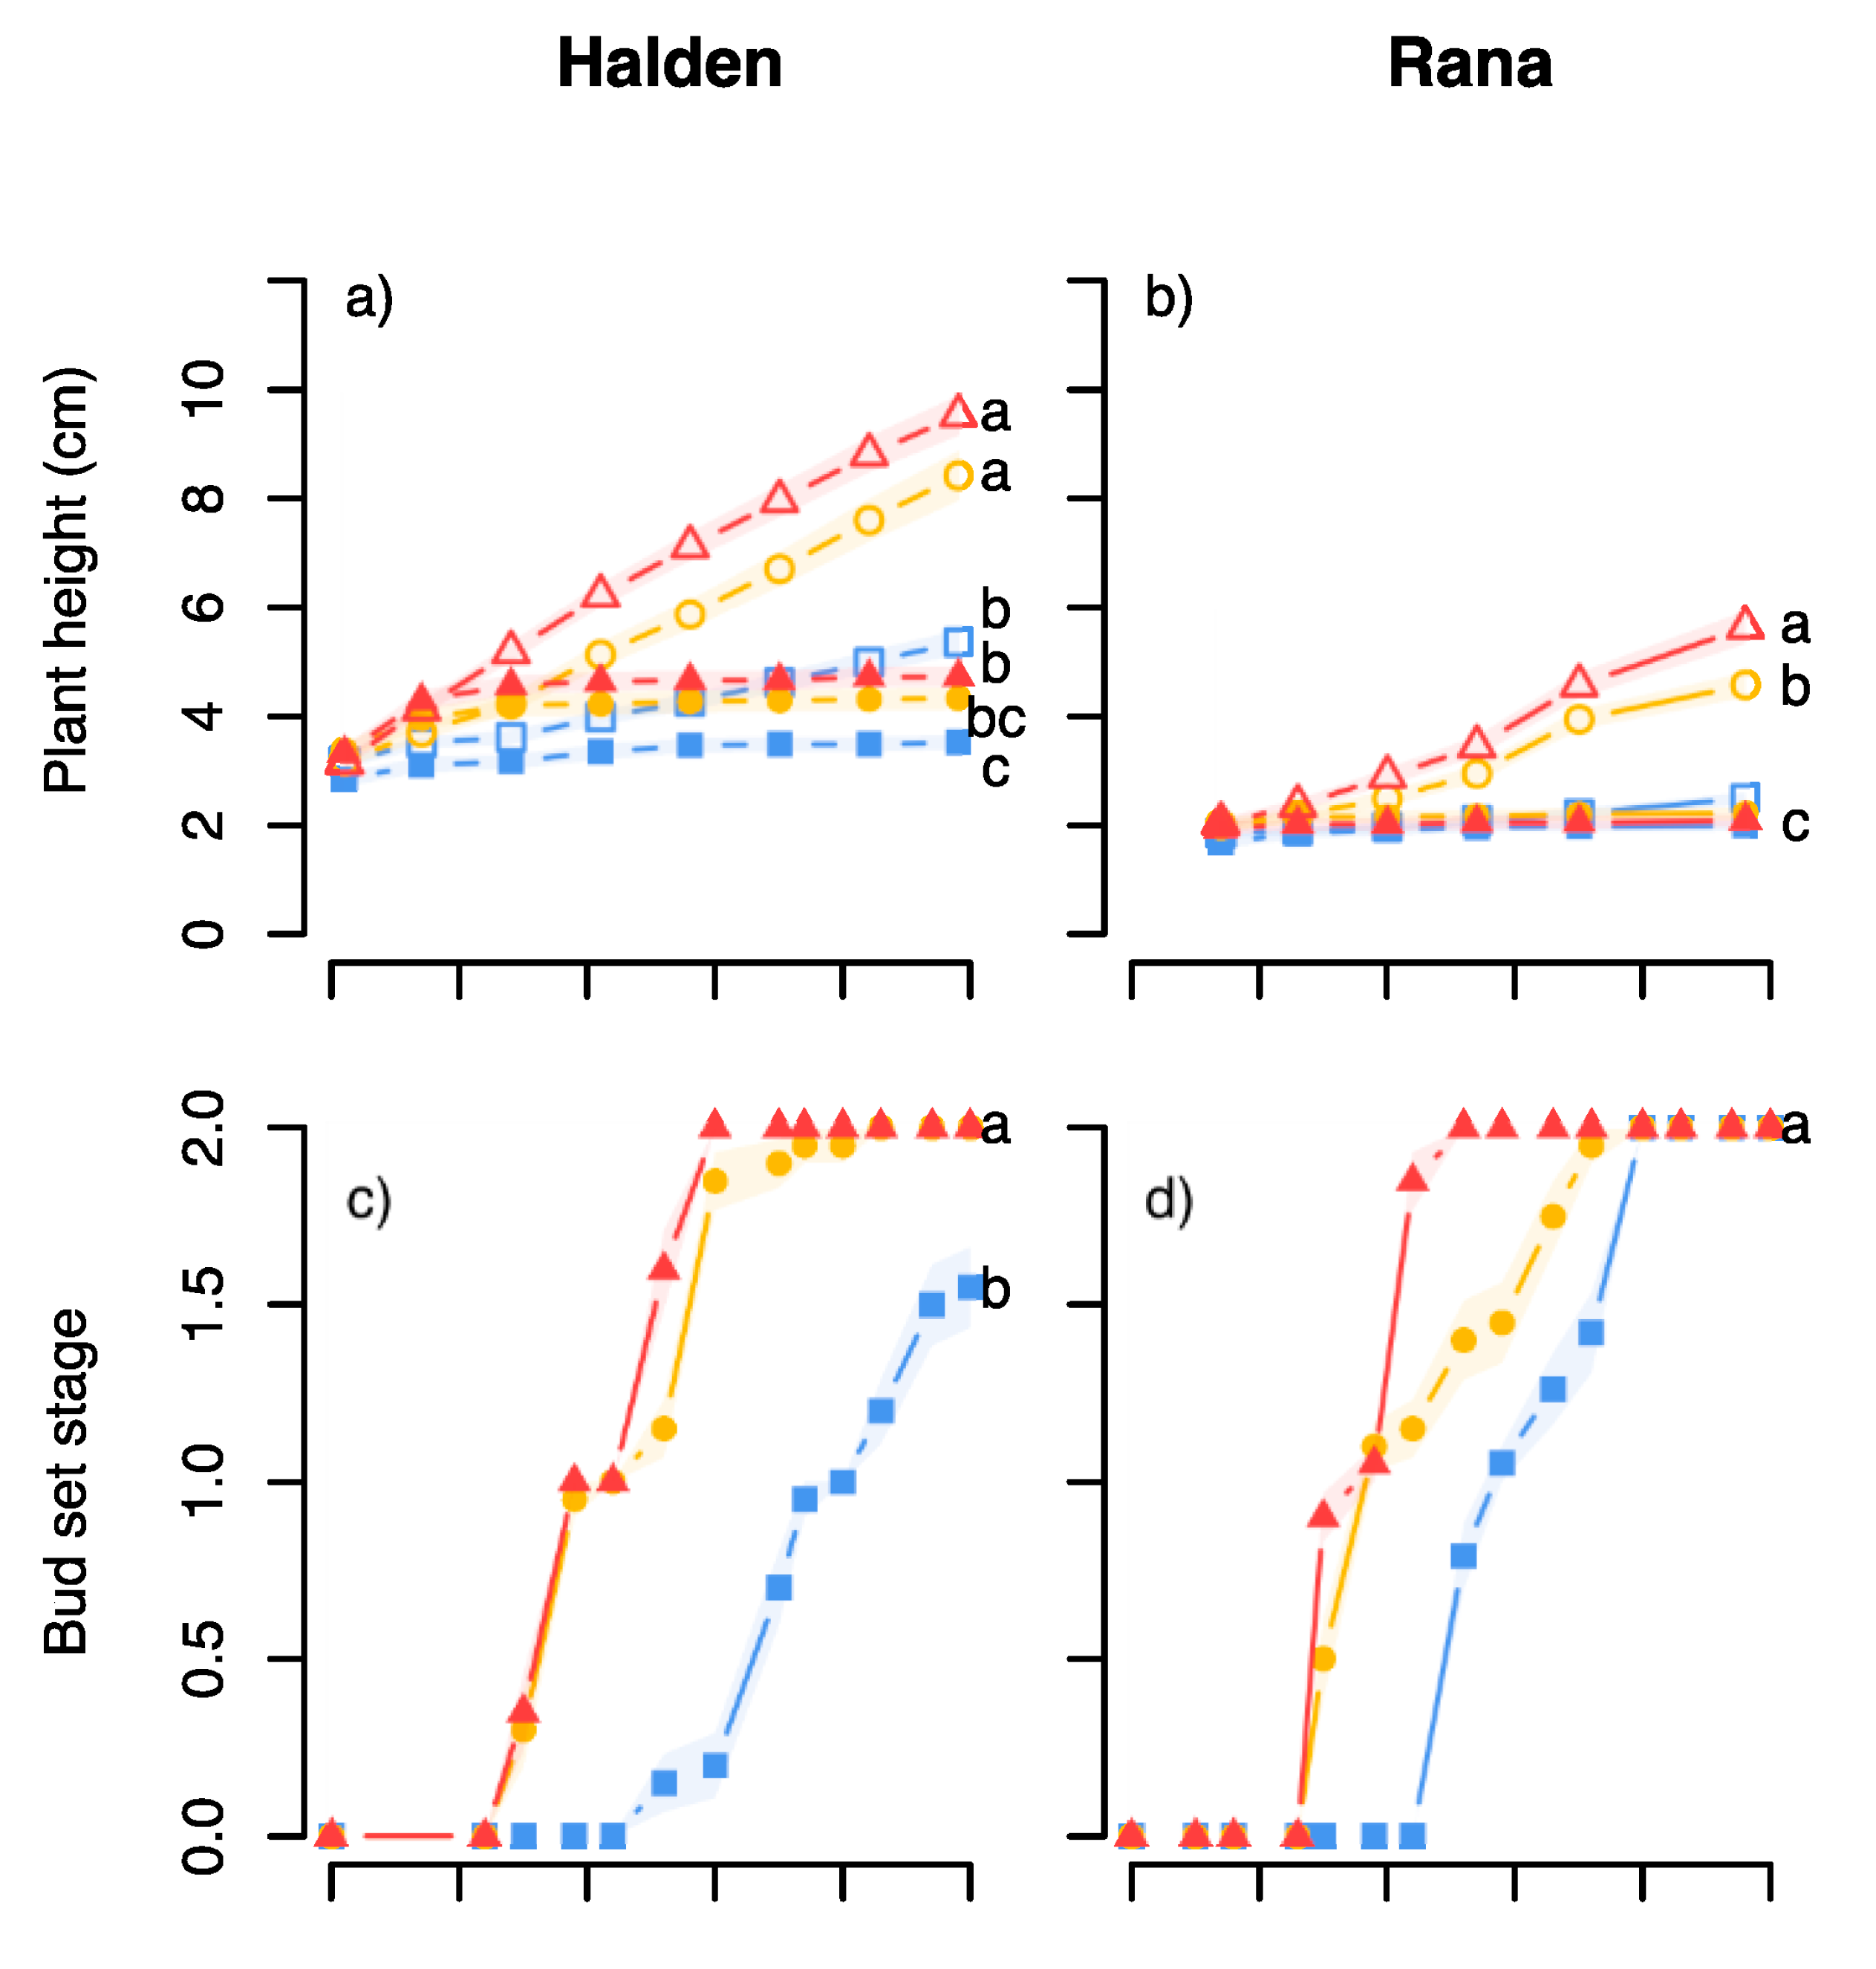
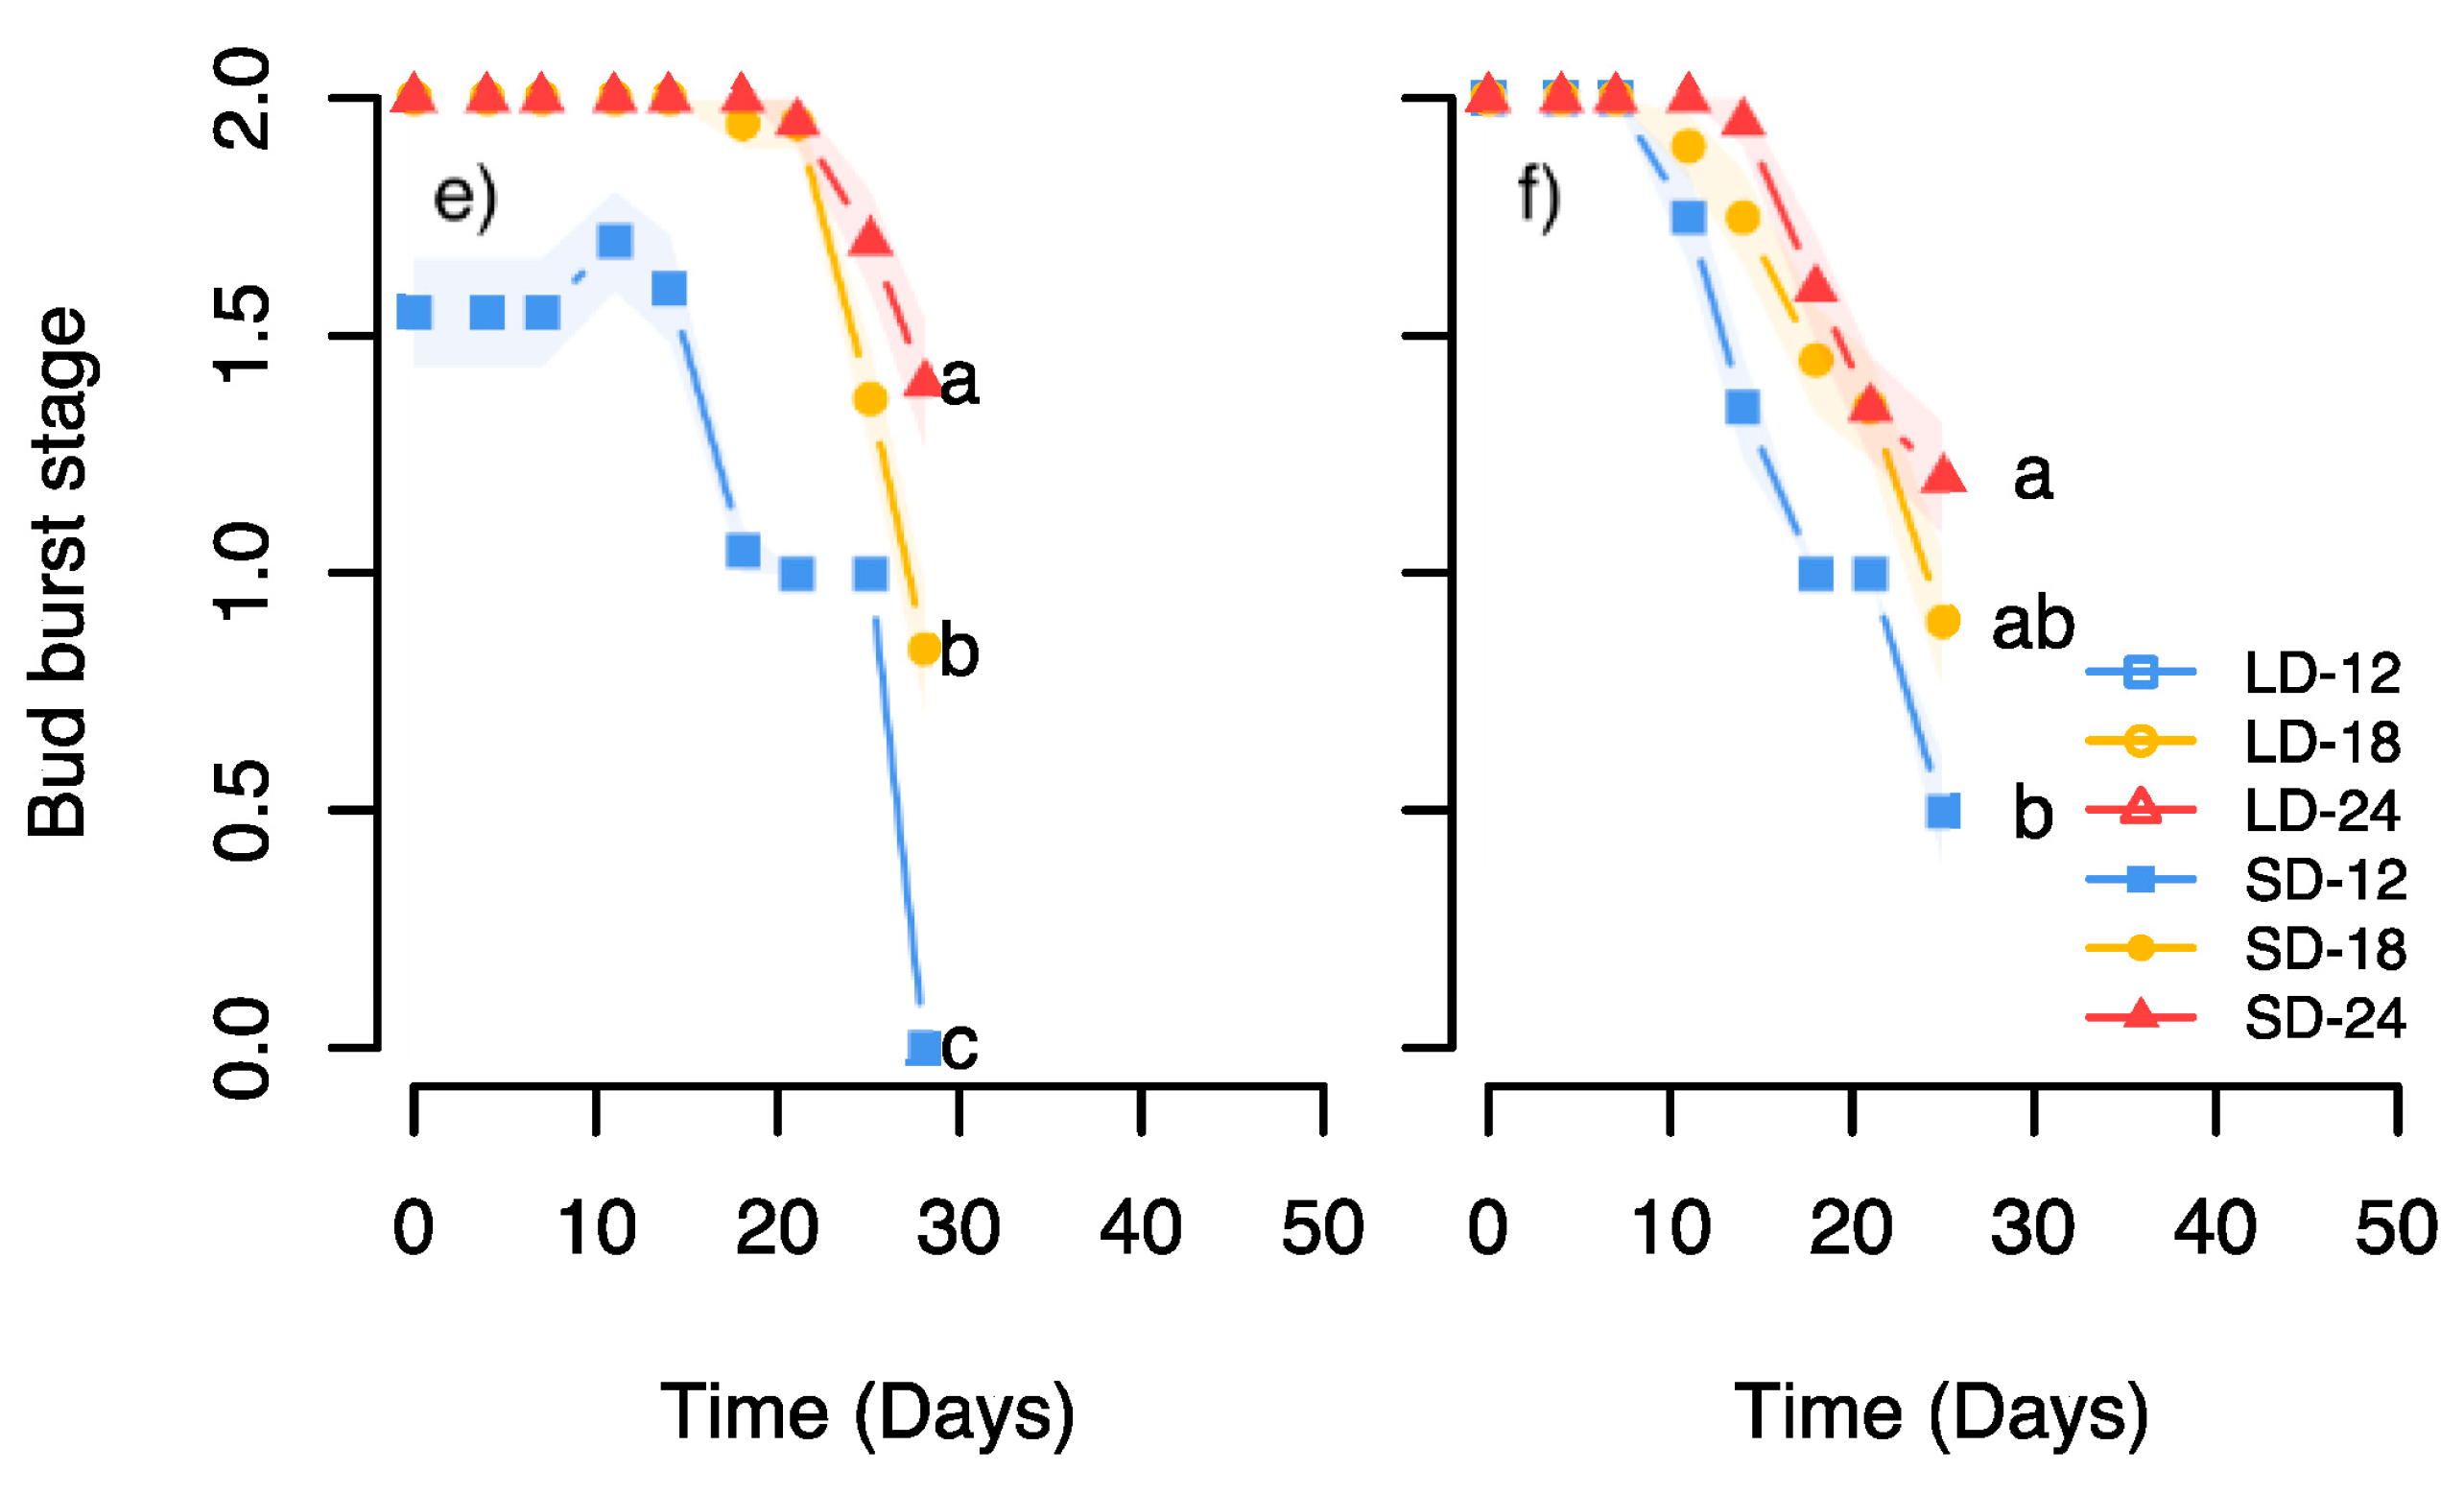
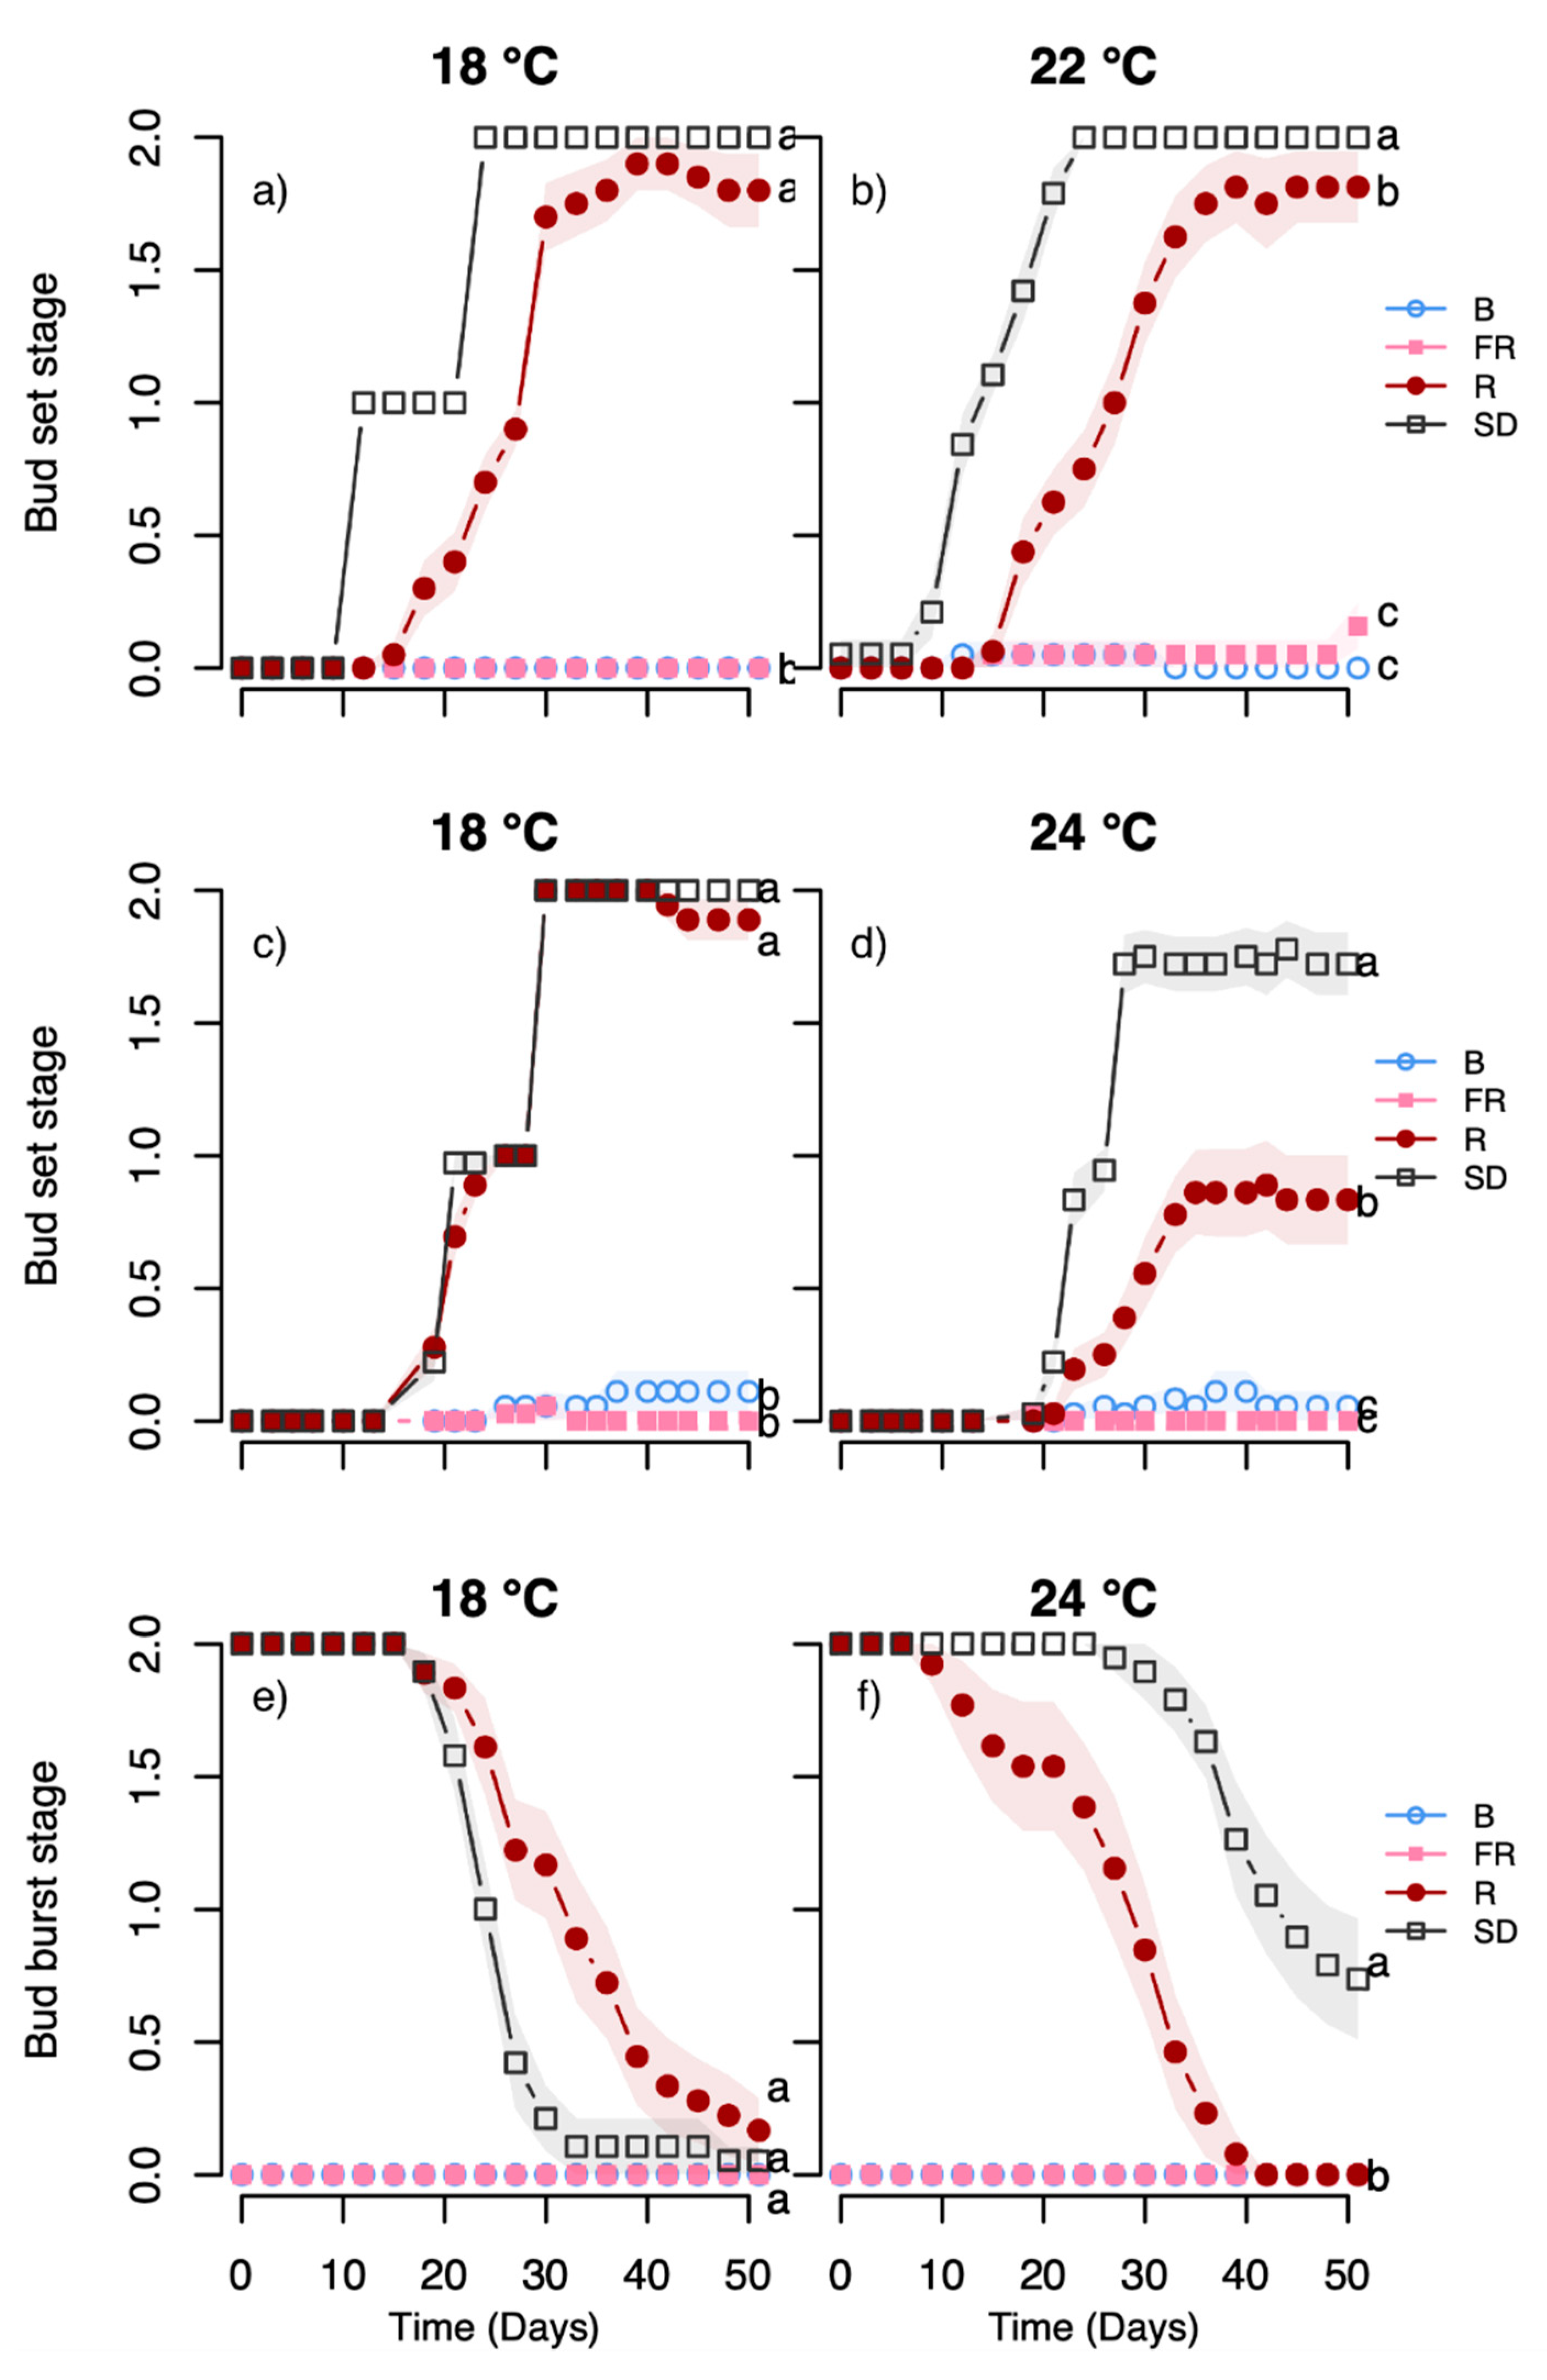
Our trials evaluating sensitivity to temperature under SD in the Halden and Rana provenances from 59 °N and 66 °N, respectively, revealed that these provenances had different responsiveness to temperature for bud phenology and height growth. Compared to the northern provenance, the more southern one appeared more sensitive to temperature, both in terms of stronger height growth and the duration of terminal bud development (Figure 2a–d). The more rapid bud development and less growth in the northern provenance at all temperatures, even under LD of a 24 h photoperiod, may reflect that “Rana” as one of the world’s northernmost Norway spruce provenances, shows adaptation to the short, usually cool growing season at high northern latitudes by investing more resources to survival rather than growth. More rapid bud set in northern than southern provenances of Norway spruce is consistent with previous studies under controlled conditions, although it could be noted that most such studies did generally not report duration of bud development (bud set and bud burst stages), but percentage of plants with buds only [8,10,14,25].
Similar to previous studies of Norway spruce and white spruce seedlings under controlled conditions [21,25,26], growth cessation and bud development under SD were generally more rapid at higher compared to lower temperature (Figure 2a–d). The slow bud development in plants exposed to SD at 12 °C is likely to be due to a slow metabolic rate at such low temperature. This is supported by temperature having a similar effect on the first appearance of terminal buds as well as the further development towards mature buds with brown, well-developed bud scales. Furthermore, the Rana plants tended to have a more rapid subsequent bud burst, while both provenances broke buds faster after being exposed to the lowest temperature during SD (Figure 2e,f). Taken together, these responses demonstrate that the depth of dormancy not only depends on the specific temperature regime under bud set but also the latitudinal origin, which is similar to the situation reported in [23,25].
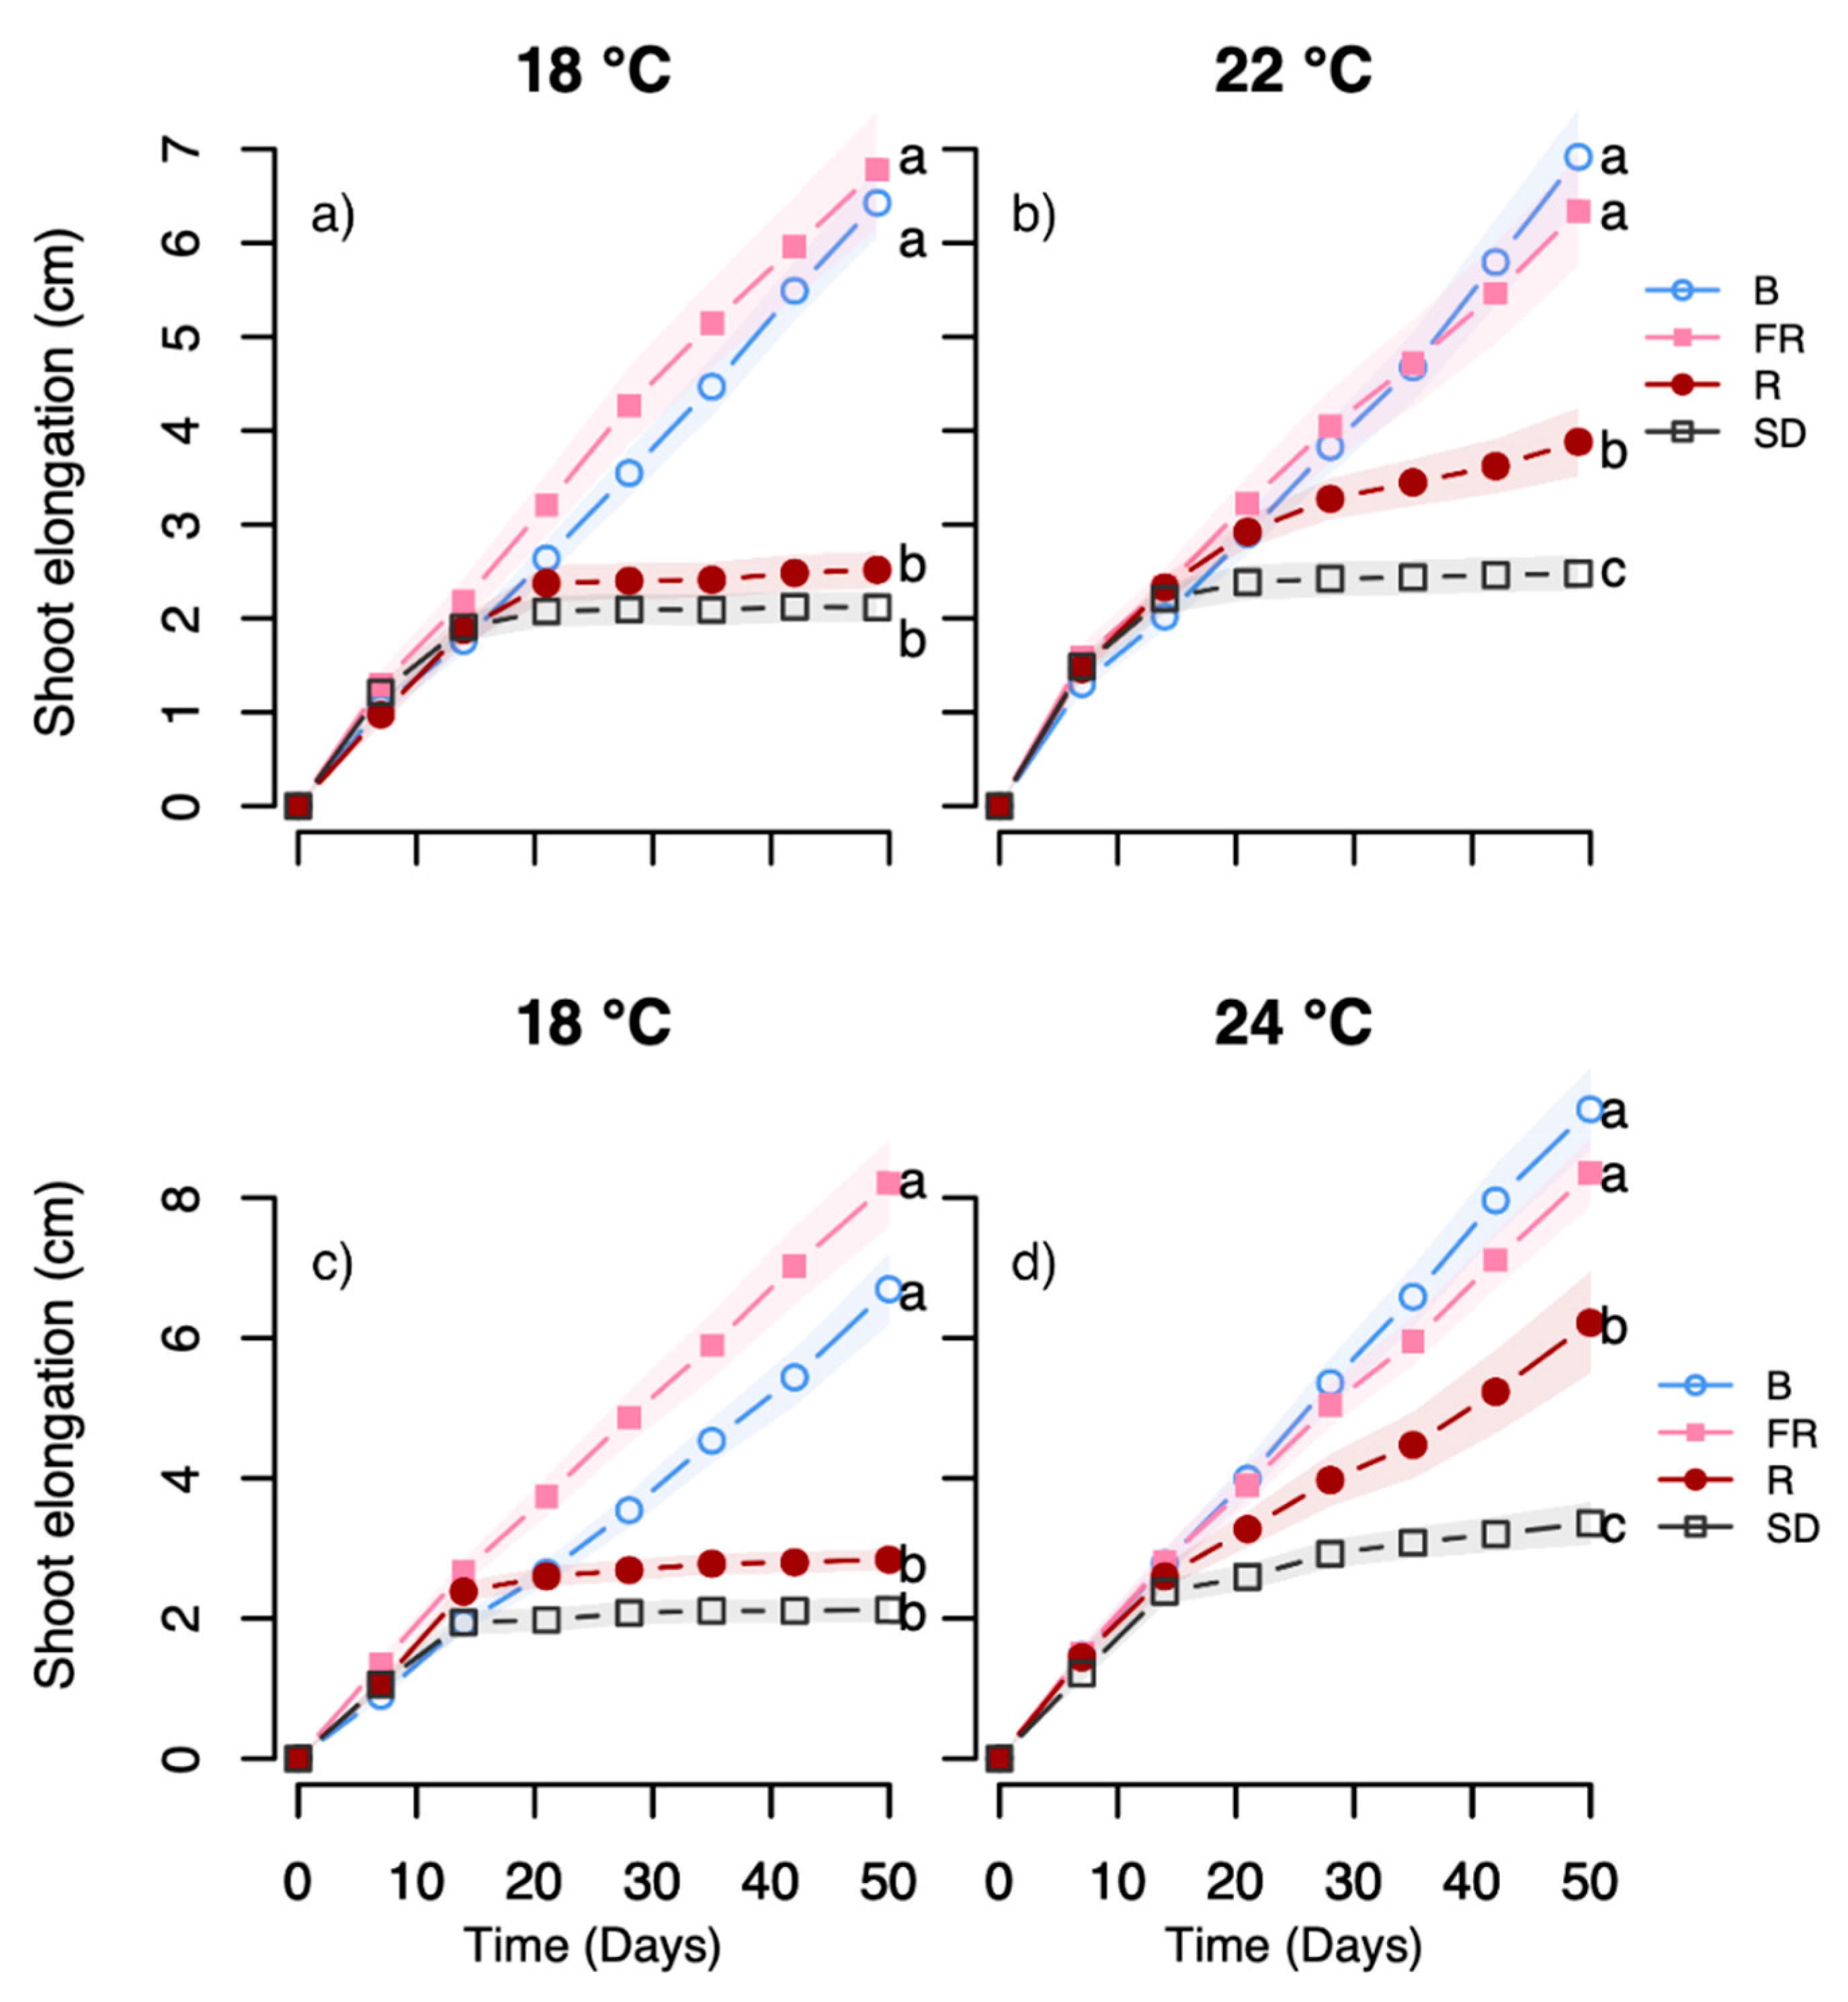
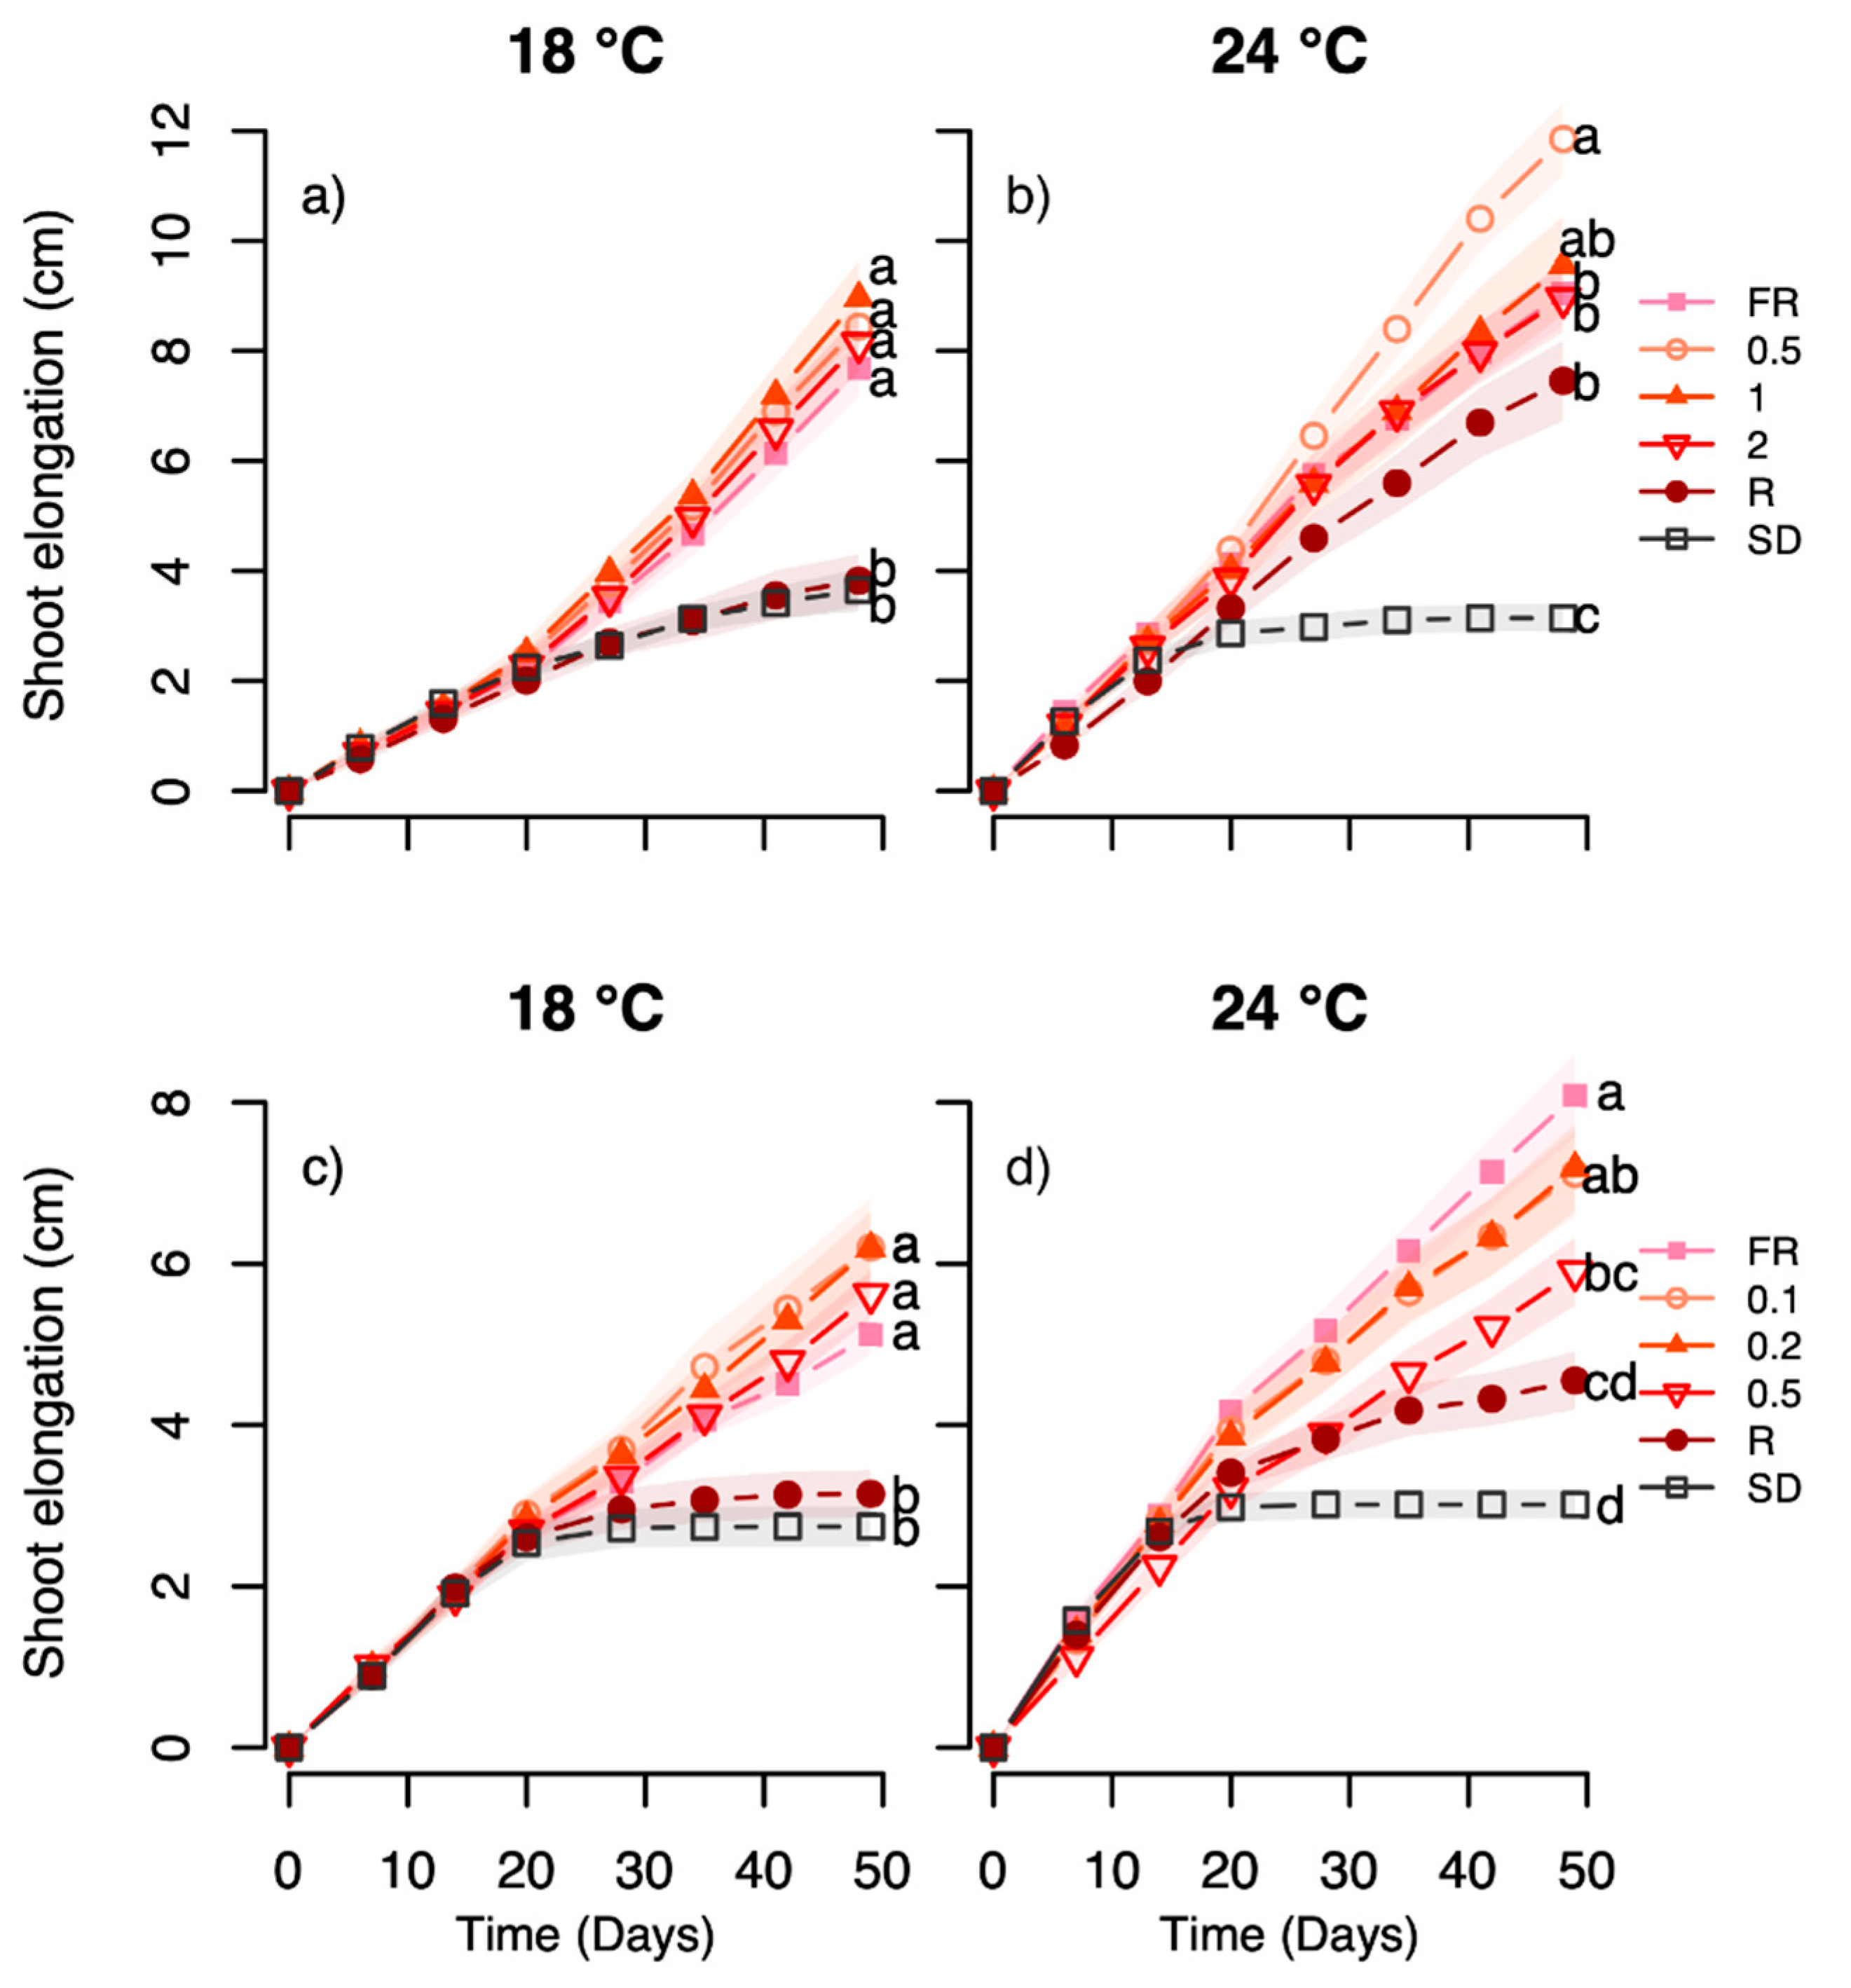
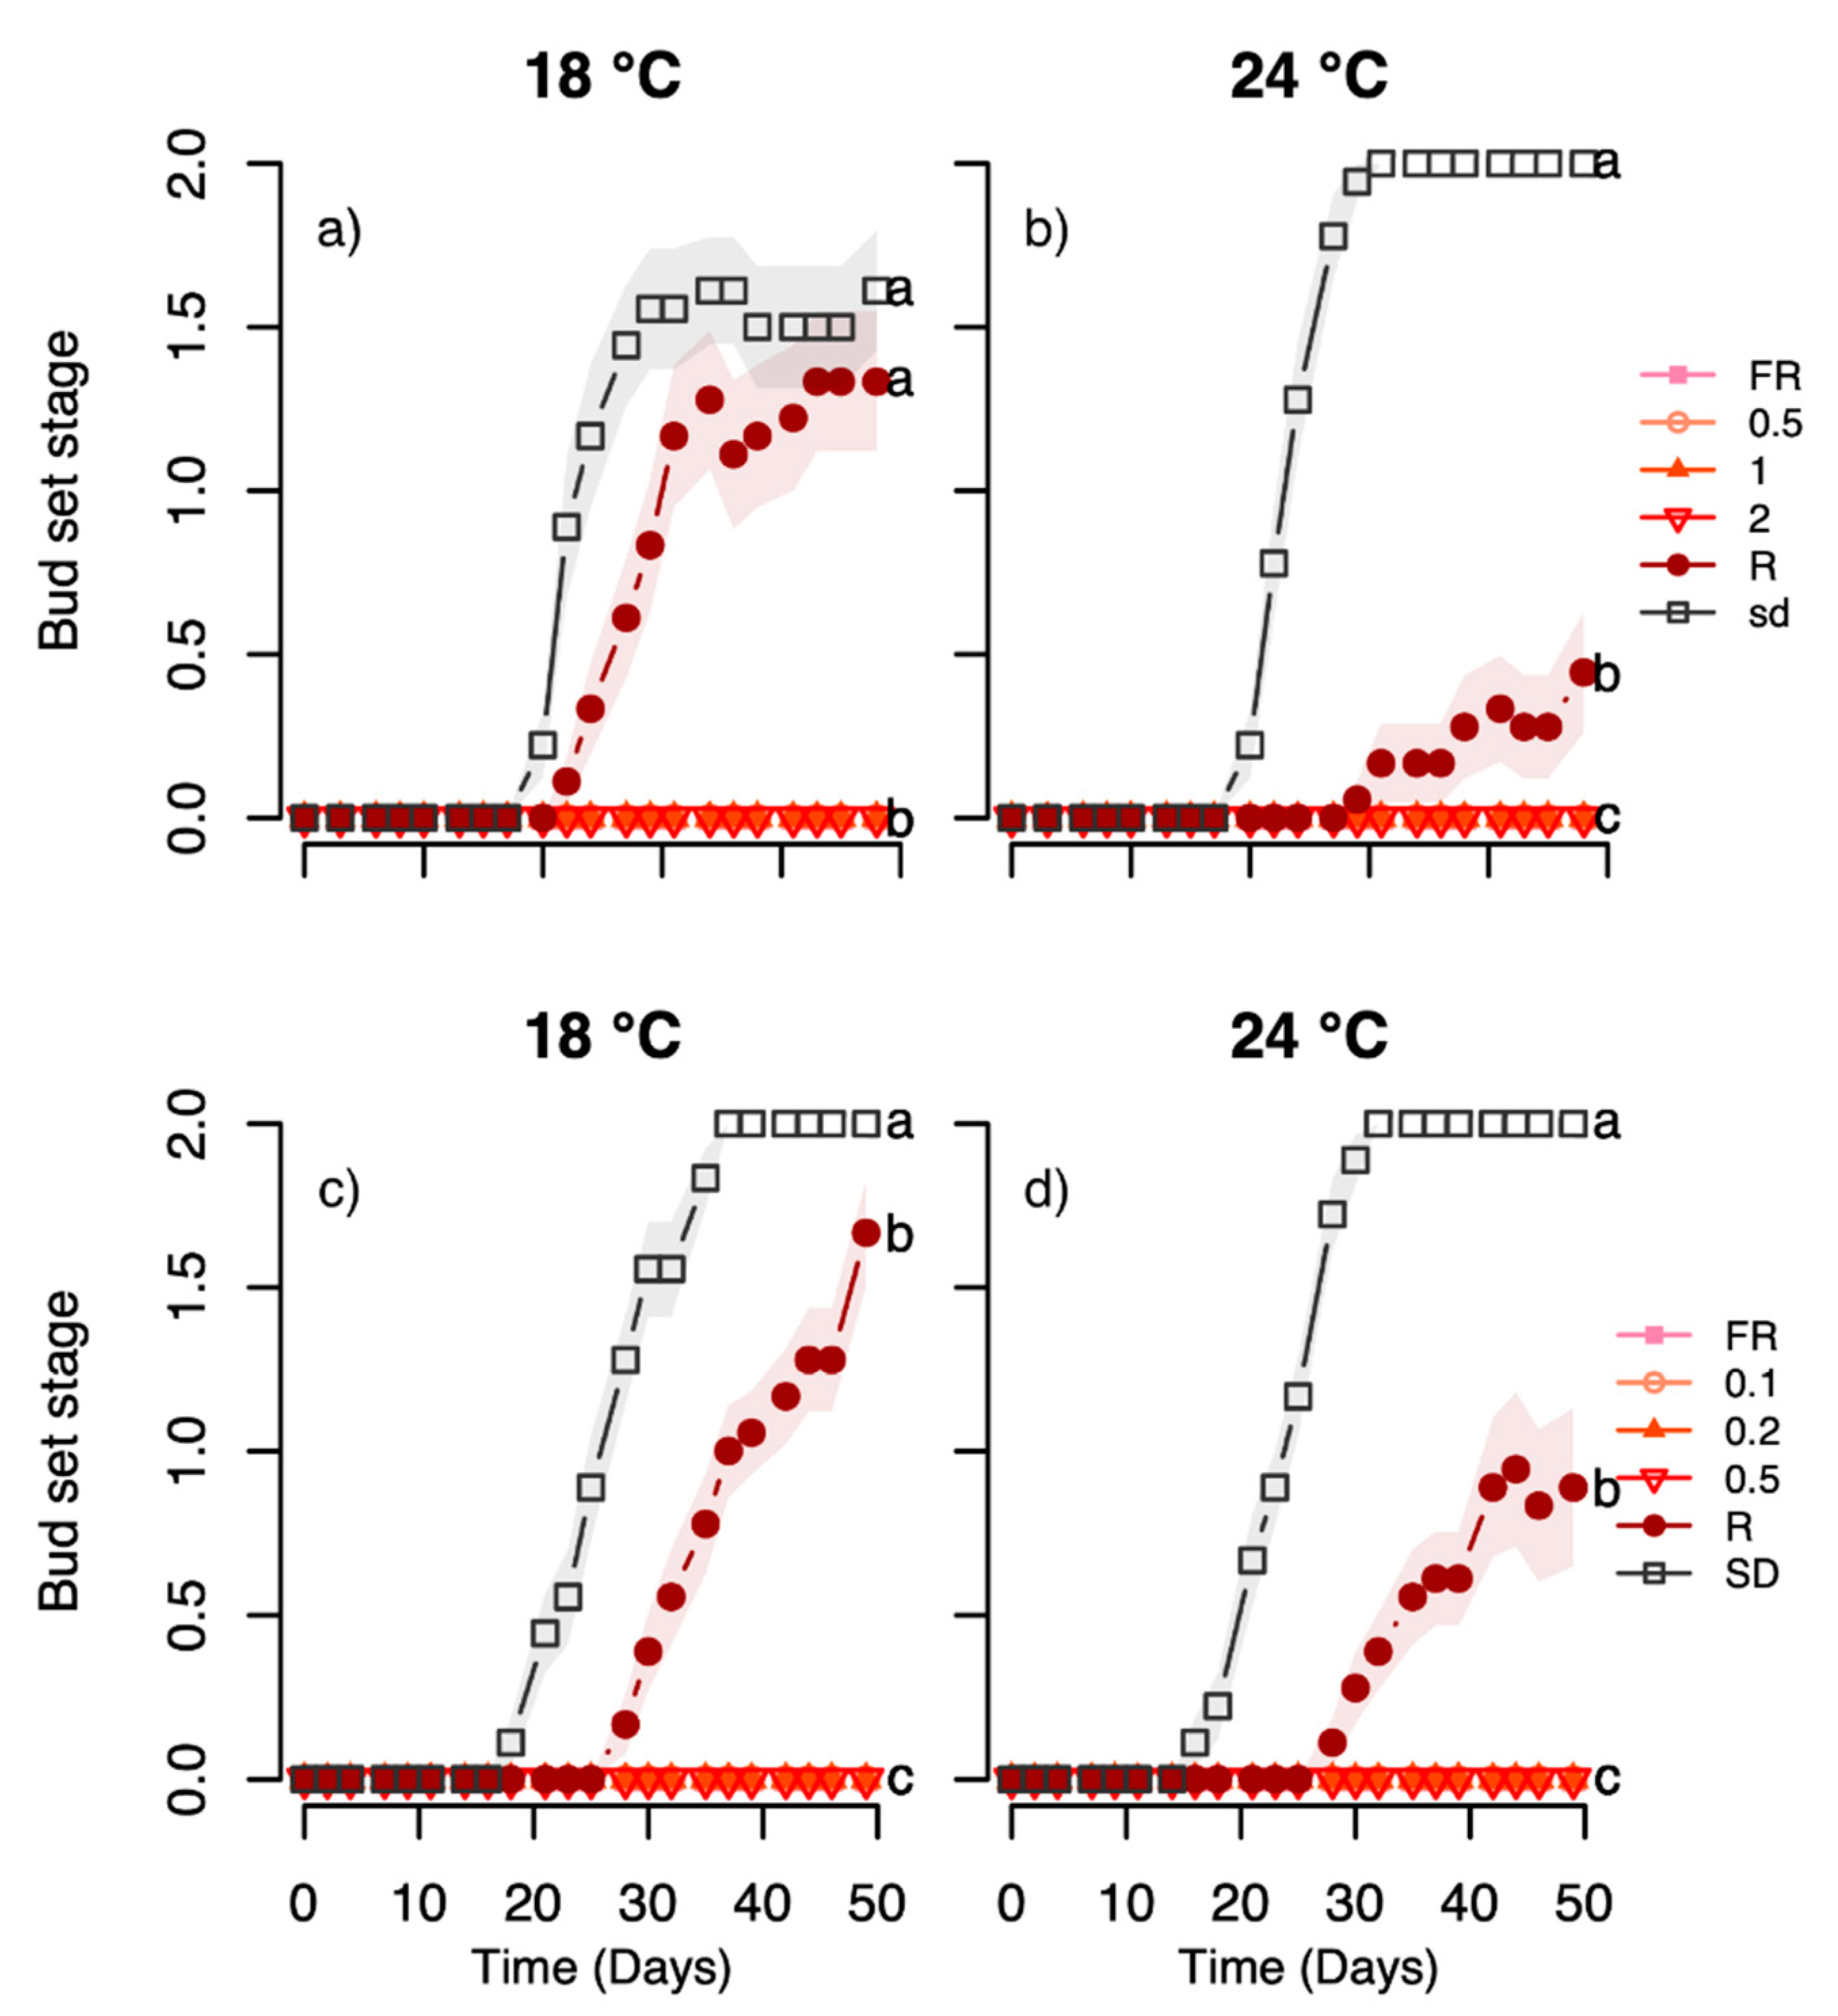
The light-quality experiments employing day extensions with narrow bandwidth LEDs indicate an interplay between temperature and light quality, particularly with respect to effect of R light, as studied in the Halden provenance. The growth and terminal bud development in response to such an R light treatment exhibited strong temperature-dependence, with substantially increased growth and delayed bud set at 24 °C but not 18 °C, as compared to under SD (Figure 3, Figure 4, Figure 5 and Figure 6). For the Halden provenance, which has a critical photoperiod for growth between 16 and 18 h [41], SD of 12 h clearly acts as a strong signal inducing rapid bud set in the vast majority of the plants at 18 °C and 22/24 °C (Figure 3, Figure 4, Figure 5 and Figure 6). In this provenance, bud set was also previously shown to be delayed by R light day extensions at 0.6–18 µmol m−2 s−1 (0.1–3.3 W m−2)) at 18 °C as compared to SD [10,11], while our data here for R light at 38 µmol m−2 s−1 (7 W m−2) show that the response is modified at 24 °C compared with 18 °C. Namely, the combination of 24 °C and R light resulted in substantially delayed bud development or even prevention of bud set in large portions of the plants, i.e., 59%, 73% and 56% in experiments 4, 5 and 6, respectively. Thus, at an elevated temperature such as 24 °C, the day extension with R light apparently acts as a far weaker bud-inducing signal than SD alone, or a somewhat weaker growth-sustaining signal than a LD treatment of a wider wavelength area. The interactive effect of temperature and day extension with R light on bud set in experiment 3–6 can also be hypothesised to be due to possible signalling associated with the peak of the growing season, considering the higher proportion of R light during late summer (July–August) in field conditions [42]. However, it should also be noted that responses under controlled conditions employing day-extension treatments may differ from in the field [43].
Furthermore, the subsequent advancing effect of bud burst of the R light treatment at 24 °C during bud set compared to SD, but not at 18 °C, and the slightly advanced bud burst after the R light at 24 °C relative to 18 °C, suggest less deep dormancy in buds developed under this light quality combined with elevated temperature (Figure 4e,f). This is opposite to the situation under SD in this and previous studies of Norway spruce seedlings where the most rapid bud burst was observed after lower compared to higher temperature under bud development (Figure 2e,f and Figure 4e,f) [23,25]. Differences in depth of dormancy, in addition to cold hardiness, may have important practical implications for seedling production in nurseries since a shallow dormancy may increase the risk of freezing damage due to early spring bud break or fluctuating temperatures during winter [44].
As expected, based on previous studies [8,10,11,14], the FR light day extension sustained shoot elongation and prevented terminal, vegetative bud development. Here we show that this occurred independently of temperature (Figure 3, Figure 4, Figure 5 and Figure 6). Previously, day extension with a combination of R and FR light (R:FR ratio 1) was found to be more efficient in preventing bud set than FR light only [10]. However, in the current study, the FR light and all the tested R:FR ratios (0.1–2) sustained shoot elongation, often with increased growth at 24 °C compared to 18 °C, and no winter bud formation occurred (Figure 3, Figure 4, Figure 5 and Figure 6). The reason for the difference between this and the previous study remains elusive, but using different lamp types providing different spectral distribution and irradiances during the main light phase in [10] compared to this study may have influenced.
The sustained growth and prevention of bud set at all temperatures under day extension with B light at 27 µmol m−2 s−1 (7 W m−2) (Figure 3 and Figure 4), in contrast to the previously tested 6 and 13 µmol m−2 s−1 (1.5 and 3.3 W m−2) [10,11], indicate an irradiance-dependence for such a B light treatment to sustain growth. It may be hypothesised that the B light day extension provided here may increase the photosynthetic capacity and the leaf formation rate [45], and thus trigger continued growth instead of terminal bud development. In Norway spruce seedlings, increased proportion of B light during the main light period (30% versus 5%) was recently shown to improve growth and result in thicker stems, more branches and higher dry matter content in needles and roots [46]. Such responses are consistent with that an increased proportion of B light under a relatively low irradiance may induce anatomical and morphological characteristics normally associated with higher irradiances, as shown in Rosa x hybrida [45]. Possibly the day extension with B light employed in the current study may have a similar effect. However, the responses to B light may differ between woody species. In Subalpine fir seedlings, increased B light proportion during the day and a day extension at 27 µmol m−2 s−1 increased/promoted terminal bud development [15,46]. It could also be noted that B light was recently shown to promote bud burst in field-collected dormant branches of several deciduous tree species, implying a role of B light as an important environmental cue in phenological transitions [47].
In general, photoperiod is known to be sensed by the R:FR light-absorbing phytochromes in trees and possibly the B light-sensing cryptochromes, and these interact with the production of growth-regulating and growth-inhibiting plant hormones [4,11,25,48] (and references therein). Information about the mechanistic interaction between such light receptors and a time-keeping clock mechanism underlying growth rhythms, as well as its output pathways, is limited for conifers. Nevertheless, the rhythmically expressed FTL2 gene is known to be involved in control of bud set [32]. Consistent with FTL2 being upregulated under bud-inducing conditions and its predicted role as a transcription factor regulating growth inhibition or/and promotion of bud set in conifers [11,30,31,32], the transcript level of 
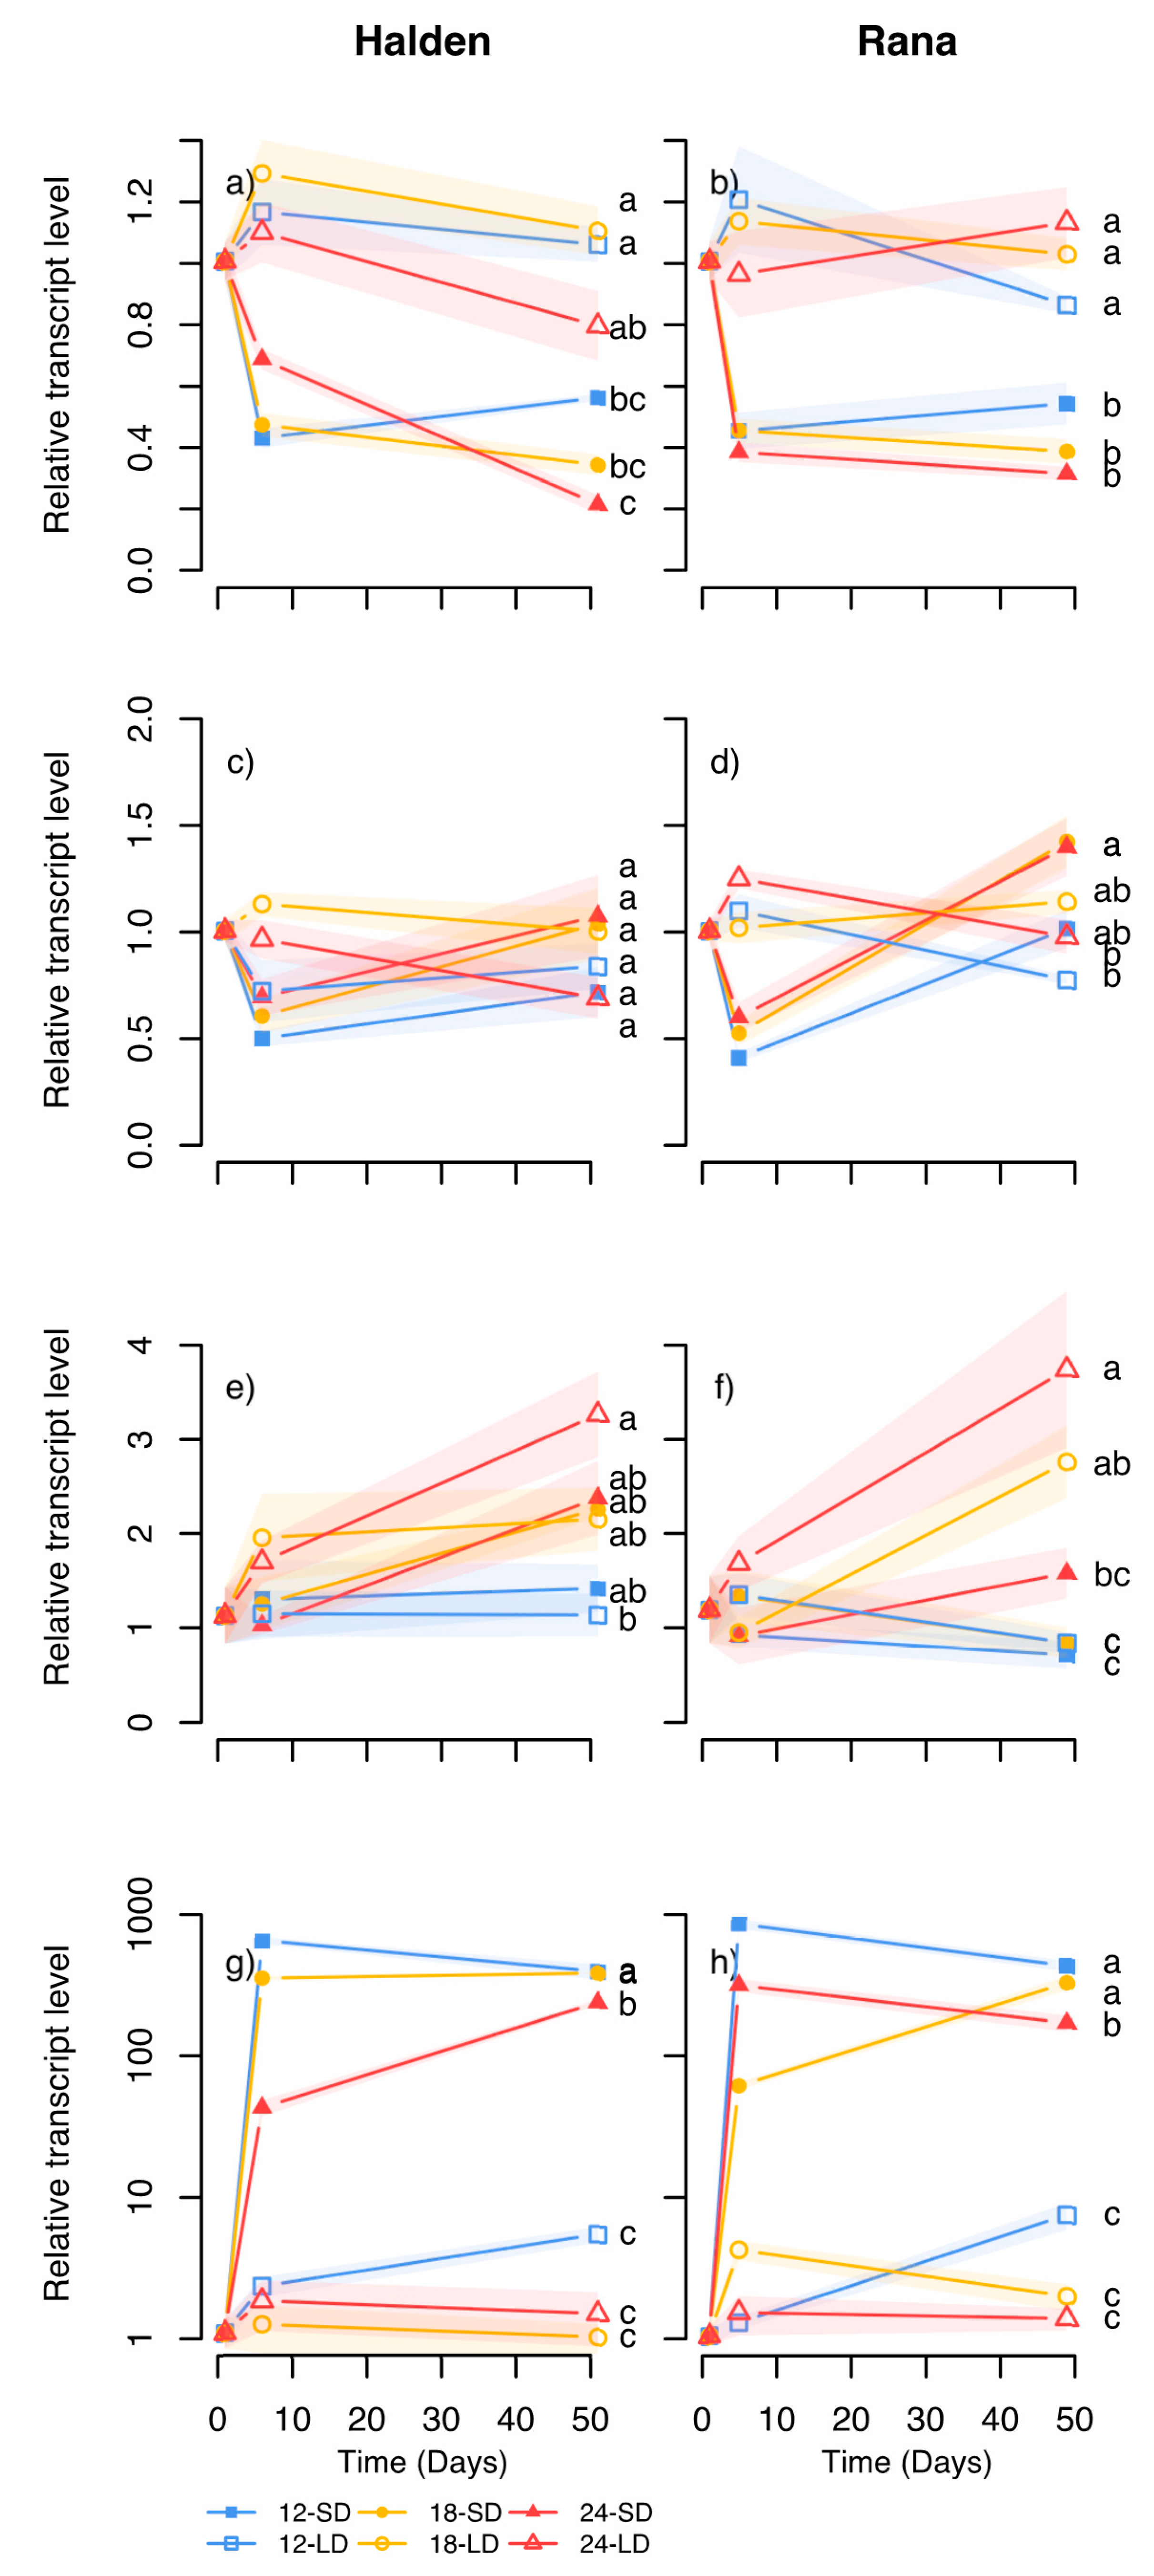
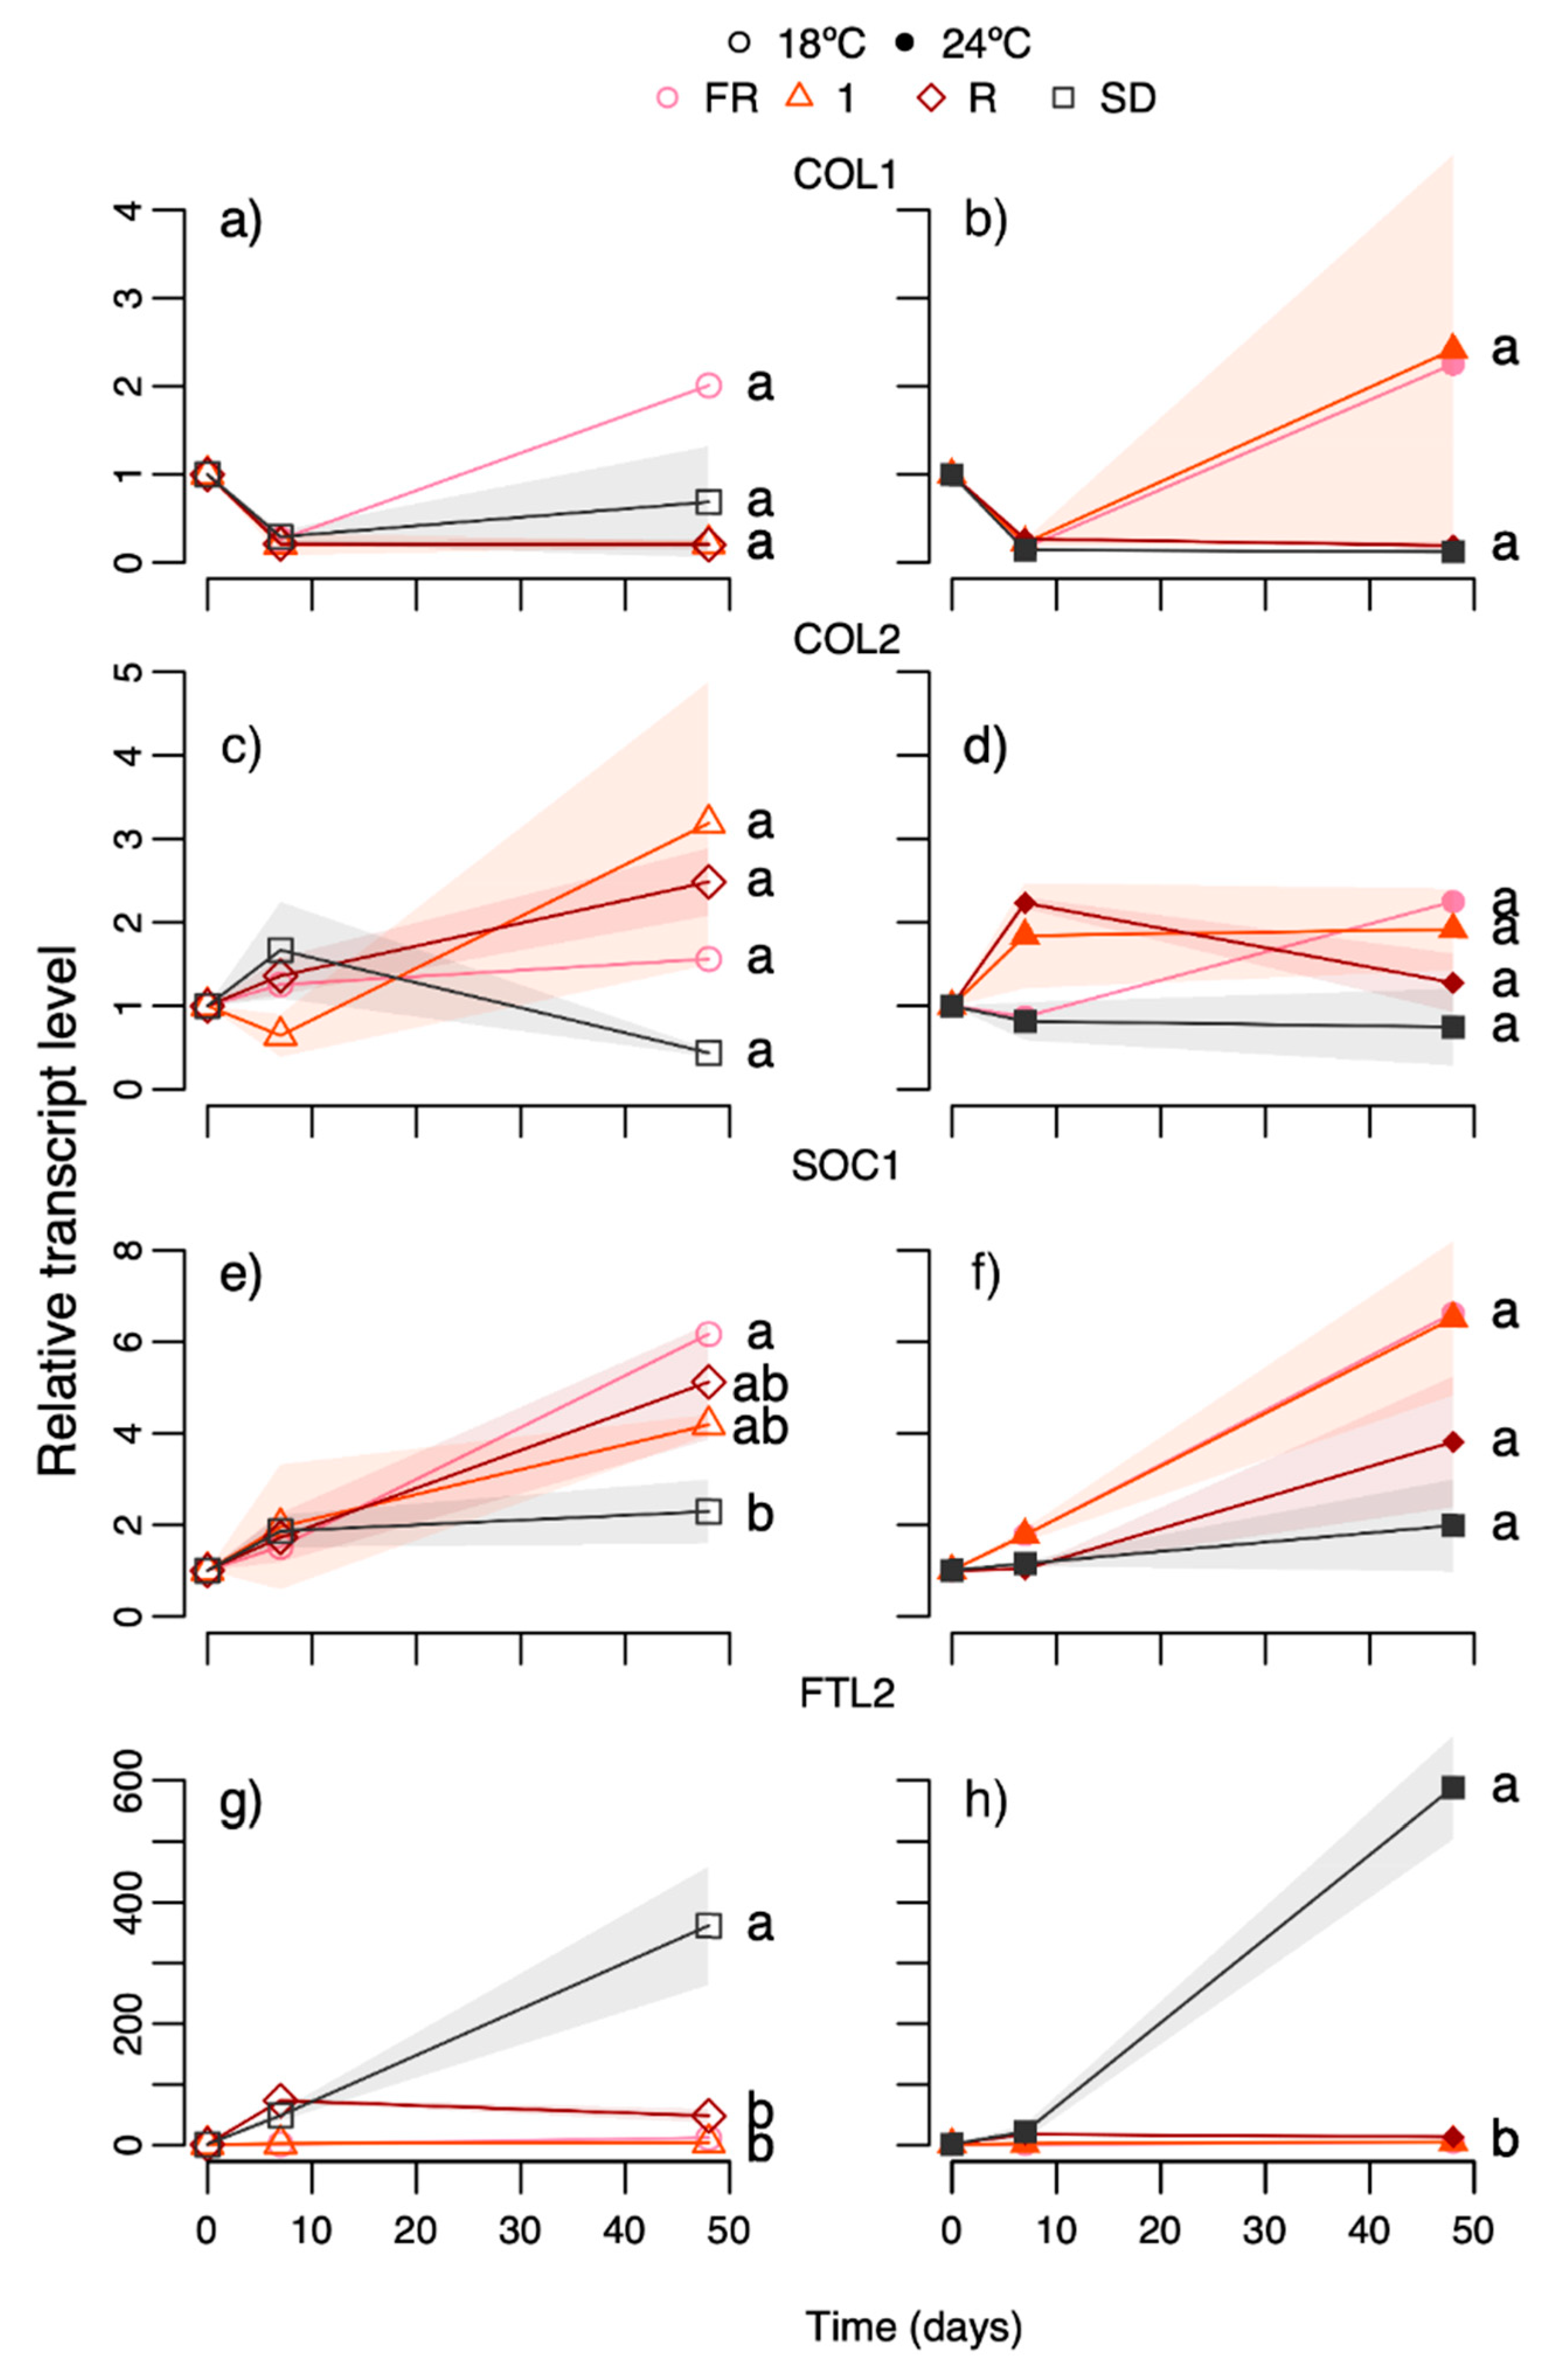
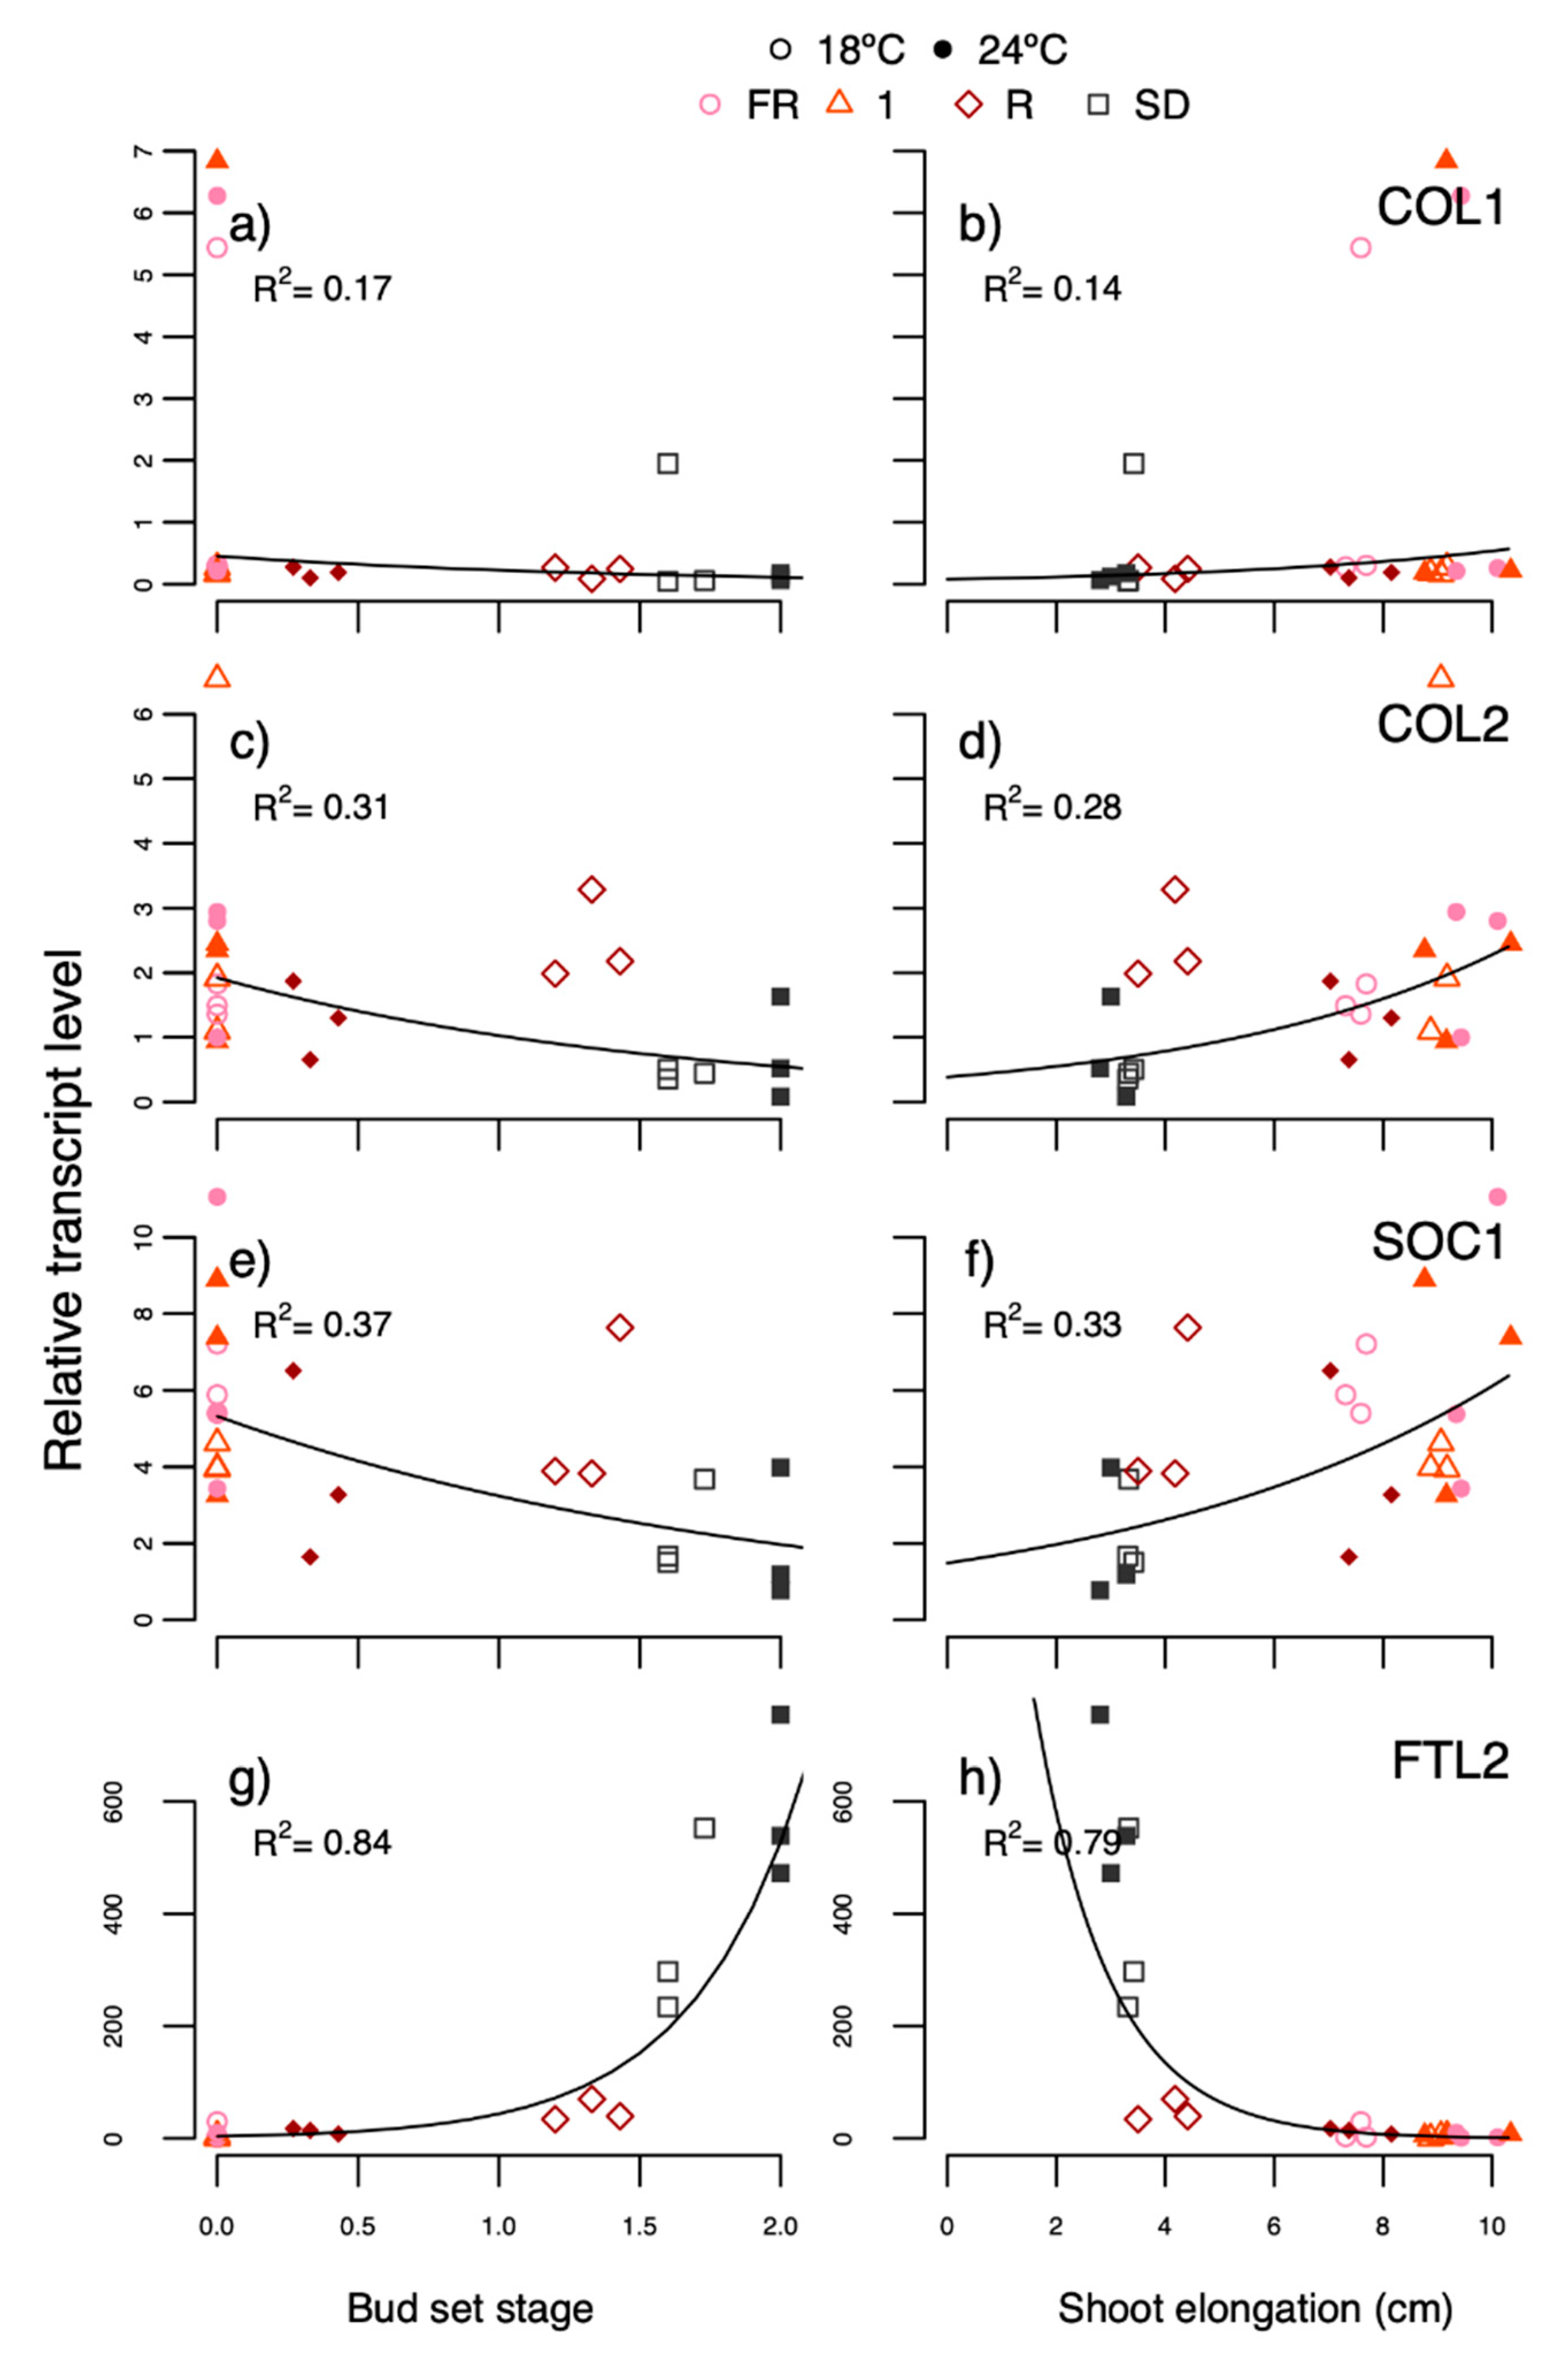
PaFTL2 was higher in the R light-treated plants at 18 °C (at least day 7) where bud set was far more advanced than at 24 °C but less than under SD. Overall, the 
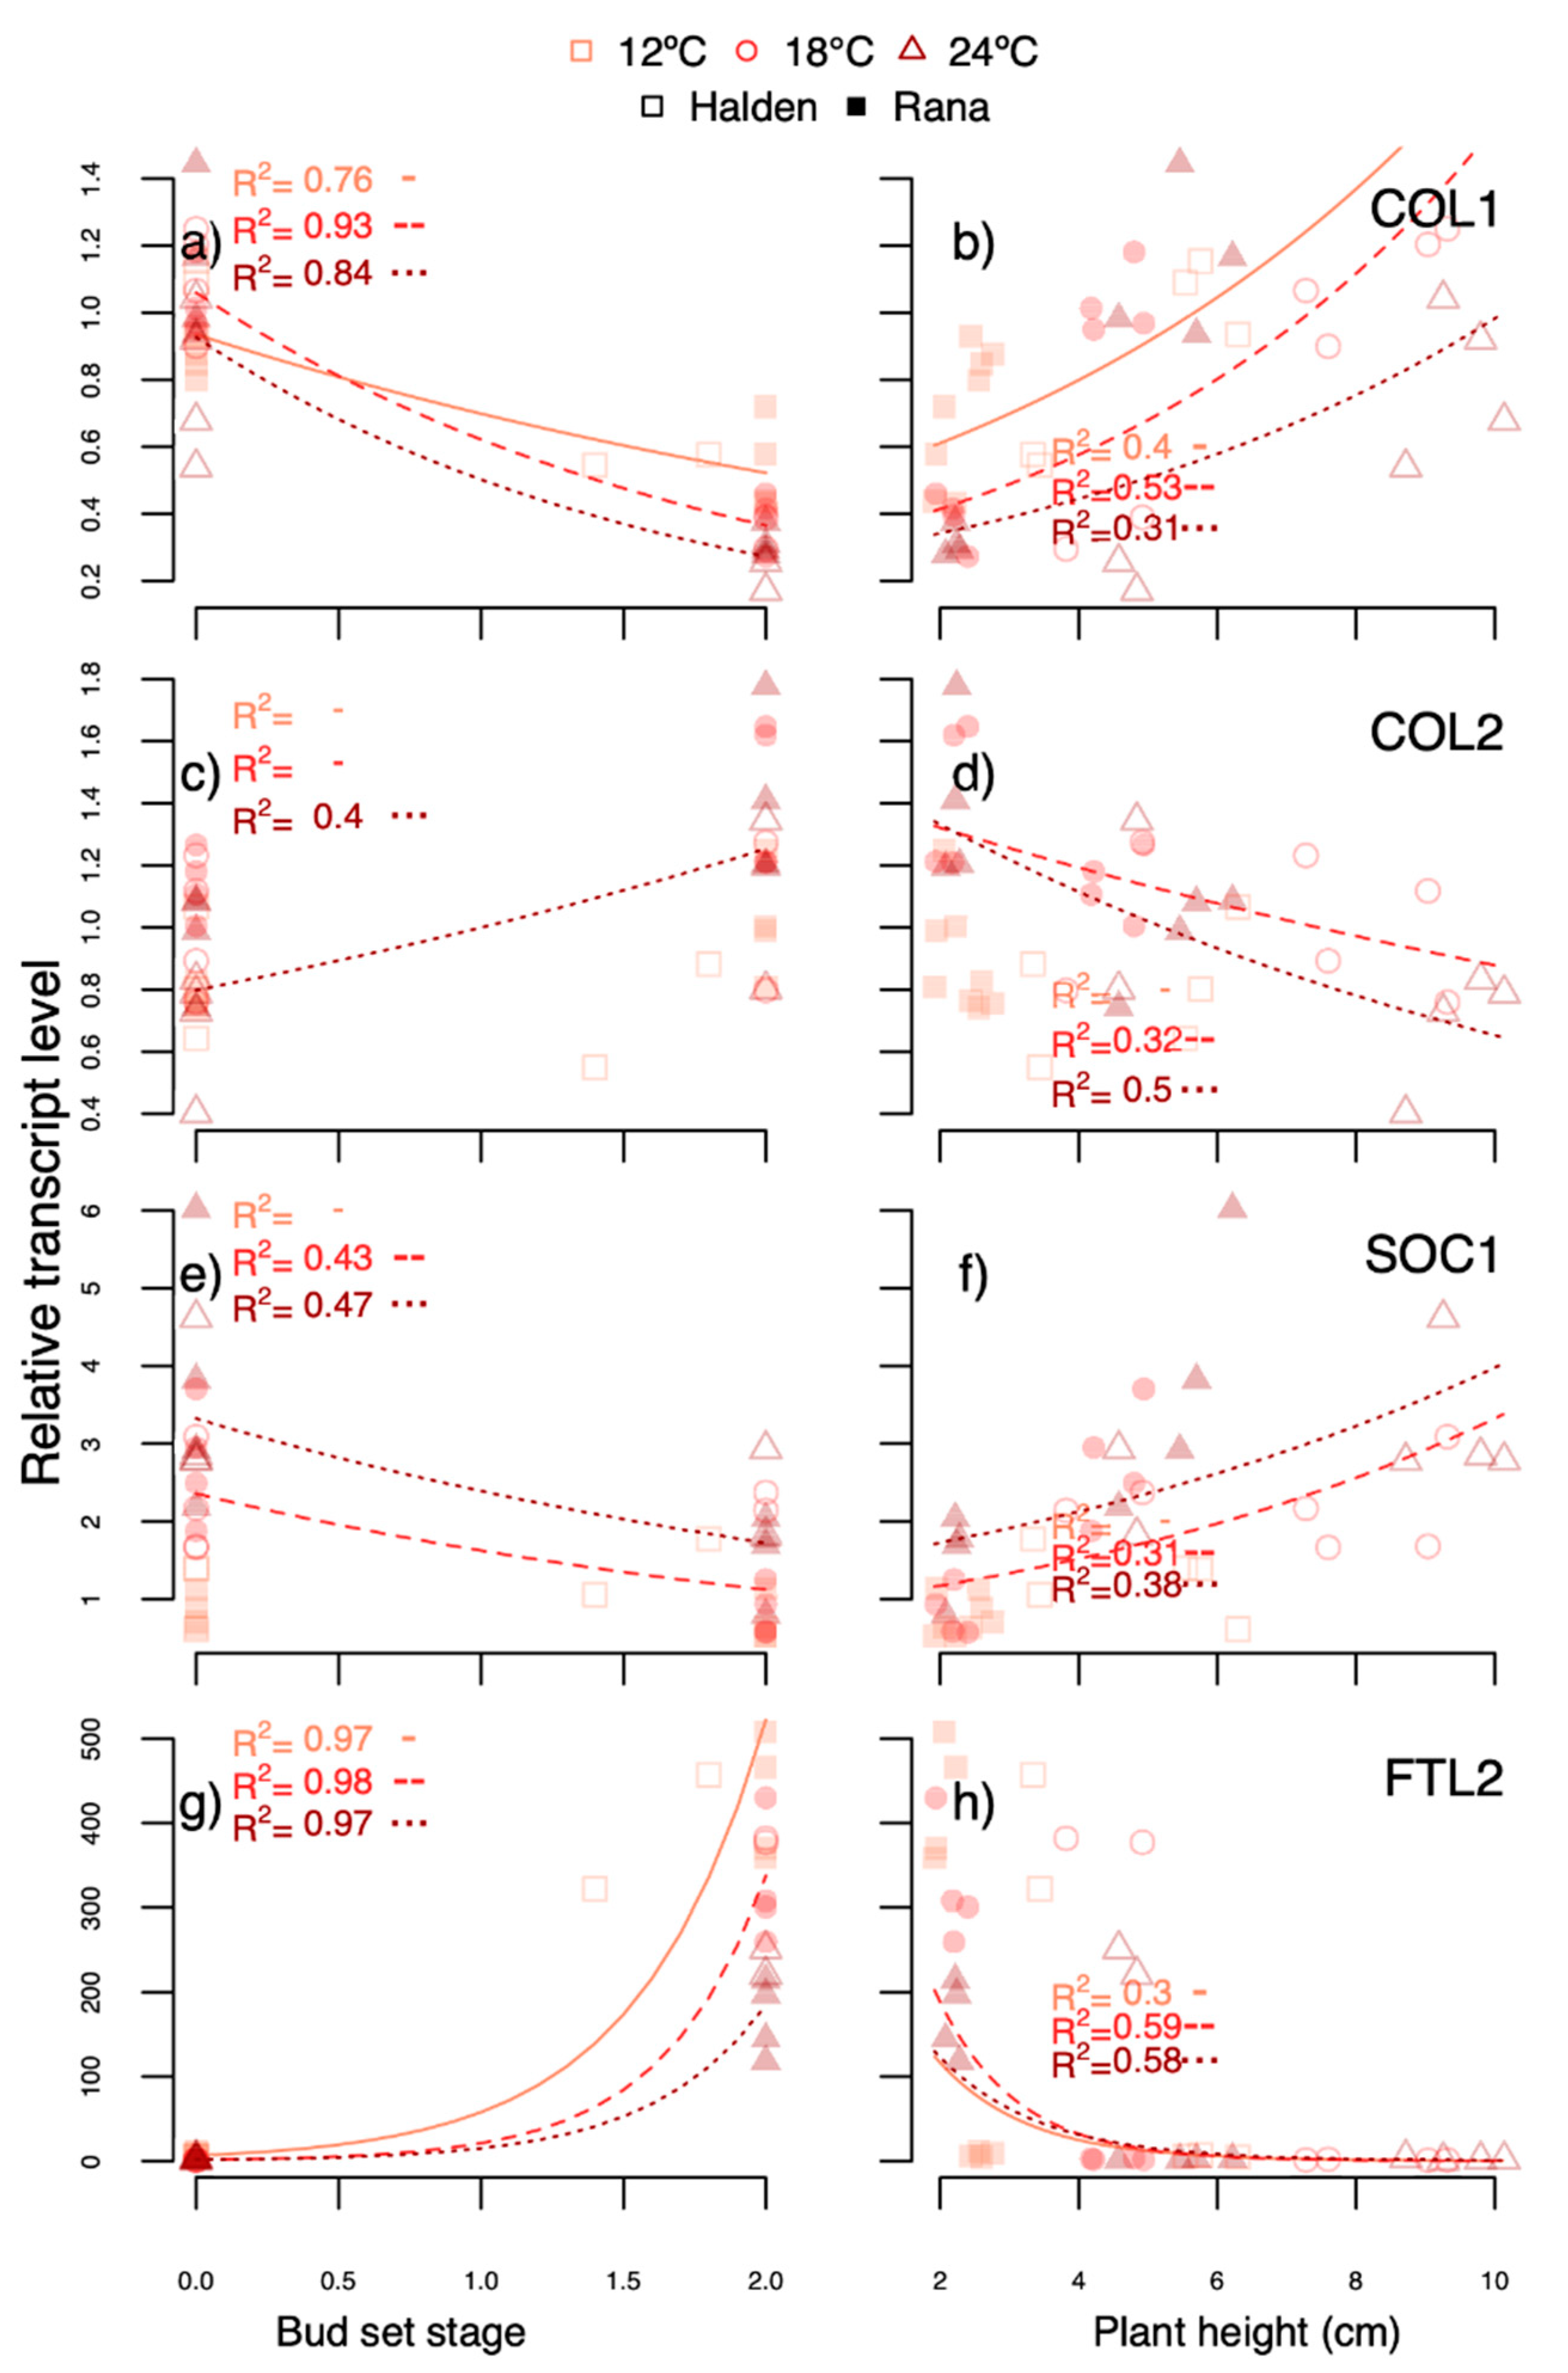
PaFTL2 transcript levels correlated well with bud development (Figure 8, Figure 9 and Figure 10; R2 0.84–0.98), and were far higher in SD-exposed plants than under R light (day 48, but not day 7, experiment 5) and growth-sustaining treatments (FR light, R:FR ratio 1 and LD; Figure 7g,h and Figure 9g,h). The transcript levels in shoot tips and apical needles of the B light exposed plants at 18 °C was similar with those under FR light, consistent with the sustained growth (data not shown; B light at 24 °C not analysed). Furthermore, 7 days after retransfer of the plants from SD at 12 °C, 18 °C or 24 °C to LD at 18 °C (experiment 1–2), the FTL2-transcript levels had decreased to levels close to those of LD in all cases in both provenances (data not shown). These responses are consistent with a role of FTL2 in phenological transitions [32].
Of the other genes studied, PaCOL1 showed high correlation between transcript levels and bud set in response to SD (Figure 8a). Also, consistent with previous studies [11,34], the levels of this as well as PaCOL2 and PaSOC1 tended to be lower under SD than the growth-sustaining treatments, but there was no clear-cut, directional effect of temperature. Although CO in Populus seedlings is involved in controlling growth rhythms [49] and both CO and COL-genes such as COL1 are determinants of sensitivity to photoperiod and SOC1 is a floral integrator in herbaceous plants [36,49], the function of COL1-2 and SOC1 in conifers such as Norway spruce remains to be elucidated by functional studies employing altered gene expression.

5. Conclusions

In conclusion, for growth and terminal bud development as well as subsequent bud burst, the results indicate an interplay between temperature and light parameters in terms of photoperiod and light quality used for day-extension treatments. The response to the R light day extension was clearly modified by temperature, with 24 °C preventing or substantially delaying terminal bud development as compared to 18 °C, but also advancing bud burst in the plants with buds, implying a shallow dormancy. FR light and different R:FR ratios sustained growth independently of the tested temperatures. This was also the case for the applied B light treatment of 27 µmol m−2 s−1, indicating an irradiance-dependent effect since lower irradiances solely delayed bud set in previous studies [10,11]. These growth-sustaining treatments generally induced more growth with warmer temperature. Moreover, the effects of the light treatments were reflected in the transcript levels of the FTL2 gene, with high levels being associated with growth cessation and bud set, and low levels with sustained growth. Higher FTL2 transcript levels under the R light day extension at 18 °C that induced bud set in virtually all plants, as compared to 24 °C that prevented bud set in large portions of the plants, is consistent with this notion.

Supplementary Materials

The following are available online at https://www.mdpi.com/1999-4907/12/3/337/s1, Figure S1: Examples of bud set stages in Norway spruce seedlings in growth chambers. 0; growing plants without terminal bud (a), 1; light green bud (b,c), 2; brown buds (d,e), Figure S2: Examples of bud burst stages in Norway spruce seedlings. 2; brown, closed bud (a), 1; opening (hole) in bud making needle initials visible (b,c), 0; regrowth after bud burst (d). Table S1. ANOVA tables for overall effect of temperature, photoperiod and provenance on shoot elongation (a), and effect of temperature and provenance on bud set stages (b) and subsequent bud burst stages (c) in Norway spruce seedlings. Table S2. Two-way ANOVA tables for overall effect of temperature and day extension with blue, red or far-red light compared to short days on shoot elongation (a,b), bud set stages (c,d) and bud burst stages (e) in Norway spruce seedlings. Table S3. Two-way ANOVA tables for overall effect of temperature and day extension with either R or FR light or R:FR ratio 0.5. 1 or 2 (a,c) or R or FR light or R:FR ratio 0.1, 0.2 or 0.5 (b,d) compared to short days on shoot elongation (a,b) and bud set stages (c,d) in Norway spruce seedlings. Table S4. Three-way ANOVA tables for effect of temperature, photoperiod and provenance on transcript levels of COL1, (a) COL2, (b) SOC1 (c) and FTL2 (d) in Norway spruce seedlings after 50 short or long days. Table S5. Three-way ANOVA tables for analyses of correlation between transcript levels of COL1 (a), COL2 (b), SOC1 (c) and FTL2 (d) and bud set stages in two provenances of Norway spruce seedlings after 50 short or long days at different temperatures. Table S6. Three-way ANOVA tables for analyses of correlation between transcript levels of COL1 (a), COL2 (b), SOC1 (c) and FTL2 (d) and plant height in two provenances of Norway spruce after 50 short or long days at different temperatures. Table S7. Two-way ANOVA tables for effect of temperature and day extension with red (R) or far-red (FR) light or R:FR ratio 1 compared to short days; SD on transcript levels of COL1 (a), COL2 (b), SOC1 (c) and FTL2 (d) in Norway spruce seedlings after 50 days. Table S8. Three-way ANOVA tables for analyses of correlation between transcript levels of COL1 (a), COL2 (b), SOC1 (c) and FTL2 (d) and bud set stages in Norway spruce seedlings after 50 days under different temperatures and day extension with red (R) or far-red (FR) light or R:FR ratio 1, compared to short days. Table S9. Three-way ANOVA tables for analyses of correlation between transcript levels of COL1 (a), COL2 (b), SOC1 (c) and FTL2 (d) and shoot elongation in Norway spruce seedlings after 50 days under different temperatures and day extension with red (R) or far-red (FR) light or R:FR ratio 1, compared to short days.

Author Contributions

Conceptualisation: J.E.O., C.C., M.V., I.S.F.; data curation: C.C., C.B.S., Funding acquisition: J.E.O., I.S.F.; investigation: C.C., O.T.A., M.V., K.T.H., J.E.O.; project administration: J.E.O., I.S.F.; supervision: J.E.O., C.B.S.; visualisation: C.C., K.T.H., J.E.O.; writing—original draft: C.C., J.E.O.; writing—review and editing: J.E.O., C.C., M.V., C.B.S., I.S.F., O.T.A., K.T.H. All authors have read and agreed to the published version of the manuscript.

Funding

This research was funded by the Research Council of Norway, grant 225365/E40 and the Norwegian University of Life Sciences.

Acknowledgments

We gratefully acknowledge Tone Ingeborg Melby for skilful technical assistance in gene expression studies (analyses and supervision), Marit Siira and Ida K. Hagen for skilful technical assistance and in plant culture, and Aruppilai Suthaparan for the data used for the light spectra of the LEDs used in the study.

Conflicts of Interest

The authors declare no conflict of interest. The funders had no role in the design of the study; in the collection, analyses, or interpretation of data; in the writing of the manuscript, or in the decision to publish the results.

References

  1. Wareing, P. Growth studies in woody species. 5. Photoperiodism in dormant buds of Fagus sylvatica L. Physiol. Plant. 1953, 6, 692–706. [Google Scholar] [CrossRef]
  2. Nitsch, J. Growth responses of woody plants to photoperiodic stimuli. Proc. Amer. Soc. Hort. Sci 1957, 79, 512–525. [Google Scholar]
  3. Dormling, I.; Gustafsson, Å.; von Wettstein, D. The experimental control of the life cycle in Picea abies (L.) Karst. I. Some basic experiments on the vegetative cycle. Silvae Genet. 1968, 17, 44–64. [Google Scholar]
  4. Olsen, J.E. Light and temperature sensing and signalling in induction of bud dormancy in woody plants. Plant Mol. Biol. 2010, 73, 37–47. [Google Scholar] [CrossRef] [PubMed]
  5. Way, D.A.; Montgomery, R.A. Photoperiod constraints on tree phenology, performance and mitigation in a warming world. Plant Cell Environ. 2015, 38, 1725–1736. [Google Scholar] [CrossRef] [PubMed]
  6. Håbjørg, A. Effects of photoperiod and temperature on growth and development of three latitudinal and three altitudinal populations of Betula pubescens Ehrh. Meld Nor. Landbr. 1972, 51, 1–27. [Google Scholar]
  7. Junttila, O.; Kaurin, Å. Climatic control of apical growth cessation in latitudinal ecotypes of Salix pentandra L. In Plant Production in the North; Kaurin, Å., Junttila, O., Nilsen, J., Eds.; Norwegian University Press: Oslo, Norway, 1985; pp. 83–91. ISBN 82-00-07385-8. [Google Scholar]
  8. Clapham, D.; Dormling, I.; Ekberg, I.; Eriksson, G.; Qamaruddin, M.; Vince-Prue, D. Latitudinal cline of requirement for far-red light for the photoperiod control of budset and extension growth in Picea abies (Norway spruce). Physiol. Plant. 1998, 102, 71–78. [Google Scholar] [CrossRef]
  9. Tsegay, B.; Lund, L.; Nilsen, J.; Olsen, J.E.; Mølmann, J.; Ernstsen, A.; Junttila, O. Growth responses of Betula pendula ecotypes to red and far-red light. Electronic J. Biotechnol. 2005, 8, 17–23. [Google Scholar] [CrossRef] [Green Version]
  10. Mølmann, J.A.; Junttila, O.; Johnsen, Ø.; Olsen, J.E. Effects of red, far-red and blue light in maintaining growth in latitudinal populations of Norway spruce (Picea abies). Plant Cell Environ. 2006, 29, 166–172. [Google Scholar] [CrossRef]
  11. Opseth, L.; Holefors, A.; Rosnes, A.K.R.; Lee, Y.K.; Olsen, J.E. FTL2 expression preceding bud set corresponds with timing of bud set in Norway spruce under different light quality treatments. Environ. Exp. Bot. 2016, 121, 121–131. [Google Scholar] [CrossRef]
  12. Clapham, D.; Ekberg, I.; Erikson, G.; Norell, L.; Vince-Prue, D. Requirement for far-red light to maintain secondary needle extension growth in northern but not southern populations of Pinus sylvestris (Scots pine). Physiol. Plant. 2002, 114, 207–212. [Google Scholar] [CrossRef] [PubMed]
  13. Chiang, C.; Olsen, J.E.; Basler, D.; Bånkestad, D.; Hoch, G. Latitude and weather influences on sun light quality and the relationship to tree growth. Forests 2019, 10, 610. [Google Scholar] [CrossRef] [Green Version]
  14. Riikonen, J. Efficiency of night interruption treatments with red and far-red light emitting diodes (LEDs) in preventing bud set in Norway spruce seedlings. Can. J. For. Res. 2018, 48, 1001–1006. [Google Scholar] [CrossRef]
  15. Chiang, C.; Aas, O.; Rindedal, M.; Lee, Y.; Torre, S.; Fløistad, I.S.; Olsen, J.E. Day-extension with far-red light enhances growth of subalpine fir (Abies lasiocarpa (Hooker) Nuttall) seedlings. Forests 2018, 9, 175. [Google Scholar] [CrossRef] [Green Version]
  16. Riikonen, J.; Kettunen, N.; Gritsevich, M.; Hakala, T.; Särkkä, L.; Tahvonen, R. Growth and development of Norway spruce and Scots pine seedlings under different light spectra. Exp. Env. Bot. 2016, 121, 112–120. [Google Scholar] [CrossRef]
  17. Riikonen, J. Content of far-red light in supplemental light modified characteristics related to drought tolerance and post-planting growth in Scots pine. Forest Ecol. Manag. 2017, 390, 8–14. [Google Scholar] [CrossRef]
  18. Olsen, J.E.; Lee, Y.K. Trees and boreal forests. In Temperature Adaptation in a Changing Climate: Nature at Risk; Storey, K.B., Tanino, K.K., Eds.; CABI Climate Change Series; CABI: Wallingford, UK, 2011; pp. 160–178. ISBN 978-1-84593-822-2. [Google Scholar]
  19. Tanino, K.; Kalcsits, L.; Silim, S.; Kendall, E.; Gray, G. Temperature-driven plasticity in growth cessation and dormancy development in deciduous woody plants: A working hypothesis suggesting how molecular and cellular function is affected by temperature during dormancy induction. Plant Mol. Biol. 2010, 73, 49–65. [Google Scholar] [CrossRef]
  20. Junttila, O.; Hänninen, H. The minimum temperature for bud burst in Betula depends on the state of dormancy. Tree Physiol. 2012, 32, 337–345. [Google Scholar] [CrossRef] [Green Version]
  21. Westergaard, L.; Eriksen, E. Autumn temperature affects the induction of dormancy in first-year seedlings of Acer platanoides L. Scand. J. For. Res. 1997, 12, 11–16. [Google Scholar] [CrossRef]
  22. Juntilla, O.; Nilsen, J.; Igeland, B. Effect of temperature on the induction of bud dormancy in ecotypes of Betula pubescens and Betula Pendula. Scand. J. For. Res. 2003, 18, 208–217. [Google Scholar] [CrossRef]
  23. Søgaard, G.; Johnsen, Ø.; Nilsen, J.; Junttilla, O. Climatic control of bud burst in young seedlings of nine provenances of Norway spruce. Tree Physiol. 2008, 28, 311–320. [Google Scholar] [CrossRef] [PubMed]
  24. Kalcsits, L.; Silim, S.; Tanino, K. Warm temperature accelerates short photoperiod-induced growth cessation and dormancy induction in hybrid poplar (Populus x spp.). Trees 2009, 23, 971–979. [Google Scholar] [CrossRef]
  25. Olsen, J.E.; Lee, Y.; Juntilla, O. Effect of alternating day and night temperature on short day-induced bud set and subsequent bud burst in long days in Norway spruce. Front. Plant Sci. 2014, 5, 1–11. [Google Scholar] [CrossRef] [Green Version]
  26. Hamilton, J.; Kayal, W.; Hart, A.; Runcie, D.; Arango-Velez, A.; Cooke, J. The joint influence of photoperiod and temperature during growth cessation and development of dormancy in white spruce (Picea glauca). Tree Physiol. 2016, 36, 1432–1448. [Google Scholar] [CrossRef] [PubMed] [Green Version]
  27. Rohde, A.; Bastien, C.; Boerjan, W.; Thomas, S. Temperature signals contribute to the timing of photoperiodic growth cessation and bud set in poplar. Tree Physiol. 2011, 31, 472–482. [Google Scholar] [CrossRef] [PubMed] [Green Version]
  28. Strømme, C.; Julkunen-Tiito, R.; Krishna, U.; Lavola, A.; Olsen, J.E.; Nybakken, L. UV-B and temperature enhancement affect spring and autumn phenology in Populus tremula. Plant Cell Environ. 2015, 38, 867–877. [Google Scholar] [CrossRef]
  29. Strømme, C.; Julkunen-Tiitto, R.; Olsen, J.E.; Nybakken, L. High daytime temperature delay autumnal bud formation in Populus tremula under field conditions. Tree Physiol. 2016, 37, 71–81. [Google Scholar]
  30. Gyllenstrand, N.; Clapham, D.; Källman, T.; Lagercrantz, U. A Norway spruce FLOWERING LOCUS T homolog is implicated in control of growth rhythm in conifers. Plant Physiol. 2007, 144, 248–257. [Google Scholar] [CrossRef] [Green Version]
  31. Asante, D.; Yakovlev, I.; Fossdal, C.G.; Holefors, A.; Opseth, L.; Olsen, J.; Juntilla, O.; Johnsen, Ø. Gene expression changes during short day induced terminal bud formation in Norway spruce. Plant Cell Environ. 2011, 34, 332–346. [Google Scholar] [CrossRef]
  32. Karlgreen, A.; Gyllenstrand, N.; Clapham, D.; Lagercrantz, U. FLOWERING LOCUS T/TERMINAL FLOWER1-LIKE genes affect growth rhythm and bud set in Norway spruce. Plant Physiol. 2013, 163, 792–803. [Google Scholar] [CrossRef] [Green Version]
  33. Avia, K.; Kärkkläinen, K.; Lagercrantz, U.; Savolainen, O. Association of the FLOWERING LOCUS T/TERMINAL FLOWER 1-LIKE gene (FTL2) expression with growth rhythm in Scots pine (Pinus sylvestris). New Physiol. 2014, 204, 159–170. [Google Scholar] [CrossRef]
  34. Böhlenius, H.; Huang, T.; Charbonnel-Campaa, L.; Brunner, A.; Janssson, S.; Strauss, S.; Nilsson, O. CO/FT regulatory module controls timing of flowering and seasonal growth cessation in trees. Science 2006, 313, 1040–1043. [Google Scholar] [CrossRef] [PubMed] [Green Version]
  35. Holefors, A.; Opseth, L.; Rosnes, A.K.R.; Ripel, L.; Snipen, L.; Fossdal, C.G.; Olsen, J.E. Identification of PaCOL1 and PaCOL2, two CONSTANS-LIKE genes showing decreased transcript levels preceding short day induced growth cessation in Norway spruce. Plant Physiol. Biochem. 2009, 47, 105–115. [Google Scholar] [CrossRef] [PubMed]
  36. Lee, J.; Lee, I. Regulation and function of SOC1, a flowering pathway integrator. J. Exp. Bot. 2010, 61, 2247–2254. [Google Scholar] [CrossRef] [PubMed] [Green Version]
  37. El Kayal, W.; Allen, C.G.; Ju, C.J.-T.; Adams, E.; King-Jones, S.; Zaharia, I.L.; Abrams, S.R.; Cooke, J. Molecular events of apical bud formation in white spruce (Picea glauca). Plant Cell Environ. 2001, 34, 480–500. [Google Scholar] [CrossRef] [Green Version]
  38. Sager, J.C.; Smith, W.O.; Edwards, J.L.; Cyr, K.L. The use of spectral data to determine photosynthetic efficiency and phytochrome photoequilibria. Trans. Amer. Soc. Agricult. Engineers 1988, 31, 1882–1889. [Google Scholar] [CrossRef]
  39. Blagojevic, D.; Lee, Y.K.; Brede, D.A.; Lind, O.C.; Yakovlev, I.; Solhaug, K.A.; Fossdal, C.G.; Salbu, B.; Olsen, J.E. Comparative sensitivity to gamma radiation at the organismal, cell and DNA level in young plants of Norway spruce, Scots pine and Arabidopsis thaliana. Planta 2019, 250, 1567–1590. [Google Scholar] [CrossRef]
  40. Crawley, M.J. The R Book, 1st ed.; John Wiley and Sons Ltd.: Chichester, UK, 2007; ISBN 13-978-0-470-51024-7. [Google Scholar]
  41. Thomas, B.; Vince-Prue, D. Photoperiodism in Plants, 2nd ed.; Academic Press: London, UK, 1997; ISBN 0-12-688490-0. [Google Scholar]
  42. Górski, T. Annual cycle of the red and far-red radiation. Internat. J. Biometeorol. 1980, 24, 361–365. [Google Scholar] [CrossRef]
  43. Poorter, H.; Fiorani, F.; Pieruschka, R.; Wojciechowski, T.; van der Putten, W.; Kleyer, M.; Schurr, U.; Postma, J. Pampered inside, pestered outside? Differences and similarities between plants growing in controlled conditions and in the field. New Phytol. 2016, 212, 838–855. [Google Scholar] [CrossRef] [PubMed]
  44. Granhus, A.; Fløistad, I.S.; Søgaard, G. Bud burst timing in Picea abies seedlings as affected by temperature during dormancy induction and mild spells during chilling. Tree Physiol. 2009, 29, 497–503. [Google Scholar] [CrossRef] [PubMed]
  45. Terfa, M.; Solhaug, K.A.; Gislerød, H.R.; Olsen, J.E.; Torre, S. A high proportion of blue light increased the photosynthesis capacity and leaf formation rate of Rosa x hybrida but does not affect time to flower opening. Physiol. Plant. 2012, 148, 146–159. [Google Scholar] [CrossRef] [PubMed]
  46. Navidad, H.; Fløistad, I.S.; Olsen, J.E.; Torre, S. Subalpine fir (Abies lasiocarpa) and Norway spruce (Picea abies) seedlings show different growth responses to blue light. Agronomy 2020, 10, 712. [Google Scholar] [CrossRef]
  47. Brelsford, C.C.; Robson, M. Blue light advances burd burst in branches of three deciduous tree species under short-day conditions. Trees 2018, 32, 1157–1164. [Google Scholar] [CrossRef]
  48. Olsen, J.E.; Junttila, O.; Nilsen, J.; Eriksson, M.; Martinussen, I.; Olsson, O.; Sandberg, G.; Mortitz, T. Ectopic expression of phytochrome A in hybrid aspen changes critical daylength for growth and prevents cold acclimation. Plant J. 1997, 12, 1339–1350. [Google Scholar] [CrossRef]
  49. Griffiths, S.; Dunford, R.P.; Coupland, G.; Laurie, D.A. The evolution of CONSTANS-like gene families in barley, rice and Arabidopsis. Plant Physiol. 2003, 131, 1855–1867. [Google Scholar] [CrossRef] [Green Version]
Figure 1. Spectral distribution of the blue, red and far-red light of Phillips GreenPower light-emitting diodes.
Forests 12 00337 g001
Figure 2. Effect of temperature (12 °C, 18 °C or 24 °C) and photoperiod (long days of 24 h (LD) or short days of 12 h (SD)) on plant height (a,b), bud set stages under SD (c,d) and subsequent bud burst stages after transfer to LD at 18 °C (e,f) in seedlings of Norway spruce provenances from Halden (59 °N; Experiment 1) and Rana (66 °N; Experiment 2). Bud set stages: 0 = growing, no bud, 1 = green bud, 2 = brown bud. Bud burst stages: 2 = closed bud, 1 = opening in bud, 0 = regrowth. n = 20 plants, ±standard error (coloured regions) is shown. Different letters indicate significant differences (p ≤ 0.05; Tukey’s test) for the last time point within each graph.
Forests 12 00337 g002aForests 12 00337 g002b
Figure 3. Effect of temperature and day extension with blue (B), red (R) or far-red (FR) light as compared to short days (SD; 12 h, no day extension) on shoot elongation in Norway spruce seedlings of the Halden provenance (59 °N) in experiments 3 (a,b) and 4 (c,d). n = 18–20 plants, ±standard error (coloured regions) is shown. Different letters indicate significant differences (p ≤ 0.05; Tukey’s test) for the last time point within each graph.
Forests 12 00337 g003
Figure 4. Effect of temperature and day extension with red (R), far-red (FR) or blue (B) light as compared to short days (SD; 12 h, no day extension) on bud set stages (ad) and bud burst stages (e,f) in Norway spruce seedlings of the Halden provenance (59 °N) in experiments 3 (a,b) and 4 (cf). n = 18–20 plants, ±standard error (coloured regions) is shown. Different letters indicate significant differences (p ≤ 0.05; Tukey’s test) for the last time point within each graph.
Forests 12 00337 g004
Figure 5. Effect of temperature and day extension with red (R) or far-red (FR) light or different R:FR ratios as compared to short days (SD; 12 h, no day extension) on shoot elongation in Norway spruce seedlings of the Halden provenance (59 °N) in experiments 5 (a,b) and 6 (c,d). n = 18–20 plants, ±standard error (coloured regions) is shown. Different letters indicate significant differences (p ≤ 0.05; Tukey’s test) for the last time point within each graph.
Forests 12 00337 g005
Figure 6. Effect of temperature and day extension with red (R) or far-red (FR) light or different R:FR ratios as compared to short days (SD; 12 h, no day extension) on bud set stages in Norway spruce seedlings of the Halden provenance (59 °N) in experiments 5 (a,b) and 6 (c,d). n = 18–20 plants, ±standard error (coloured regions) is shown. Different letters indicate significant differences (p ≤ 0.05; Tukey’s test) for the last time point within each graph.
Forests 12 00337 g006
Figure 7. Effect of temperature (12 °C, 18 °C or 24 °C) and photoperiod (long days of 24 h (LD) or short days of 12 h (SD)) on relative transcript levels of COL1 (a,b), COL2 (c,d), SOC1 (e,f) and FTL2 (g,h) in Norway spruce seedlings of the Halden (59 °N; Experiment 1) and Rana (66 °N; Experiment 2) provenances. The transcript levels were normalized against the mean of three reference genes (αTUBLIN, ACTIN, EF1) and are shown as fold change relative to the time 0 value. n = 4, ±standard error (coloured fields) is shown. Each sample, consisting of shoot tips of 3 pooled plants, was analysed in triplicate. Different letters indicate significant differences (p ≤ 0.05; Tukey’s test) for the last time point within each graph.
Forests 12 00337 g007
Figure 8. Analyses of correlation between relative transcript levels of COL1 (a,b), COL2 (c,d), SOC1 (e,f) and FTL2 (g,h) and bud set stages (a,c,e,g) or plant height (b,d,f,h) in seedlings of the Halden (59 °N) and Rana (66 °N) provenances of Norway spruce after 50 days under different temperatures (12 °C, 18 °C or 24 °C) and photoperiods (long days of 24 h (LD) or short days of 12 h (SD)). n = 4 samples. Models with an R2 value < 0.2 are not included.
Forests 12 00337 g008
Figure 9. Effect of day extension with red (R), far-red (FR) or R:FR ratio 1 as compared to short days (SD; no day extension) under different temperatures on relative transcript levels of COL1 (a,b), COL2 (c,d), SOC1 (e,f) and FTL2 (g,h) in seedlings in the Halden provenance (59 °C) of Norway spruce. The transcript levels were normalized against the mean of three reference genes (αTUBLIN, ACTIN, EF1) and are shown as fold change relative to the time 0 value. n = 3, ±standard error (coloured fields) is shown. Each sample, consisting of shoot tips of 3 pooled plants, was analysed in triplicate. Different letters indicate significant differences (p ≤ 0.05; Tukey’s test) for the last time point within each graph.
Forests 12 00337 g009
Figure 10. Analyses of correlation between relative transcript levels of COL1 (a,b), COL2 (c,d), SOC1 (e,f) and FTL2 (g,h) and bud set stages (a,c,e,g) or plant height (b,d,f,h) in seedlings of the Halden provenance (59 °N) of Norway spruce after 50 days under different temperatures and day-extension treatments with red (R), far-red (FR) or R:FR ratio 1 as compared to short days (SD of 12 h, no day extension). n = 4 samples.
Forests 12 00337 g010
Table 1. Overview of the experiments and experimental conditions for investigating interactive effects of photoperiod/day extension with different light qualities and temperature on growth cessation, bud set and subsequent bud burst in Norway spruce provenances from Norway.
Experiment: ProvenanceLight Parameter Tested during Experimental Treatments *Pre-Growing Conditions (7 Weeks under LD) **Experimental Treatments (6–8 Weeks) ***Forcing/Bud Burst Conditions) ****
PPFD
(µmol m−2 s−1)
R:FR Light Ratio Temperature
(°C)
Photoperiod (Exp 1–2) or
Type of Day-Extension Light from LEDs (Exp 3–6)
PPFD in Main Light Phase
(µmol m−2 s−1)
R:FR during Main Light Period of 12 hTemperature
(°C)
Temperature
(°C)
Light Conditions
1: Halden (59 °N)Photo-
period
2001.71812 h (SD),
24 h (LD)
2001.712, 18, 2418As pregrowing
2: Rana (66 °N)Photo-
period
2001.71812 h (SD),
24 h (LD)
2001.712, 18, 2418As pregrowing
3: HaldenLight quality2001.718B, R, FR, SD160218, 22--
4: HaldenLight quality2001.718B, R, FR, SD160218, 2418As pregrowing
5: HaldenLight quality2501.818FR (0.24),
R: FR 0.5 (0.72),
1 (0.78),
2 (0.81),
R (0.88),
SD
2602.518, 24--
6: HaldenLight quality2501.818FR (0.24), R:FR 0.1 (0.4),
0.2 (0.56),
0.5 (0.72),
R (0.88),
SD
2602.518, 24--
* Photoperiods 12 h and 24 h (12 h day extension with low-intensity incandescent light). Light quality from light-emitting diodes during day extension. ** PPFD = photosynthetic photon flux density, LD = long days of 24 h, R: FR = red: far-red. *** SD = short days of 12 h, B, R, FR = blue, red, far-red light; 12 h day extension with 0.5 h overlap on each side of main 12 h photoperiod. The values in brackets correspond to the phytochrome photostationary state values of R and FR light treatments. **** Plants were transferred to forcing conditions after the experimental treatments. - = bud burst not recorded.
Publisher’s Note: MDPI stays neutral with regard to jurisdictional claims in published maps and institutional affiliations.

