Predicting the Potential Geographic Distribution of Sirex nitobei in China under Climate Change Using Maximum Entropy Model


1
Sino-France Joint Laboratory for Invasive Forest Pests in Eurasia, Beijing Forestry University, Beijing 100083, China
2
Suzhou New District (Huqiu District) Forestry Station, Suzhou 215163, China
*
Author to whom correspondence should be addressed.
Forests 2021, 12(2), 151; https://doi.org/10.3390/f12020151
Submission received: 5 December 2020
/
Revised: 23 January 2021
/
Accepted: 25 January 2021
/
Published: 28 January 2021
(This article belongs to the Section Forest Inventory, Modeling and Remote Sensing)
Abstract
:Sirex nitobei, an Asian native wood wasp species, is a major pest in coniferous commercial forestry, infesting and weakening conifers through its obligate mutualism with a wood-rotting fungus species. The combination of wood wasp larvae and obligate mutualistic fungus causes the breakdown of plant vascular tissue, leading to the weakening of the plant and eventually to death, as well as a high economic cost in commercial forestry. Since it was first recorded in China in the early 1980s, S. nitobei has widely spread and become successfully established. Despite its extensive distribution range, little is known about the factors influencing current and future distribution patterns for potential pest control and monitoring. We used a maximum entropy model in conjunction with climate variables and shared socio-economic pathways to predict the current and future distribution of S. nitobei in China. We used the jackknife method and correlation analysis to select the bioclimatic and environmental variables that influence the geographic distribution of S. nitobei, which resulted in the inclusion of the monthly total precipitation in July (prec7), the monthly average maximum temperature in February (tmax2), the monthly average minimum temperature in July (tmin7), the monthly total precipitation in December (prec12), and isothermality (bio3). We found that precipitation and temperature influenced the potentially suitable areas, as predicted by the maximum entropy model. Moreover, the association of the fungus, the wood wasp, and the host plant impacts are related to availability of moisture and temperature, where moisture affects the growth of the fungus, and temperature influences the emergence, development and growth of larvae. Under the current climate conditions, the total potential suitable areas increased by 18.74%, while highly suitable and moderately suitable areas increased by 28.35 and 44.05%, respectively, under the 2081–2100 ssp245, 370 scenarios. Favorable conditions under climate change, low rainfall, and high temperature will favor the speedy larval development, the growth of its obligate nutritional fungal mutualist and the ability of S. nitobei to rapidly spread in previously unsuitable areas.
1. Introduction
Invasive alien species (IAS) can cause significant negative ecosystem level, economic, and human health impacts in areas they are introduced to [1,2,3,4]. Indeed, invasive species are predicted to be one of the biggest drivers of global change as a result of their impacts on the environment [5]. Typically, invasive alien species are those species that are introduced intentionally or unintentionally by humans to regions outside their geographic distribution [6]. Once established, these species begin to have negative effects on the environment through their interactions with biota in the introduced region. However, some species can produce deleterious effects similar to invasive species in regions in their native ranges, the species may have a distribution within a continent, but may not occur in some parts of the continent, which would be their introduced range once they arrive and are establish there [7], often referred to as native pest species [8]. Insects, in particular, can be far more damaging as an invasive species due to their high rates of reproduction, high abundances, physiological tolerance to extreme temperatures, and ability to fly, giving them leverage to spread faster and further [9]. Moreover, under the scenario of global climate change, more areas are predicted to become more suitable as temperatures increase, making previously unsuitable habitats become more habitable.
Sirex nitobei (Hymenoptera: Siricidae), a wood-boring wasp species native to Asia with a Palaearctic and Oriental distribution range, is an important pest of conifers, Larix and Pinus species in commercial forestry. In China, the hosts of S. nitobei include Pinus sylvestris var. mongolica, P. tabuliformis, P. armandii, P. thunbergia, and P. massoniana; while in Japan, it infests P. densiflora and P. thunbergii [10,11]. The species has become successfully established within some Asian countries where it was previously not found. It has been recorded in China, Japan, and Korea [12]. In China, the first report of S. nitobei dates to 1980, and since then, the species has spread into 13 provinces, including Zhejiang, Beijing, Heilongjiang, Jilin, Liaoning, Inner Mongolia, Hebei, Shandong, Shaanxi, Gansu, Jiangsu, Anhui, and Yunnan [13]. S. nitobei has a long lifecycle, producing one generation a year, with a four-day lifespan [14]. Using the ovipositor, the female drills through the phloem to the xylem, often drilling multiple tunnels in the xylem during oviposition. During drilling, mucus and mycelium are injected into the tunnel. The mycelia are from its obligate mutualistic, either Amylostereum areolatum or A. chailletii [15], carried by the wood wasp, and the mucus which contains a phytotoxin that promotes its growth. The fungus growth can weaken the immune system of the host plant, and destroy the cellulose and lignin [16]. The nature of the obligate mutualism association between S. nitobei and its wood fungus is that S. nitobei larvae cannot digest plant cellulose, hemicellulose or wood fibers due to a lack of important enzymes required for the digestion of these substances. The fungus, supported by the mucus, facilitates this by breaking down the cellulose and lignin in the wood, enabling the larvae to consume it [17]. Research has shown that neither mucus nor obligate mutualistic fungus can directly cause tree death alone; it is only the combination of mucus and obligate mutualistic fungus that can cause the tree to weaken or die [18]. Damage to the cellulose and lignin can lead to a blocked vascular tissue, which reduces nutrient transport from the stem to the crown, causing the wood to desiccate [19]. Moreover, this damage causes the plant to increase stem respiration to compensate, which causes starch content to decrease. This has severe negative impacts on wood quality and ultimately reduces the commercial value of wood. In addition, due to the poor transportation of the photosynthetic products, as a result of the damage to the vascular tissues, the leaves begin to turn yellow, resembling senescence [20]; thus, damage from S. nitobei causes premature senescence in the host plant.
In 2013, S. nitobei was found to co-infest host plant species together with the invasive European wood wasp, S. noctilio, which was a severe international quarantine woodborer that invaded China in 2013 [21]. Together, they severely affected the timber industry as most of the host are important wood species for coniferous timber production. The software used in most of these studies makes use of data on climatic variables in the current occurrence areas as well as some of the species characteristics to predict possible suitable habitats under various climate change scenarios. Maximum entropy theory is one such model, and predicts species potential future distribution using occurrence points and environmental variables [22,23,24,25]. The model has been applied in a wide range of studies predicting habitat suitability for plants, animals, and fungi [26,27,28,29], especially in invasion biology studies. The model is highly advantageous above others due to its faster operational capability, simplicity of operation, stable calculation results, and high accuracy [30], even with a few occurrence points [31,32]. For the latter, maximum entropy is ideal as a model to be applied to studies on the distribution patterns of Sirex wood wasps, since they occur in areas that are inconvenient for transportation, making it difficult to collect occurrence data, and their habitat ranges are extensive. Furthermore, this is one of the main challenges in monitoring and attempting to control the population of S. nitobei.
The maximum entropy model was used to predict the globally suitable areas of the three natural enemy nematodes of the European wood wasp, S. noctilio, (Fischbein et al.) using a combination of bioclimatic variables from the WorldClim database v1.4. The predicted results of suitable and unsuitable areas were consistent with the previous successful and failed releases in non-native areas of these nematodes. Climate and other factors affected the establishment of nematode populations, and affected the control effect of S. noctilio [33]. Similarly, Sun et al. used 19 bioclimate variables, from the WorldClim database v1.4, to predict the globally suitable areas of S. noctilio under the near current and future climate conditions, and showed that the potential distribution areas of S. noctilio were concentrated in 30° N–60° N and 25° S–55° S. High suitability was found for all continents, with the exception of Antarctica. The environmental variables significantly influencing the potential distribution and habitat suitability of S. noctilio are annual mean temperature (bio1), mean temperature of the warmest quarter (bio10), and precipitation of the wettest month (bio13). In 2050 and 2070, the area of moderate and highly suitable areas changed with the increase or decrease in carbon dioxide emissions [34]. In January 2020, the WorldClim database updated the global climate and weather data from v1.4 and v2.0 to v2.1 [35,36]. The database v1.4 contains the historical climate data from 1960 to 1990, and the database v2.1 contains the historical climate data from 1970 to 2000. In database v1.4, the Coupled Model Intercomparison Project Phase 5 (CMIP5) data, the future climate have four representative concentration pathways (RCP), including rcp26, rcp45, rcp60, and rcp85. RCPs summarize the impact of many strategies to deal with climate change in future greenhouse gas emissions [37]. The periods included 2050 and 2070, the average for 2041–2060 and 2061–2080, respectively. In database v2.1, the CMIP6 data, the future climate had four shared socio-economic pathways (SSPs), including ssp126, ssp245, ssp370, and ssp585. SSPs can better reflect the correlation between socio-economic development and climate scenarios [38,39]. The periods of CMIP6 are more specific, including 2021–2040, 2041–2060, 2061–2080, and 2081–2100. The CMIP provides an essential reference for research on the laws of past climate change and the predictions of future climate change. It is a critical platform in climate science and an essential part of IPCC (The Intergovernmental Panel on Climate Change) scientific reports over the years. Compared with CMIP5, the simulation results of CMIP6 are closer to the actual observations [40,41]. CMIP5 had uploaded 19 global climate models (GCM), and recently, CMIP6 uploaded nine GCMs to the WorldClim database. Compared with CMIP5, the predictive results of CMIP6 with the National (Beijing) Climate Center Climate System Model (BCC_CSM) were significantly improved [42].
The aim of this study was to predict the potential geographic distribution of S. nitobei, and the environmental variables driving this, under near climate change and future climate change scenarios using maximum entropy model and CMIP6 data. We chose the medium-resolution BCC_CSM, the BCC-CSM2-MR, to predict the potential distribution area of S. nitobei under future climate conditions. Further, we perform this research to inform or guide pest control strategies for this pest species.
2. Materials and Methods
2.1. The Source of Occurrence Points
The occurrence data of S. nitobei were obtained from the following sources: (1) The collection records of S. nitobei specimens deposited in Beijing Key Laboratory for Forest Pests Control (Beijing Forestry University, BFU), National Zoological Museum of China (Chinese Academy of Science, CAS), Research Institute of Forest Ecology, Environment, and Protection (Chinese Academy of Forestry, CAF), Sawfly Collection of Central South University of Forestry and Technology (CSUFT), and College of Agriculture and Biotechnology (Zhejiang University, ZJU); (2) published reference related to S. nitobei [10,12,13,43,44,45,46,47]; (3) observational data that we collected from 2013 to 2019, where we investigated the historical and potential occurrence points in Beijing, Heilongjiang, Jilin, Liaoning, Shandong, Shaanxi, Inner Mongolia, Gansu, Yunnan, and other provinces. S. nitobei samples were collected during its emergence period and by rearing from trunks of dying trees.
2.2. The Selection Occurrence Points
We used Google Earth 7.1 (Google Inc., Mountain View, CA, USA) to verify accuracy of the latitude and longitude of the collected occurrence points. To eliminate the influence of large spatial correlation and over-fitting simulation, the buffer analysis was used to filter the occurrence points that were too close. The spatial resolution of environmental variables used in this study was 2.5 arc-minutes, covering about 21.0 km2, with the radius of the buffer zone set to 2.5 km [48]. When the distance between the occurrence points was less than 5.0 km, only one occurrence point was retained.
2.3. Environmental Variables
Insects species’ distribution patterns are influenced by a variety of environmental variables [49]. The environmental variables we used in this study were from the WorldClim v2.1 (https://www.worldclim.org/), and included 19 bioclimatic variables, monthly average minimum temperature, monthly average maximum temperature, and monthly total precipitation. We also used the environmental variables of the future climate condition, the periods of the 21st century, under four climate scenarios, including ssp126, ssp245, ssp370, and ssp585. The GCM chose the BCC-CSM2-MR.
We used the ArcMap software v10.2 (Environmental Systems Research Institute Inc., Redlands, CA, USA) to convert the environment variables from *.tif format to *.asc format (ArcToolbox: Conversion Tools - From Raster - Raster to ASCII), in preparation for use in MaxEnt software 3.4.1 (Princeton University, Princeton, NJ, USA). The coordinate system was set to World Geodetic System (WGS) 1984. Since too many variables can increase the ecological space dimension, which can affect the predicted performance and accuracy of the maximum entropy model, we used the jackknife analysis in MaxEnt software to obtain the percent contribution of each environmental variable [50,51,52]. We extracted the environmental variables’ climate information of all occurrence points using ArcMap software (ArcToolbox: Spatial Analyst Tools - Extraction - Sample). We used Pearson’s correlation analysis to calculate the relationship between the climatic/environmental variables using SPSS software v20.0.0 (International Business Machines Corporation, Armonk, NY, USA) [53].
2.4. Maximum Entropy Model Optimization
The maximum entropy model parameters set in this study were as follows: Create response curves and jackknife to measure variable importance; Cloglog output mode [25]; output file format as ‘asc’. To predict the potentially suitable distribution area under future climate conditions, the filenames of future climate variables data were set to correspond to the near current climate variables and loaded into ‘Projection layers directory/file’.
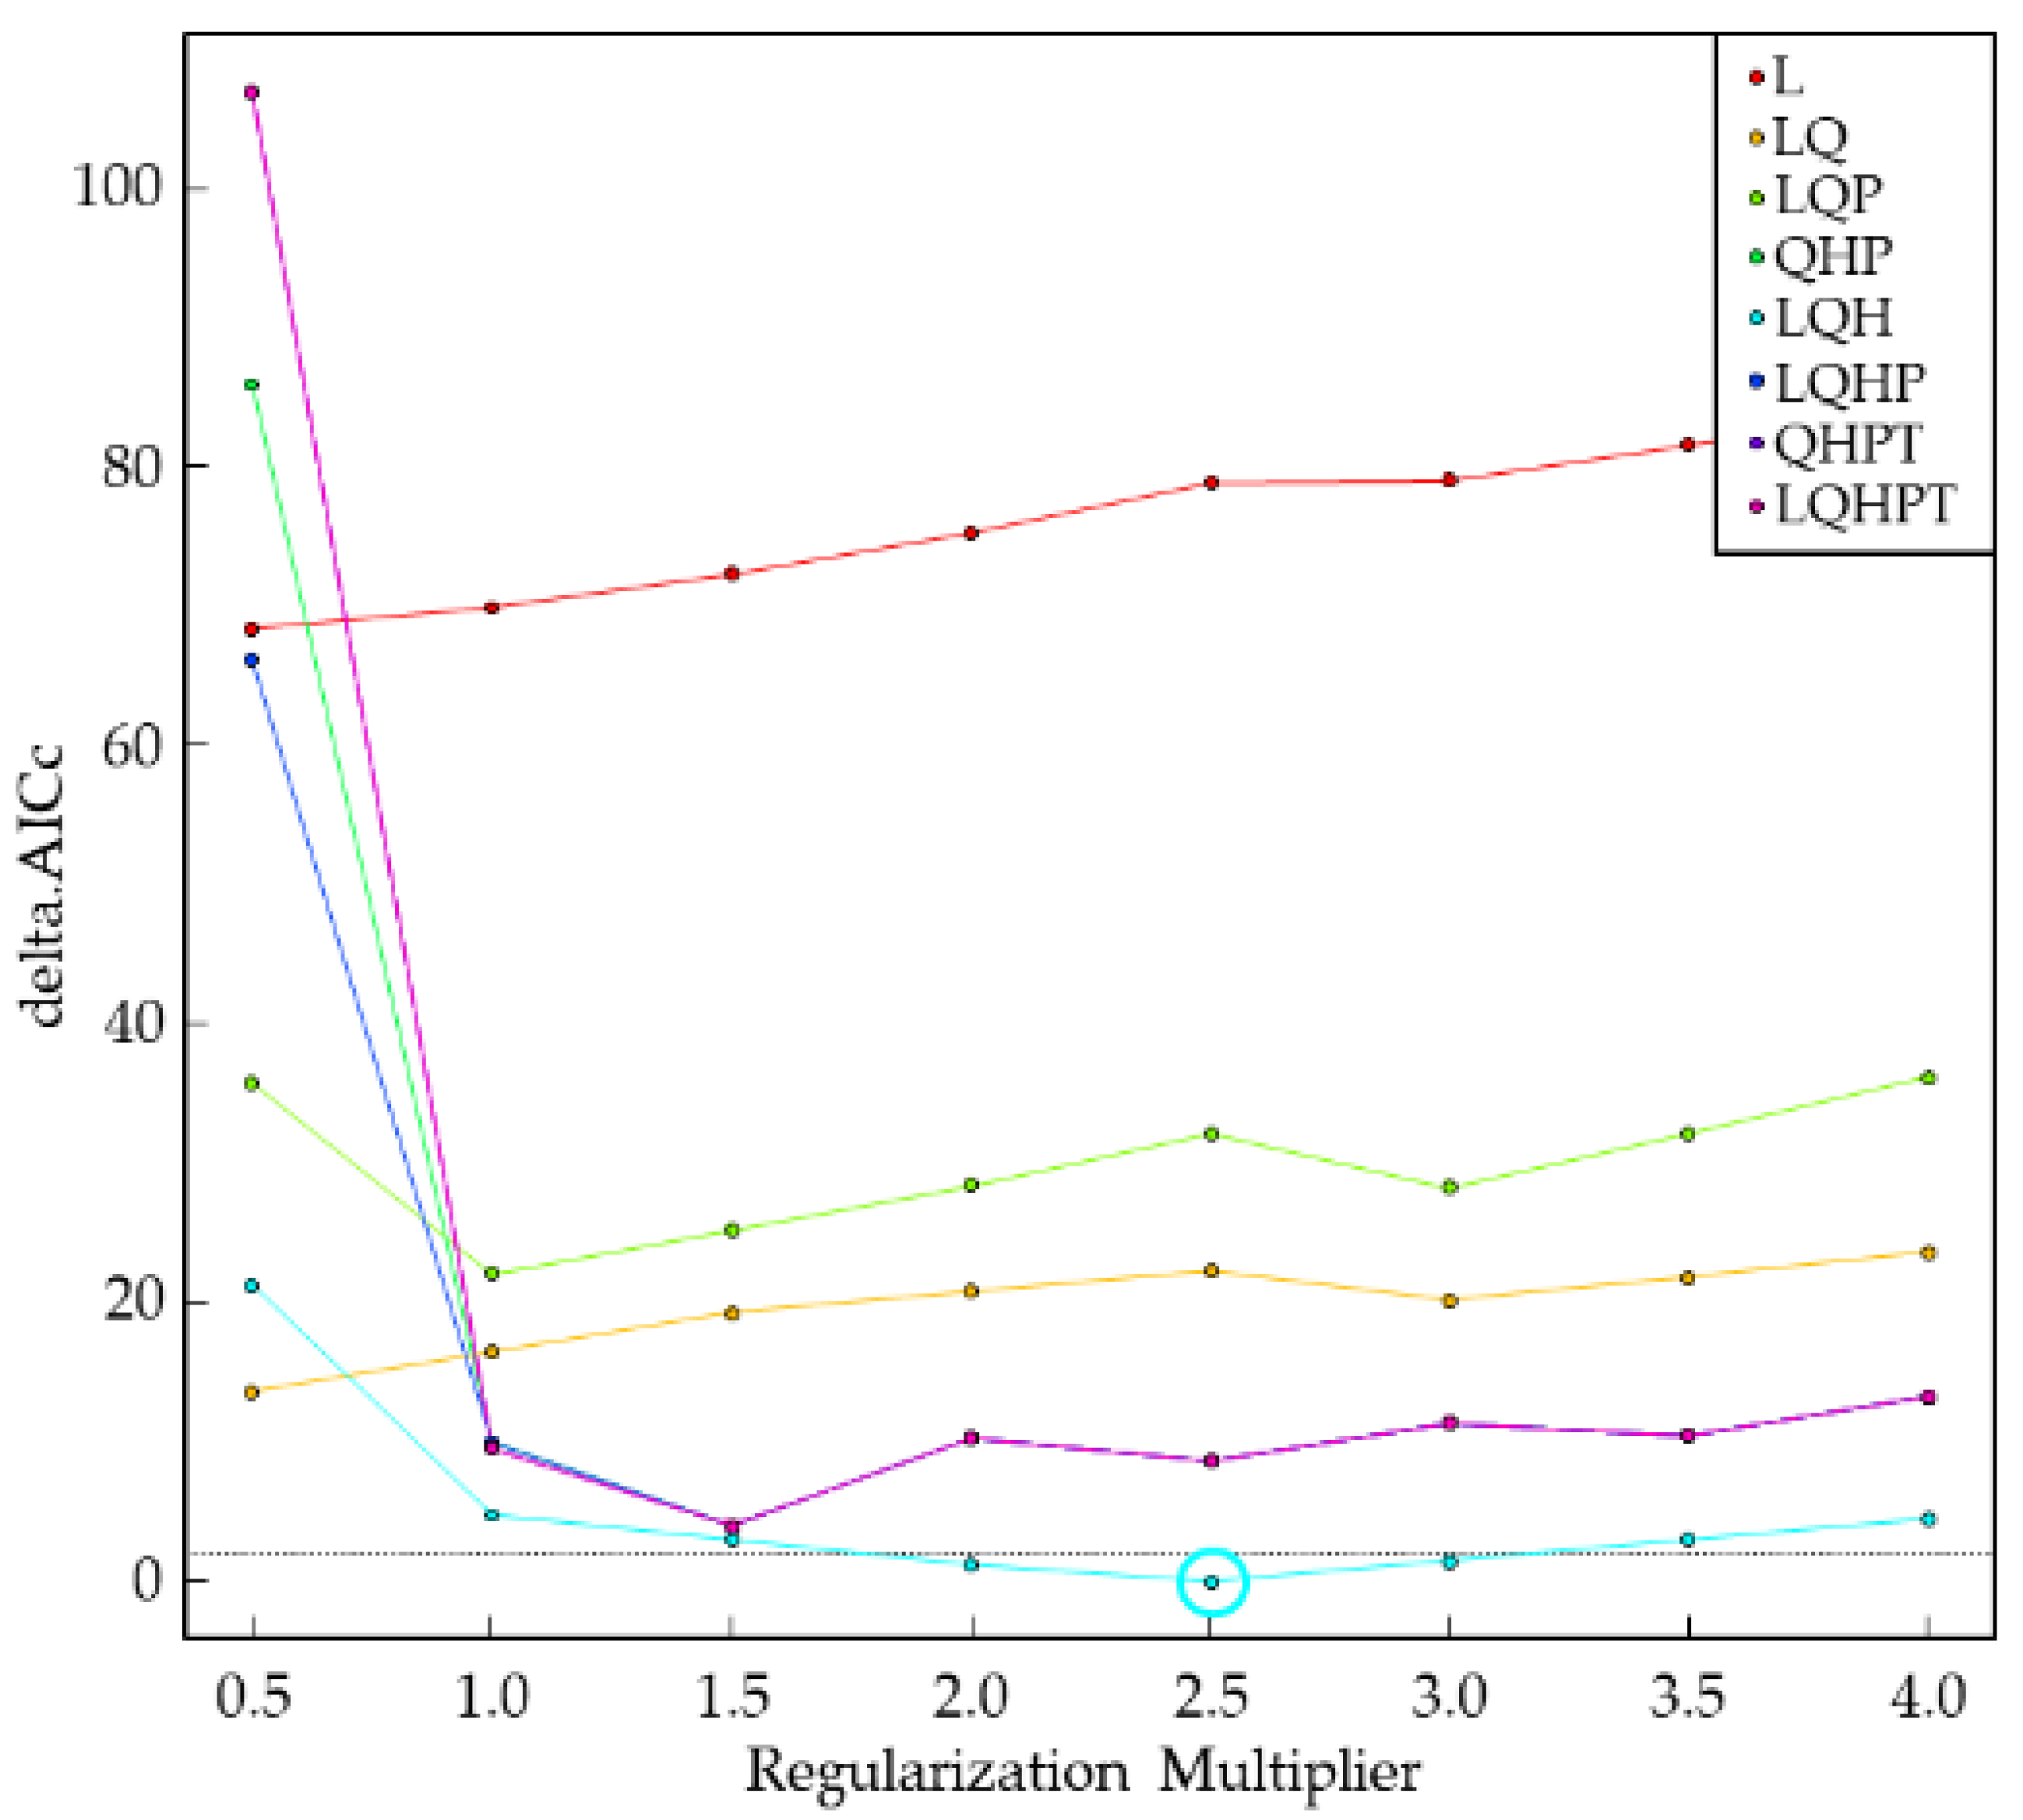
The following parameters were also used in the model analysis. We used random seed, which is similar to bootstrapping, where each run will use a different random seed. The random test percentage was set to 25, which means that 75% of the occurrence points are randomly selected as the training set, and the remaining 25% are used as the test set. We used ArcMap software, DIVA-GIS software v7.5.0 (https://www.diva-gis.org/), and R software v4.0.3 (https://www.r-project.org/) to calculate the ‘Regularization multiplier’ (RM). The R packages used were ENMeval, dismo, dotCall64, fields, grid, knitr, maps, maptools, raster, rgeos, sp, spam, and spThin, to calculate the RM and feature classes (FC). The RM was set to 0.5, 1.0, 1.5, 2.0, 2.5, 3.0, 3.5, and 4.0. The FC included linear (L), quadratic (Q), hinge (H), product (P), and threshold (T). The ENMeval package was used to calculate the corrected Akaike information criterion correction value (AICc value) under different parameters. AICc value was used to estimate the complexity of the maximum entropy model, with the smallest AICc value corresponding to the FC combination and preferred RM [54]. We tested eight different FC combinations, including L, LQ, LQP, QHP, LQH, LQHP, and LQHPT [24,55,56]. The “checkerboard2” method was used to calculate the AICc value. The model was run ten times (replicates set to 10) under the same setting, with the final result presented as the average of the replicates.
2.5. Classification of Potentially Suitable Area
The asc file resulting from 10x replication of the maximum entropy model was converted to a raster by ArcMap software (ArcToolbox: Conversion Tools - To Raster - ASCII to Raster). The S. nitobei distribution range in China was analyzed using ArcMap software (ArcToolbox: Spatial Analyst Tools - Extraction - Extract by Mask). In this study, we used the lowest presence threshold (LPT) to define the suitable distribution area and unsuitable distribution area [57]. The contents of the potential distribution areas were divided into four categories, including unsuitable distribution areas (0–LPT), low suitable distribution areas (LPT–0.4), moderately suitable distribution areas (0.4–0.6), and highly suitable distribution areas (0.6–1.0). We calculated the area of each category using ArcMap software (ArcToolbox: Spatial Analyst Tools - Reclass - Reclassify), and set the coordinate system of the potential distribution map of S. nitobei to China Lambert Conformal Conic.
2.6. The Predictive Accuracy of Maximum Entropy Model
The area under the curve (AUC) of the receiver operating characteristic (ROC) curve, the AUC value, is widely used to estimate the predictive accuracy of the maximum entropy model. The following criteria are used to determine if the predicted accuracy is good or bad: AUC scores range from 0 ≤ to ≤ 1; the output showing 0.5 < AUC ≤ 0.7 is considered failed or bad predictive power; 0.7 < AUC ≤ 0.8 is general; 0.8 < AUC ≤ 0.9 is good; 0.9 < AUC ≤ 1.0 is very good. The larger the AUC value, the more credible the maximum entropy model [58]. However, even though the AUC value as evaluation criterion of maximum entropy model is widely used, it does present some problems: (1) it ignores the predicted probability values and the goodness-of-fit of the model; (2) it summarizes the test performance over regions of the ROC space in which one would rarely operate; (3) it weights omission and commission errors equally; (4) it does not give information about the spatial distribution of model errors; and, most importantly, (5) the total extent to which models are carried out highly influences the rate of well-predicted absences and the AUC scores [59]. The AUC value could vary with the spatial range of the selected background point. The more extensive the spatial range, the higher the AUC value [60]. To eliminate the possible deviations of the AUC value, we used the AUC value of the partial-area ROC (P-ROC AUC) to estimate the predictive accuracy of the maximum entropy model. We used 5% error rate (E = 0.05) to calculated the AUC ratios, AUC ratio = AUCE/AUC0.5, by using Niche Analyst software v3.0 (http://nichea.sourceforge.net/) (Calculate AUC value of partial - area ROC approaches) The AUC ratios > 1 indicated that the model has a very good random prediction. [61].
3. Results
3.1. The Major Parameters of Maximum Entropy Model
We used buffer analysis to all collected 31 occurrence points and finally got 24 occurrence points of the S. nitobei for the maximum entropy model. By using the jackknife analysis and Pearson’s correlation analysis to select bioclimatic and environmental variables. The selection results of the environmental variables are shown in Table 1.
The FC combination of the maximum entropy model in this study was LQH and the ‘RM’ was 2.5 (Figure 1).
3.2. The Predictive Accuracy of Maximum Entropy Model
The accuracy of predicted result, under current climate and future climate conditions, was estimated by the AUC value and AUC ratio. The results showed that the AUC and AUC ratio values of 17 climate conditions were all greater than 0.9 and 1.0, indicating that the predicted results of the maximum entropy model were very good (Table 2).
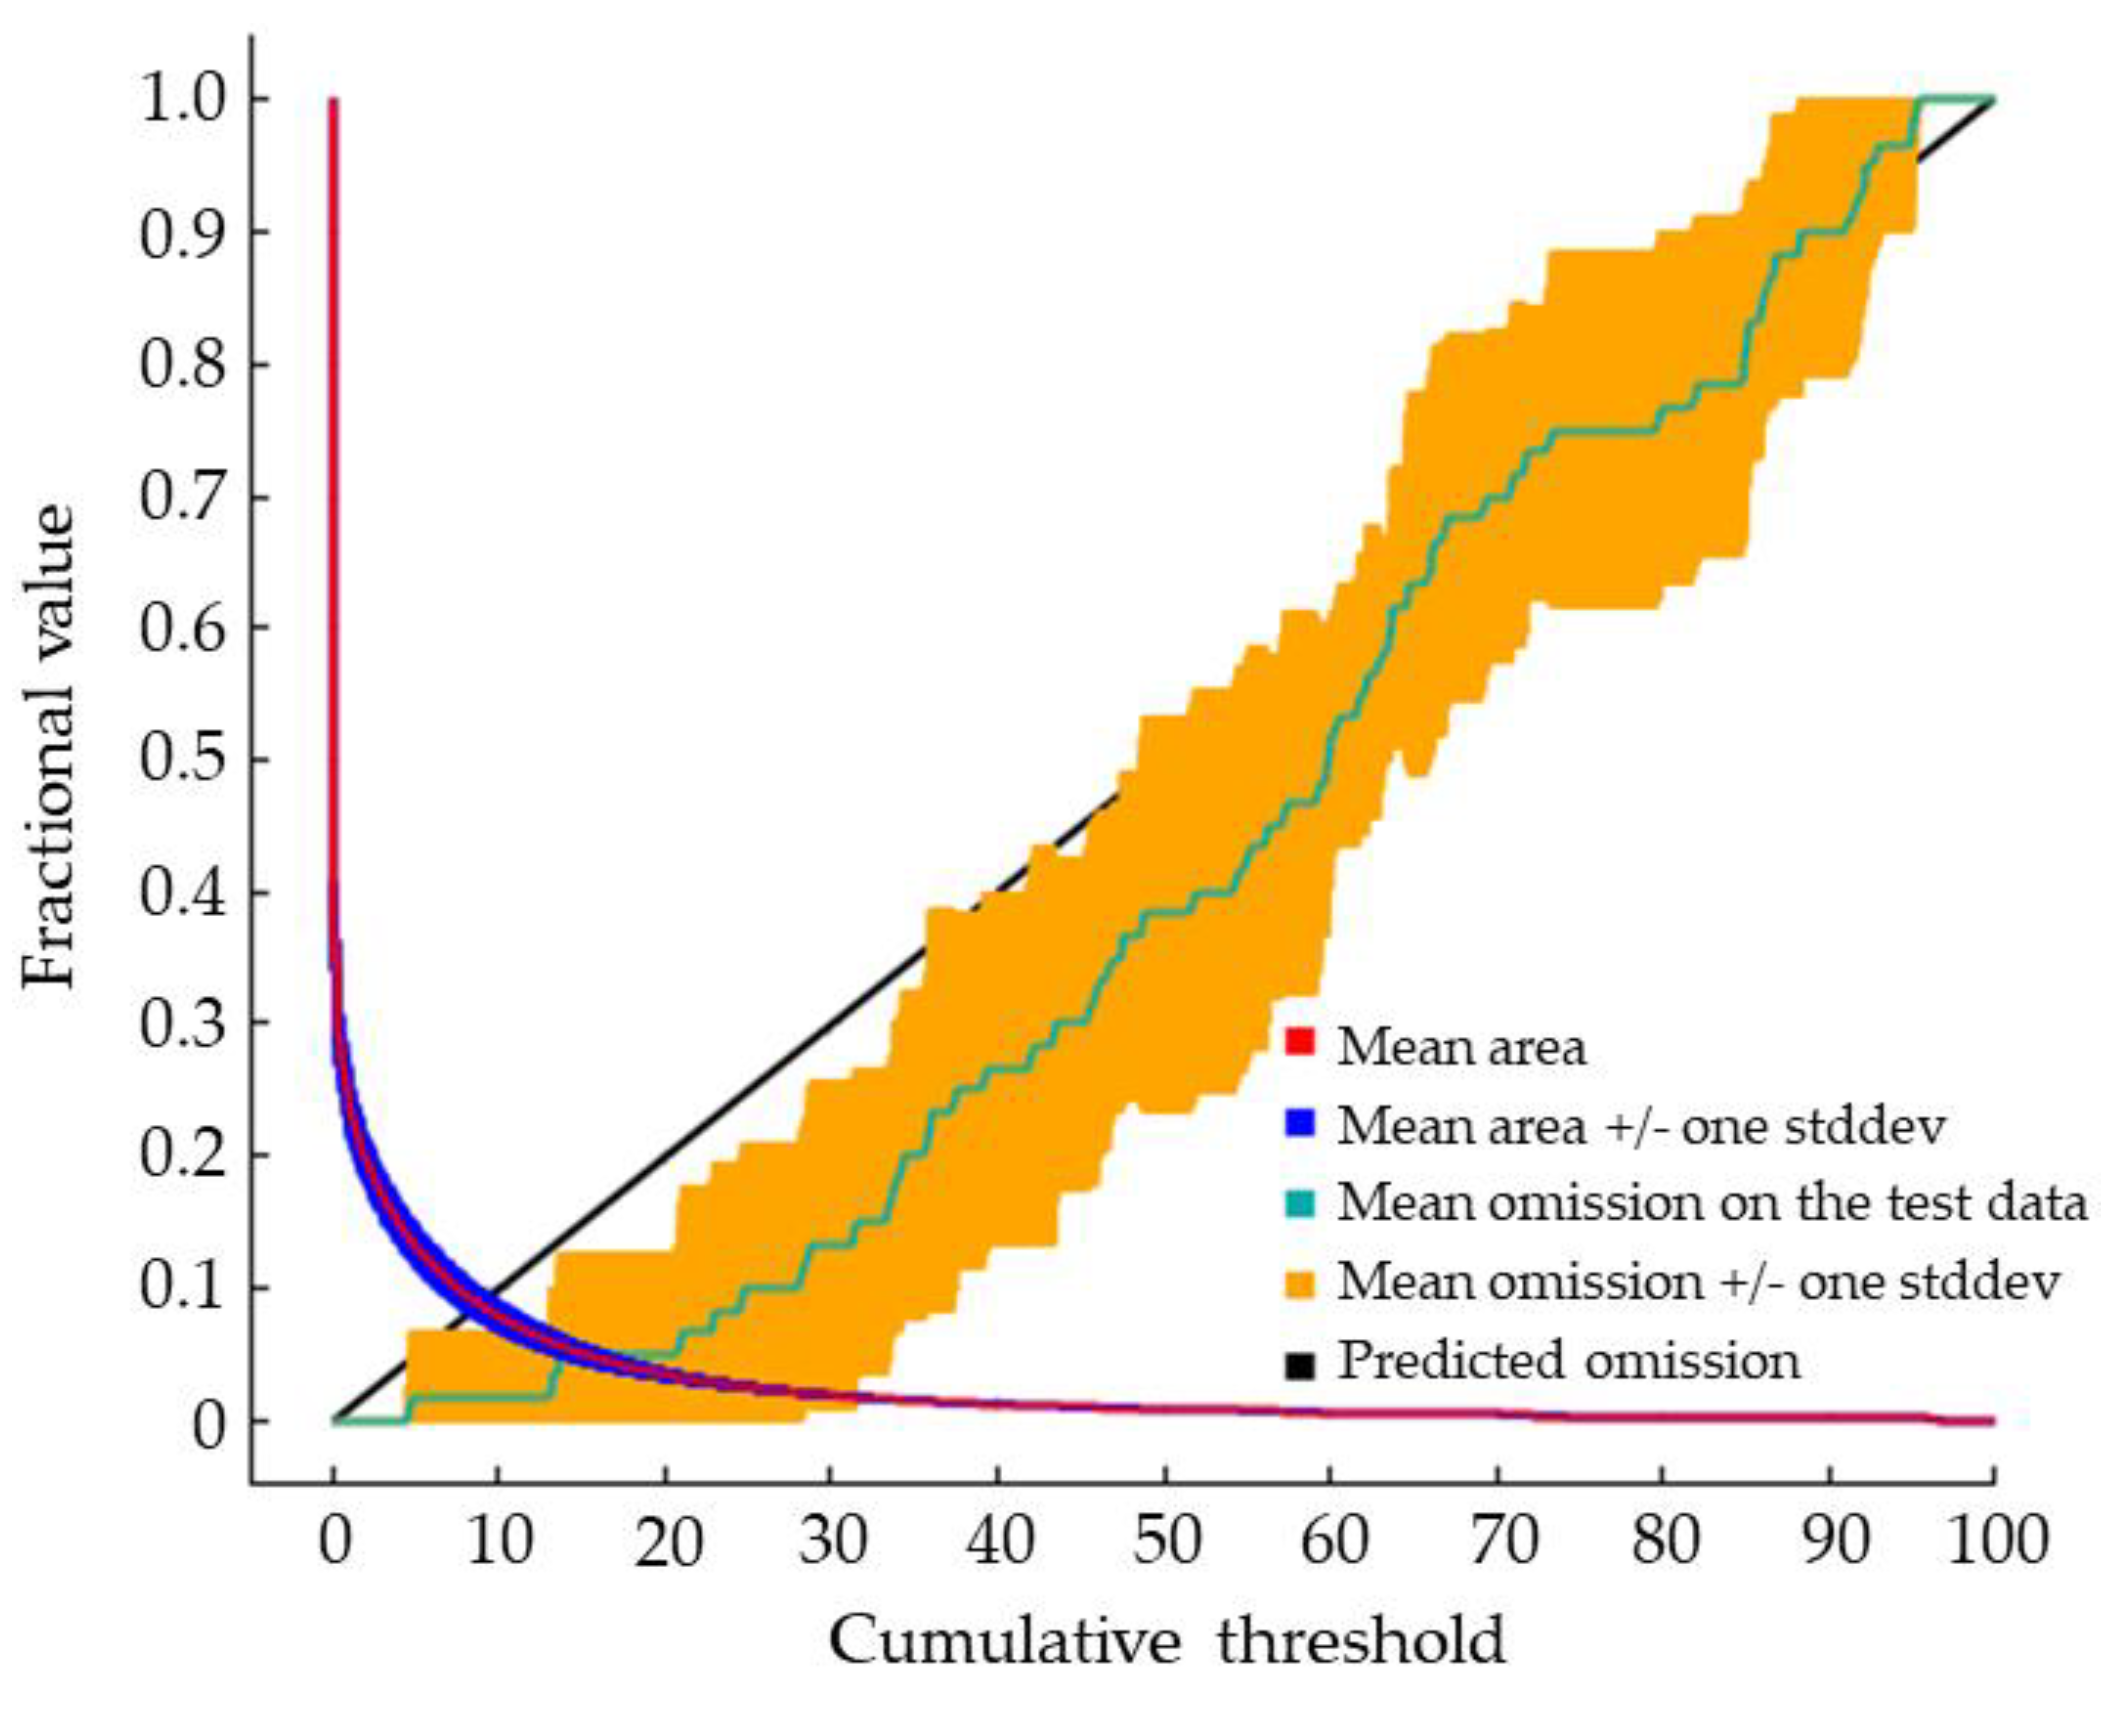
Under near current climate conditions, the mean omission curve on the test data had a slight deviation near the predicted omission (Figure 2), which might be due to the small sample size.
3.3. The Potential Distribution of S. nitobei under the Current Climate Condition
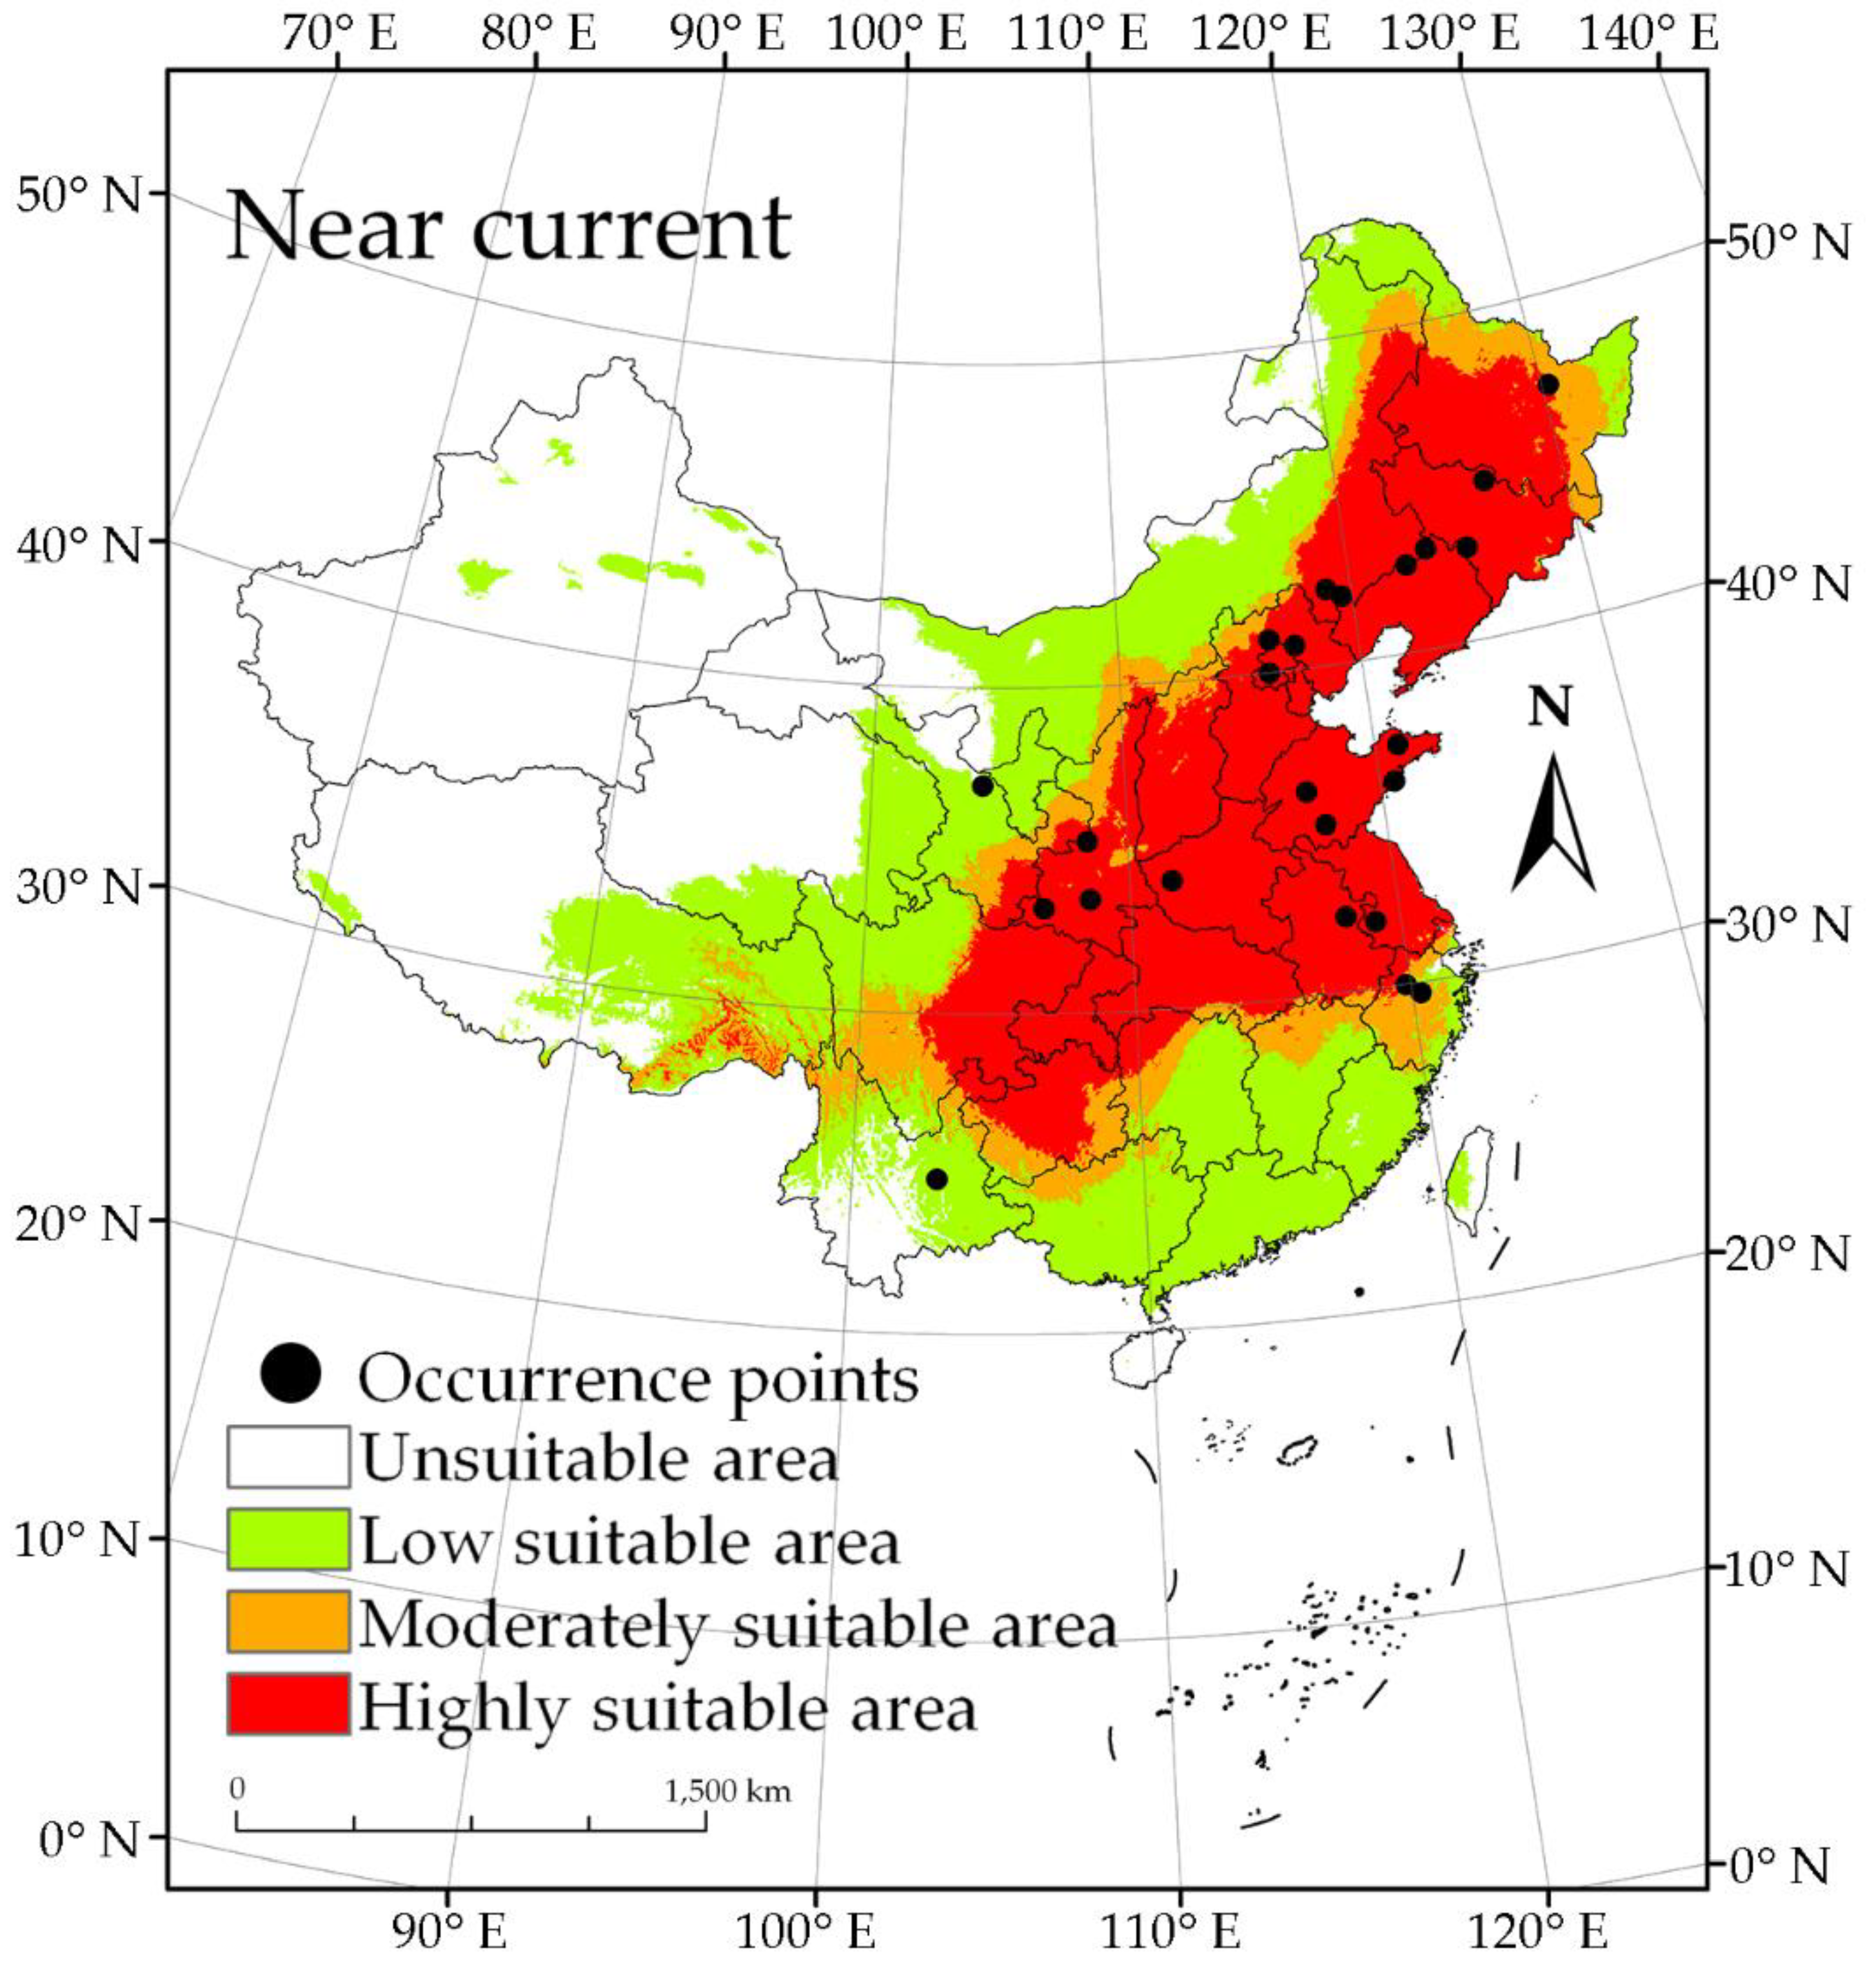
The potentially suitable distribution areas of S. nitobei as predicted by the maximum entropy model were divided into four grades: highly suitable, moderately suitable, low suitable, and unsuitable (Figure 3). The predicted results showed that the range of the suitable area, under the current climate condition, is 79°–137° E, 21°–54° N; and the highly suitable area is 93°–132° E, 25°–50° N. The administrative regions that were predicted to be highly suitable areas included Beijing, Tianjin, Henan, Shandong, Liaoning, and Chongqing. The moderately suitable areas and the low suitable areas were mainly distributed around highly suitable areas. With the except for Hainan, the low suitable areas only had sporadic distribution, while other administrative regions had large areas (Figure 3). The predicted area of the highly suitable area was 2.54 × 10⁶ km2, accounting for 26.46% of the total land area of China, followed by the predicted area of low suitability which was 2.65 × 10⁶ km2, accounting for 27.56% of the total land area; the moderately suitable area covering 8.45 × 10⁵ km2, accounting for 8.80% of the total land area. The total predicted area of suitability for S. nitobei in China was 6.03 × 10⁶ km2, accounting for 62.82% of the total land area of China (Figure 3).
3.4. The Relationship between the Distribution of S. nitobei and the Environmental Variables
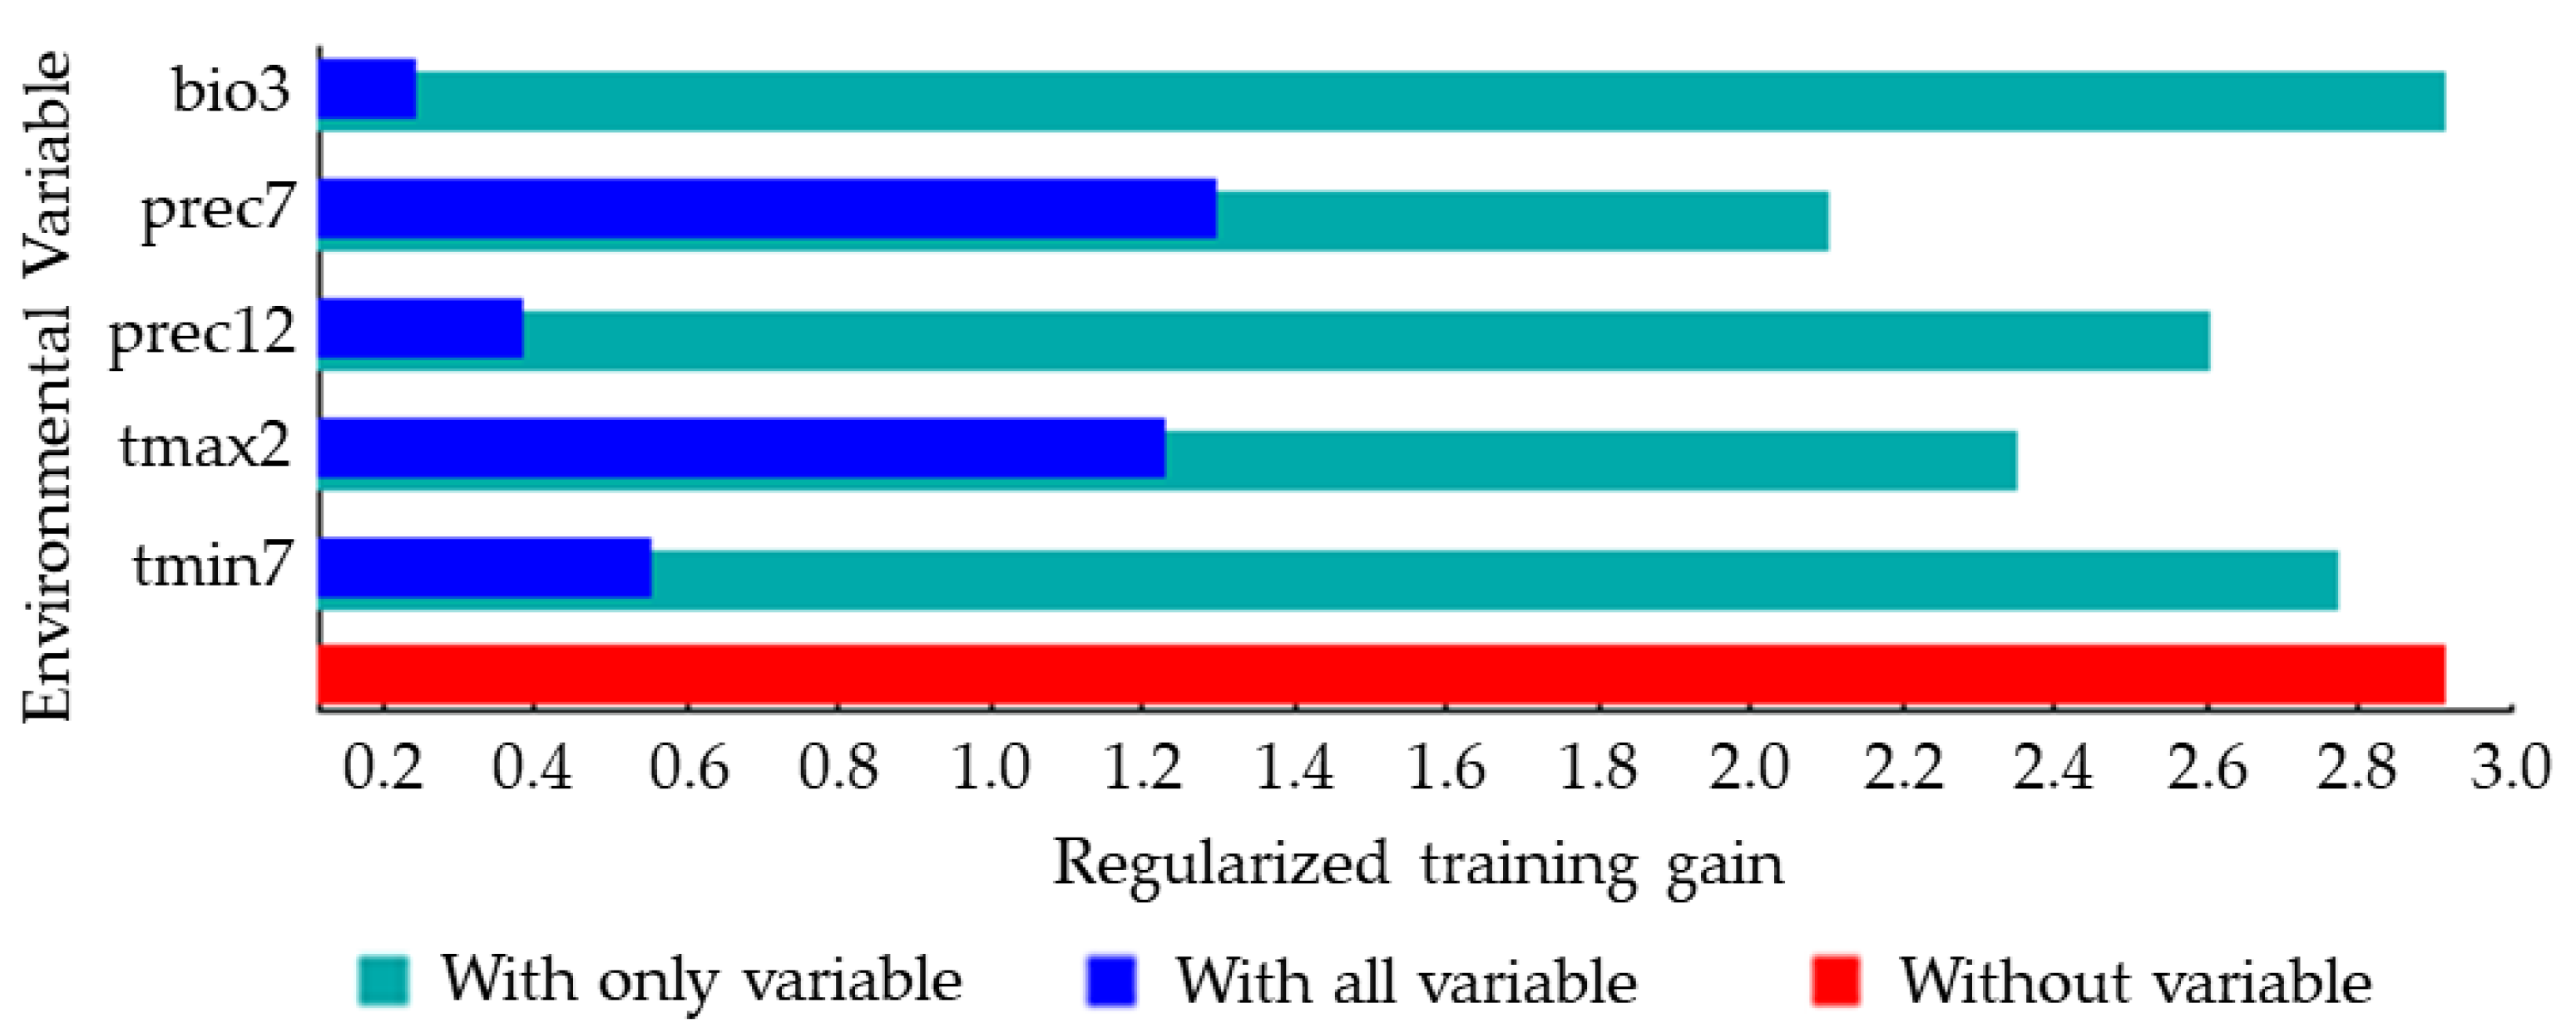
The jackknife method was used to analyze the importance of the five environmental variables that strongly impacted the distribution of S. nitobei (Figure 4). The longer the blue bar, the more influential the variable is to the species distribution, and the shorter the green bar, the more information the variable has compared to others. Among the five environmental variables, the two environmental variables that have a greater impact on the distribution of S. nitobei were the monthly total precipitation in July (prec7) and the maximum temperature in February (tmax2) (Figure 4). In terms of the variables that were most crucial in predicting area suitability for S. nitobei, isothermality (bio3), monthly total precipitation in December (prec12) and the minimum temperature in July (tmin7) contributed significantly and gave the most unique information in predicting area suitability.
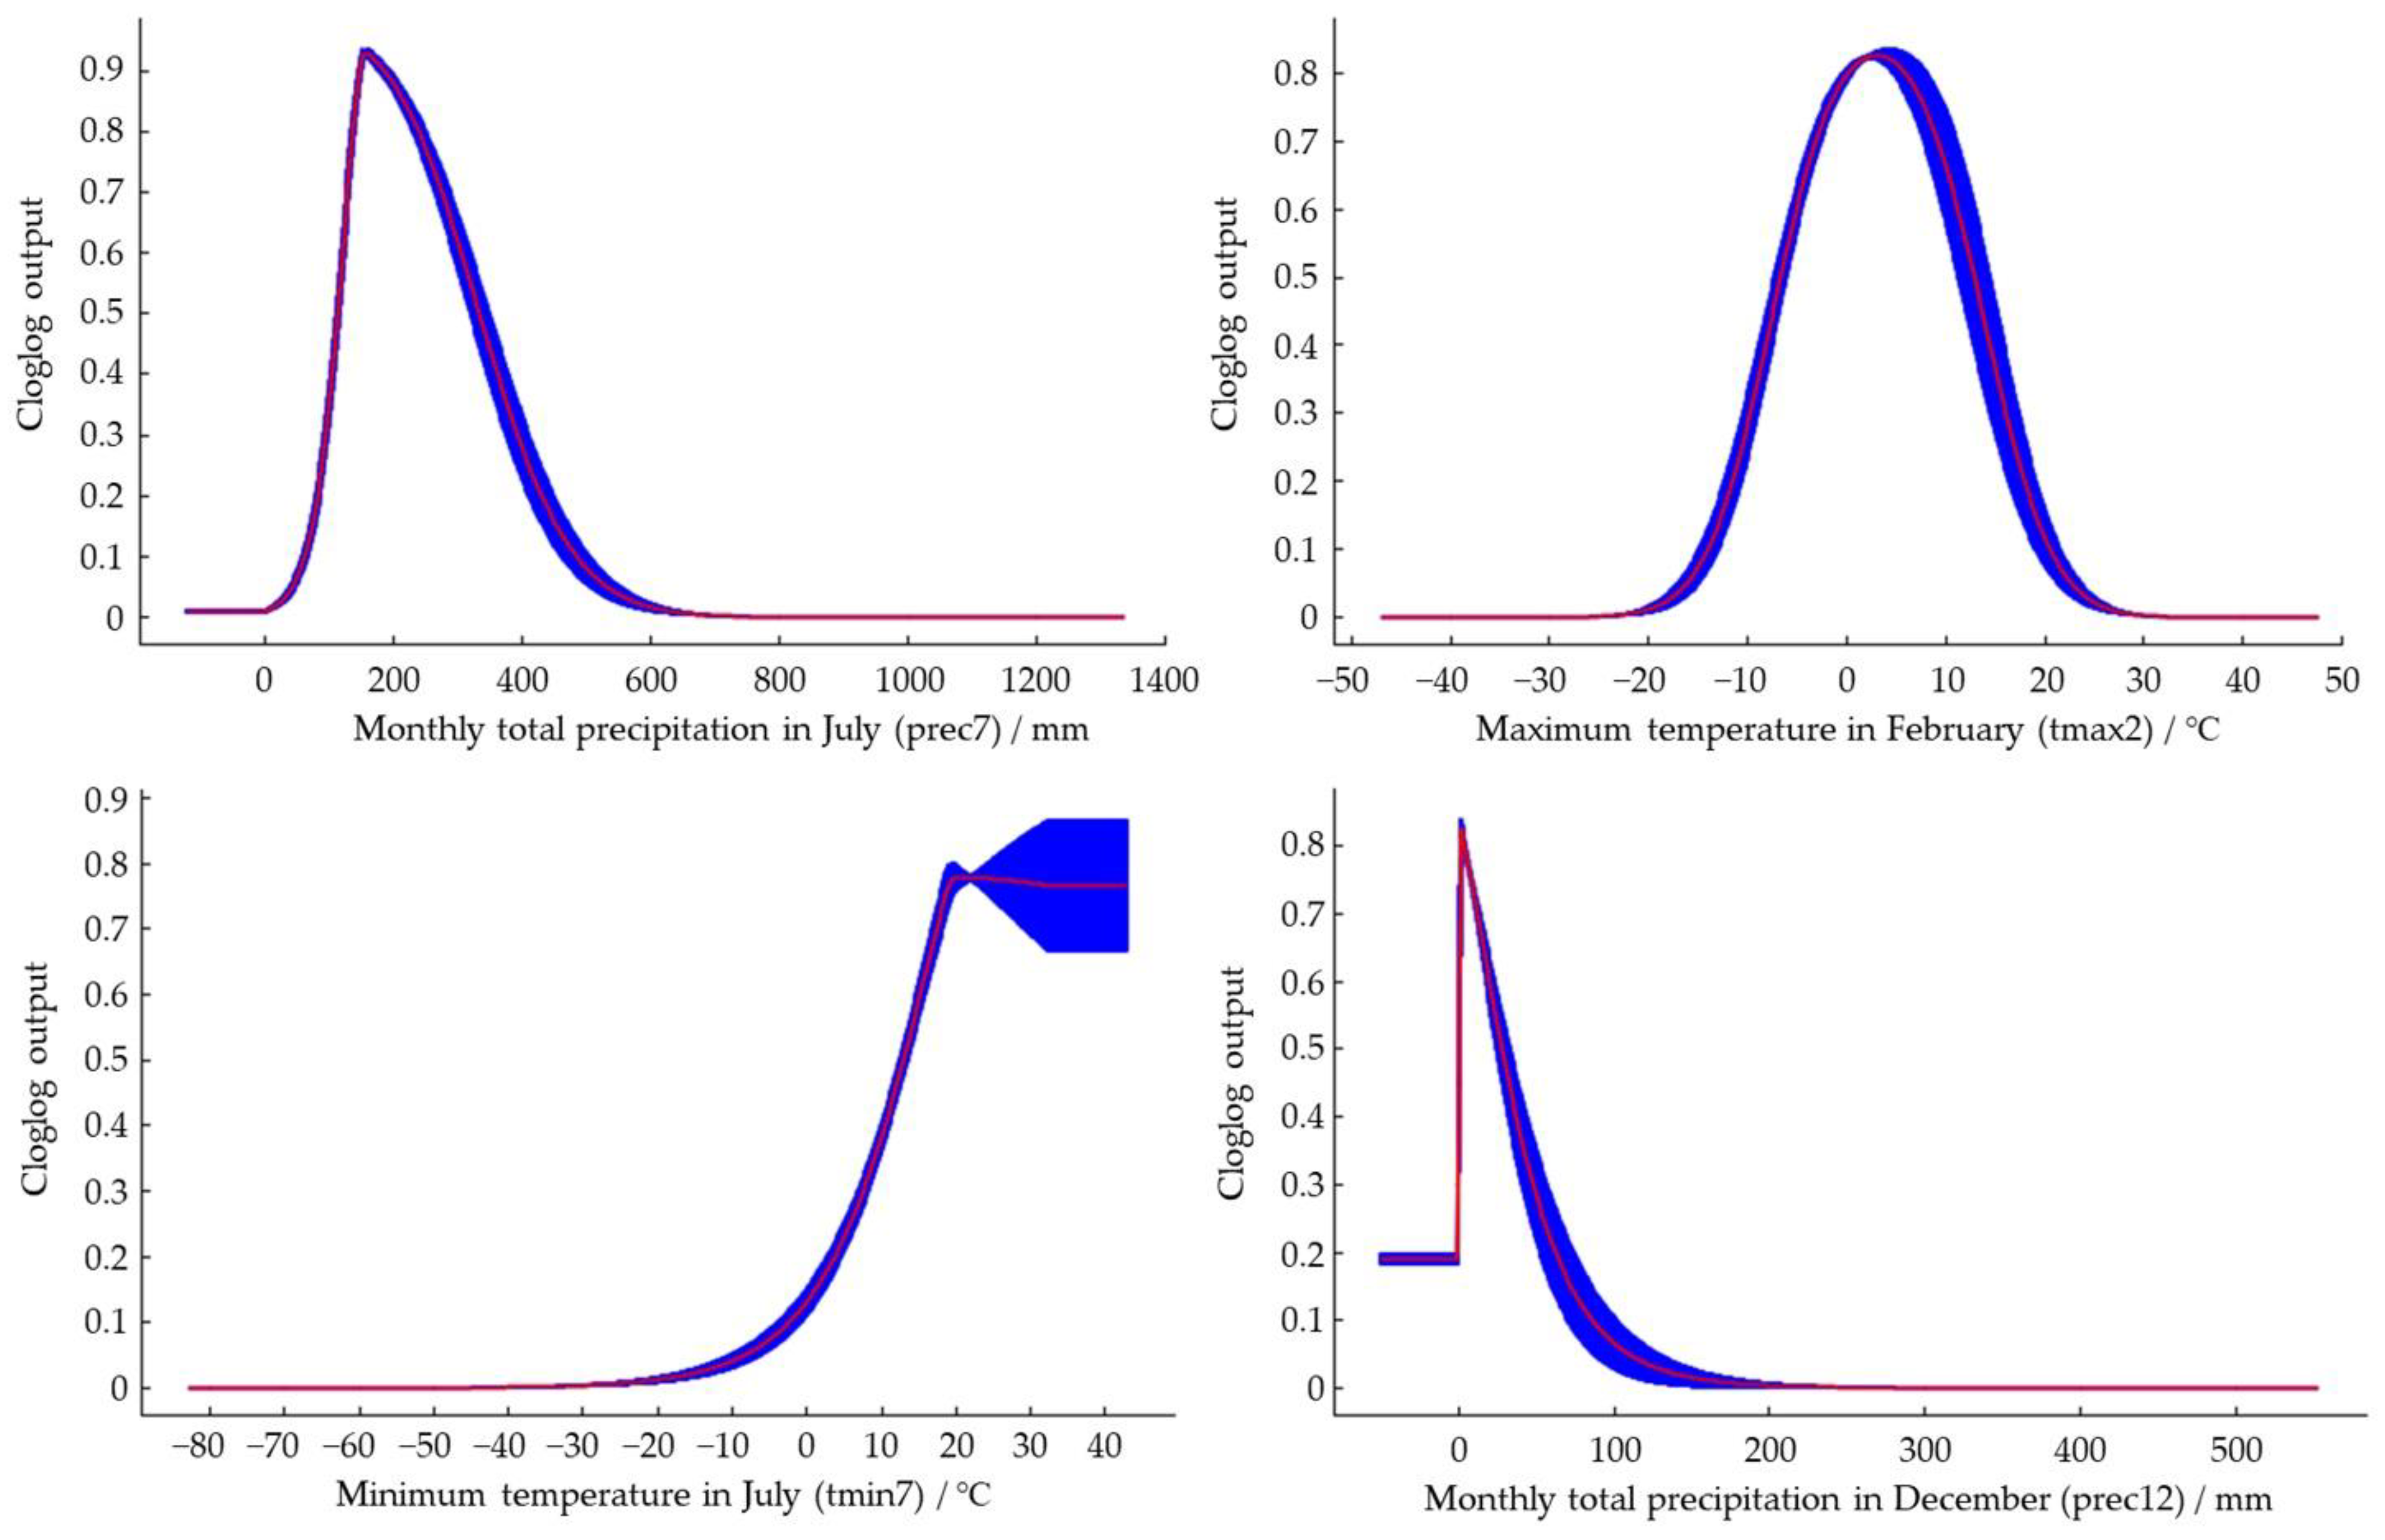
The response curves between the dominant environmental variables and the distribution probability drawn by the maximum entropy model (Figure 5) reflected the range of environmental variables under different thresholds. In this study, LPT was the threshold used to divide the range of potentially suitable distribution of S. nitobei. The results showed that the suitable value of the potentially suitable distribution area under prec7 was 68–469 mm, and the most suitable value was 158 mm of rainfall. When the prec7 was between 68–158 mm of rainfall, the probability of occurrence increased as precipitation increases; and when the prec7 was between 158–469 mm, the probability of occurrence decreases as precipitation increases. Thus, areas of excess rainfall could have a negative influence on the establishment of S. nitobei; the suitable rainfall range for a highly suitable area was predicted to be 122–305 mm with a suitable tmax2 value of −13–19 °C, and the most suitable value was found to be 3 °C. When the tmax2 was −13–3 °C, the probability of occurrence increases with increasing temperature, and when the tmax2 was −3–19 °C, the probability of occurrence decreases with increasing temperature increases. The suitable value for the highly suitable area was −5–11 °C. The suitable value of the tmin7 was greater than 0 °C, and the probability of occurrence increases with increasing temperature. The suitable temperature value for the highly suitable area was greater than 15 °C. The suitable value of the prec12 was 0–78 mm, and the probability of existence decreases with the precipitation increases. The suitable value of the highly suitable area was 0–19 mm.
3.5. Potential Distribution of S. nitobei under Future Climate Conditions
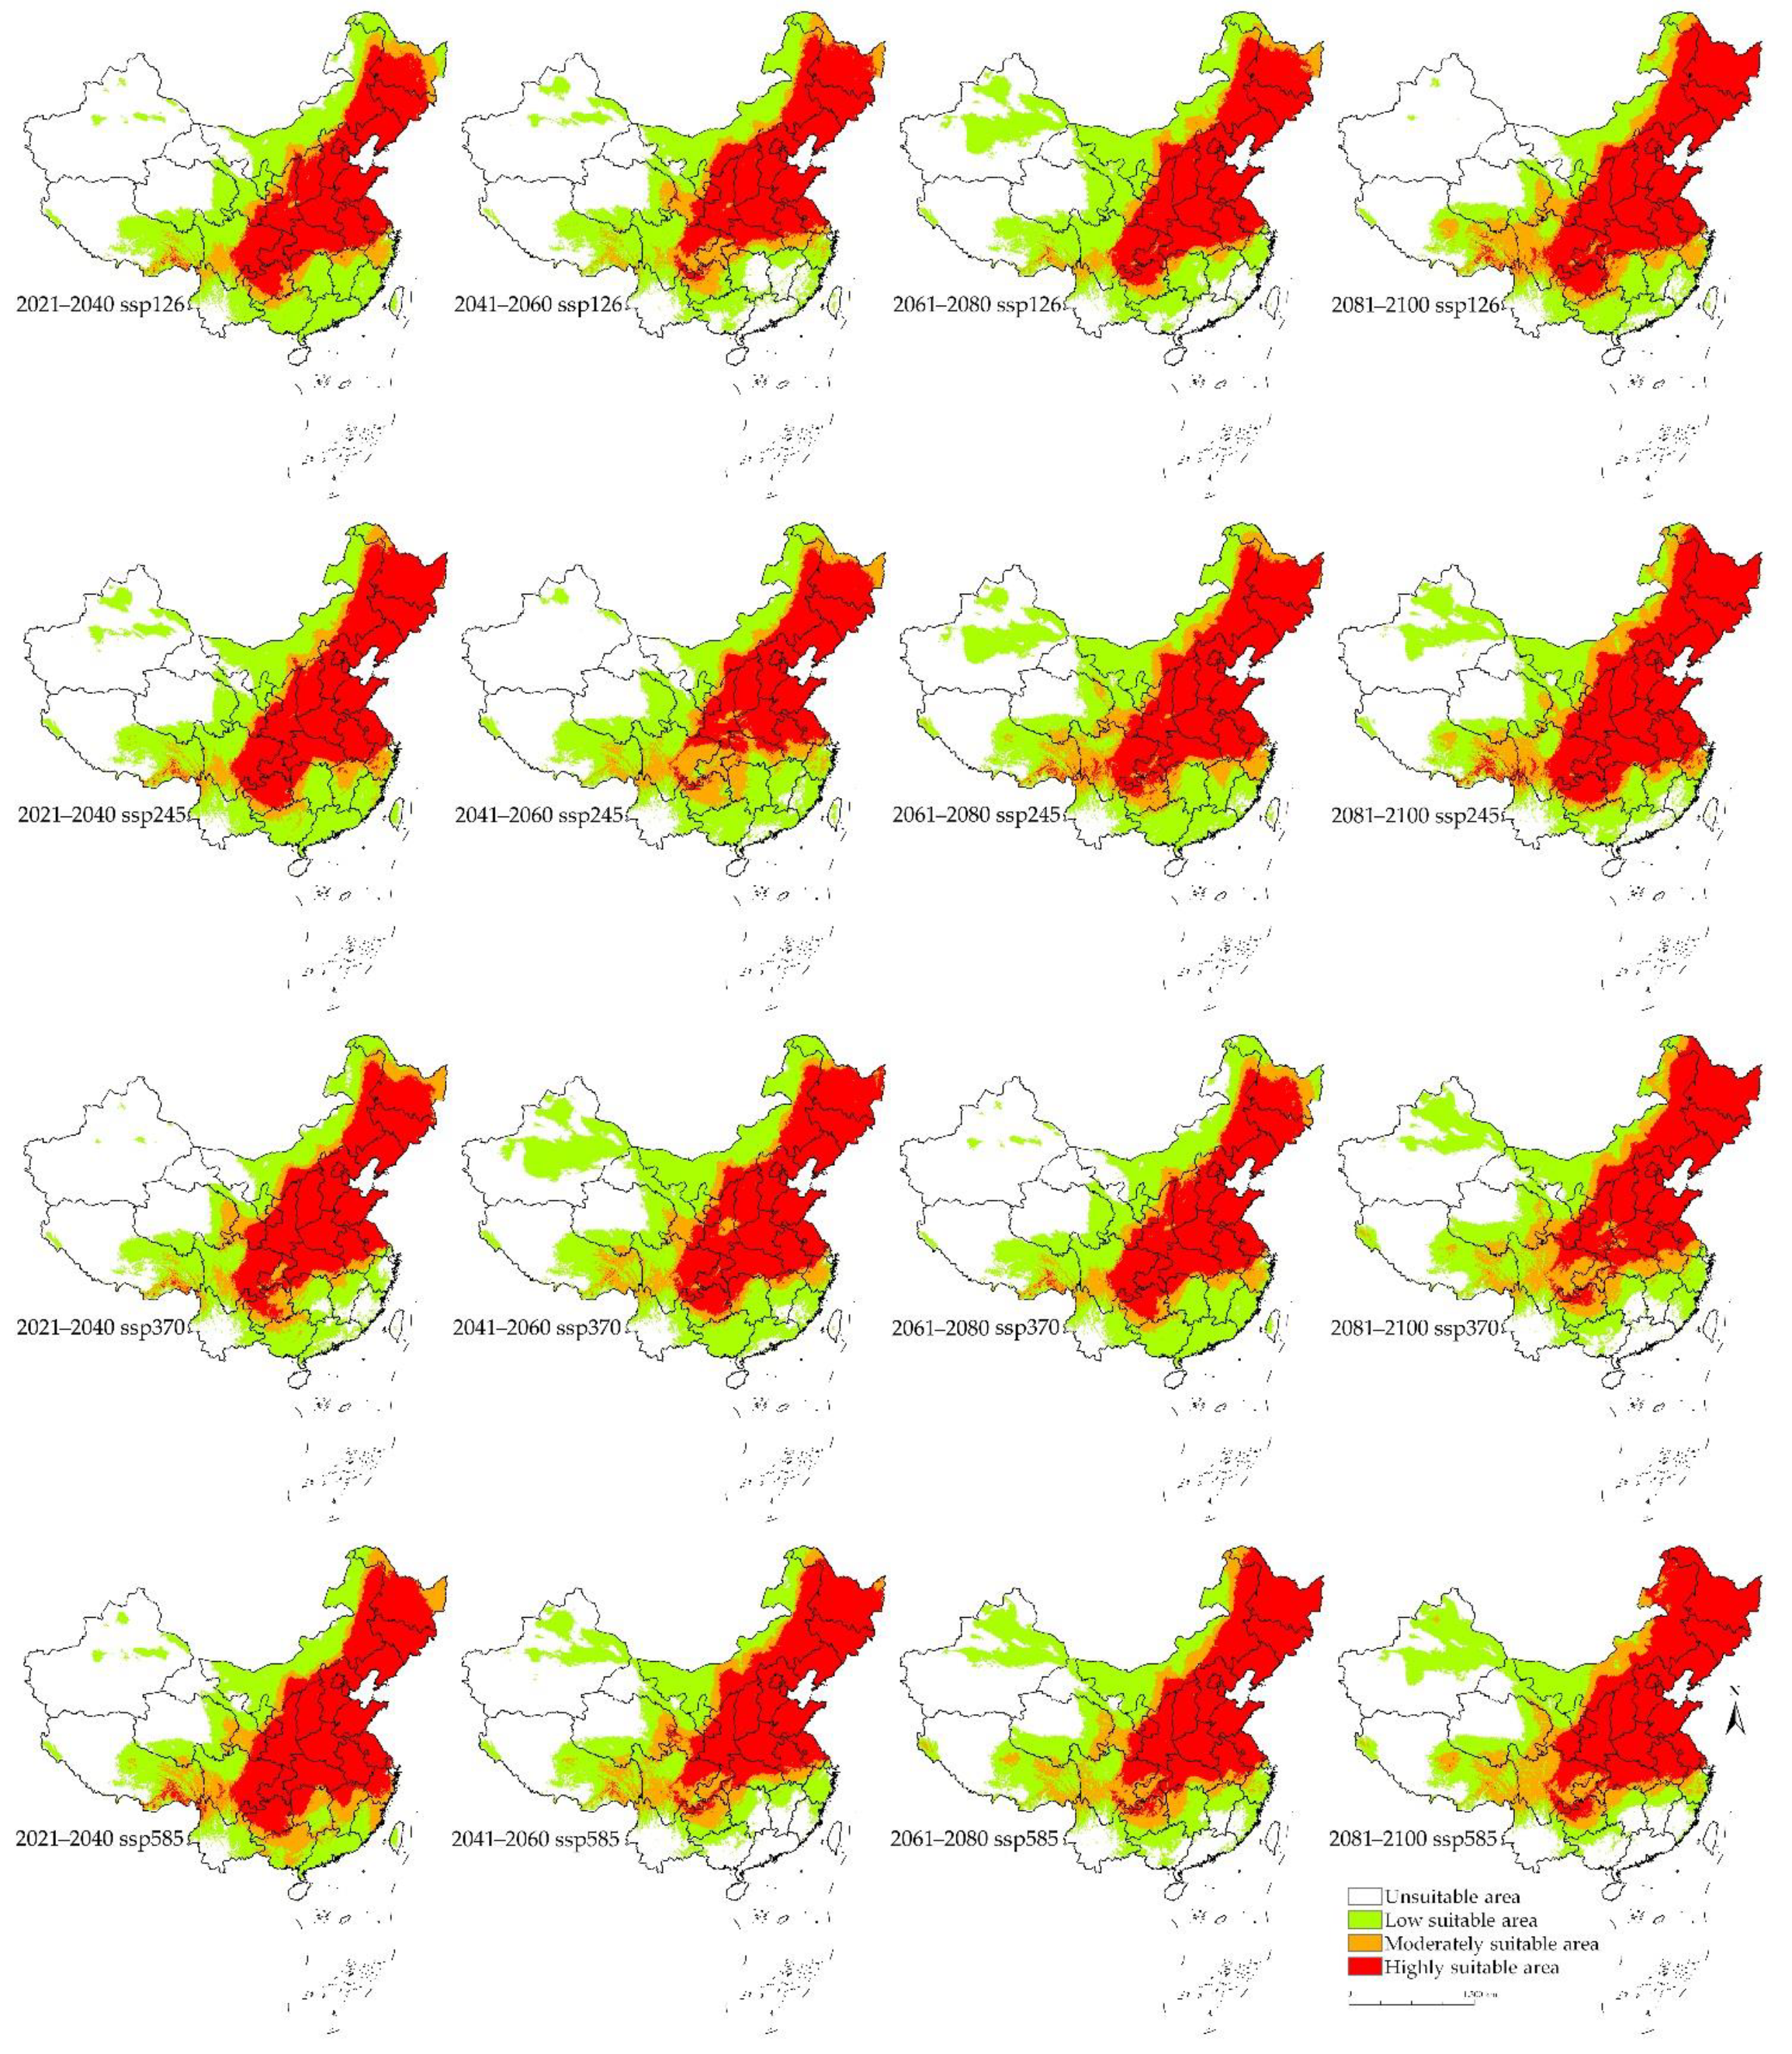
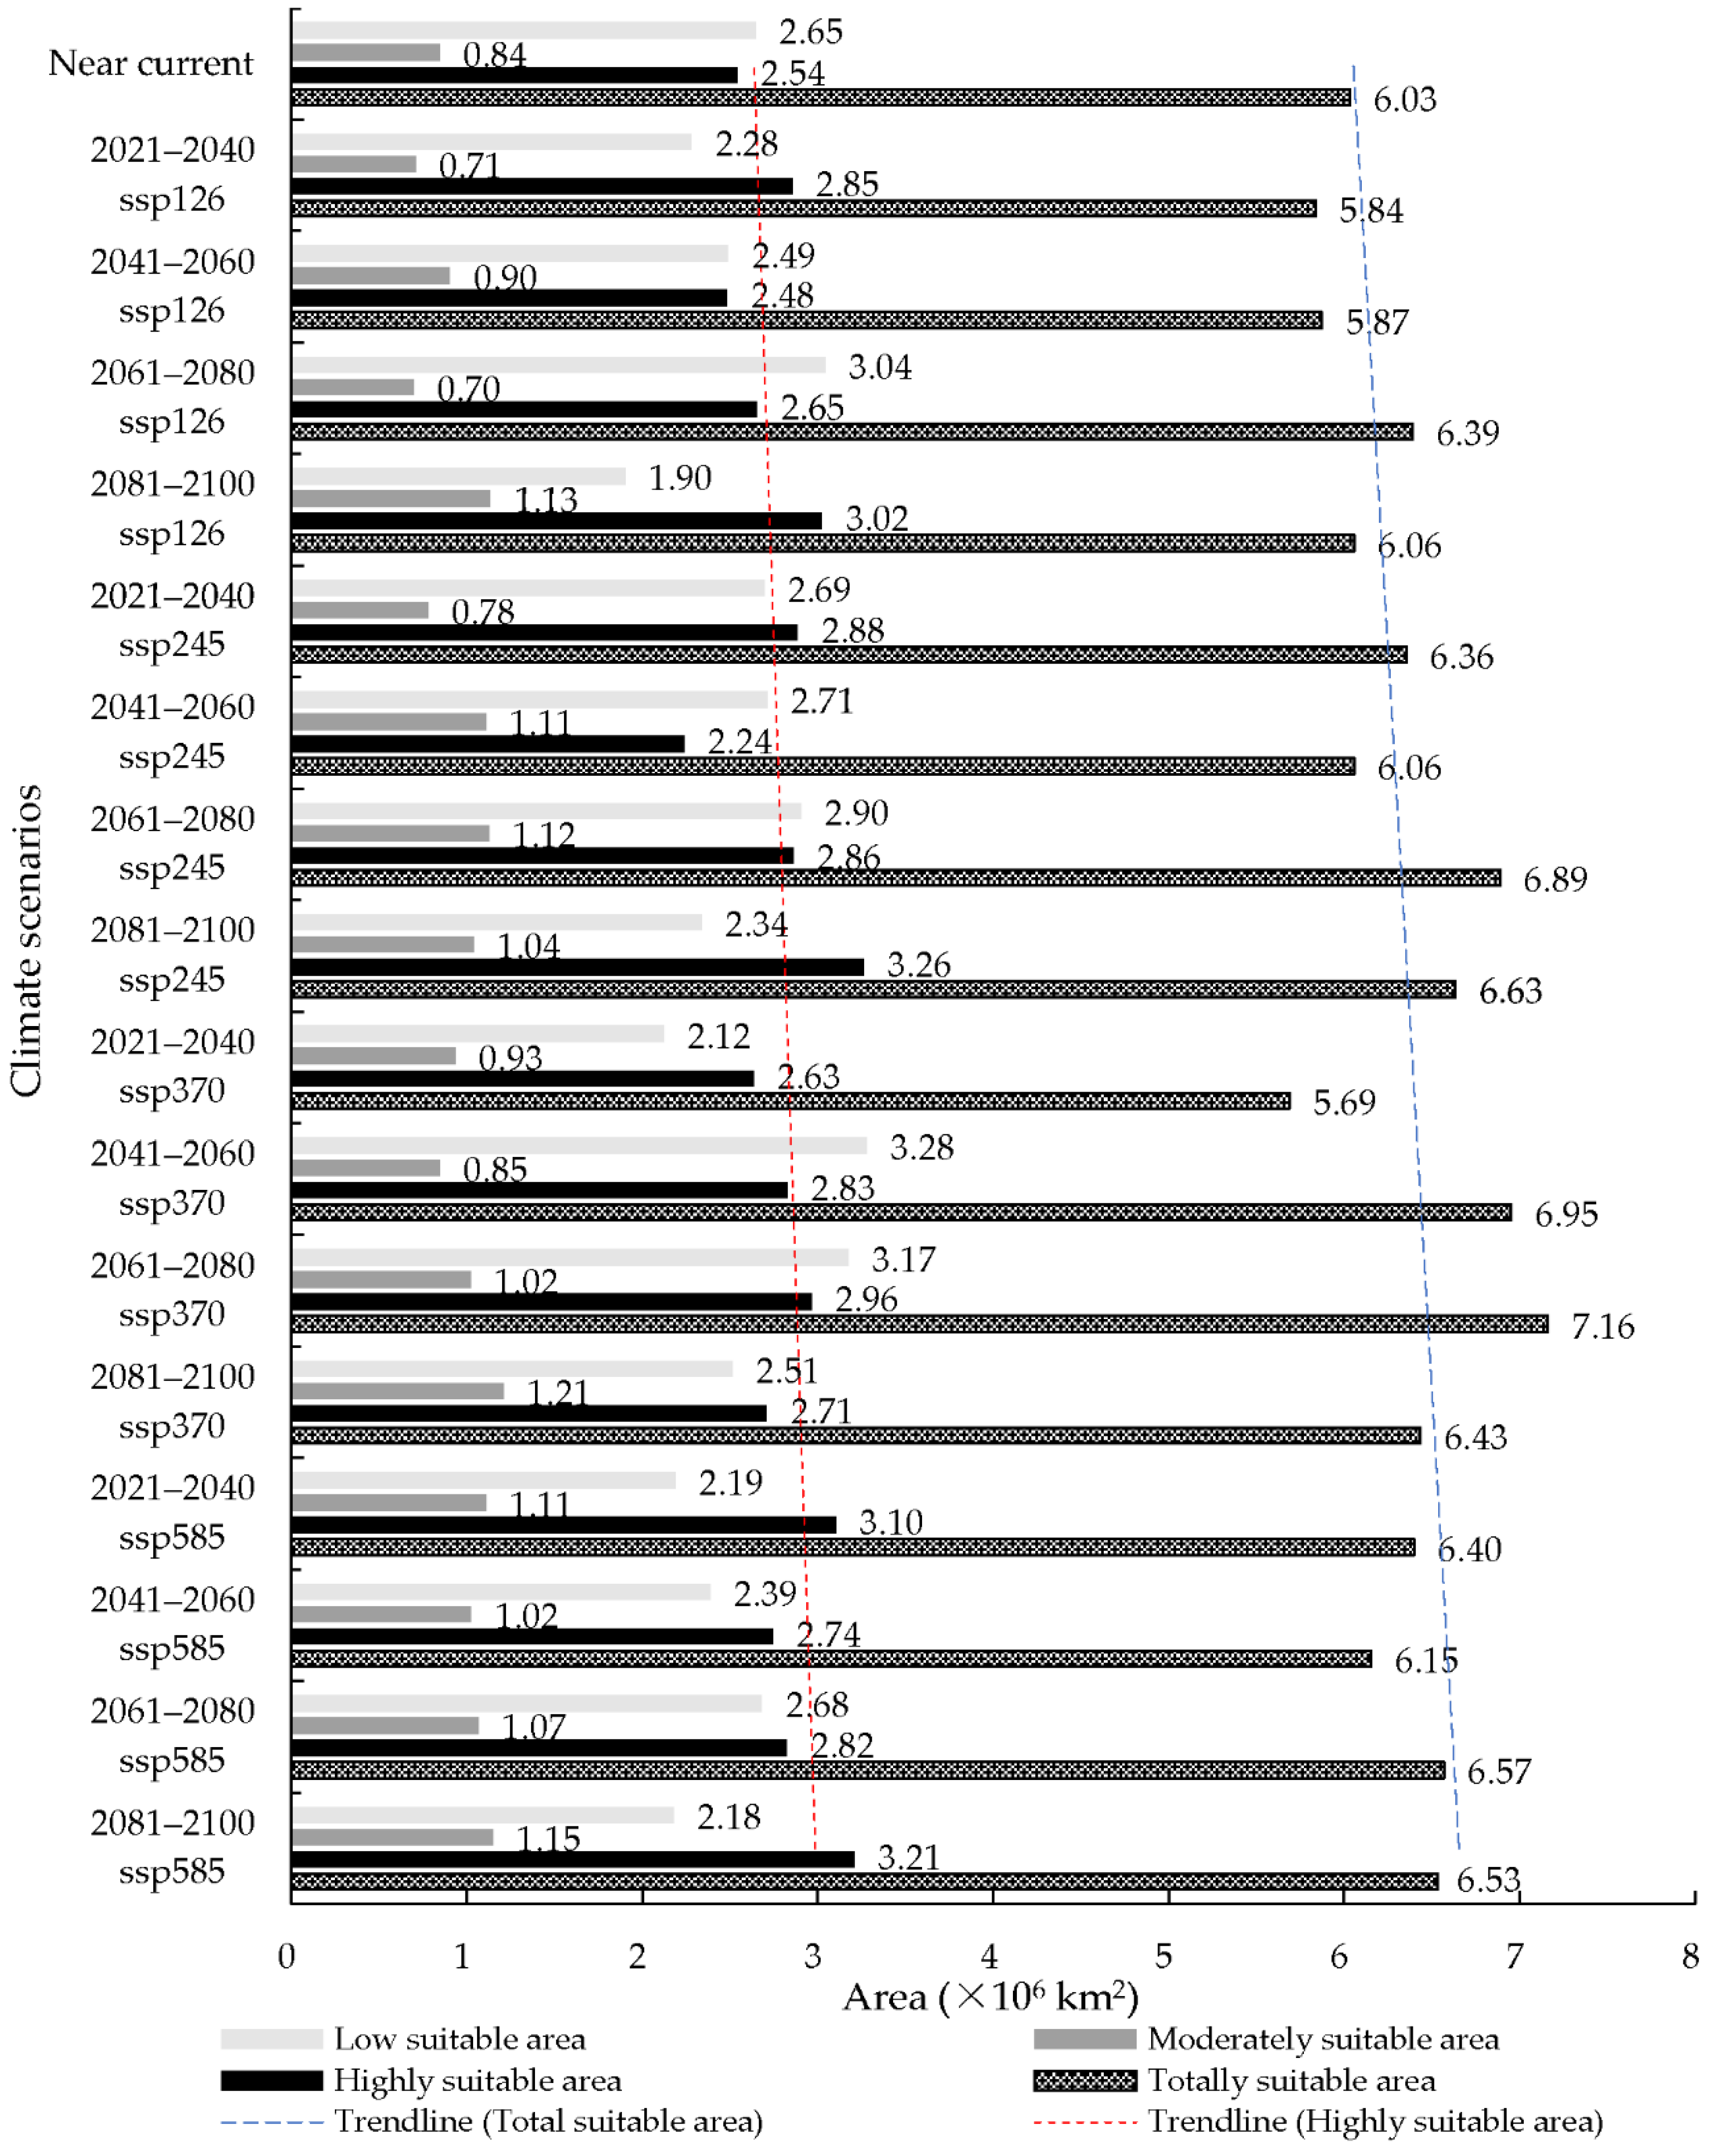
Under the future climate conditions, the periods of 21st century, including 2021–2040, 2041–2060, 2061–2080, and 2081–2010, under four CMIP6 climate scenarios, including ssp126, ssp245, ssp370, and ssp585 showed an increase in predicted area suitability for the distribution of S. nitobei in China, showing potential spread into unsuitable areas which are becoming suitable (Figure 6 and Figure 7). The total predicted area of suitability increases in the period 2061–2080 ssp370 and 2021–2040 ssp370, from 5.69 × 10⁶ km2 to 7.16 × 10⁶ km2, increasing by 18.74% in the former, and decreasing by 5.64% in the latter when compared to the total area of the suitable area under current climate condition. Similarly, the maximum highly suitable area appears in the period 2081–2100 ssp245, reaching an area of 3.26 × 10⁶ km2, with an increase of 28.35% compared to the highly suitable area of the suitable area under current climate condition; while the minimum suitability area was predicted for the period 2041–2060 ssp245, reaching an area of 2.24 × 10⁶ km2, with a decrease of 11.93% in suitable area under current climate condition. The moderately suitable area increased in the period 2081–2100 ssp370, increasing to 1.21 × 10⁶ km2, with an increase of 44.05% compared to current climate condition, while a decrease was noted in the period 2061–2080 ssp126, reaching an area of 6.96 × 10⁵ km2, with a decrease of 16.67% compared to the moderately suitable area under current climate condition. The predicted area of low suitability also shows similar trends, reaching an area of 3.28 × 10⁶ km2 during the period 2041–2060 ssp370, with an increase of 23.77%, while the minimum predicted low suitability area reached was 1.90 × 10⁶ km2 during the period 2081–2100 ssp126, with a decrease of 28.30% compared to the total area of the low suitable area under current climate condition (see Figure 7).
4. Discussion
We found that the wood wasp, S. nitobei, has a high suitability area in China and has the potential to spread to previously unsuitable and moderately suitable areas under future climate change scenarios in the 21st century. In the study, we revisited some of the old records of the species taken during the early 1980s when the species was first recorded. New occurrences were recorded and old ones were deleted and corrected. In our own sampling initiatives, we found that detection of Sirex wood wasp sites of infestation was unique, characterized by circular emergence holes and the teardrop rosin secretion flowing from the emergence holes [47,62,63]. These factors improved the efficiency and accuracy of Sirex wood wasps field investigation. The selected 24 occurrence points covering 14 administrative regions in China. There were 20 occurrence points distributed in a highly suitable area, 2 in the moderately suitable area, and 2 in low suitable area (Figure 3). Maximum entropy is highly reliable as a predictive climate suitability model due to its requirements of small sample sizes and its ability to accurately predict potential distribution based on environmental variables and current cooccurrence data.
4.1. The Association between Environmental Variables and the Potential Spread of S. nitobei
The earliest record of the S. nitobei collection in China was in 1980, and it has now expanded 1750 km southwest, 1450 km northwest, and 2200 km northeast from the earliest discovery place. An adult Sirex wood wasp maximum flight distance was 56 km [64,65]. The excellent flying ability and the continuous large suitable areas explained the long-distance spread of S. nitobei. The four primary environment variables affecting the distribution of S. nitobei were the rainfall in July (prec7), maximum temperature in February (tmax2), minimum temperature in July (tmin7), and rainfall in December (prec12), which showed that S. nitobei had strong environmental adaptability driven by temperature and precipitation. The range of predicted suitable habitats for S. nitobei under the near current climatic conditions was 79°–137° E, 21°–54° N, while the current range of occurrence points was 103°–131° E, 25°–48° N, a large area of occurrence compared to other Sirex wood wasps distributed in China [13,21]. The highly suitable area for S. nitobei under the current climate covers a total area of 6.03 × 10⁶ km2, largely driven by summer rainfall patterns, temperature and isothermality. These areas increase by a great proportion when modeled in future climate scenarios and shared socio-economic paths.
Changes in environmental factors, especially temperature and rainfall, can influence microclimates and influence the habitability of areas for the species. The increased impact of climate change, particularly changes in rainfall and temperature patterns, can influence the survival ability of the species. Here we show that the S. nitobei can increase its distribution range when areas are within the maximum rainfall range of 152 mm and temperatures below 15 °C. S. nitobei may have high flexibility and adaptability in its tolerance to fluctuating environmental conditions. Thus, when the environment of a certain habitat of the S. nitobei destroyed, it could quickly find another suitable habitat. Therefore, its habitat can always be maintained above the minimum area requirements (MAR) required for survival [66,67,68]. This is evident in the increasing suitability of moderately suitable areas under the current climate condition, as well as the future predicted moderately suitable areas. The high adaptability may allow S. nitobei to easily colonize new areas in predicted suitability areas with only a small population [69].
Temperature can significantly affect the reproductive output of insects. Under unfavorable temperatures, eggs and larvae may not survive. Temperature and precipitation have been shown to affect the emergence of S. nitobei larvae as well as the developmental or pupal stages [10,70]. Thus, precipitation (prec7) and minimum temperature in July (tmin7) may affect the critical period that determines larval emergence. Furthermore, the growth conditions of the obligate mutualistic fungus of S. nitobei, A. areolatum, and A. chailletii, are also affected by temperature and moisture. The growth condition of A. areolatum is 0–30 °C [71,72]. The larvae of S. nitobei rely on the obligate mutualistic fungus for nutrition for their growth, while moisture availability affects the growth condition of the fungus. The fungus prefers to grow in wood that has a lower moisture content [18,20]. We show that as precipitation increases, the occurrence of S. nitobei is predicted to decrease, and this could be related to the availability of food for larval development. This is likely because when the wood is too wet, the fungus cannot grow or affect the wood so that it is more palatable for the larvae of S. nitobei. In a similar research, Sun et al., used the maximum entropy model to predict the globally suitable areas of S. noctilio, using environmental variables including the annual mean temperature (bio1), mean temperature of the warmest quarter (bio10), and precipitation of the wettest month (bio13) [34]. These three environmental variables were also affecting the growth of the mature larvae and the pupa, and also could predict potentially suitable areas determined by variation in temperature and precipitation [46]. Therefore, the environmental adaptability of larvae and the obligate mutualistic fungus could influence the distribution of Sirex wood wasps in China, and the spread of Sirex species could be enhanced by climate change patterns associated with low rainfall and high temperatures.
We initially used the maximum entropy model to predict the potentially suitable areas of S. nitobei around the world, and found that the high and moderately suitable areas of S. nitobei are mainly concentrated in China, Japan, South Korea, and North Korea. This was consistent with the information that has been reported [10,11,13,14,62,63]. Besides, there were a few sporadic suitable areas in northeastern India, Nepal, and southeast Russia, around known habitats of S. nitobei, and there was a small range of low or unsuitable areas of S. nitobei in other countries or regions. However, there are no relevant reports on S. nitobei in other countries.
4.2. The Main Factors Affecting the Predictive Accuracy of the Maximum Entropy Model
We found maximum entropy model to be highly effective and accurate in predicting the potentially suitable areas of S. nitobei in China. The model yielded high AUC variables, and although using the AUC value to verify the predictive accuracy of maximum entropy model is controversial [59,60,73], we did not find a significant difference between the AUC value and AUC ratios under different climate conditions in this study. The AUC values and AUC ratio were greater than 0.9 and 1.0, indicating the predictive accuracies were very good (Table 2, Figure 2). In this study, the maximum entropy model was confirmed to reliably predict the suitable area of S. nitobei by using a wide range but a small sample size of occurrence points [74]. Moreover, it is important to incorporate up to date and relevant climate and environmental data when using distribution models. Here we used the updated WorldClim database with near current and future climate variables, which gave predictions that are much closer to reality and have biological relevance. However, there are still challenges and a 20-year gap with the current timeline, which means that there are still restrictions for predicting the potentially suitable area of the species as researchers cannot get the latest climate database.
4.3. The Suitable Area of S. nitobei under the Future Climate Conditions and the Suggestions about the Pest Control
Comparing the range of the potentially suitable area of S. nitobei under the future climate conditions with the near current climate condition, the area of the total suitable area was increasing under the four CMPI6 climate scenarios, with an increase of 18.74% in total suitable area under climate scenario 2061–2080 ssp370; an increase in land area from 6.03 × 10⁶ km2 to 7.16 × 10⁶ km2 predicted potential total suitable area. The percentage of increase in the area of the highly suitable area was 28.35% and that of moderately suitable area was 44.05%, showing a more rapid increase in suitability under the scenarios 2081–2100 ssp245 and 2081–2100 ssp370; while under the same climate scenarios, low suitability areas increased by 23.77%. Overall, in the climate scenarios of the period 2021–2040 ssp370, 2041–2060 ssp245, 2061–2080 ssp126, and 2081–2100 ssp126, there is a general decrease in the suitability area of S. nitobei, which could be associated with high rainfall patterns and temperature variations in these periods and currently shared socioeconomic pathways, which would affect the lifecycle of S. nitobei as well as its obligate mutualistic fungus. The most apparent increase and decrease in the suitable areas were in Jiangxi, Hunan, Guangdong, Inner Mongolia, Tibet, and Xinjiang. The time interval of the 21st century periods under four CMIP6 climate scenarios is ten years, and thus within ten years, the area of the suitable area would not change significantly. As a result, the potentially suitable area under the scenario ssp585 might present a more realistic result.
Sirex wood wasps are highly adaptable and can spread easily due to their distance dispersal abilities. In terms of possible measures for pest control strategies that can be employed to control S. nitobei, we suggest that quarantine should be formulated to prevent spread. S. nitobei showed high levels of adaptability and likely to have physiological tolerance to highly variable environmental conditions. Under future climate change scenarios, the species is likely to spread widely as more areas become more suitable and habitable through favorable environmental conditions.
5. Conclusions
We found that maximum entropy model is effective in predicting the potential suitable areas of S. nitobei in China, despite the given small sample sizes. Incorporation of near current and future climate scenarios allowed for a better predictive outcome and enabled the precise identification of important environmental variables driving current and potential future suitable areas, particularly the shared socioeconomic pathways ssp126, ssp245, ssp370, and ssp585. As expected, temperature and precipitation were very important in predicting the potential suitable areas of S. nitobei, which could be related to the biological requirements for reproduction and larval development, as well as the growth requirements of its obligate mutualistic fungus. Under the future climate conditions, the total area and the area of suitable areas for S. nitobei will increase continually, with noticeable changes in areas such as Inner Mongolia, Tibet, and Xinjiang. The pest control of S. nitobei should focus on these areas where multiple types of Sirex wood wasps jointly infest the host plants, and the distribution needs to be continuously mapped.
Author Contributions
Conceptualization, T.G. and J.S.; Methodology, Y.L. and J.Z.; Software, T.G. and Y.L.; Data collection, Q.X.; Writing—original draft preparation, T.G.; Writing—review and editing, J.S.; Supervision, J.S.; Project administration, J.S.; Funding acquisition, J.S. All authors have read and agreed to the published version of the manuscript.
Funding
This research was supported by General Program of National Natural Science Foundation of China (No. 31770687).
Data Availability Statement
Data sharing is not applicable to this article.
Acknowledgments
We acknowledge the groups of ArcGIS, MaxEnt, and WorldClim for their contribution in making this simulation possible. Additionally, we also thank Teddy of Unité de Recherche de Zoologie Forestière (URZF), l’Institut national de recherche pour l’agriculture, l’alimentation et l’environnement (INRAE) Orléans for helpful suggestions. Last but not least, we would like to thank anonymous reviewers for valuable comments that helped us to improve the quality of this article.
Conflicts of Interest
The authors declare no conflict of interest.
References
- Pimentel, D.; Zuniga, R.; Morrison, D. Update on the environmental and economic costs associated with alien-invasive species in the United States. Ecol. Econ. 2005, 52, 273–288. [Google Scholar] [CrossRef]
- Vilà, M.; Espinar, J.L.; Hejda, M.; Hulme, P.E.; Jarošík, V.; Maron, J.L.; Pergl, J.; Schaffner, U.; Sun, Y.; Pyšek, P. Ecological impacts of invasive alien plants: A meta-analysis of their effects on species, communities and ecosystems. Ecol. Lett. 2011, 14, 702–708. [Google Scholar] [CrossRef]
- Mack, R.; Smith, M. Invasive plants as catalysts for the spread of human parasites. NeoBiota 2011, 9, 13–29. [Google Scholar] [CrossRef] [Green Version]
- Vanbergen, A.J.; Espíndola, A.; Aizen, M.A. Risks to pollinators and pollination from invasive alien species. Nat. Ecol. Evol. 2018, 2, 16–25. [Google Scholar] [CrossRef] [Green Version]
- Vilà, M.; Corbin, J.D.; Dukes, J.S.; Pino, J.; Smith, S.D. Linking Plant Invasions to Global Environmental Change. In Terrestrial Ecosystems in a Changing World; Springer: Berlin/Heidelberg, Germany, 2007; pp. 93–102. [Google Scholar]
- Richardson, D.M.; Pyšek, P.; Rejmánek, M.; Barbour, M.G.; Panetta, F.D.; West, C.J. Naturalization and invasion of alien plants: Concepts and definitions. Divers. Distrib. 2000, 6, 93–107. [Google Scholar] [CrossRef]
- Early, R.; Bradley, B.A.; Dukes, J.S.; Lawler, J.J.; Olden, J.D.; Blumenthal, D.M.; Gonzalez, P.; Grosholz, E.D.; Ibañez, I.; Miller, L.P.; et al. Global threats from invasive alien species in the twenty-first century and national response capacities. Nat. Commun. 2016, 7, 1–9. [Google Scholar] [CrossRef]
- Husch, P.E.; Ferreira, D.G.; Seraphim, N.; Harvey, N.; Silva-Brandão, K.L.; Sofia, S.H.; Sosa-Gómez, D.R. Structure and genetic variation among populations of E uschistus heros from different geographic regions in Brazil. Entomol. Exp. Appl. 2018, 166, 191–203. [Google Scholar] [CrossRef] [Green Version]
- Kenis, M.; Branco, M. Impact of alien terrestrial arthropods in Europe. Chapter 5. BioRisk 2010, 4, 51–71. [Google Scholar] [CrossRef] [Green Version]
- Fukuda, H.; Hijii, N. Different parasitism patterns of two hymenopterous parasitoids (Ichineumonidae and Ibaliidae) depending on the development of Sirex nitobei (Hym., Siricidae). J. Appl. Entomol. 1996, 120, 301–305. [Google Scholar] [CrossRef]
- Kobayashi, T.; Sasaki, K.; Enda, N. Correlation between Sirex nitobei and Amylostereum areolatum, associated with the death of Japanese pine trees during winter season. J. Jpn. For. Soc. 1978, 60, 405–411. [Google Scholar]
- Taeger, A.; Blank, S.M.; Liston, A.D. World catalog of symphyta (hymenoptera). Zootaxa 2010, 2580, 1–1064. [Google Scholar] [CrossRef] [Green Version]
- Xiao, G.R.; Huang, X.Y.; Zhou, S.Z.; Wu, J.; Zhang, P. Siricidae; Economic Sawfly Fauna of China (Hymenoptera, Symphyta); Tianze Eldonejo: Xi’an, China, 1991; pp. 37–42. [Google Scholar]
- Fukuda, H.; Kajimura, H.; Hijii, N. Fecundity of the woodwasp, Sirex nitobei Matsumura, in relation to its body size. J. Jpn. For. Soc. 1993, 75, 405–408. [Google Scholar]
- Wang, M.; Wang, L.X.; Li, D.P.; Fu, N.N.; Li, C.C.; Luo, Y.Q.; Ren, L.L. Advances in the Study of Mutualism Relationship Between Amylostereum areolatum and Sirex noctilio. J. Temp. For. Res. 2020, 3, 1–11. [Google Scholar]
- Morgan, F.D. Bionomics of siricidae. Annu. Rev. Entomol. 1968, 13, 239–256. [Google Scholar] [CrossRef]
- Cartwright, K.S.G. A further note on fungus association in the Siricidae. Ann. Appl. Biol. 1938, 25, 430–432. [Google Scholar] [CrossRef]
- Coutts, M.P. The mechanism of pathogenicity of Sirex noctilio on Pinus radiata II. Effects of S. noctilio mucus. Aust. J. Biol. Sci. 1969, 22, 1153–1162. [Google Scholar] [CrossRef]
- Coutts, M.P.; Dolezal, J.E. Sirex noctilio, its associated fungus, and some aspects of wood moisture content. Aust. For. Res. 1965, 1, 3–13. [Google Scholar]
- Coutts, M.P. The mechanism of pathogenicity of Sirex noctilio on Pinus radiata I. Effects of the symbiotic fungus Amylostereum sp. (Thelophoraceae). Aust. J. Biol. Sci. 1969, 22, 915–924. [Google Scholar] [CrossRef] [Green Version]
- Li, D.P.; Shi, J.; Lu, M.; Ren, L.L.; Zhen, C.A.; Luo, Y.Q. Detection and identification of the invasive Sirex noctilio (Hymenoptera: Siricidae) fungal symbiont, Amylostereum areolatum (Russulales: Amylostereacea), in China and the stimulating effect of insect venom on laccase production by A. areolatum YQL03. J. Econ. Entomol. 2015, 108, 1136–1147. [Google Scholar] [CrossRef]
- Phillips, S.J.; Anderson, R.P.; Schapire, R.E. Maximum entropy modeling of species geographic distributions. Ecol. Model. 2006, 190, 231–259. [Google Scholar] [CrossRef] [Green Version]
- Phillips, S.J.; Dudík, M. Modeling of species distributions with Maxent: New extensions and a comprehensive evaluation. Ecography 2008, 31, 161–175. [Google Scholar] [CrossRef]
- Merow, C.; Smith, M.J.; Silander, J.A., Jr. A practical guide to MaxEnt for modeling species’ distributions: What it does, and why inputs and settings matter. Ecography 2013, 36, 1058–1069. [Google Scholar] [CrossRef]
- Phillips, S.J.; Anderson, R.P.; Dudík, M.; Schapire, R.E.; Blair, M.E. Opening the black box: An open-source release of Maxent. Ecography 2017, 40, 887–893. [Google Scholar] [CrossRef]
- Liu, Y.; Shi, J. Predicting the Potential Global Geographical Distribution of Two Icerya Species under Climate Change. Forests 2020, 11, 684. [Google Scholar] [CrossRef]
- Lin, L.L.; He, J.; Xie, L.; Cui, G.F. Prediction of the Suitable Area of the Chinese White Pines (Pinus subsect. Strobus) under Climate Changes and Implications for Their Conservation. Forests 2020, 11, 996. [Google Scholar] [CrossRef]
- Kotlov, I.; Chernenkova, T. Modeling of Forest Communities’ Spatial Structure at the Regional Level through Remote Sensing and Field Sampling: Constraints and Solutions. Forests 2020, 11, 1088. [Google Scholar] [CrossRef]
- Pandit, K.; Smith, J.; Quesada, T.; Villari, C.; Johnson, D.J. Association of Recent Incidence of Foliar Disease in Pine Species in the Southeastern United States with Tree and Climate Variables. Forests 2020, 11, 1155. [Google Scholar] [CrossRef]
- Elith, J.; Phillips, S.J.; Hastie, T.; Dudík, M.; Chee, Y.E.; Yates, C.J. A statistical explanation of MaxEnt for ecologists. Divers. Distrib. 2011, 17, 43–57. [Google Scholar] [CrossRef]
- Ahmed, S.E.; McInerny, G.; O’Hara, K.; Harper, R.; Salido, L.; Emmott, S.; Joppa, L.N. Scientists and software–surveying the species distribution modelling community. Divers. Distrib. 2015, 21, 258–267. [Google Scholar] [CrossRef]
- Farashi, A.; Kaboli, M.; Karami, M. Predicting range expansion of invasive raccoons in northern Iran using ENFA model at two different scales. Ecol. Inform. 2013, 15, 96–102. [Google Scholar] [CrossRef]
- Fischbein, D.; Lantschner, M.V.; Corley, J.C. Modelling the distribution of forest pest natural enemies across invaded areas: Towards understanding the influence of climate on parasitoid establishment success. Biol. Control 2019, 132, 177–188. [Google Scholar] [CrossRef]
- Sun, X.T.; Xu, Q.; Luo, Y.Q. A Maximum Entropy Model Predicts the Potential Geographic Distribution of Sirex noctilio. Forests 2020, 11, 175. [Google Scholar] [CrossRef] [Green Version]
- Fick, S.E.; Hijmans, R.J. WorldClim 2: New 1 km spatial resolution climate surfaces for global land areas. Int. J. Climatol. 2017, 37, 4302–4315. [Google Scholar] [CrossRef]
- Hijmans, R.J.; Cameron, S.E.; Parra, J.L.; Jones, P.G.; Jarvis, A. Very high resolution interpolated climate surfaces for global land areas. Int. J. Climatol. A J. R. Meteorol. Soc. 2005, 25, 1965–1978. [Google Scholar] [CrossRef]
- Harris, R.M.B.; Grose, M.R.; Lee, G.; Bindoff, N.L.; Porfirio, L.L.; Fox-Hughes, P. Climate projections for ecologists. Wiley Interdiscip. Rev. Clim. Chang. 2014, 5, 621–637. [Google Scholar] [CrossRef]
- Moss, R.H.; Edmonds, J.A.; Hibbard, K.A.; Manning, M.R.; Rose, S.K.; Vuuren, D.P.V.; Carter, T.R.; Emori, S.; Kainuma, M.; Kram, T.; et al. The next generation of scenarios for climate change research and assessment. Nature 2010, 463, 747–756. [Google Scholar] [CrossRef] [PubMed]
- Vuuren, D.P.V.; Edmonds, J.; Kainuma, M.; Riahi, K.; Thomson, A.; Hibbard, K.; Hurtt, G.C.; Kram, T.; Krey, V.; Lamarque, J.-F.; et al. The representative concentration pathways: An overview. Clim. Chang. 2011, 109, 5–13. [Google Scholar] [CrossRef]
- Fan, X.W.; Miao, C.Y.; Duan, Q.Y.; Shen, C.W.; Wu, Y. The performance of CMIP6 versus CMIP5 in simulating temperature extremes over the global land surface. J. Geophys. Res. Atmos. 2020, 125, e2020JD033031. [Google Scholar] [CrossRef]
- Xin, X.G.; Wu, T.W.; Zhang, J.; Zhang, F.; Li, W.P.; Zhang, Y.W.; Lu, Y.X.; Fang, Y.J.; Jie, W.H.; Zhang, L.; et al. Comparison of simulation results of the Arctic sea ice by BCC_CSM: CMIP5 and CMIP6 historical experiments. Haiyang Xuebao 2020, 42, 49–64. [Google Scholar]
- Xin, X.G.; Wu, T.W.; Zhang, J.; Zhang, F.; Li, W.P.; Zhang, Y.W.; Lu, Y.X.; Fang, Y.J.; Jie, W.H.; Zhang, L.; et al. Introduction of BCC models and its participation in CMIP6. Adv. Clim. Chang. Res. 2019, 15, 533–539. [Google Scholar]
- Wu, X.Z. A preliminary study on Sirex rufi-abomins. Sci. Silvae Sin. 1985, 21, 315–318. [Google Scholar]
- Fu, G.S.; Xu, F.Y.; Ge, M.H. A preliminary study on Sirex juvencus imperialis Kirby and its parasitical natural enemy Ibalia leucospoided. J. Nanjing For. Univ. 1995, 19, 42–46. [Google Scholar]
- Du, W.G.; Jiao, J.W.; Wang, Q.Y. Brief Report on Luring and Collecting Sirex nitobei by Trap Log. Heilongjiang Agric. Sci. 2011, 5, 57–58. [Google Scholar]
- Wang, M.; Bao, M.; Ao, T.G.; Ren, L.L.; Luo, Y.Q. Population distribution patterns and ecological niches of two Sirex species damaging Pinus sylvestris var. mongolica. Chin. J. Appl. Entomol. 2017, 54, 924–932. [Google Scholar]
- Lu, Z.B.; Gao, T.; Shui, S.Y.; Shi, H.L.; Ren, L.L.; Shi, J. Biological characteristics of Sirex nitobei (Hymenoptera: Siricidae) on the Hasi mountain natural Pinus tabuliformis forest in Gansu province. J. Northwest For. Univ. 2018, 33, 158–161. [Google Scholar]
- Guevara, L.; Gerstner, B.E.; Kass, J.M.; Anderson, R.P. Toward ecologically realistic predictions of species distributions: A cross-time example from tropical montane cloud forests. Glob. Chang. Biol. 2018, 24, 1511–1522. [Google Scholar] [CrossRef]
- Hortal, J.; Roura-Pascual, N.; Sanders, N.J.; Rahbek, C. Understanding (insect) species distributions across spatial scales. Ecography 2010, 33, 51–53. [Google Scholar] [CrossRef]
- Sillero, N. What does ecological modelling model? A proposed classification of ecological niche models based on their underlying methods. Ecol. Model. 2011, 222, 1343–1346. [Google Scholar] [CrossRef]
- Anderson, R.P.; Gonzalez, I., Jr. Species-specific tuning increases robustness to sampling bias in models of species distributions: An implementation with Maxent. Ecol. Model. 2011, 222, 2796–2811. [Google Scholar] [CrossRef]
- Verbruggen, H.; Tyberghein, L.; Belton, G.S.; Mineur, F.; Jueterbock, A.; Hoarau, G.; Gurgel, C.F.D.; De Clerck, O. Improving transferability of introduced species’ distribution models: New tools to forecast the spread of a highly invasive seaweed. PLoS ONE 2013, 8, e68337. [Google Scholar] [CrossRef] [Green Version]
- Phillips, S.J.; Dudík, M.; Schapire, R.E. A maximum entropy approach to species distribution modeling. In Proceedings of the Twenty-First International Conference on Machine Learning; Association for Computing Machinery: New York, NY, USA, 2004; pp. 655–662. [Google Scholar]
- Akaike, H. Information theory and an extension of the maximum likelihood principle. In The Second International Symposium on Information Theory; Akadémiai Kiadó: Budapest, Hungary, 1973; pp. 267–281. [Google Scholar]
- Morales, N.S.; Fernández, I.C.; Baca-González, V. MaxEnt’s parameter configuration and small samples: Are we paying attention to recommendations? A systematic review. PeerJ 2017, 5, e3093. [Google Scholar] [CrossRef] [PubMed]
- Radosavljevic, A.; Anderson, R.P. Making better Maxent models of species distributions: Complexity, over fitting and evaluation. J. Biogeogr. 2014, 41, 629–643. [Google Scholar] [CrossRef]
- Pearson, R.G.; Raxworthy, C.J.; Nakamura, M.; Peterson, A.T. Predicting species distributions from small numbers of occurrence records: A test case using cryptic geckos in Madagascar. J. Biogeogr. 2007, 34, 102–117. [Google Scholar] [CrossRef]
- Swets, J.A. Measuring the accuracy of diagnostic systems. Science 1988, 240, 1285–1293. [Google Scholar] [CrossRef] [PubMed] [Green Version]
- Lobo, J.M.; Jiménez-Valverde, A.; Real, R. AUC: A misleading measure of the performance of predictive distribution models. Glob. Ecol. Biogeogr. 2008, 17, 145–151. [Google Scholar] [CrossRef]
- Peterson, A.T.; Papeş, M.; Soberón, J. Rethinking receiver operating characteristic analysis applications in ecological niche modeling. Ecol. Model. 2008, 213, 63–72. [Google Scholar] [CrossRef]
- Qiao, H.J.; Peterson, A.T.; Campbell, L.P.; Soberón, J.; Ji, L.Q.; Escobar, L.E. NicheA: Creating virtual species and ecological niches in multivariate environmental scenarios. Ecography 2016, 39, 805–813. [Google Scholar] [CrossRef] [Green Version]
- Fukuda, H.; Hijii, N. Host-tree conditions affecting the oviposition activities of the woodwasp, Sirex nitobei Matsumura (Hymenoptera: Siricidae). J. For. Res. 1996, 1, 177–181. [Google Scholar] [CrossRef]
- Fukuda, H.; Hijii, N. Bark thickness of host pine trees and female body size affecting ovipositional success of Sirex nitobei Matsumura (Hymenoptera: Siricidae). J. For. Res. 1998, 3, 185–186. [Google Scholar] [CrossRef]
- Martínez, A.S.; Villacide, J.; Fernández Ajó, A.A.; Martinson, S.J.; Corley, J.C. Sirex noctilio flight behavior: Toward improving current monitoring techniques. Entomol. Exp. Appl. 2014, 152, 135140. [Google Scholar] [CrossRef]
- Liu, X.B.; Zheng, Z.J.; Zhou, F.; Ren, L.L.; Luo, Y.Q. Effects of age (in days), gender and nematode infection on the flight capacity of Sirex noctilio. Chin. J. Appl. Entomol. 2017, 54, 933–939. [Google Scholar]
- Lovejoy, T.E. Discontinuous wilderness: Minimum areas for conservation. Parks 1980, 5, 13–15. [Google Scholar]
- Soulé, M. Thresholds for survival: Maintaining fitness and evolutionary potential. In Comservation Biology: An Evolutionary-Ecological Perspective; Sinauer Associates: Sunderland, MA, USA, 1980; pp. 151–169. [Google Scholar]
- Shaffer, M.L. Minimum population sizes for species conservation. BioScience 1981, 31, 131–134. [Google Scholar] [CrossRef]
- Xu, H.F.; Lu, H.J. Minimum Viable Population—A Basic Theory of Conservation Biology. Chin. J. Ecol. 1996, 15, 25–30. [Google Scholar]
- Fukuda, H.; Hijii, N. Reproductive strategy of a woodwasp with no fungal symbionts, Xeris spectrum (Hymenoptera: Siricidae). Oecologia 1997, 112, 551–556. [Google Scholar] [CrossRef]
- Li, C.C.; Wang, L.X.; Ren, L.L.; Li, H.D.; Luo, Y.Q. Effects of Temperature Adaptation of Symbiotic Wood-decay Fungus Amylostereum areolatum on Potential Distribution Area of Sirex noctilio. J. Northeast For. Univ. 2019, 47, 112–117. [Google Scholar]
- Li, C.C.; Wang, L.X.; Li, J.L.; Gao, C.L.; Luo, Y.Q.; Ren, L.L. Thermal survival limits of larvae and adults of Sirex noctilio (Hymenoptera: Siricidae) in China. PLoS ONE 2019, 14, e0218888. [Google Scholar] [CrossRef] [Green Version]
- Hughes, G.; Madden, L.V. Evaluating predictive models with application in regulatory policy for invasive weeds. Agric. Syst. 2003, 76, 755–774. [Google Scholar] [CrossRef]
- Xia, W.C.; Zhang, C.; Zhuang, H.F.; Ren, B.P.; Zhou, J.; Shen, J.; Ali, K.; Luan, X.F.; Li, D.Y. The potential distribution and disappearing of Yunnan snub-nosed monkey: Influences of habitat fragmentation. Glob. Ecol. Conserv. 2020, 21, e00835. [Google Scholar] [CrossRef]
Figure 1.
The regularization multiplier and feature classes of S. nitobei in the maximum entropy model.
Figure 1.
The regularization multiplier and feature classes of S. nitobei in the maximum entropy model.

Figure 2.
Output of the predictive accuracy of the maximum entropy model.

Figure 3.
Current occurrence and distribution of S. nitobei in China, and the predicted area suitability under the near current climate condition. S. nitobei has the potential to occupy over 60% of the land area of China, which shows high suitability for occurrence of S. nitobei.
Figure 3.
Current occurrence and distribution of S. nitobei in China, and the predicted area suitability under the near current climate condition. S. nitobei has the potential to occupy over 60% of the land area of China, which shows high suitability for occurrence of S. nitobei.

Figure 4.
Jackknife analysis result showing most important environmental variables predicting potentially suitable distribution areas of S. nitobei in China. Monthly precipitation in July and maximum temperature in February significantly contributed to explaining the suitability of the area, with monthly precipitation in July and isothermality having the most unique information predicting area suitability for S. nitobei.

Figure 5.
Response curves between the distribution probability of S. nitobei and environmental variables. Values shown are average over 10 replicate runs: blue margins show ± SD calculated over 10 replicates.
Figure 5.
Response curves between the distribution probability of S. nitobei and environmental variables. Values shown are average over 10 replicate runs: blue margins show ± SD calculated over 10 replicates.

Figure 6.
Predicted potential distribution of S. nitobei in China under the future climate conditions during the periods of the 21st century under four Coupled Model Intercomparison Project Phase 6 (CMIP6) climate scenarios, and including four shared socio-economic pathways (ssp126, ssp245, ssp370, and ssp585).

Figure 7.
The area of suitable area of S. nitobei in China under the near current and future climate conditions.
Figure 7.
The area of suitable area of S. nitobei in China under the near current and future climate conditions.


Table 1.
Environmental variables used in predicting the potential geographic distribution of S. nitobei.
Table 1.
Environmental variables used in predicting the potential geographic distribution of S. nitobei.
| Climate Variables | Code | Percent Contribution |
|---|---|---|
| Monthly total precipitation in July (mm) | prec7 | 35.9 |
| Monthly average maximum temperature in February (°C) | tmax2 | 21.0 |
| Monthly total precipitation in December (mm) | prec12 | 8.6 |
| Monthly average minimum temperature in July (°C) | tmin7 | 2.8 |
| Isothermality (×100) | bio3 | 0.5 |
Table 2.
The predictive accuracy of the maximum entropy model estimated by AUC and AUC ratio.
| Climate Conditions | AUC | AUC Ratio |
|---|---|---|
| Near current | 0.990 | 1.90 |
| 2021–2040 ssp126 | 0.990 | 1.85 |
| 2041–2060 ssp126 | 0.980 | 1.89 |
| 2061–2080 ssp126 | 0.986 | 1.88 |
| 2081–2100 ssp126 | 0.987 | 1.86 |
| 2021–2040 ssp245 | 0.991 | 1.87 |
| 2041–2060 ssp245 | 0.981 | 1.85 |
| 2061–2080 ssp245 | 0.989 | 1.84 |
| 2081–2100 ssp245 | 0.995 | 1.86 |
| 2021–2040 ssp370 | 0.984 | 1.86 |
| 2041–2060 ssp370 | 0.986 | 1.88 |
| 2061–2080 ssp370 | 0.983 | 1.85 |
| 2081–2100 ssp370 | 0.980 | 1.84 |
| 2021–2040 ssp585 | 0.992 | 1.86 |
| 2041–2060 ssp585 | 0.982 | 1.86 |
| 2061–2080 ssp585 | 0.984 | 1.88 |
| 2081–2100 ssp585 | 0.985 | 1.86 |
Publisher’s Note: MDPI stays neutral with regard to jurisdictional claims in published maps and institutional affiliations. |
© 2021 by the authors. Licensee MDPI, Basel, Switzerland. This article is an open access article distributed under the terms and conditions of the Creative Commons Attribution (CC BY) license (http://creativecommons.org/licenses/by/4.0/).
Share and Cite
MDPI and ACS Style
Gao, T.; Xu, Q.; Liu, Y.; Zhao, J.; Shi, J. Predicting the Potential Geographic Distribution of Sirex nitobei in China under Climate Change Using Maximum Entropy Model. Forests 2021, 12, 151. https://doi.org/10.3390/f12020151
AMA Style
Gao T, Xu Q, Liu Y, Zhao J, Shi J. Predicting the Potential Geographic Distribution of Sirex nitobei in China under Climate Change Using Maximum Entropy Model. Forests. 2021; 12(2):151. https://doi.org/10.3390/f12020151
Chicago/Turabian StyleGao, Tai, Qiang Xu, Yang Liu, Jiaqiang Zhao, and Juan Shi. 2021. "Predicting the Potential Geographic Distribution of Sirex nitobei in China under Climate Change Using Maximum Entropy Model" Forests 12, no. 2: 151. https://doi.org/10.3390/f12020151
Note that from the first issue of 2016, this journal uses article numbers instead of page numbers. See further details here.