Article

Carbon Emissions from Oil Palm Induced Forest and Peatland Conversion in Sabah and Sarawak, Malaysia

by
Wan Shafrina Wan Mohd Jaafar
1,*,
Nor Fitrah Syazwani Said
1,
Khairul Nizam Abdul Maulud
1,2,
Royston Uning
3,
Mohd Talib Latif
3,
Aisyah Marliza Muhmad Kamarulzaman
1,
Midhun Mohan
4,
Biswajeet Pradhan
1,5,6,
Siti Nor Maizah Saad
1,
Eben North Broadbent
7,
Adrián Cardil
8,
Carlos Alberto Silva
9 and
Mohd Sobri Takriff
10
1
Earth Observation Centre, Institute of Climate Change, Universiti Kebangsaan Malaysia (UKM), Bangi 43600, Selangor, Malaysia
2
Department of Civil Engineering, Faculty of Engineering & Built Environment, Universiti Kebangsaan Malaysia (UKM), Bangi 43600, Selangor, Malaysia
3
Department of Earth Sciences and Environment, Faculty of Science and Technology, Universiti Kebangsaan Malaysia, Bangi 43600, Selangor, Malaysia
4
Department of Geography, University of California—Berkeley, Berkeley, CA 94709, USA
5
Centre for Advanced Modelling and Geospatial Information Systems, Faculty of Engineering and IT, University of Technology Sydney, Ultimo, NSW 2007, Australia
6
Department of Energy and Mineral Resources Engineering, Sejong University, Choongmu-gwan, 209, Neungdongro Gwangjin-gu, Seoul 05006, Korea
7
Spatial Ecology and Conservation Lab, School of Forest Resources and Conservation, University of Florida, Gainesville, FL 32611, USA
8
Tecnosylva, Parque Tecnológico de León, 24009 León, Spain
9
School of Forest Resources and Conservation, University of Florida, Gainesville, FL 32611, USA
10
Department of Chemical and Process Engineering, Faculty of Engineering and Built Environment, Universiti Kebangsaan Malaysia, Bangi 43600, Selangor, Malaysia
*
Author to whom correspondence should be addressed.
Forests 2020, 11(12), 1285; https://doi.org/10.3390/f11121285
Submission received: 21 October 2020 / Revised: 21 November 2020 / Accepted: 24 November 2020 / Published: 29 November 2020

Abstract

:
The palm oil industry is one of the major producers of vegetable oil in the tropics. Palm oil is used extensively for the manufacture of a wide variety of products and its production is increasing by around 9% every year, prompted largely by the expanding biofuel markets. The rise in annual demand for biofuels and vegetable oil from importer countries has caused a dramatic increase in the conversion of forests and peatlands into oil palm plantations in Malaysia. This study assessed the area of forests and peatlands converted into oil palm plantations from 1990 to 2018 in the states of Sarawak and Sabah, Malaysia, and estimated the resulting carbon dioxide (CO2) emissions. To do so, we analyzed multitemporal 30-m resolution Landsat-5 and Landsat-8 images using a hybrid method that combined automatic image processing and manual analyses. We found that over the 28-year period, forest cover declined by 12.6% and 16.3%, and the peatland area declined by 20.5% and 19.1% in Sarawak and Sabah, respectively. In 2018, we found that these changes resulted in CO2 emissions of 0.01577 and 0.00086 Gt CO2-C yr−1, as compared to an annual forest CO2 uptake of 0.26464 and 0.15007 Gt CO2-C yr−1, in Sarawak and Sabah, respectively. Our assessment highlights that carbon impacts extend beyond lost standing stocks, and result in substantial direct emissions from the oil palm plantations themselves, with 2018 oil palm plantations in our study area emitting up to 4% of CO2 uptake by remaining forests. Limiting future climate change impacts requires enhanced economic incentives for land uses that neither convert standing forests nor result in substantial CO2 emissions.

1. Introduction

Forests play a significant role in reducing the negative impacts of global climate change by absorbing carbon dioxide (CO2) and storing it in tree biomass; additionally, they also contribute to preserving watersheds and natural habitats for wildlife. Over the past few decades, forested lands have undergone far-reaching transformations due to massive rates of deforestation, usually arising from social pressures aligned with economic development [1,2,3]. Given population expansion, it comes as no surprise that one of the major contributors to deforestation is the massive increase in agricultural land [1,2,4,5,6,7]. Oil palm, being an omnipresent agricultural commodity, has a significant impact on the environment. These rapid changes in land use have been associated with the degradation of natural resources and environmental pollution [8].
In Malaysia, oil palm demand has grown over the past few decades and this trend has been amplified over the last few years [9]. This rapid growth of the palm oil industry has resulted in increased production and land use and land cover (LULC) change [10]. Oil palm cultivation expanded from 54,700 hectares in early 1960 to 5.64 million hectares by the year 2015, and Malaysia’s Ministry of Primary Industry has proposed to cap the oil palm plantation area to 6.5 million hectares by 2023 [11]. Malaysia is the world’s second-largest oil palm producer; it is incumbent on all organizations and people to adhere to a more sustainable oil palm cultivation approach, which is less detrimental to forest growth and its carbon sequestration abilities [2].
Even though in the early years of oil palm expansion, mineral soils were abundant and preferred for cultivation, throughout the years, it extended into marginal soils such as peat due to limited suiting lands [12,13]. This intervention has generated a red alarm about the future of species and carbon-rich old-growth and selectively logged forests. Notwithstanding the evident repercussions, several studies have identified increasing concerns from the impacts of industrial oil palm plantations on forests [14]. In this sense, integration of remote sensing and geographical information systems (GIS) can be deemed as powerful tools for analyzing, quantifying, and visualizing the impact of potential changes of the oil palm areas from local to global scales [15]. A recent review study undertaken by Chong et al. [16] underscored the ability of remote sensing to assist oil palm plantation management—such as by conducting land cover classification, change detection on oil palm land cover, tree counting, age estimation, biomass, carbon production assessment, yield appraisal, and disease detection. In our study, we emphasize the ability of spatial technologies to monitor natural land cover conversion resulting from palm oil plantation expansion.
Sarawak occupies 37.5% of the total land area of Malaysia [17], which at present, is undergoing aggressive deforestation due to agricultural expansion [18]. Its total oil palm area has increased from 473,134 ha in 2000 to approximately 1.16 million ha in 2009. Over time, areas planted in oil palm in Sarawak increased further, and in 2018 the total area planted for oil palm reached 1.57 million ha [19]. Meanwhile, in Sabah, the northern part of Borneo, deforestation of tropical forests has been happening since the early 1950s due to commercial logging. Over the years, deforestation switched from commercial logging to agricultural plantations [5,14,20] and consequent channeling to open broad road networks that require access through the forests. In Sarawak alone, the dependency of the state economy on forestry, which contributed to 52% of state revenue, is the main driving force to land-use change [6].
The LULC changes arising due to the palm oil industry expansion resulting in the conversion of forest and peatland have been repeatedly associated with deforestation and substantial carbon dioxide (CO2) emission from the burning of biomass [21]. In the past three decades, tropical peatlands have lost more than 2.5 gigaton carbon (Gt C) of carbon stock in total—of which 427.2 ± 90.7 Mg C ha−1 or 17.1 ± 3.6 Mg C ha−1 yr−1 was attributed to C loss resulting from biomass and peat due to the conversion of tropical virgin peat swamp forests into oil palm plantations [22]. Malaysia is the second-largest producer of oil palm in the world, and Sabah and Sarawak are the two largest oil palm producing regions in the country; however, there exists limited information on the extent and effects of forest and peatland loss driven by oil palm expansion. In addition, the CO2 emission from palm-driven land-use change is also poorly recorded in the Sabah and Sarawak regions. Most of the research has focused on global and national scales [23,24,25,26], thus ignoring the high degree of uncertainty in emissions existing at local levels. This study worked to provide such information by using multitemporal remote sensing analyses from 1990 to 2018 to quantify the loss of tropical forest and peatland through the expansion of oil palm plantations in Sabah and Sarawak, Malaysia, and then quantifying the rates of associated CO2 emission and uptake. This information is critical to motivate and support government efforts to sustainably manage these areas in the future.

2. Materials and Methods
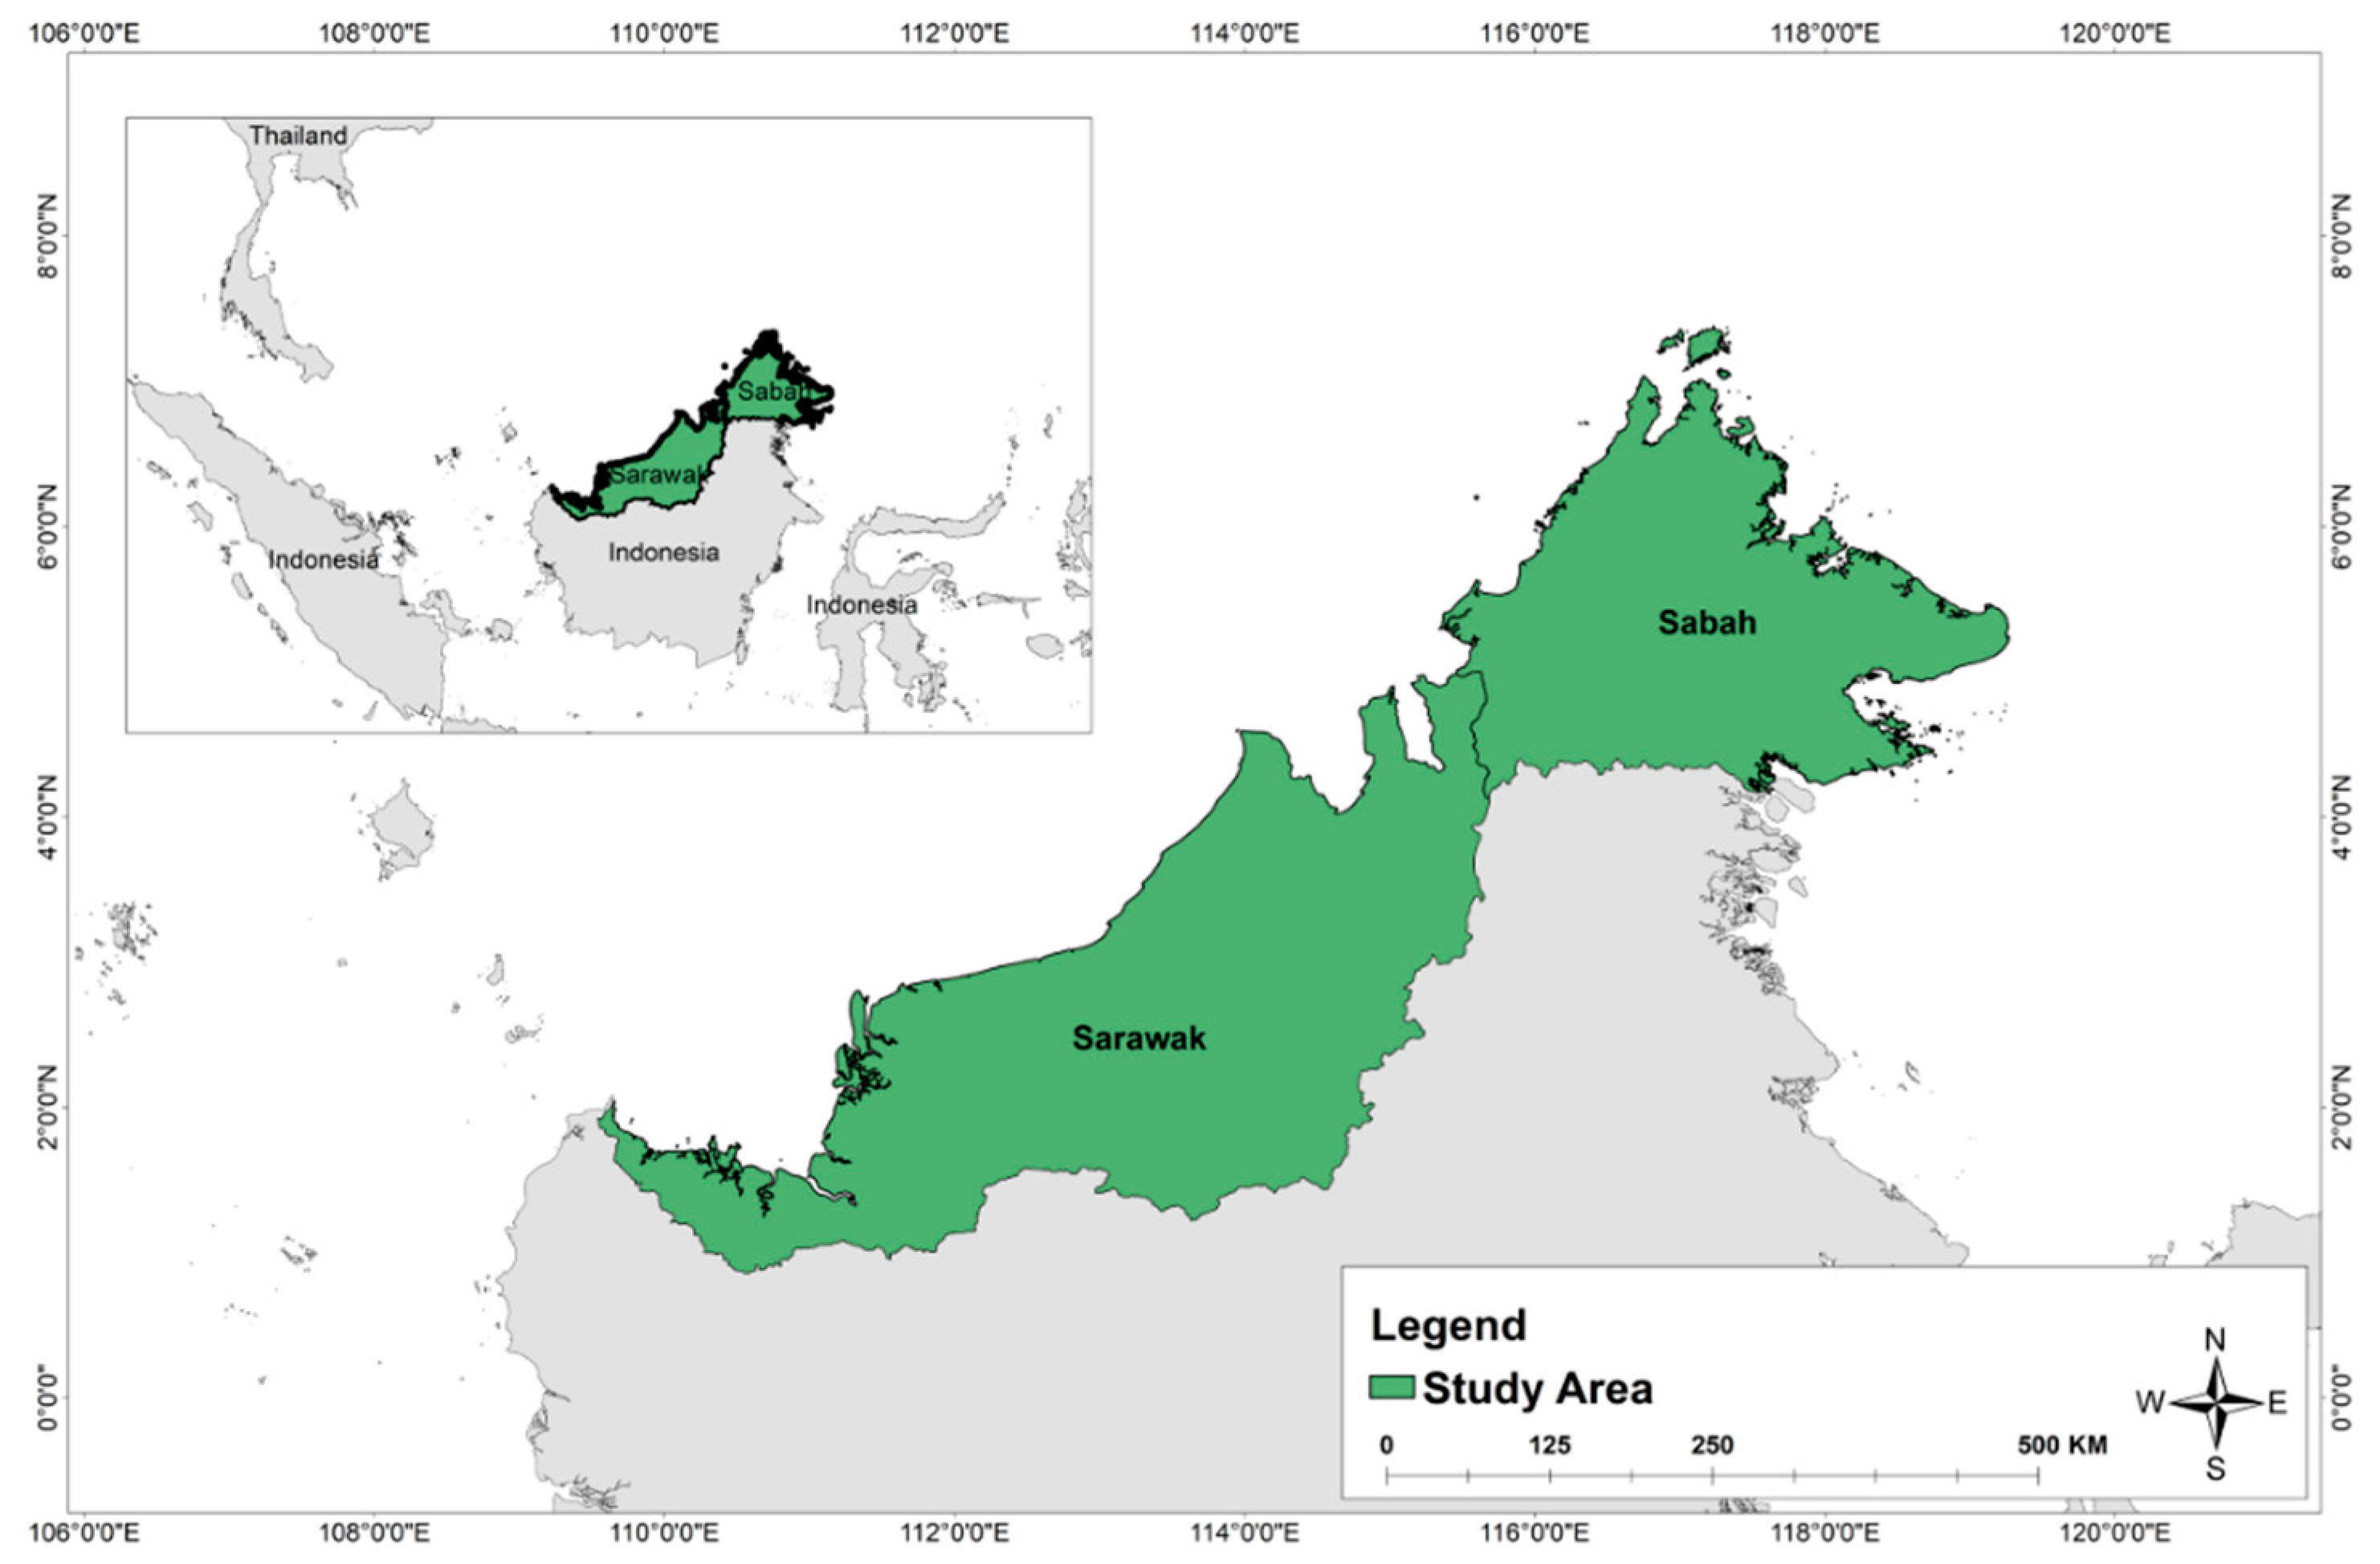
2.1. Study Area

This study focused on oil palm areas located in East Malaysia—states of Sarawak and Sabah (Figure 1). Sarawak is the largest state in Malaysia, with an area almost equal to that of Peninsular Malaysia. Sarawak is located at the north of the equator between latitude 0° 50′ and 5° N, longitude 109° 36′ and 115° 40′ E and 600 km from Peninsular Malaysia, where its regions cover about 800 km along the northwest coast of Borneo. It is home to some of the world′s most distinct flora and fauna. The total area of Sarawak is 12.4 million ha, with a population of 2.77 million. Based on the annual report from the Forest Department of Sarawak [26], 4.2 million ha are permanent forest estate and 712,012 ha are protected areas. Sarawak’s forest consists of four types—hill mixed dipterocarp forest, peat swamp forest, mangrove forest, and others (kerangas and montane forest)—with hill Mixed dipterocarp forest comprising 65.4% of total cover.
Sabah is the second largest state in Malaysia after Sarawak and shares a common boundary with Sarawak towards the southwest; it also shares borders with East Kalimantan (Indonesia) in the south. The state is located in the northern part of the island Borneo. Sabah, similar to Sarawak, is home to many endemic species of flora and fauna. The total area is 7.4 million ha (Sabah Structure Plan 2033 [27]), with an estimated population of 3.74 million (National Physical Plan-3 [28]); the subtotal forest reserves, according to the Sabah’s Forestry Department, encompasses 3.54 million ha with 1.35 million classified as protected forest reserves. Its forest consists of four categories, which are: coastal and mangrove forests, dipterocarp forests, heath and limestone forests, and montane forests.

2.2. Data Collection

The analysis of land cover change from forest conversion by oil palm plantation was derived from two 30 m spatial resolution multispectral satellite image series—Landsat-5 Thematic Mapper (TM) and Landsat-8 Operational Land Images (OLI) data downloaded from http://glovis.usgs.gov/ [29]. A series of images taken within the same month with less cloud cover was used on a yearly basis to obtain an average of each band rather than using a single date image to represent the whole month. In total, 22 scenes of satellite images from Landsat-5-TM year 1990 and 16 scenes of satellite images from Landsat-8-OLI year 2018 from each state were used to conduct the analysis of LULC change into oil palm plantations in this study (Figure 2). All images collected during the southwest monsoon season were selectively downloaded, specifically, the months of June and July, when East Malaysia generally experiences clear skies with cloud cover less than 10% coverage.
Besides satellite images, auxiliary data obtained from various sources were also used to map and validate the land use and oil palm in Sabah and Sarawak. A soil map produced by the Department of Agriculture Sabah and Sarawak dated 1990 was used to digitize the peatland polygon layer, while Sabah and Sarawak peatland polygon layer for the year 2018 was based on the Harmonised World Soil Map for Malaysia obtained from The Food and Agriculture Organization (FAO)/United Nations Educational, Scientific, and Cultural Organization (UNESCO) soil map of the world [30]. Furthermore, statistical data obtained from the Malaysian Palm Oil Board (MPOB) and Sabah and Sarawak Forestry Department were used to compare the results obtained in this study with the oil palm and forest area statistics obtained from the respective agencies. We also used oil palm polygon boundary data obtained from Roundtable on Sustainable Palm Oil (RSPO) as a benchmark and reference to map all types of oil palm plantation; that is both small- and large-scale oil palm plantations, regardless of their status (certified and noncertified holders). Finally, forest cover change data that were obtained from the Global Land Analysis and Discovery (GLAD) (formerly addressed as The Hansen tree cover change data) [15], accessed through Global Forest Watch were used as a reference to observe the extent of forest change from 2000 to 2019. Table 1 shows the datasets and overall description of data usage to map land use and oil palm plantations over Sabah and Sarawak states for the years 1990 and 2018.

2.3. Data Processing

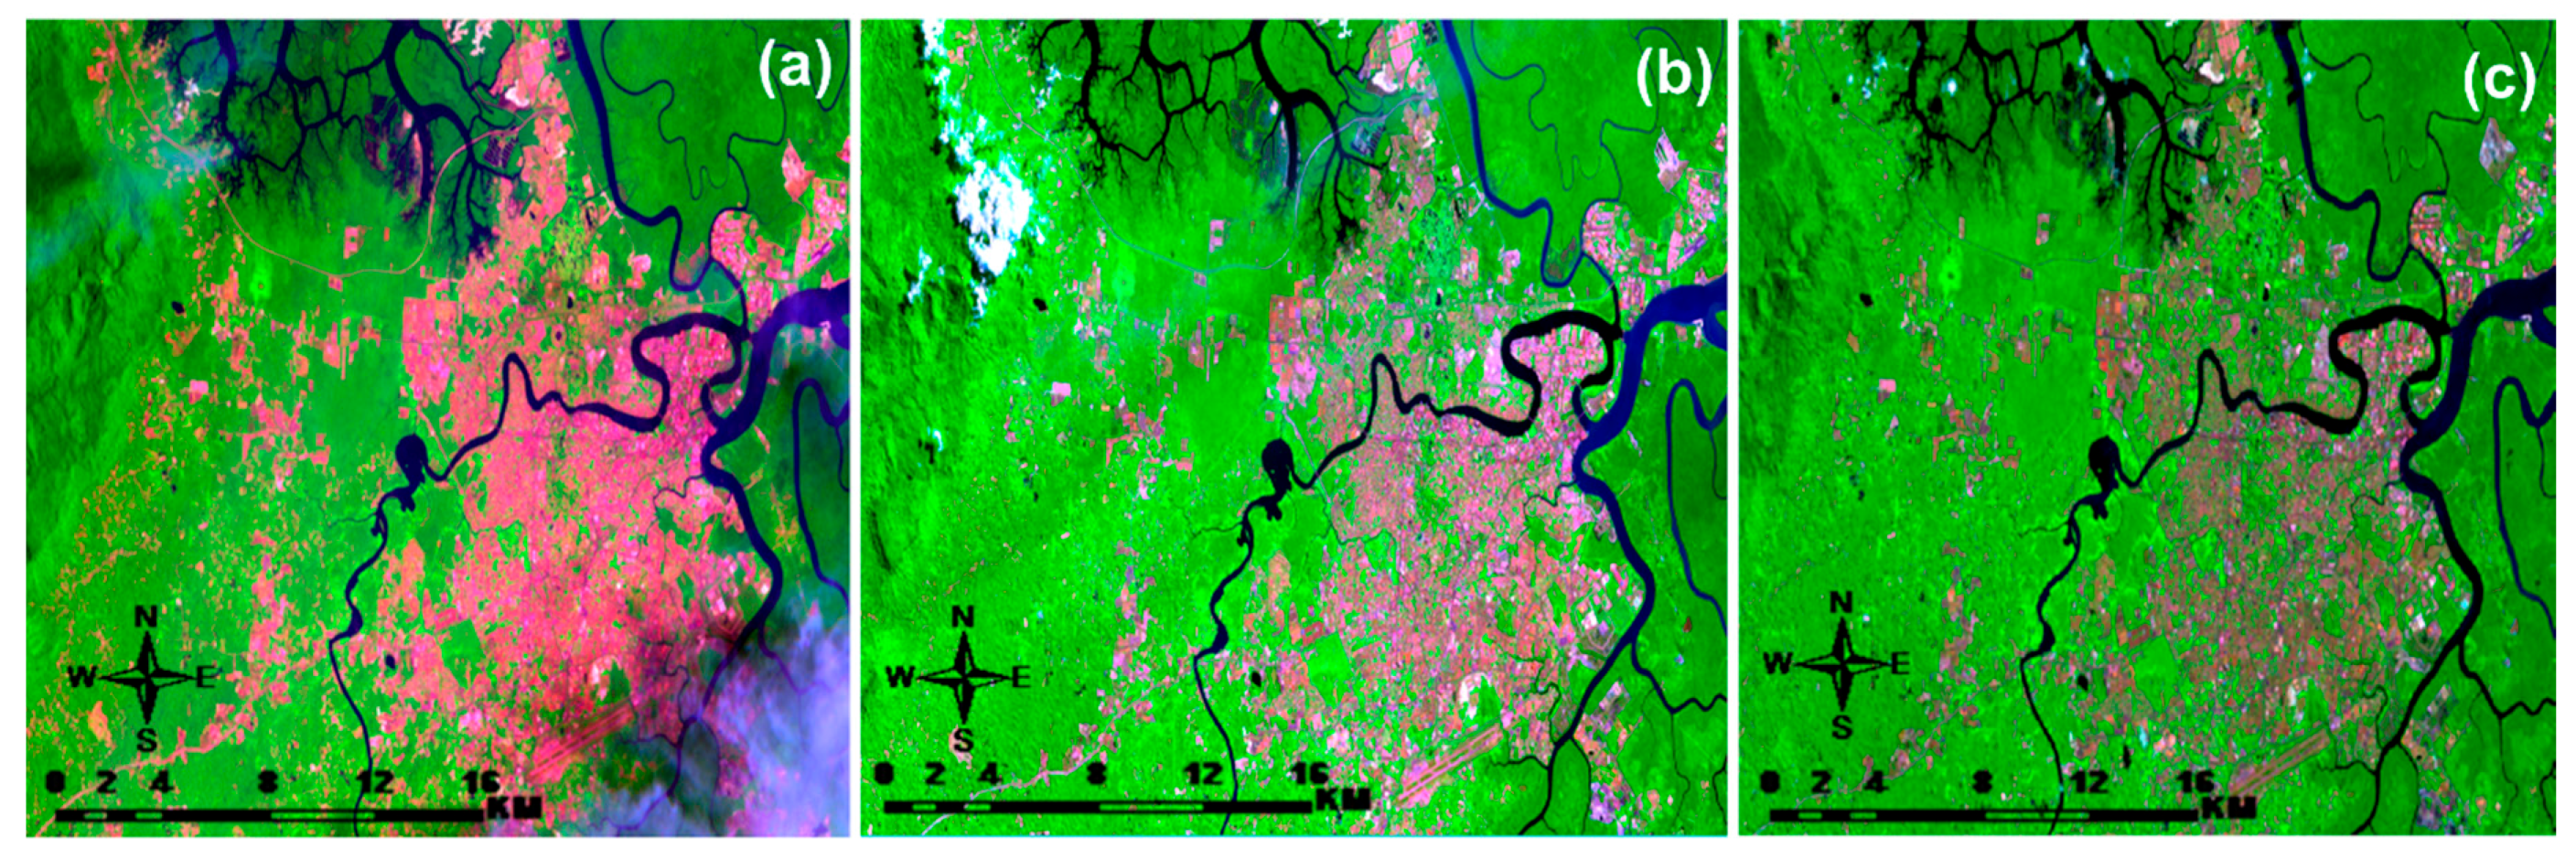
2.3.1. Image Preprocessing

A total of 38 Landsat scenes from Landsat-5 and Landsat-8 downloaded from the GloVis website were atmospherically, radiometrically, and geometrically corrected to improve the image quality. Atmospheric and radiometric corrections were performed using the ATCOR module [31] in ERDAS Imagine software, version 2018 [32]. All the preprocessed images were georeferenced with UTM, Zone 49 and 50 North Projection, and WGS 84 datum using ArcGIS software [33].

2.3.2. Seamless Image Mosaicking

After the preprocessing, to create a seamless image mosaic, thick and thin cloud effects were removed. The F mask algorithm, developed by Zhu and Woodcock [34], was used to detect both clouds and cloud shadows for Landsat TM and Landsat OLI. The probability mask and scene-based threshold were used to compute the cloud mask, while the cloud shadows were calculated using a combination of lapse rate and object matching and a flood-fill transformation. The input data in the F mask operation were the top of atmosphere (TOA) reflectance bands (band 1, 2, 3, 4, 5, and 7) and brightness temperature band (BT) (band 6—TM and band 10/11—OLI). Landsat digital number (DN) values were converted to TOA reflectance and BT (degree Celsius) before applying rules based on cloud and cloud shadow physical properties to extract the potential cloud and cloud shadow layer. Finally, the potential segmented cloud layer and the geometric relationships were used to match the potential cloud shadow layer to produce the final cloud and cloud shadow layer. This cloud removal operation was fully operated using the Fmask function in ENVI 5.3 software [35]. For each satellite image scene, two different images that were captured at different dates on the same month were used in the cloud patching process (Figure 3) to create seamless mosaic products (atmospherically corrected and free cloud cover images), which were then used in the subsequent process as an input.
The F mask algorithm successfully removed 96% of cloud covers and the shadows. The algorithm also efficiently detected low-temperature and thin clouds in high altitudes through thermal sensors onboard Landsat-TM and Landsat-OLI. Even though the algorithm assists in the cloud removal process and makes the monitoring work at landscape level practical and feasible, it failed to detect small patches of scattered clouds on the images.

2.4. Land-Use Land Cover Extraction and Classification

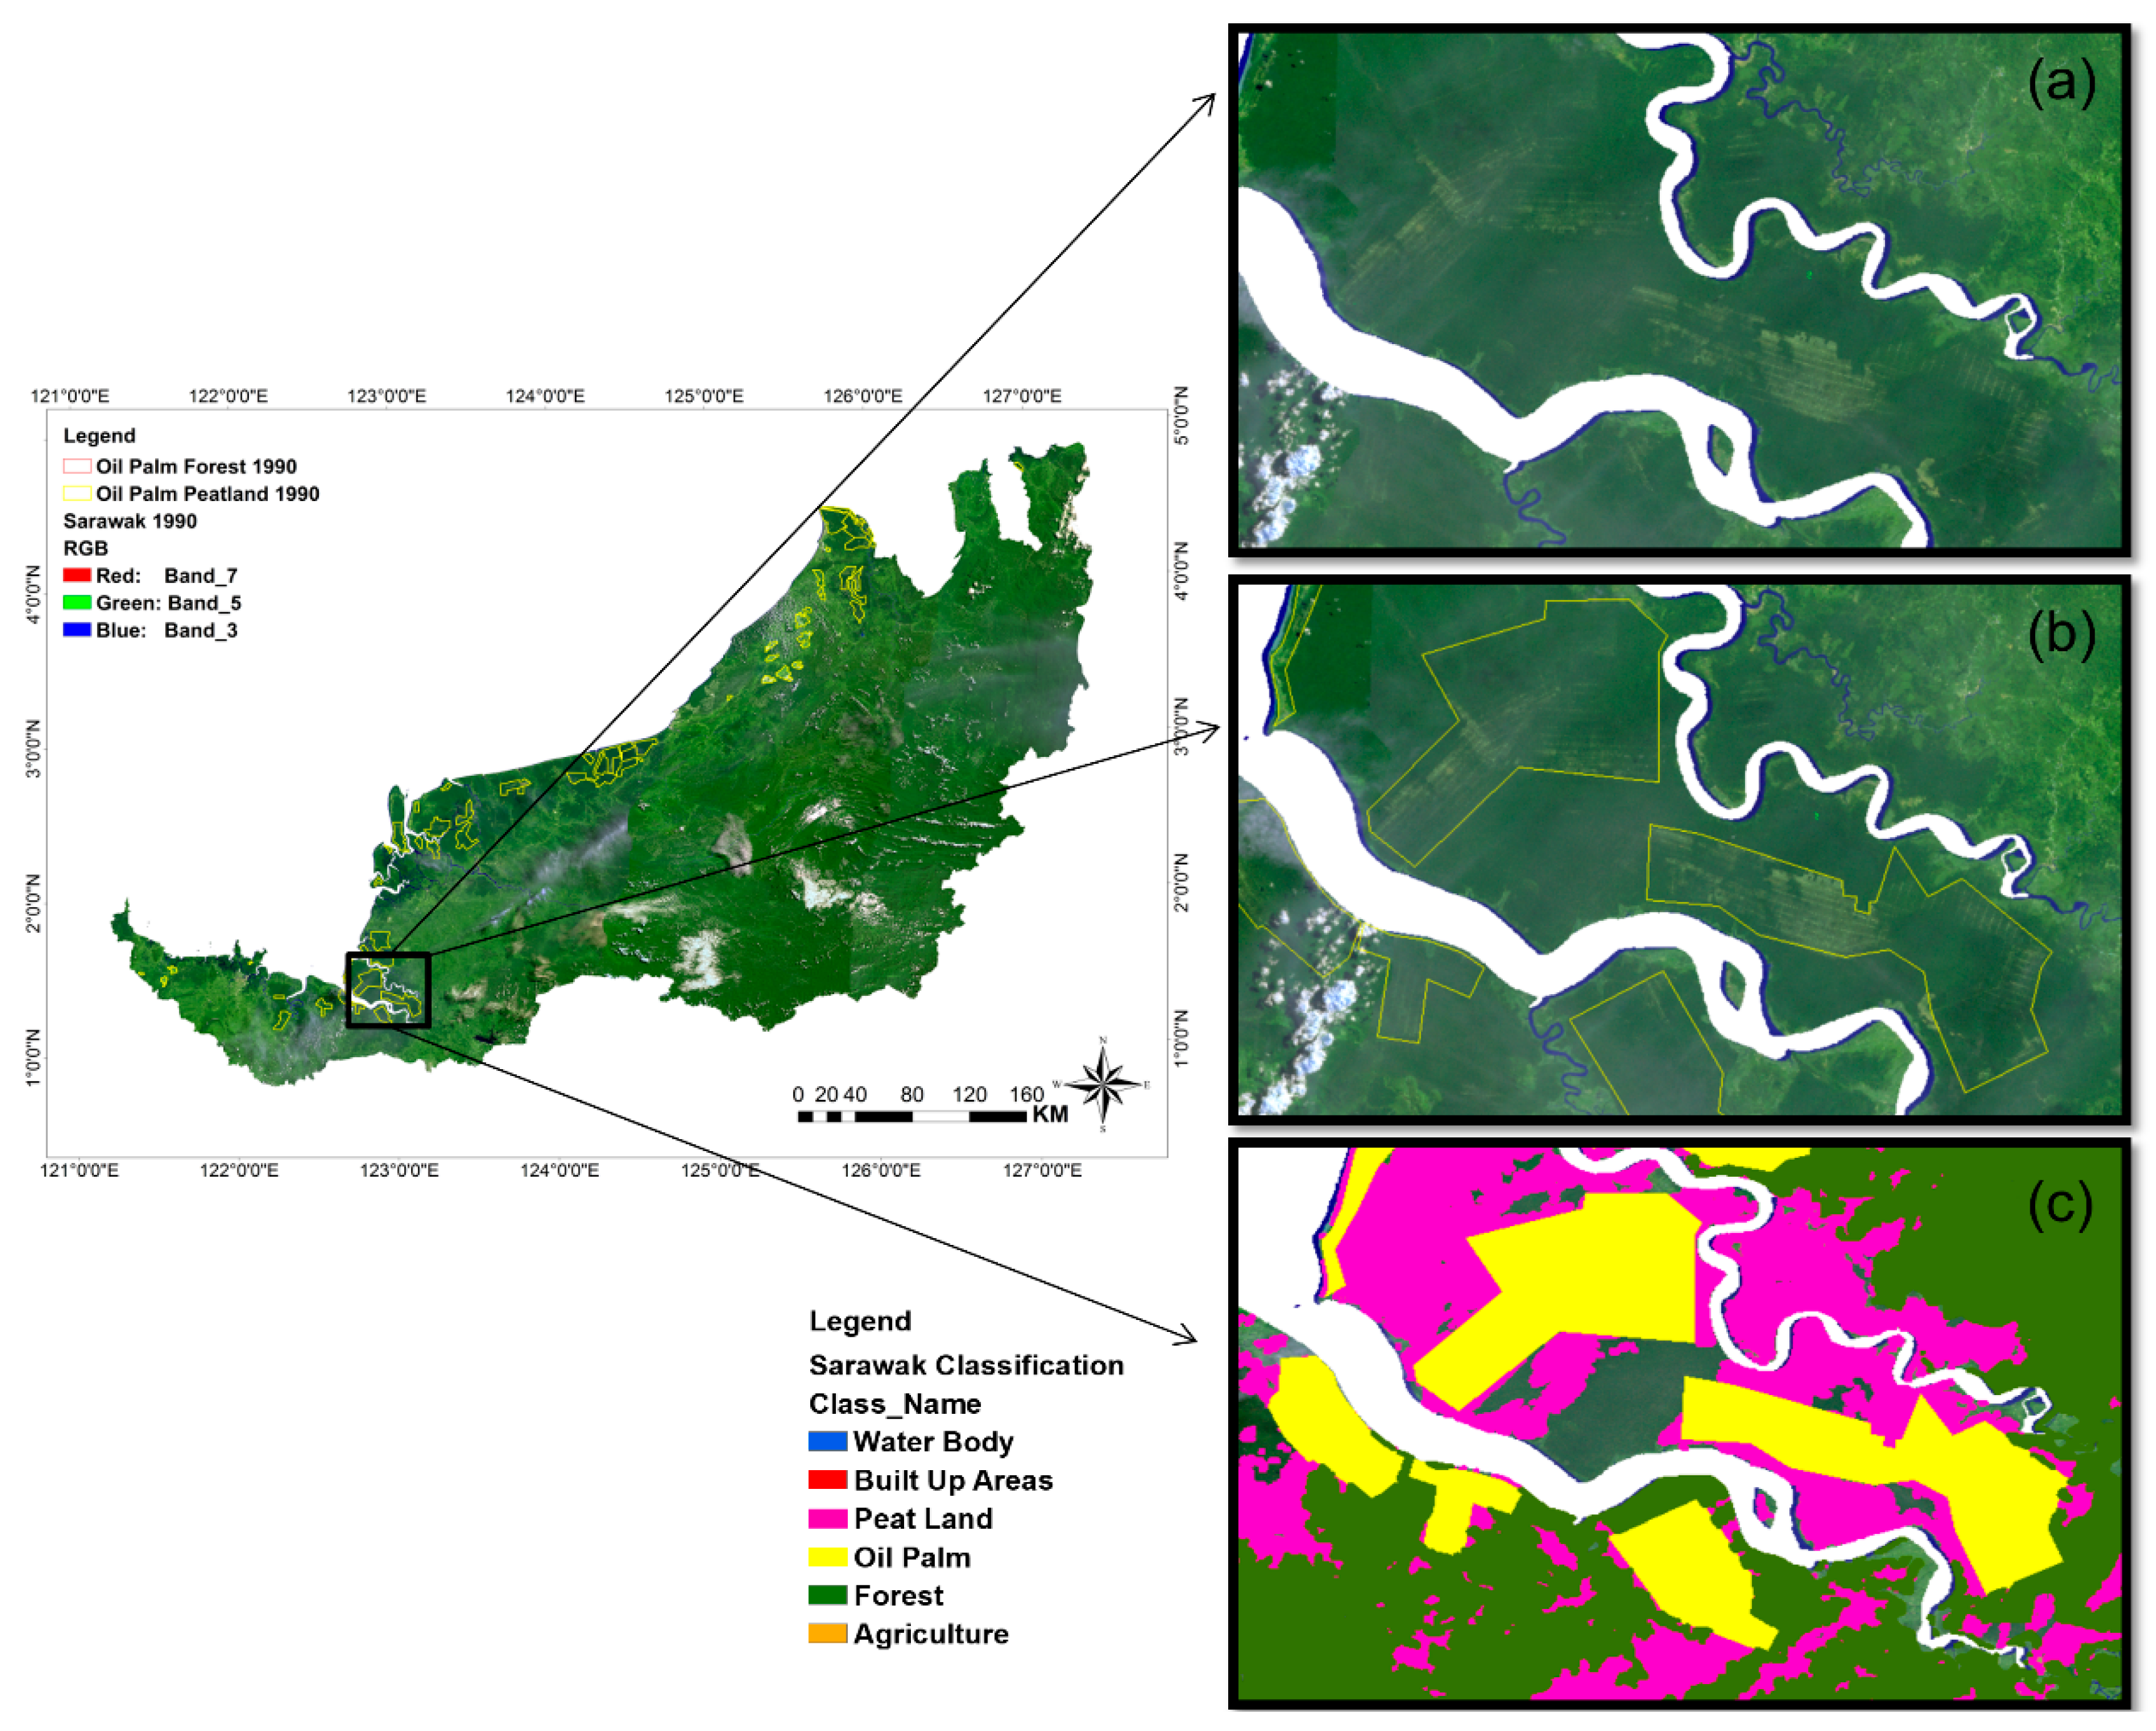
2.4.1. Oil Palm Plantations Mapping (Manual Extraction)

This study applied a combination of manual interpretation of satellite data and automated classification of Landsat images for LULC analysis. The oil palm plantations were manually digitized on-screen by visually interpreting Landsat imagery; this method has been widely accepted and has been successfully used to map oil palm plantations in the major oil palm producing countries, such as Indonesia and Malaysia [7,13,36,37]. Since oil palm has similar reflectance patterns as secondary forest, but are frequently organized in rectilinear patterns, the visual interpretation method was found to be the most efficient method in identifying oil palm cultivation areas (Figure 4). We mapped plantations in 1990 and 2018 based on a cloud-free seamless image mosaic that was processed earlier. Secondary data obtained from GLAD tree cover change data [15], accessed in Global Forest Watch, and RSPO oil palm concession polygon [38] were used as a benchmark and reference to map all types of oil palm plantation. All combinations of small-scale, large-scale, certified, and noncertified oil palm plantations were considered here.
The resulting maps were further verified using the web-based validation tool Laco-wiki (http://www.laco-wiki.net/) [39]. Laco-Wiki provides a web-based solution for validating land cover and land use maps using a variety of reference layers, including satellite and aerial imagery and incorporating imagery from Google Maps and Bing Maps. To ensure the crowns of individual palms could be clearly identified, we constrained our validation sample to areas with high-resolution imagery (<5 m2). The validation sample was selected randomly with an equal number of validation points for each map within the oil plantations area and within a 15 km buffer outside the plantation area. The buffer was created to make sure that sample points suitable for oil palm plantations within close proximity were also considered, which in turn helped avoid inflating the accuracy estimates.

2.4.2. Land Cover Classification

LULC classification was done through integration of on-screen digitizing methodology (accomplished through manual visual interpretation) and automated image classification techniques (where the individual pixels were classified based on reflectance values using mathematical algorithms) [40,41]. Since Sabah and Sarawak have different forest management—where each state categorizes different forest land classes incorporating disparate sets of criteria—we harmonized the classification classes to create a standard classification consisting of six general classes: water body, built-up areas, peatland, oil palm, forest, and agriculture (Table 2). The oil palm class was extracted by manual digitization, and the peatland polygon layer for 1990 was extracted by digitizing the soil maps of Sabah and Sarawak. The soil maps were obtained from the Department of Agriculture of the respective states. Meanwhile, the peatland polygon layer for 2018 was based on the Harmonized World Soil Map for Malaysia [42].
To perform an automated classification approach to extract other classes (water body, built-up areas, forest, and agriculture), we adopted the support vector machine (SVM) algorithm to differentiate optimal boundaries between classes based on the training areas or region of interest that were sampled in the images [43]. The SVM classification was applied using SVM classifier in ENVI Software and multiple regions of interest (ROIs) were collected to represent each feature on the satellite image. SVM is widely used for satellite image classification, which involves the use of kernel technique to transform the dataset into a higher dimensional feature space. There are several kernels used in machine learning classification, some of which are linear, polynomial, and radial basis function (RBF) and Sigmoid kernel [44]. The selected kernel has to be set by the user in the specific software. Also, common parameters—such as penalty parameter, pyramid level, and classification probability threshold value—need to be set with the selected kernel. In this study, we applied a radial basis function filter (RBF) with a 100.00 penalty parameter, and set the pyramid level and classification threshold values as 0.00 [39]. This parameter setting was applied to prevent features from being classified into one class only and to ensure that no pixel value remained unclassified. The application of RBF kernel for the SVM classification can be expressed as in Equation (1) [45]:
K x i x j   = e y ( x i x j ) 2 ,   γ   >   0 ,
where, x i and x j , represent feature vectors in some input space and γ is the width of the kernel function. The proper kernel function selected will allow the data to be separated and distinguished properly from their original input space [44].

2.5. Assessing Land Cover Change Driven by Oil Palm Plantation

To assess forest and peatland change driven by the expansion of oil palm plantations, we used secondary data from multiple sources. These included oil palm statistics data obtained from the MPOB, forest change extended area information from GLAD accessed through Global Forest Watch, oil palm polygon boundary from RSPO, and peatland information obtained from the Department of Agriculture, Sabah and Sarawak and FAO—UNESCO soil map of the world. Based on the six land-use classes, we calculated the area of each land cover class converted to new oil palm from 1990 to 2018. Our study did not focus on decadal changes; rather, we focused on long-range impacts. The analysis of oil palm expansion was run on the forest, peatland, and other lands/agriculture layers for 1990 and 2018 to determine whether the results were robust to the input land cover dataset.
The automated land cover classification was assessed using the same approach as oil palm mapping. The resulting land-use classification was validated using the Laco-wiki validation tool. In total, 114 validation sample points (1990, n = 56; 2018, n = 58) were selected randomly from each classification result, and the confusion matrix was used to generate the overall accuracy, omission and commission error, and Kappa (k) coefficients.

2.6. Calculation of Annual Carbon Emission and Uptake

The study on annual CO2 emissions (Ce)/uptake (Cu) was calculated by multiplying the estimated oil palm/forest area with its respective CO2 emission/uptake rate (see Equations (2) and (3)). The estimated oil palm/forest area data were obtained from a series of computation processes, as previously explained in Section 2.2, Section 2.3, Section 2.4 and Section 2.5. The CO2 emission/uptake rate, however, was obtained from the literature [10,19], which was selected according to identical area, type of soil, as well as the type of plant. In this study, the selected CO2 emission rate for peat soil oil palm plantation was 24 t CO2-C ha−1 yr−1 [46], CO2 uptake rate for oil palm plantation on forest was 82 t CO2-C ha−1 yr−1 [47], while the CO2 uptake rate for forest was 32 t CO2-C ha−1 yr−1 [47].
Annual CO2 Emission (t Ce yr−1) = Area (ha) x estimated emission (t Ce ha−1yr−1),
Annual CO2 Uptake (t Cu yr−1) = Area (ha) x estimated uptake (t Cu ha−1yr−1).

3. Results

3.1. Land Use Classification Accuracy

The accuracy assessment was done considering the selected validation sample points. Precision measurement indices based on a confusion matrix, user’s accuracy (UA), and producer’s accuracy (PA) were employed. The overall accuracies of the SVM classifier for all six classes were found to be 90% (1990) and 98% (2018) for Sarawak classification with Kappa coefficients of 86% (1990) and 97% (2018) (Table 3). While for Sabah, the observed overall accuracies for all six classes were 87% (1990) and 97% (2018), with Kappa coefficients of 77% (1990) and 96% (2018), respectively (Table 4).

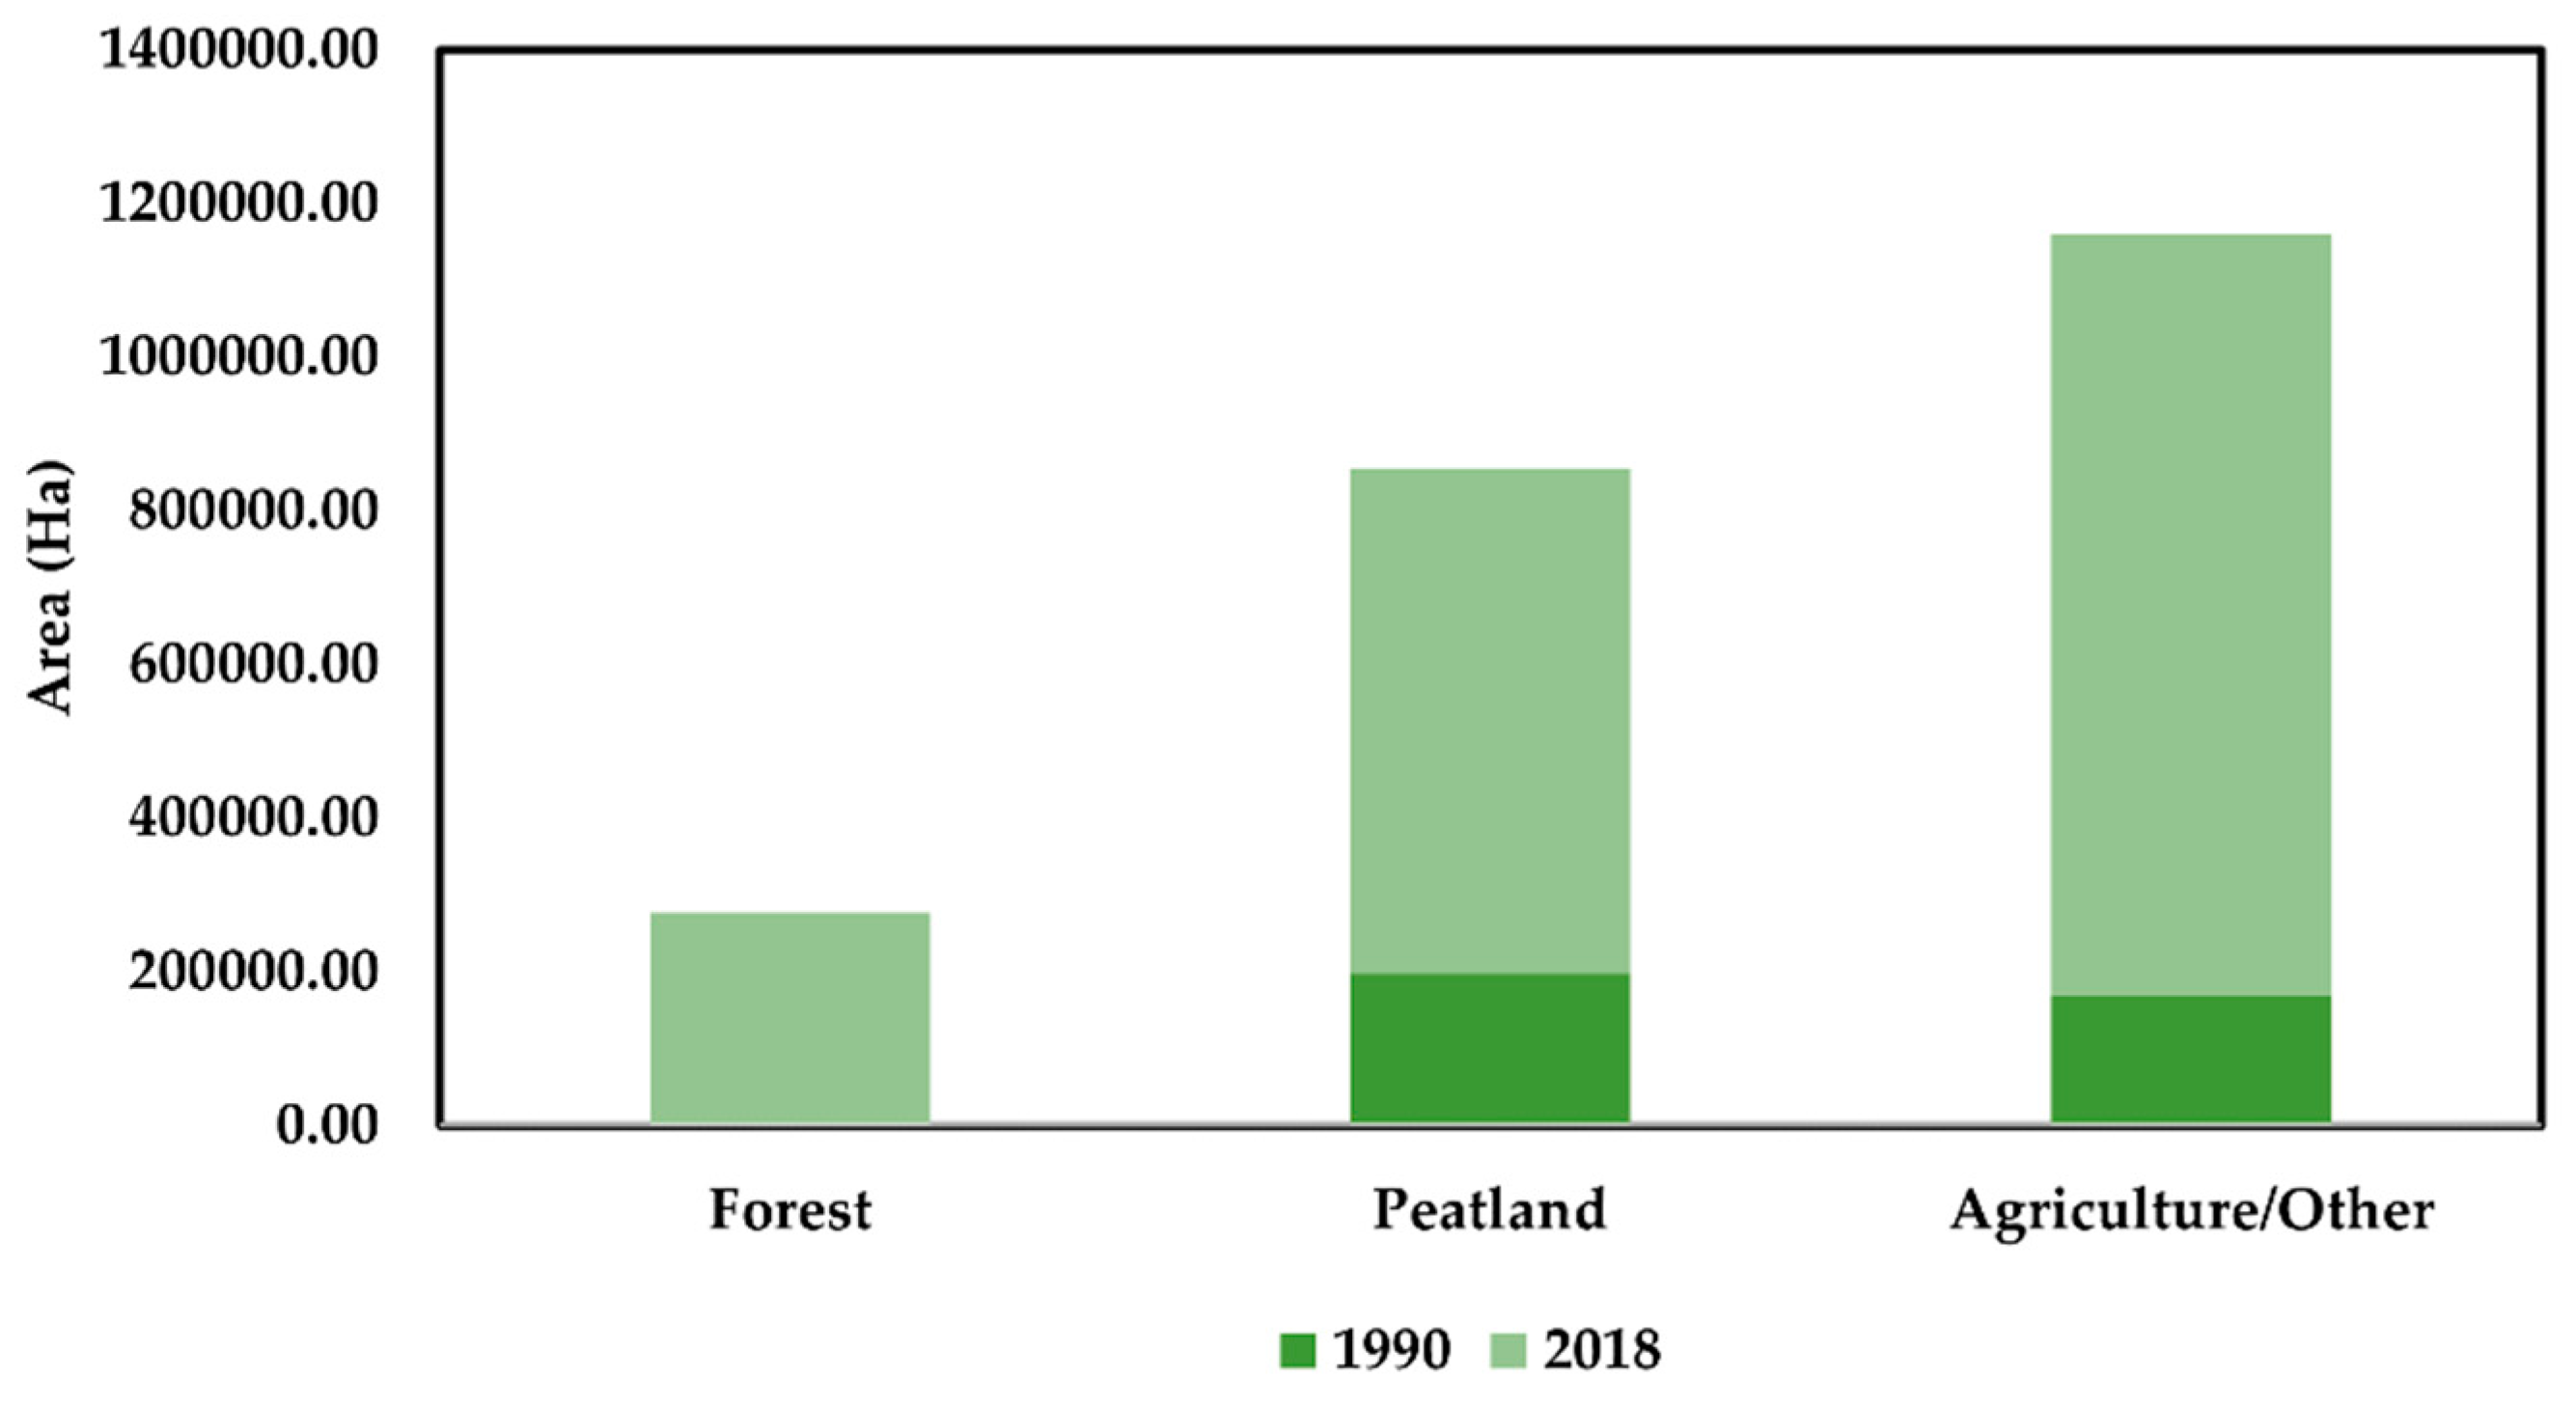
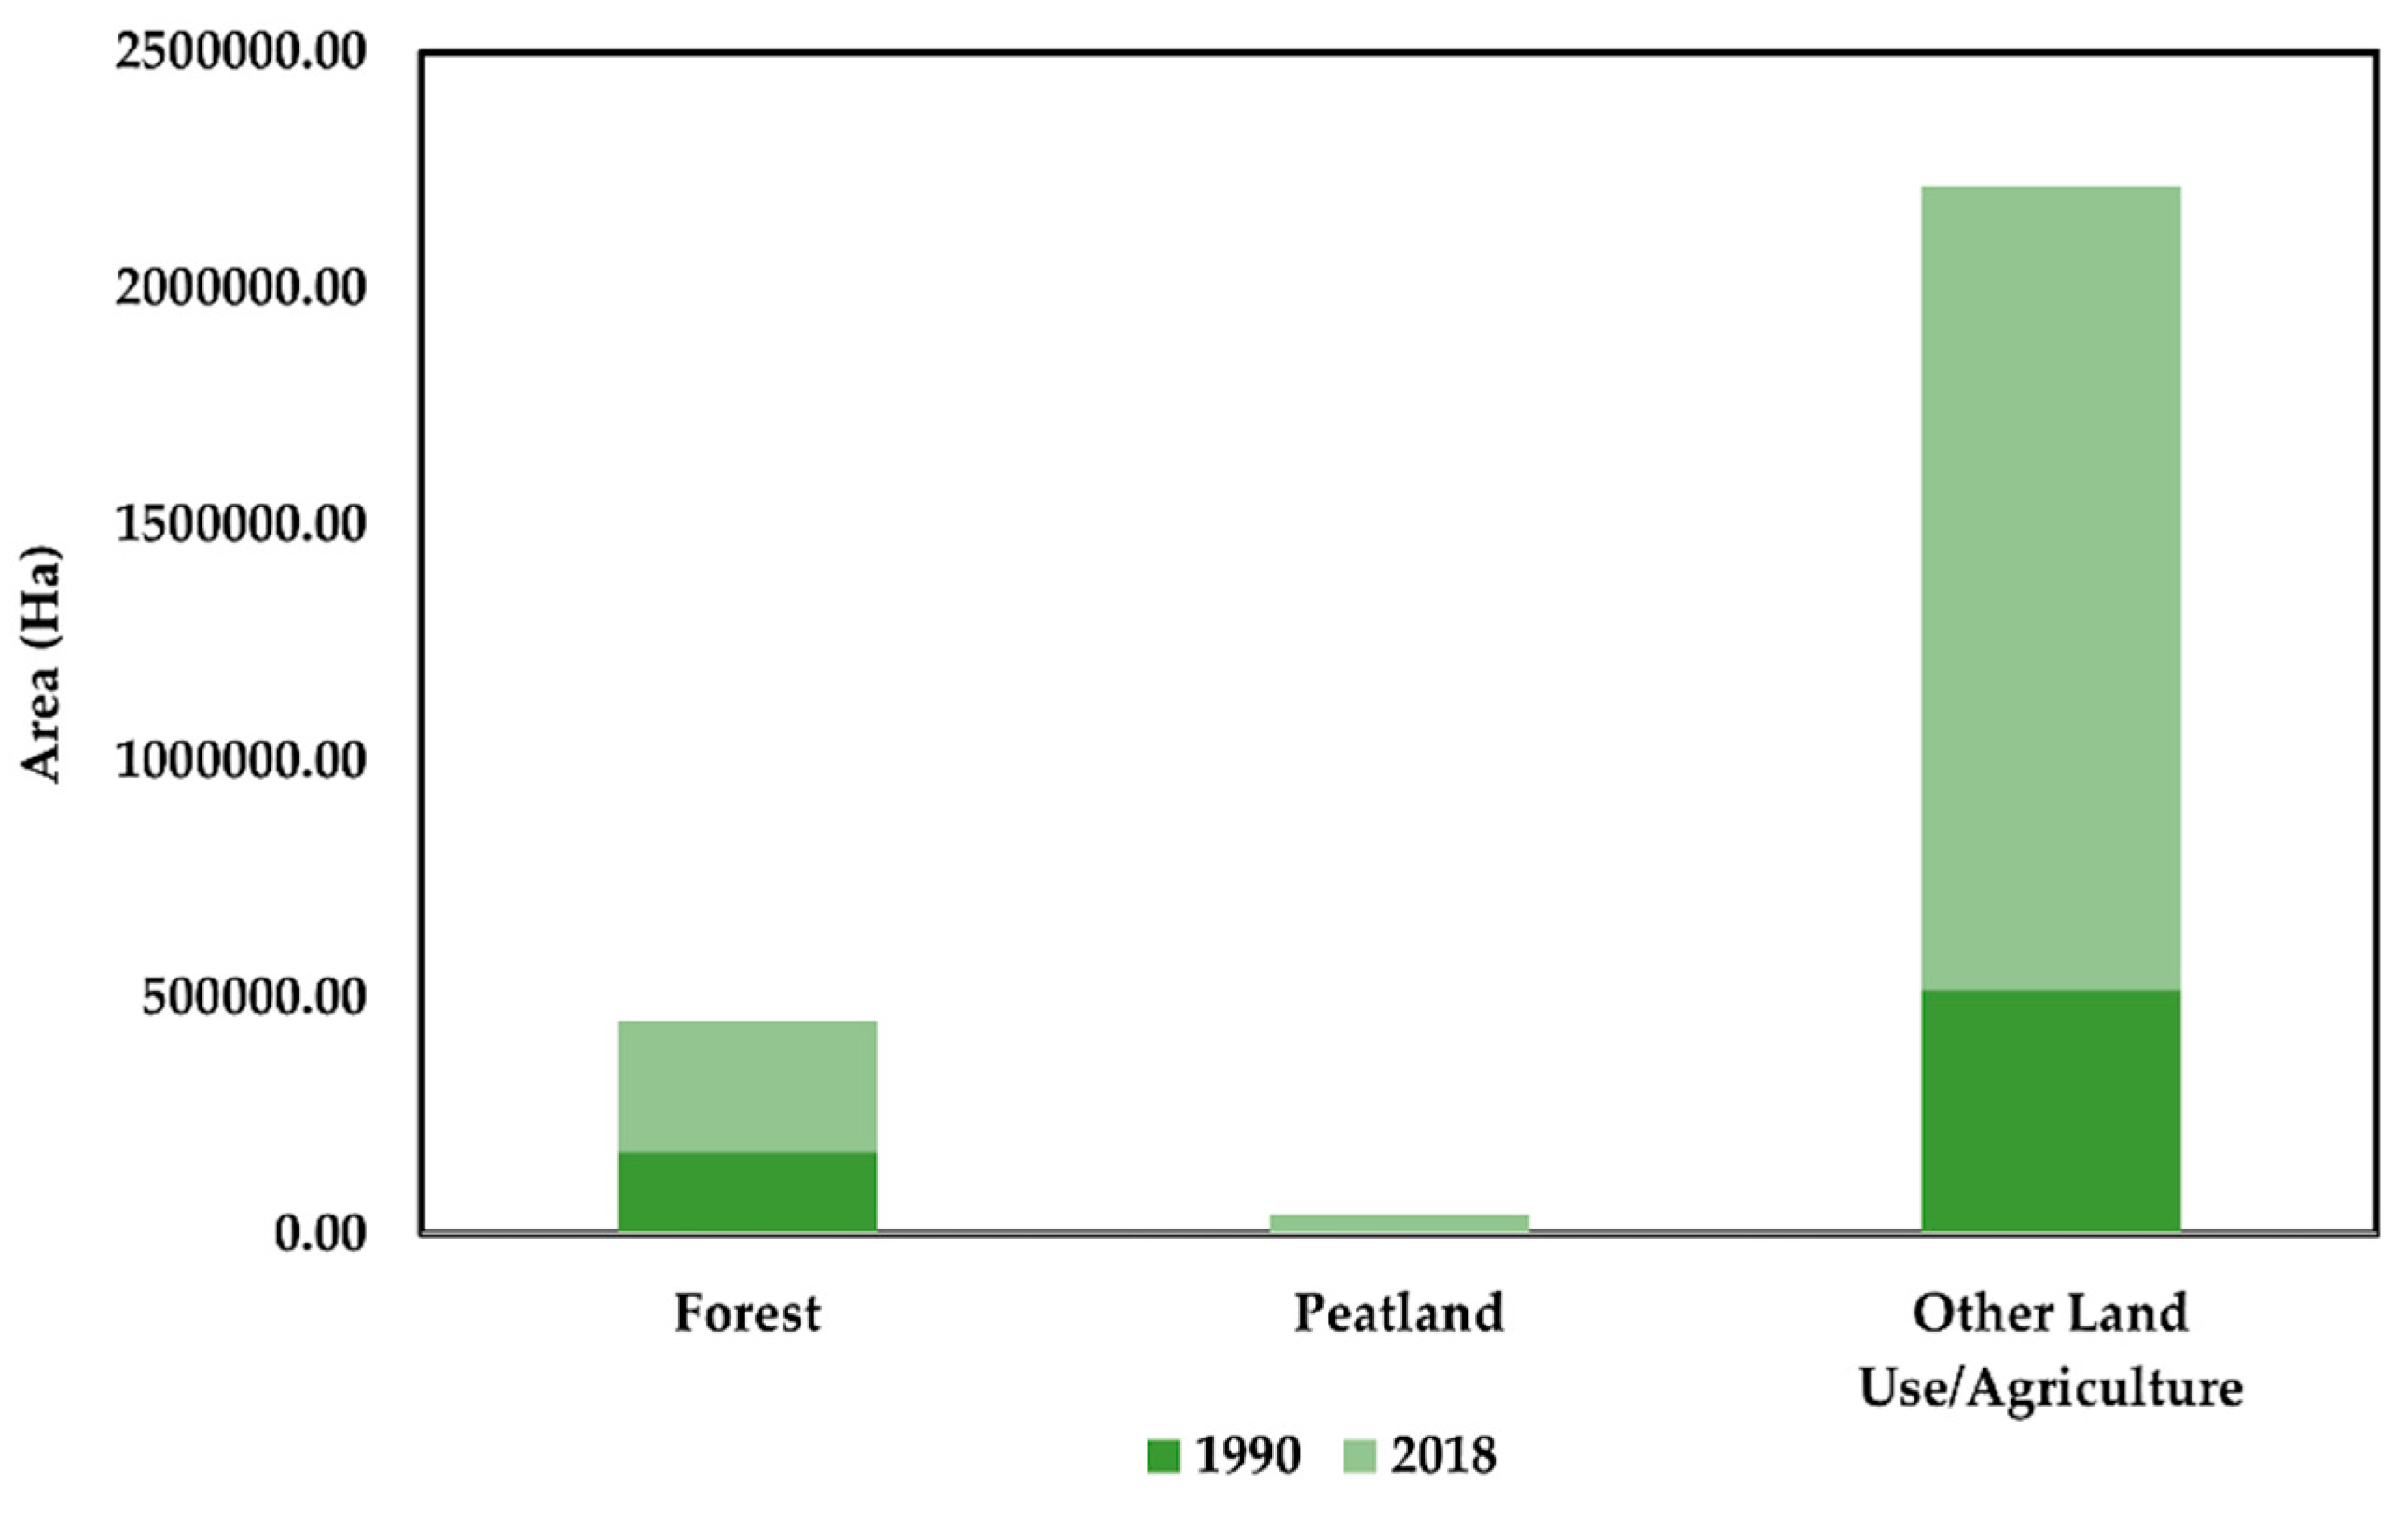
3.2. Forest and Peatland Changes

Sarawak is the largest state in Malaysia, with 12.4 million ha of terrestrial land area. In 1990, more than 77% of Sarawak was covered by forest. As of 2018, Sarawak forest cover had reduced to 66%. Despite forest cover existing as the largest land cover type in 1990 and 2018, in total, more than 12% of forests and 21% of peatlands were converted between 1990 and 2018 (Table 5).
Sabah, at 7.4 million ha, is the second-largest state in Malaysia and occupies around 10 percent of Borneo. Sabah in 1990 had more than 75% forest cover but dropped to 64% in 2018. Sabah underwent a rapid change within 28 years, with 16% of forest being converted. Despite the forest cover remaining as the largest land cover type in 1990 and 2018, more than 916,175 ha were deforested within the 28 years. Meanwhile, 30,979 ha of peatland were cleared from 1990 to 2018. The loss of natural forest and peatland between 1990 and 2018 was accompanied by the increase in the degraded forest, where almost 16% of natural forest and 19% of peatland was lost between 1990 and 2018 (Table 6).

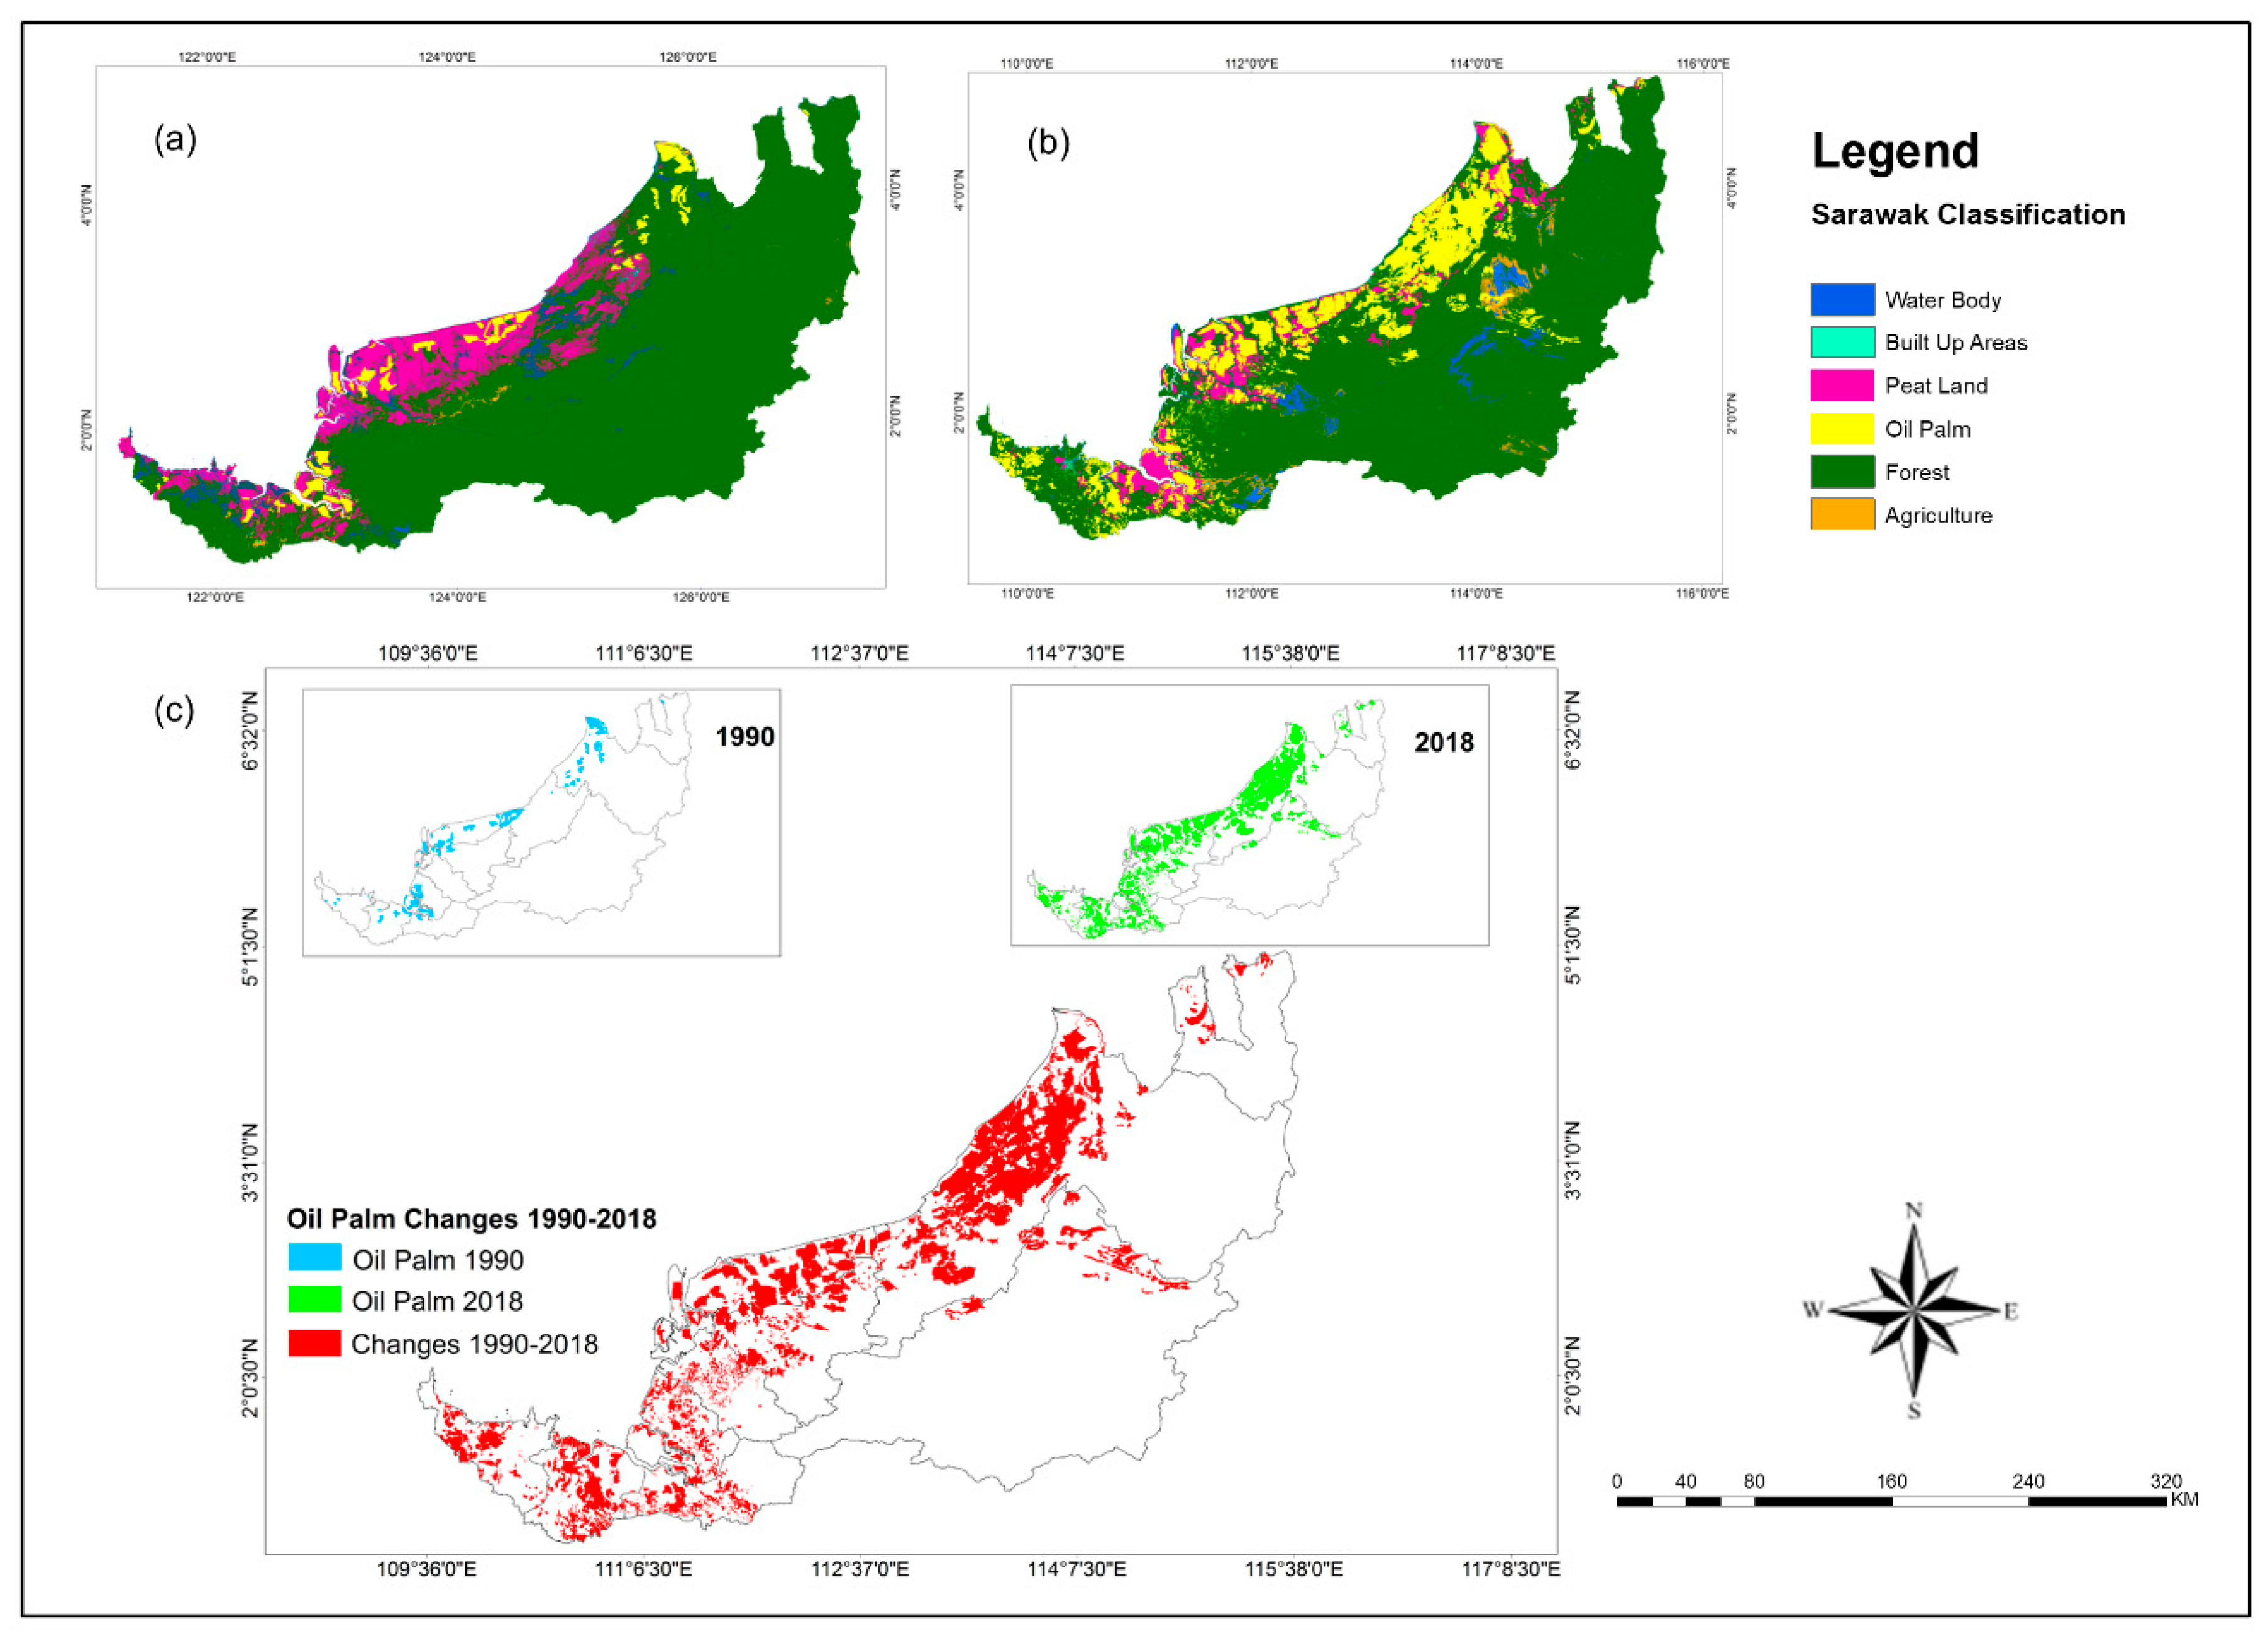
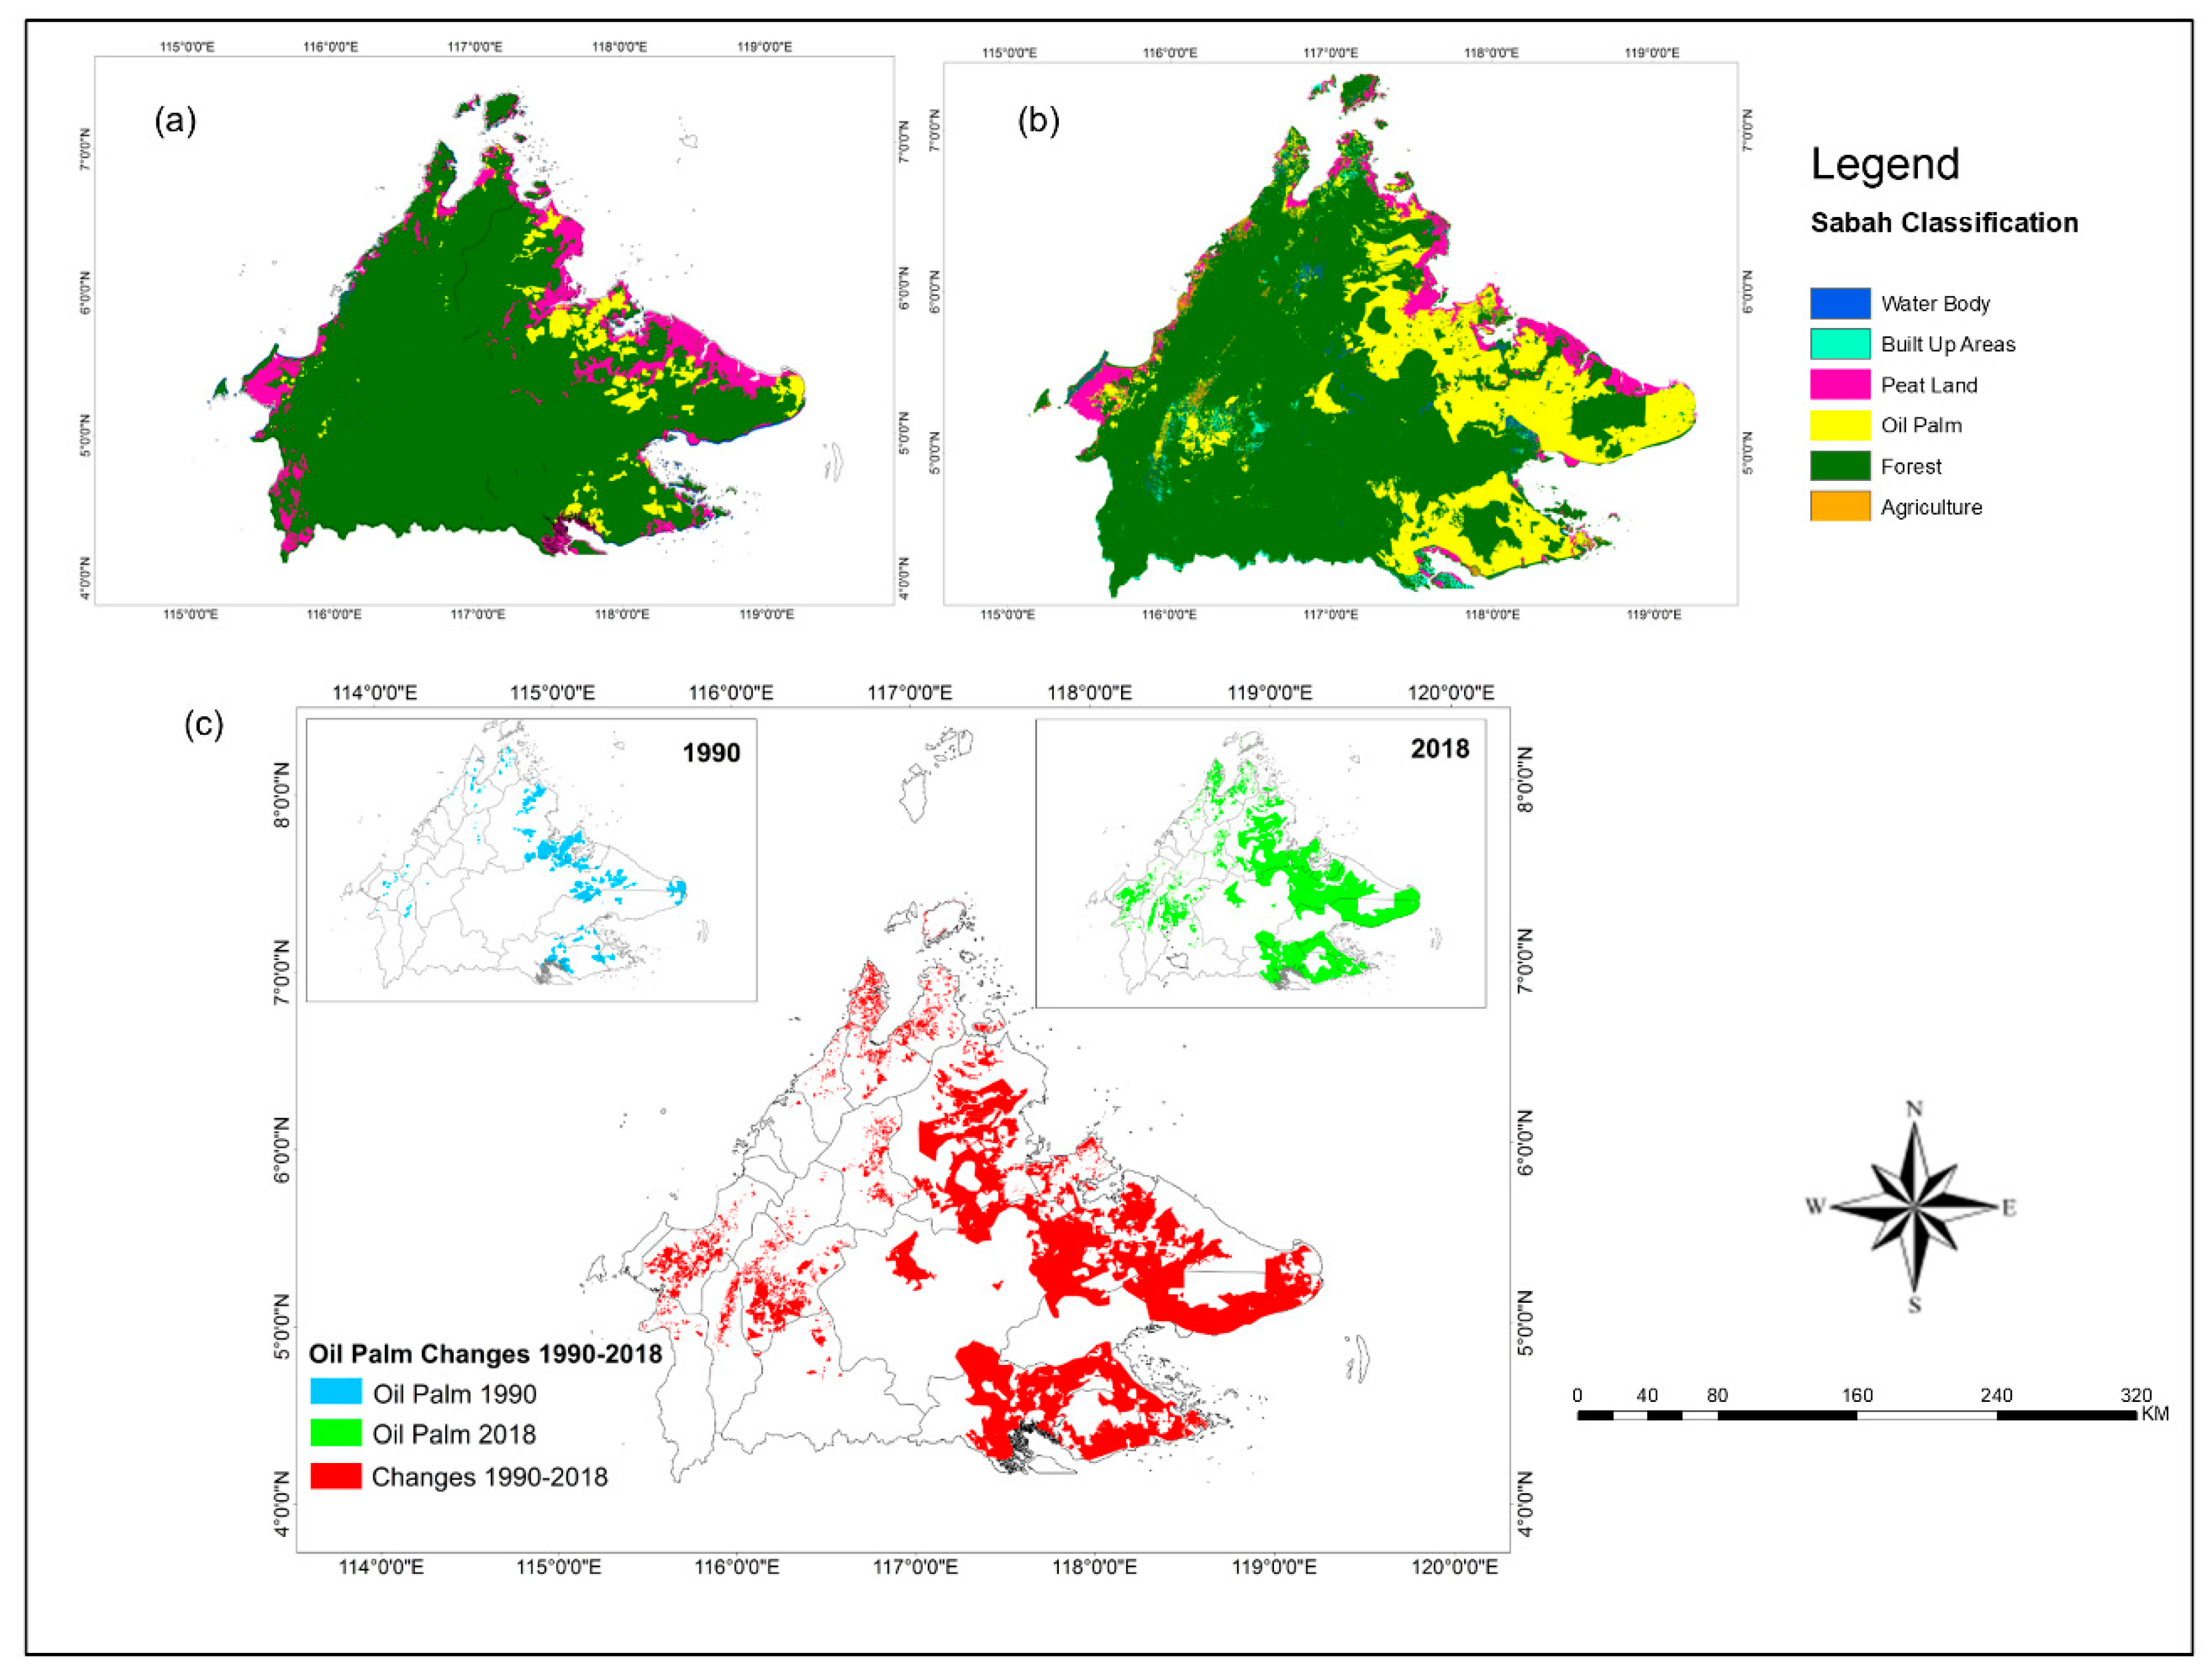
3.3. Oil Palm Plantation Changes

In 1990, the expansion of Sarawak palm oil plantations was still far behind Sabah and Peninsular Malaysia; the state had around 366,799 ha of oil palm plantation area. Expansion of oil palm cultivation increased by 81% (increased by about 1.6 million ha) from 1990 to 2018. In 1990, the state had only 366,799 ha of oil palm plantation area, while in 2018 the oil palm plantation area rose to 1.9 million ha (Table 7). On the other hand, Sarawak has the largest forest land in Malaysia. In 1990, only 0.2% (635.6 ha) of total oil palm was planted in the forest area. However, within 28 years, the oil palm planted on forest land rose staggeringly by 14% (276,456 ha). Sarawak also has the largest area of peatland. The expansion of oil palm plantation area has occurred tremendously on peatland area compared to the oil palm on the forest. The coverage area of oil palm planted on peatland in 1990 was 197,323 ha (54%), which later increased to 657,273 ha (34%) by 2018. Besides, the greatest expansion of oil palm plantation area in Sarawak can be seen in the other land used (agriculture land). In 1990, there was 168,840 ha of oil palm planted on agricultural land, but the coverage area expanded to 990,891 ha in 2018 with an increase of 83% (Figure 5). Overall, within 28 years, oil palm cover has increased tremendously at the cost of 18% of forest and 30% of peatland (Figure 6).
Sabah oil palm plantation area in 1990 was more than its neighboring state, Sarawak, with a total area of 695,523 ha. Expansion of oil palm plantations occurred rapidly through 2018, with oil palm plantation area now exceeding 2 million ha, with the decadal growth in 28 years approaching 65% (1.32 million ha) (Table 8). The total area of oil palm plantations expansion in forest areas in 1990 was 172,956 ha. Expansion of oil palm plantation area since 1990 has occurred at the highest rate on other land used (agriculture land) with 74% (517,246 ha) coverage compared to the oil palm expansion on forest area and peatland area with 25% (172,956 ha) and 1% (5321 ha), respectively. Meanwhile, in 2018, there were 2 million ha of oil palm planted in Sabah, with 14% planted in forest (276,431 ha). The other 2% and 84% of the total oil palm plantation were planted on peatland and other land use (agriculture land), with each category covering 35,627 ha and 1.2 million ha, respectively (Figure 7). Overall, 1.4 million ha of oil palm has expanded from 1990 to 2018. Oil palm on agricultural land has seen major expansion since 1990 with an increase in cultivation area as much as 90% (1.2 million ha), followed by oil palm expansion on the forest with an 8% increment (103,474 ha) and 2% (30,306 ha) expansion on peatland (Figure 8). Based on our results, it can be concluded that even though there occurred significant conversion of forest and peatlands between 1990 and 2018, only around 10% of this was incurred as a result of oil palm expansion and associated land-use conversion.

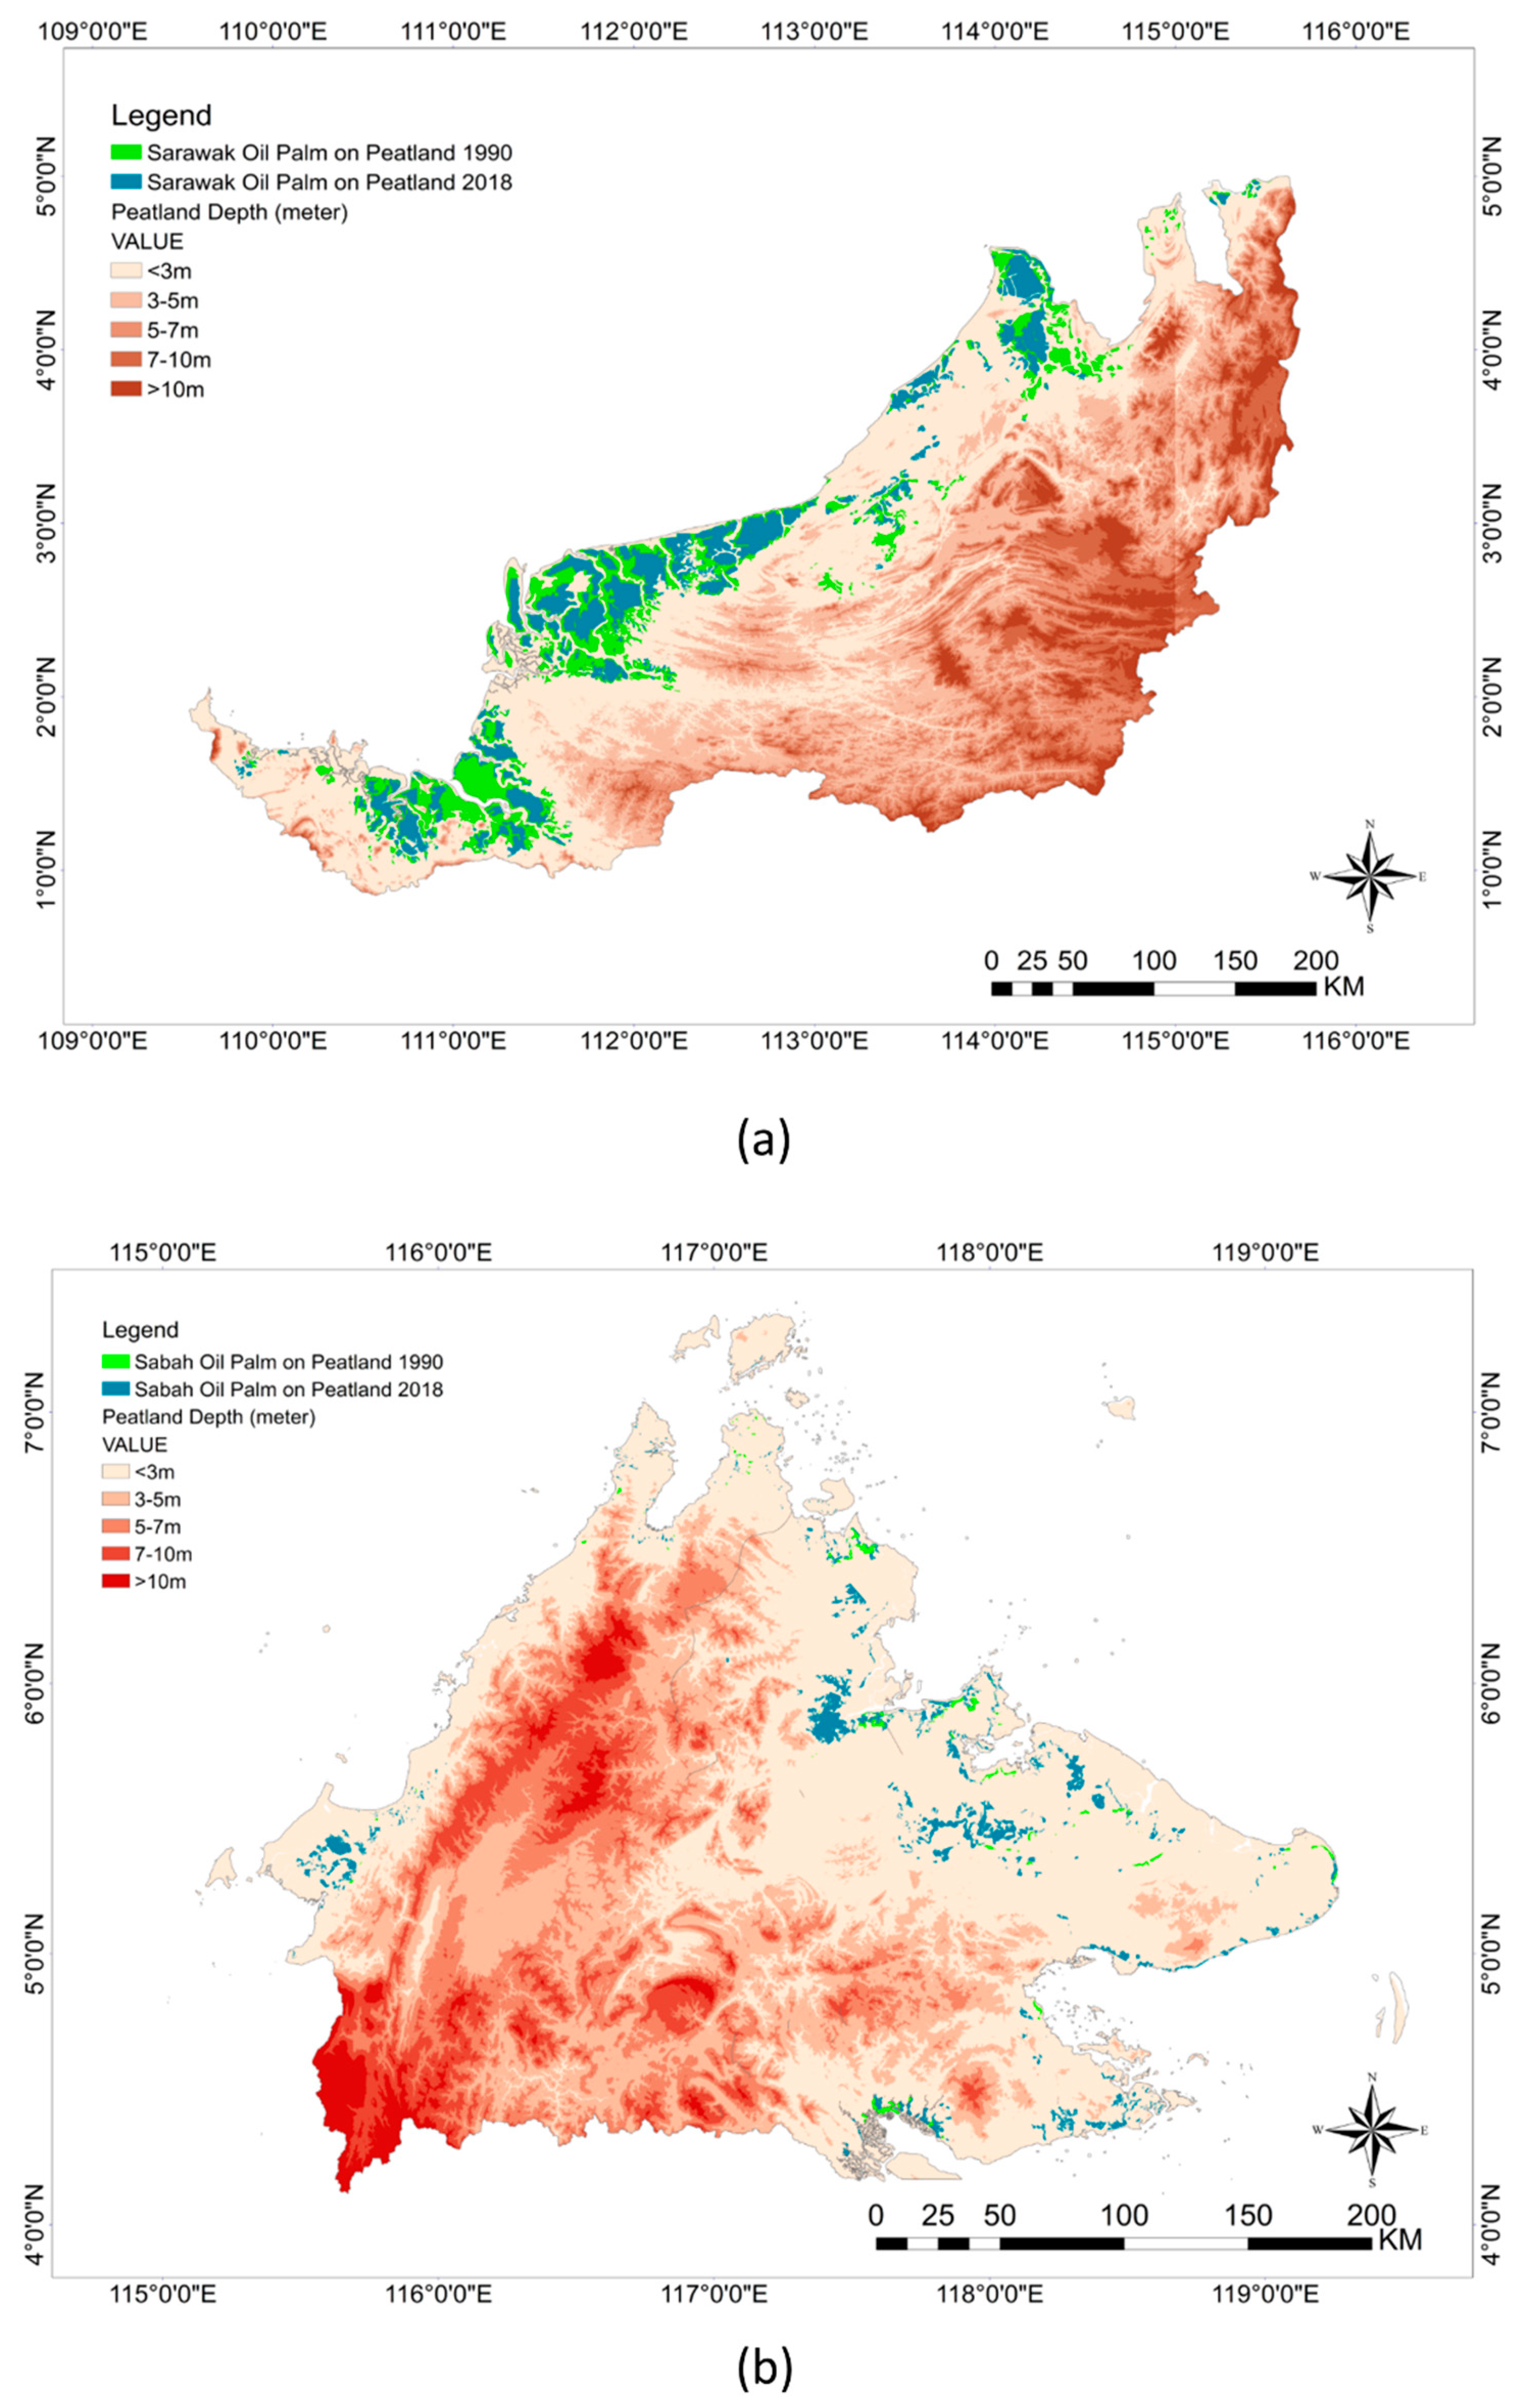
3.4. Peat Characteristics on Oil Palm Cultivation

This study did not intend to assess oil palm cultivation from an economic perspective, but the yield potential of oil palm planted on peatland has been a controversial issue debated worldwide. Soil depth has been seen as one of the major impacts that can affect the yield economics of oil palm cultivation on peatland. The soil depth is related to whether the soils are shallow (0–1 m), moderate (>1–3 m), or deep (>3 m). Standard operating procedures (SOP) for oil palm cultivation on peat were adopted by the National Action Plan for Peatlands (NAPP) in 2011 under the first to third National Physical Plan (NPP1-3) to establish a high standard for commercial oil palms; the target was to produce high initial yield and sustain the high yield throughout its life cycle, as well as to minimize the negative impact on peatland. All oil palms were supposed to be cultivated and planted on peat that is less than 3 m in depth (shallow to moderate peat depth). Based on our study findings, 100% of oil palms on peat in Sarawak and Sabah were planted at peat depth less than 3 m (Figure 9a,b).

3.5. Annual Oil Palm, Forest, and Peatlands CO2 Emissions and Uptake

Based on the mapped palm oil plantations in 2018, we estimated oil palm plantations on peat soil annual CO2 emissions for Sarawak and Sabah, which was found to be 0.01577 and 0.00086 Gt CO2-C yr−1, respectively (Table 9). The total annual CO2 emissions were also recorded, which were 0.01663 Gt CO2-C yr−1, based on a total area of 692,899.9 ha for Sarawak and Sabah. In contrast, estimated annual oil palm plantations on forest CO2 uptake for Sarawak and Sabah were 0.02267 and 0.02267 Gt CO2-C yr−1, respectively (Table 10). This has also given rise to a total annual CO2 uptake of 0.04533 Gt CO2-C yr−1 from an area of 552,886.78 ha for both states. The estimated forest annual CO2 uptake for Sarawak and Sabah was 0.26464 and 0.15007 Gt CO2-C yr−1, respectively (Table 11). A total annual carbon-CO2 uptake of 0.41471 Gt CO2-C yr−1 was recorded based on a total area of 12,959, 869.1 ha for both Sarawak and Sabah.

4. Discussion

4.1. Forest Cover Loss and Oil Palm Development

Sarawak forest cover decreased from 76% in 1990 to 67% in 2018 and Sabah forest cover decreased from 76% in 1990 to 64% in 2018. In the early 1990s, forest cover loss was primarily attributed to a migratory program that triggered the transition of forests into settlements and fostered land clearing activities for oil palm and other plantation endeavors [48]. The palm oil industry in Sabah grew rapidly with a setup of a few government organizations, such as the Sabah Land Development Board and Felda, who laid the groundwork for the land settlements scheme, and the 1990s can be considered the era when large-scale oil planting took off in Sabah. In 2000, the oil palm area exceeded a million hectares [2]. In parallel, there was an increase in oil palm growth in Sarawak in the 1990s and 2000s. From 1990 to 2018, Sarawak state encountered many developments as the country was moving towards the millennial century and the increase of nations and the state economy. Similarly, the last decade has seen a rapid expansion of oil palm plantations in Sabah and Sarawak—where there was a greater land availability as compared to Peninsular Malaysia. By 2018, the Sabah and Sarawak cultivation area accounted for 6.1% and 5.8% of the land area of Malaysia.
The Ministry of Agriculture Malaysia, through its policy forecast, the Third National Agricultural Policy (NAP3) 1999 [49], reported 3.1 million ha of oil palm cultivation area in 2000 and 3.6 million ha cultivation area in 2010, with an average of 50,000 ha annual expansion. However, the projection was not met, and underestimations occurred in 2000 itself—there were 3.3 million ha of oil palm cultivation area with 200,000 ha area overestimated with respect to the projection [10]. The new proposal by the primary industry′s ministry advises the cabinet to cap the maximum area of oil palm plantations for Malaysia at about 6.5 million ha, up from the 5.85 million ha at the end of 2018 [50]. The new proposal is expected to be achieved by 2023 based on the average annual expansion of plantations from 2013–2018. This move was made to dismiss accusations that oil palm plantations are the reason for deforestation.
Sarawak state government had targeted to develop about 2 million ha of oil palm plantation by 2020 [46]; our findings show that Sarawak’s oil palm plantation had reached 1.9 million ha in 2018 −18% overestimated than MPOB reports [51] and a recent study by Meijaard et al. 2018 [52]. Meanwhile, our study shows that Sabah has reached 2 million ha of oil palm area in 2018 with ~22% overestimated to those of [51,52]. However, in many recent studies, the estimates failed to include many independent smallholder plantings (i.e., those not included in a collaborative scheme setting with an industrial-scale producer); these plots are more difficult to map at a global scale because of their heterogeneous nature [26]. In tandem, it should be borne in mind that only 60.6% of oil palm plantations have received the Malaysian Sustainable Palm Oil (MSPO) certificate nationwide; this can make monitoring their sustainability targeted efforts difficult and might steer the government to revoke their licenses to sell palm oil presuming a paucity of standard compliance [53]. Our study carefully digitized every single oil palm area observed in the Landsat imagery scene, regardless of their status (certified and noncertified), which hence explained the differences from those previously reported (Table 12).
Cultivated areas were consistently increasing during the periods of analysis, as the main livelihood of the local people of Sabah and Sarawak shifted to the cultivation of crops. Between the 1990s and 2000s, forests and peatlands were the primary land areas used for oil palm plantations. The oil palm in agricultural land area in Sarawak increased from 46% in 1990 to 51% in 2018, while oil palm in agricultural land area in Sabah increased from 74% in 1990 to 84% in 2018. The cultivation of oil palm planted on peatlands in Sarawak is significantly higher compared to Sabah. Our findings showed that 34% (657 k ha) of the oil palm area in Sarawak in 2018 was planted on peatland; this is almost consistent with the statistics reported by Sarawak state, where in 2018 about 660,000 ha of Sarawak’s oil palm estates were found to be planted on peatland [51], while in Sabah there was only 2% (36 k ha) of oil palm planted on peatland in the same year.
Sarawak has about 1.6 million ha (70%) of Malaysia’s peat soil; our results indicated that 657,273 ha of oil palm was planted on peatland in 2018, meaning half a million ha were cleared for oil palm plantation. Whereas Sabah has about 117,000 ha (5%) of Malaysia’s peat soil, based on our study, 35,627 ha of oil palm were planted on Sabah peatland in 2018. Oil palm planters favor having their plantation on peat, partly as oil palms growing on peat have high fruit production abilities [54]. Moreover, planting oil palm on flat plains, such as lowland peatland, is easier for management and harvesting. However, our results for Sabah oil palm on peatland show that only 2% of the peatland had been cultivated with oil palm—a small increase of 1% from the initial study year in 1990. Sabah lacks extensive swamp forest formations, and consequently, the amount of oil palm on peat is minimal.
The absolute land area covered by oil palm is often overlooked in favor of reciting percentages of change; however, it is important to look at the quality of land that has been used for oil palm and the issue of deforestation. Malaysia has the highest density of oil palm in the world but also retains 55% of the total land areas under forest cover (excluding agroforestry and oil palm) [55,56,57]. The results of our analysis are consistent with the statistics reported by the state government, where Sabah and Sarawak proudly maintain their forest cover at 63% and 66% coverage in 2018 [26,58]. From the total global agricultural area of 1.6 billion ha, the oil palm plantation alone only accounted for 0.13% (Sabah) and 0.12% (Sarawak); these statistics provide supporting evidence that oil palm plantation is not a major cause of deforestation in Malaysia. In addition, even though our study reveals that the proportion of forest area destroyed by oil palm development is lower than the proportion of peatland area destroyed, the temporal analysis still shows signs of forest loss due to oil palm expansion. Sarawak has lost approximately 18% of its forest and 30% of its peatland, and Sabah has lost 8% of its forest and 2% of its peatland, from 1990–2018.
The role of oil palm development in deforestation is a controversial issue, with advocates in plantation development claiming that the oil palm cultivation area has mostly been limited to previously degraded land, while the opponents claimed it is the primary driver of deforestation. In Sabah and Sarawak, oil palm is mainly planted in designated agricultural land. The state′s government has a very clear land usage policy that embraces approaches to restore and regenerate the degraded forests by growing indigenous tree species that would mature in a short period, which could reduce the pressure to open up new land for oil palm cultivation, hence reducing the impact of deforestation.

4.2. CO2 Related from Forest Converted for Oil Palm Plantations and from Peatland

As estimated in this study, CO2 emissions of Sarawak (0.01577 Gt CO2-C yr−1) oil palm plantations on peat soil were higher compared to Sabah (0.00086 Gt CO2-C yr−1). This might be due to the vast area of Sarawak peatland. Both Sarawak and Sabah, as main producers of palm oil in Malaysia, have contributed to a total of annual CO2 emissions of 0.01663 Gt CO2-C yr−1. The total CO2 emissions from both states, however, presents a magnitude lower than the projection for Kalimantan, Indonesia palm oil expansion in 2020 (0.12–0.15 Gt CO2-C yr−1) [36]. In addition, Sarawak and Sabah total CO2 uptake from both oil palm plantations on forest land (0.04533 Gt CO2-C yr−1) and total forest annual CO2 uptake (0.41471 Gt CO2-C yr−1) were higher compared to the oil palm plantations on peat soil CO2 emissions (0.01663 Gt CO2-C yr−1). Considering the annual CO2 emissions and uptake, we estimate that oil palm plantations on peat soils offset, by only 4%, the forest CO2 uptake in the year 2018. This suggests a minimal carbon impact due to land-use change relative to time. While the estimation did not include emission/uptake from soils, this shows the possibility to achieve carbon neutrality for sustainable oil palm activities in the long run in this particular region [47].

4.3. Peatland Depth Characteristics and Relationship with Palm Oil Production and CO2 Emission

The national action plan governed by the Malaysian Palm Oil Council (MPOC) has set a guideline on the oil palm plantation on peatland that must refer to the standard operating procedure to sustain the peatland. Peatland is an organic soil with wet and high moisture water content, hence increasing the productivity of the plantations and producing better yield cultivation compared to other mineral lands [59,60,61,62]. This explains the greater expansion of oil palm cultivation on peatland in Sabah and Sarawak from 1990 to 2018. Peatland depth is one of the many peatland characteristics that relate to yield production. Peatland depth and decomposition of organic matter in soil affect oil palm plantation practices. The suitability of peat depth for oil palm plantation was classified from shallow class (0.5–1 m)—the most suitable—to very deep (˃3 m) (MPOB). The best management practice of oil plantation on peatland in Malaysia was at a peat depth of less than 3 m [59,60]. Any plantation or replantation of oil palm at a depth of more than 3 m can be harmful to the peatland ecosystem and might not help in its production as well. For example, if the plantation was planted at a depth of more than 5 m, it will release more carbon and increase greenhouse gasses in the atmosphere (GHGs). The relationship of tropical peatland with CO2 emission, especially in Peninsular Malaysia, Sarawak, and Sabah, is still undergoing a lot of research. Many studies focused on temperate peatland and only a few studies were conducted on tropical peatland [63]. According to MPOC, Malaysian lowland peatland mostly contains wood and has the minimum CO2 emission compared to temperate peatland. The wood in the soil will not be decomposed easily to lead to CO2 emission due to its water content. MPOC has highlighted that different depths of soil have different soil character and contain different organic or inorganic content that become factors of CO2 emission. Tropical peatlands, such as in Sarawak and Sabah are under this category, and mostly the oil palm plantations take place at 0.5 m or less than 3 m (Figure 9) [64]. It will be important that future research investigates the relationship between peatland depth and the effect of CO2 emission resulting from oil palm plantation-induced peatland forest conversion at the local level.

5. Conclusions

In this study, we integrated multitemporal remote sensing optical data and GIS analysis tools for updating land cover changes and carbon dioxide emissions estimations from forest conversion driven by oil palm plantations in Sarawak and Sabah, Malaysia. Overwhelming global demand for affordable vegetable oil has driven the fast expansion of oil palm plantations, especially in the Southeast Asia region. This expansion has triggered many alarming environmental issues, such as deforestation and the destruction of natural carbon storage. The palm oil industry in Sarawak and Sabah started in 1990, with forests as the primary land source. Our result shows that the expansion of oil palm in deeper peatland boomed in the 2000s. Along this line, the utilization of peatland and deforestation for palm oil plantations has been identified as one of the main challenges that need to be addressed to control natural carbon emission into the atmosphere.
Based on our findings, we can state that oil palm-related natural carbon emissions could be reduced by adopting and implementing RSPO best management practices to ensure that all oil palm plantations holders align with the sustainability criteria. The government′s decision to limit the oil palm planted area to 6.5 million hectares by 2023 is a positive step to avoid further deforestation and CO2 emissions—especially the conversion of peatland into oil palm plantations. Clear land usage policy by the state government on land gazette and enforcing oil palm to only be planted on designated agricultural land will reduce pressure to open up new forest and peatland areas for oil palm plantation, hence reducing the impact of deforestation and promoting the restoration and regeneration degraded forests. Malaysia’s government has taken steps to protect their forests and peatland but stronger actions and enforcement should be conducted to promote more sustainable land use in the future. Additionally, the uptake capability of forests needs to be buttressed further to reduce the climate change impact in this area. Curbing tropical deforestation by conserving, protecting, regrowing forests, and planting can potentially reduce emissions and increase carbon sequestration from the atmosphere. This effort should target Sarawak and Sabah, which retain three-quarters of the remaining peat swamp forests in southeast Asia, to safeguard the region′s biodiversity and carbon stocks.

Author Contributions

Conceptualization, M.S.T.; methodology, W.S.W.M.J., R.U. and M.T.L.; software, N.F.S.S., W.S.W.M.J., A.M.M.K. and S.N.M.S.; validation, W.S.W.M.J., R.U. and M.T.L.; formal analysis, N.F.S.S., W.S.W.M.J., R.U. and M.T.L.; writing—original draft preparation, N.F.S.S., W.S.W.M.J., R.U. and M.T.L.; writing—review and editing, W.S.W.M.J., N.F.S.S., R.U., M.T.L., M.M., B.P., S.N.M.S., A.C., E.N.B., C.A.S., K.N.A.M. and M.S.T.; visualization, W.S.W.M.J., N.F.S.S. and A.M.M.K.; supervision, M.S.T., M.T.L. and K.N.A.M.; funding acquisition, M.S.T. All authors have read and agreed to the published version of the manuscript.

Funding

This research was funded by Malaysian Ministry of Higher Education (grant no: KK-2019-014).

Acknowledgments

We would like to thank the Malaysian Ministry of Higher Education for funding this study through research grant KK-2019-014. This manuscript was contributed by all co-authors.

Conflicts of Interest

The authors declare no conflict of interest.

References

  1. Shevade, V.S.; Loboda, T.V. Oil palm plantations in Peninsular Malaysia: Determinants and constraints on expansion. PLoS ONE 2019, 14, e0210628. [Google Scholar] [CrossRef] [PubMed] [Green Version]
  2. Gunarso, P.; Hartoyo, M.E.; Agus, F.; Killeen, T.J. Oil Palm and Land Use Change in Indonesia, Malaysia and Papua New Guinea. Reports from the Technical Panels of the 2nd Greenhouse Gas Working Group of the Roundtable on Sustainable Palm Oil (RSPO). 2013, pp. 29–64. Available online: https://www.tropenbos.org/resources/publications/oil+palm+and+land+use+change+in+indonesia,+malaysia+and+papua+new+guinea (accessed on 1 March 2020).
  3. Austin, K.G.; Mosnier, A.; Pirker, J.; McCallum, I.; Fritz, S.; Kasibhatla, P.S. Shifting patterns of oil palm driven deforestation in Indonesia and implications for zero-deforestation commitments. Land Use Policy 2017, 69, 41–48. [Google Scholar] [CrossRef] [Green Version]
  4. Jaafar, W.S.W.M.; Maulud, K.N.A.; Kamarulzaman, A.M.M.; Raihan, A.; Md Sah, S.; Ahmad, A.; Saad, S.N.M.; Azmi, A.T.M.; Syukri, N.K.A.J.; Khan, W.R. The Influence of Deforestation on Land Surface Temperature—A Case Study of Perak and Kedah, Malaysia. Forests 2020, 11, 670. [Google Scholar] [CrossRef]
  5. Amarthalingam, S. Plantations main drivers of deforestation in Sabah, Sarawak. The Edge Financial Daily. 16 January 2017. Available online: https://www.theedgemarkets.com/article/plantations-main-drivers-deforestation-sabah-sarawak (accessed on 1 January 2020).
  6. Hansen, T.S. Spatio-temporal aspects of land use and land cover changes in the Niah catchment, Sarawak, Malaysia. Singap. J. Trop. Geogr. 2005, 26, 170–190. [Google Scholar] [CrossRef]
  7. Ramdani, F.; Hino, M. Land use changes and GHG emissions from tropical forest conversion by oil palm plantations in Riau Province, Indonesia. PLoS ONE 2013, 8, e70323. [Google Scholar] [CrossRef] [Green Version]
  8. Schrier-Uijl, A.P.; Silvius, M.; Parish, F.; Lim, K.H.; Rosediana, S.; Anshari, G. Environmental and social impacts of oil palm cultivation on tropical peat: A scientific review. In Proceedings of the Roundtable of Sustainable Palm Oil, Kuala Lumpur, Malaysia, 19 November 2013; pp. 131–168. [Google Scholar]
  9. Seegräf, M.; May, D.; Breuer, T.; Schukat, P. Palm oil—Sustainability is possible! In Promotion and Certification of Smallholders Helps Sustainable Palm Oil Production; Federal Ministry for the Environment, Nature Conservation and Nucleur Safety of the Federal Republic of Germany: Eschborn, Germany, 2010. [Google Scholar]
  10. WWF. Land Use and the Oil Palm Industry in Malaysia. 2000. Available online: http://scholar.google.com/scholar?hl=en&btnG=Search&q=intitle:Land+Use+and+the+Oil+Palm+Industry+in+Malaysia–3 (accessed on 10 December 2019).
  11. Yusuf, A. Malaysia to Cap 6.5 m ha of Oil Palm Plantations by 2023. New Straits Times. 4 March 2019. Available online: https://www.nst.com.my/business/2019/03/466143/malaysia-cap-65m-ha-oil-palm-plantations-2023 (accessed on 1 March 2020).
  12. Koh, L.P.; Miettinen, J.; Liew, S.C.; Ghazoul, J. Remotely sensed evidence of tropical peatland conversion to oil palm. Proc. Natl. Acad. Sci. USA 2011, 108, 5127–5132. [Google Scholar] [CrossRef] [PubMed] [Green Version]
  13. Miettinen, J.; Shi, C.; Liew, S.C. Land cover distribution in the peatlands of Peninsular Malaysia, Sumatra and Borneo in 2015 with changes since 1990. Glob. Ecol. Conserv. 2016, 6, 67–78. [Google Scholar] [CrossRef] [Green Version]
  14. Gaveau, D.L.; Sheil, D.; Salim, M.A.; Arjasakusuma, S.; Ancrenaz, M.; Pacheco, P.; Meijaard, E. Rapid conversions and avoided deforestation: Examining four decades of industrial plantation expansion in Borneo. Sci. Rep. 2016, 6, 32017. [Google Scholar] [CrossRef] [PubMed]
  15. Hansen, M.C.; Potapov, P.V.; Moore, R.; Hancher, M.; Turubanova, S.A.; Tyukavina, A.; Kommareddy, A. High-resolution global maps of 21st-century forest cover change. Science 2013, 342, 850–853. [Google Scholar] [CrossRef] [PubMed] [Green Version]
  16. Chong, K.L.; Kanniah, K.D.; Pohl, C.; Tan, K.P. A review of remote sensing applications for oil palm studies. Geo-Spat. Inf. Sci. 2017, 20, 184–200. [Google Scholar] [CrossRef] [Green Version]
  17. Kamlun, K.U.; Goh, M.H.; Teo, S.; Tsuyuki, S.; Phua, M.H. Monitoring of deforestation and fragmentation in Sarawak, Malaysia between 1990 and 2009 using Landsat and SPOT images. J. For. Environ. Sci. 2012, 28, 152–157. [Google Scholar] [CrossRef] [Green Version]
  18. Hamzah, K.A.; Malik, R.A.; Joseph, K.T. Malaysia: Land- Use Change in the Oil Palm Sector. In Proceedings of the 9th Annual Roundtable Meeting on Sustainable Palm Oil, Sabah, Malaysia, 22 November 2013. [Google Scholar]
  19. MPOB. The Malaysian Palm Oil Facts. 2018. Available online: http://www.mpob.gov.my (accessed on 3 February 2020).
  20. Osman, R.; Phua, M.H.; Ling, Z.Y.; Kamlun, K.U. Monitoring of Deforestation Rate and Trend in Sabah between 1990 and 2008 Using Multitemporal Landsat Data. J. For. Environ. Sci. 2012, 28, 144–151. [Google Scholar] [CrossRef]
  21. Uning, R.; Latif, M.T.; Othman, M.; Juneng, L.; Hanif, N.M.; Nadzir, M.S.M.; Maulud, K.N.A.; Jaafar, W.S.W.M.; Said, N.F.S.; Ahamad, F.; et al. A Review of Southeast Asian Oil Palm and Its CO2 Fluxes. Sustainability 2020, 12, 5077. [Google Scholar] [CrossRef]
  22. Hergoualc’h, K.; Verchot, L.V. Stocks and fluxes of carbon associated with land use change in Southeast Asian tropical peatlands: A review. Glob. Biogeochem. Cycles 2011, 25. [Google Scholar] [CrossRef] [Green Version]
  23. Gibbs, H.K.; Ruesch, A.S.; Achard, F.; Clayton, M.K.; Holmgren, P.; Ramankutty, N.; Foley, J.A. Tropical forests were the primary sources of new agricultural land in the 1980s and 1990s. Proc. Natl. Acad. Sci. USA 2010, 107, 16732–16737. [Google Scholar] [CrossRef] [PubMed] [Green Version]
  24. Cooper, H.V.; Evers, S.; Aplin, P.; Crout, N.; Dahalan, M.P.B.; Sjogersten, S. Greenhouse gas emissions resulting from conversion of peat swamp forest to oil palm plantation. Nat. Commun. 2020, 11, 1–8. [Google Scholar]
  25. Canadell, J.G.; Le Quéré, C.; Raupach, M.R.; Field, C.B.; Buitenhuis, E.T.; Ciais, P.; Marland, G. Contributions to accelerating atmospheric CO2 growth from economic activity, carbon intensity, and efficiency of natural sinks. Proc. Natl. Acad. Sci. USA 2007, 104, 18866–18870. [Google Scholar] [CrossRef] [Green Version]
  26. Town & Regional Planning Department of Sabah. Sabah Structure Plan 2033; Ministry of Local Government and Housing: Town and Regional Planning Department: Kota Kinabalu, Malaysia, 2016. Available online: http://www.townplanning.sabah.gov.my (accessed on 1 December 2019).
  27. Forest Department of Sarawak. Forest Research & Development. Available online: https://forestry.sarawak.gov.my/ (accessed on 1 December 2019).
  28. Federal Department of Town and Country Planning Peninsular Malaysia. National Physical Plan-3; Ministry of Urban Wellbeing, Housing and Local Government: Kuala Lumpur, Malaysia, 2016. Available online: https://www.melaka.gov.my/ms/koleksi-media/penerbitan/lain-lain/lampiran-ll/rancangan-fizikal-negara-ke-3-rfn3 (accessed on 1 December 2019).
  29. USGS Global Visualization Viewer (GloVis). Available online: http://glovis.usgs.gov (accessed on 10 November 2019).
  30. Food and Agriculture Organization–FAO. FAO/IIASA/ISRIC/ISSCAS/JRC, Harmonized World Soil Database (Version 1.1); FAO: Rome, Italy; IIASA: Laxenburg, Austria, 2009. [Google Scholar]
  31. Geosystems. Haze Reduction, Atmospheric and Topographic Correction. In User Manual ATCOR2 and ATCOR3; Geosystems GmbH: Geneva, Switzerland, 2013. [Google Scholar]
  32. ERDAS Imagine 2018; Hexagon Geospatial: Norcross, GA, USA; Peachtree Corners Circle Norcross: Norcross, GA, USA, 2018.
  33. ESRI. ArcGIS Desktop: Release 10; Environmental Systems Research Institute: Redlands, CA, USA, 2016. [Google Scholar]
  34. Zhu, Z.; Woodcock, C.E. Object-based cloud and cloud shadow detection in Landsat imagery. Remote Sens. Environ. 2012, 118, 83–94. [Google Scholar] [CrossRef]
  35. ENVI 5.3. Exelis Visual Information Solutions; Harris Geospatial Corporation: Boulder, CO, USA, 2010. [Google Scholar]
  36. Carlson, K.M.; Curran, L.M.; Asner, G.P.; Pittman, A.M.; Trigg, S.N.; Adeney, J.M. Carbon emissions from forest conversion by Kalimantan oil palm plantations. Nat. Clim. Chang. 2013, 3, 283–287. [Google Scholar] [CrossRef]
  37. Miettinen, J.; Hooijer, A.; Tollenaar, D.; Page, S.; Malins, C.; Vernimmen, R.; Liew, S.C. Historical Analysis and Projection of Oil Palm Plantation Expansion on Peatland in Southeast Asia. ICCT White Paper. 17 February 2012, pp. 1–51. Available online: https://theicct.org/sites/default/files/publications/ICCT_palm-expansion_Feb2012.pdf (accessed on 14 March 2020).
  38. GeoRSPO. Roundtable on Sustainable Palm Oil. Available online: https://rspo.org/members/georspo (accessed on 10 November 2019).
  39. See, L.; Bayas, J.C.L.; Schepaschenko, D.; Perger, C.; Dresel, C.; Maus, V.; Salk, C.; Weichselbaum, J.; Lesiv, M.; McCallum, I.; et al. LACO-Wiki: A New Online Land Cover Validation Tool Demonstrated Using GlobeLand30 for Kenya. Remote Sens. 2017, 9, 754. [Google Scholar] [CrossRef] [Green Version]
  40. Hansen, M.C.; Stehman, S.V.; Potapov, P.V.; Arunarwati, B.; Stolle, F.; Pittman, K. Quantifying changes in the rates of forest clearing in Indonesia from 1990 to 2005 using remotely sensed data sets. Environ. Res. Lett. 2009, 4, 034001. [Google Scholar] [CrossRef]
  41. Talukdar, S.; Singha, P.; Mahato, S.; Pal, S.S.; Liou, Y.A.; Rahman, A. Land-use land-cover classification by machine learning classifiers for satellite observations-A review. Remote Sens. 2020, 12, 1135. [Google Scholar] [CrossRef] [Green Version]
  42. Food and Agriculture Organization GeoNetwork. Available online: http://www.fao.org/soils-portal/soil-survey/soil-maps-and-databases/faounesco-soil-map-of-the-world/en/ (accessed on 11 November 2019).
  43. Maxwell, A.E.; Warner, T.A.; Fang, F. Implementation of machine-learning classification in remote sensing: An applied review. Int. J. Remote Sens. 2018, 39, 2784–2817. [Google Scholar] [CrossRef] [Green Version]
  44. Srivastava, P.K.; Han, D.; Rico-Ramirez, M.A.; Bray, M.; Islam, T. Selection of classification techniques for land use/land cover change investigation. Adv. Space Res. 2012, 50, 1250–1265. [Google Scholar] [CrossRef]
  45. Bouaziz, M.; Eisold, S.; Guermazi, E. Semiautomatic approach for land cover classification: A remote sensing study for arid climate in southeastern Tunisia. Euro-Mediterr. J. Environ. Integr. 2017, 2, 24. [Google Scholar] [CrossRef] [Green Version]
  46. Manning, F.C.; Kho, L.K.; Hill, T.C.; Cornulier, T.; Teh, Y.A. Carbon Emissions from Oil Palm Plantations on Peat Soil. Front. For. Glob. Chang. 2019, 2, 37. [Google Scholar] [CrossRef] [Green Version]
  47. Fowler, D.; Nemitz, E.; Misztal, P.; Di Marco, C.; Skiba, U.; Ryder, J.; Helfter, C.; Cape, J.N.; Owen, S.; Dorsey, J.; et al. Effects of land use on surface-atmosphere exchanges of trace gases and energy in Borneo: Comparing fluxes over oil palm plantations and a rainforest. Philos. Trans. R. Soc. B Biol. Sci. 2011, 366, 3196–3209. [Google Scholar] [CrossRef]
  48. Meléndez, M.R.; Ponce, W.P. Pollination in the oil palms Elaeis guineensis, E. oleifera and their hybrids (OxG), in tropical America. Pesqui. Agropecuária Trop. 2016, 46, 102–110. [Google Scholar] [CrossRef] [Green Version]
  49. Federal Department of Town and Country Planning Peninsular Malaysia. Third National Agricultural Policy (1998–2010) Executive Summary; Ministry of Agriculture: Kuala Lumpur, Malaysia, 1999; pp. 1–16. [Google Scholar]
  50. The Star. Cap on Oil Palm Estates Proposed. Available online: https://www.thestar.com.my/business/business-news/2019/03/06/cap-on-oil-palm-estates-proposed/ (accessed on 6 December 2019).
  51. MPOB. Oil Palm Planted Area. 2018. Available online: http://bepi.mpob.gov.my/images/area/2018/Area_summary.pdf (accessed on 6 December 2019).
  52. Meijaard, E.; Garcia-Ulloa, J.; Sheil, D.; Wich, S.A.; Carlson, K.M.; Juffe-Bignoli, D.; Brooks, T.M. Oil palm and biodiversity. In A Situation Analysis by the IUCN Oil Palm Task Force; IUCN Publication: Gland, Switzerland, 2018. [Google Scholar] [CrossRef]
  53. Ili, A. Only 7.9% of Private Oil Palm Plantations in Perak Are Registered with MSPO, Says Kok; The Star. Available online: https://www.thestar.com.my/news/nation/2019/12/14/only-79-of-private-oil-palm-plantations-in-perak-are-registered-with-mspo-says-kok (accessed on 14 December 2019).
  54. Phillips, V.D. Peatswamp ecology and sustainable development in Borneo. Biodivers. Conserv. 1998, 7, 651–671. [Google Scholar] [CrossRef]
  55. Global Oils and Fats Business Online. Managing Forests the Malaysian Way. Available online: http://gofbonline.com/managing-forests/ (accessed on 3 March 2020).
  56. Kaur, D. Palm Oil Is Not Cause of Deforestation, Says PM; The Malaysian Reserve. Available online: https://themalaysianreserve.com/2019/11/20/palm-oil-is-not-cause-of-deforestation-says-pm/ (accessed on 3 March 2020).
  57. Ying, T.X.; Dr M: Ban on Palm Oil Will Not Solve Deforestation. The Edge Markets. Available online: https://www.theedgemarkets.com/article/dr-m-ban-palm-oil-will-not-solve-deforestation (accessed on 3 March 2020).
  58. Sabah Forestry Department. Forest Policy. 2018. Available online: http://www.forest.sabah.gov.my/ (accessed on 1 December 2019).
  59. Veloo, R.; Van Ranst, E.; Selliah, P. Peat Characteristics and its Impact on Oil Palm Yield. NJAS Wagening J. Life Sci. 2015, 72, 33–40. [Google Scholar] [CrossRef]
  60. Kannan, P. Penyediaan Kawasan Bagi Tanaman Sawit; Risalah Sawit; MPOB: Kuala Lumpur, Malaysia, 2012; pp. 3–6. [Google Scholar]
  61. Malaysian Oil Palm Council (MPOC). Available online: http://mpoc.org.my/malaysian-peat-soils-are-different-from-temperate-peat-soils-and-have-lower-co2-emissions-2/ (accessed on 15 February 2020).
  62. Malaysia Palm Oil Board (MPOB). Tanah Gambut dan Tanaman Kelapa Sawit. Submitted work.
  63. Melling, L.; Goh, K.J.; Chaddy, A.; Hatano, R. Soil CO2 Fluxes from Different Ages of Oil Palm in Tropical Peatland of Sarawak, Malaysia. Trop. Peatl. Ecosyst. 2015, 982, 24–35. [Google Scholar]
  64. Parish, F.; Lim, S.S.; Perumal, B.; Giesen, W. RSPO Manual on Best Management Practices (BMPs): For Management and Rehabilitation of Natural Vegetation Associated with Oil Palm Cultivation on Peat; RSPO: Kuala Lumpur, Malaysia, 2012. [Google Scholar]
Figure 1. Study Area—Sarawak and Sabah states.
Forests 11 01285 g001
Figure 2. Flow chart demonstrating the workflow incorporated for land use and land cover extraction and classification.
Forests 11 01285 g002
Figure 3. The phase of creating a seamless mosaic product from individual Landsat image; (a) Landsat-8 OLI, 10 June 2018; (b) Landsat-8 OLI, 18 June 2018; and (c) 2018 cloud-free Landsat Image over Kuching, Sarawak area.
Forests 11 01285 g003
Figure 4. Training sample selection for digitizing oil palm plantation area based on visual interpretation on Landsat-5, Sarawak area in 1990; (a) empty scene, (b) selecting oil palm training sample, and (c) oil palm manual extraction polygon overlaid with overall classification result.
Forests 11 01285 g004
Figure 5. Oil palm expansion on forest, peatland, and agricultural land in Sarawak in 1990 and 2018 (note: oil palm area on forest 1990 = 636 ha and oil palm area on forest 2018 = 276,820 ha).
Forests 11 01285 g005
Figure 6. Sarawak oil palm development: (a) 1990 as the initial stat, (b) 2018, and (c) changes in oil palm development.
Forests 11 01285 g006
Figure 7. Oil palm expansion into forest, peatland, and agricultural areas in Sabah between 1990 and 2018 (note: oil palm area on peatland 1990 = 5321 ha and oil palm area on peatland 2018 = 35,627 ha).
Forests 11 01285 g007
Figure 8. Sabah oil palm development: (a) 1990 as the initial state, (b) 2018, and (c) changes in oil palm development.
Forests 11 01285 g008
Figure 9. Oil palm development on peatlands at (a) Sarawak and (b) Sabah.
Forests 11 01285 g009
Table 1. Datasets specification used in the study.
NoSource DataData DescriptionData Characteristics
1Landsat—5
1990
Thematic Mapper ™
30-m resolution
B1 (0.45–0.52)B2 (0.52–0.60)
B3 (0.63–0.69)B4 (0.76–0.90)
B5 (1.55–1.75)B6 (10.40–12.50)
B7 (2.09–2.35)(Thermal)
http://glovis.usgs.gov/
2Landsat—8
2018
Operational Land Images (OLI) and Thermal Infrared Sensor (TIRS)
30-m resolution
B1 (0.44–0.45)B2 (0.45–0.51)
B3 (0.53–0.59)B4 (0.64–0.67)
B5 (0.85–0.88)B6 (1.57–1.65)
B7 (2.11–2.29)B8 (0.50–0.68)
B9 (1.36–1.38)B10 (10.60–11.19)
B11 (11.50–12.51) (Thermal)(Thermal)
http://glovis.usgs.gov/
3Department of Agriculture Sabah and SarawakSoil map (hardcopy) year 1990 for Sabah and Sarawak. Department of Agriculture, Sabah
Department of Agriculture, Sarawak
4The Food and Agriculture Organization (FAO)/United Nations Educational, Scientific, and Cultural Organization (UNESCO)Extract peatland polygon layer based on Harmonized World Soil Map for Malaysiahttp://www.fao.org/soils-portal/soil-survey/soil-maps-and-databases/faounesco-soil-map-of-the-world/en/
5Malaysia Palm Oil Board (MPOB)Oil Palm Plantation area statistical data in 2018http://bepi.mpob.gov.my/index.php/en/
6Forest Department Sarawak and Sabah Forestry Department
Forest area statistical data in 1990 and 2018https://forestry.sarawak.gov.my/page-0-461-1170-tid.html
Sabah Forestry Department Annual Report
7Roundtable on Sustainable Palm Oil (RSPO)Oil palm concession https://rspo.org/members/georspo
8Global Land Analysis & Discovery (GLAD) Tree cover change datahttps://data.globalforestwatch.org/datasets/tree-cover-loss-hansen-umd-google-usgs-nasa
B = band.
Table 2. LULC classification scheme.
LULC ClassLULC Description
Oil PalmThis class includes all small- and large-scale oil palm plantations
ForestThis class includes natural forest cover, permanent forest estate, national/state land forest, totally protected forest, wildlife sanctuaries, secondary forests, sparsely vegetated forests, i.e., shrubs and grass.
PeatlandThis class corresponds to peat swamp forest and wetland.
Water This class corresponds to a water body including rivers, lakes, and ponds.
Built-up areasThis class includes settlement, bare land, industrial zones, and commercial development.
AgricultureThis class covers all types of commercial crops and commodities besides oil palm such as rubber, cocoa, and paddy.
Table 3. Sarawak land use classification accuracy assessment.
Support Vector Machine Classification Accuracy (%)
Class19902018
UAPAOECEUAPAOECE
Oil Palm85.4088.7311.2714.6099.4299.130.870.58
Forest97.4096.503.502.6092.6392.867.147.37
Peatland69.3563.2736.7530.6593.8294.195.816.18
Water100.00100.000.000.00100.00100.000.000.00
Built-up Areas95.0996.233.774.9199.96100.000.000.04
Agriculture74.7857.7242.2825.2297.5197.512.492.49
Overall Accuracy90.1397.75
Kappa Coefficients86.48 (0.86)97.07 (0.97)
Note: UA = user accuracy; PA = producer accuracy; OE = omission error; CE = commission error.
Table 4. Sabah land-use classification accuracy assessment.
Support Vector Machine Classification Accuracy (%)
Class19902018
UAPAOECEUAPAOECE
Oil Palm87.1995.524.4812.8197.9697.042.962.04
Forest85.2881.0418.9614.72979398.491.512.07
Peatland83.1451.7848.2216.8696.5896.013.993.42
Water100.0088.5411.460.00100.0098.441.560.00
Built-up Areas88.1880.4719.5311.82100.00100.000.000.00
Agriculture83.8754.1745.8316.1380.9386.0713.9319.07
Overall Accuracy86.5797.40
Kappa Coefficients76.75 (0.77)95.81 (0.96)
Note: UA = user accuracy; PA = producer accuracy; OE = omission error; CE = commission error.
Table 5. Amount of forest cover in Sarawak (1990 and 2018).
Type of ForestArea (ha)Forest Cover Change
(1990–2018) (ha)
Forest Change
(1990–2018) (%)
Year 1990Year 2018
Forest9,459,020.728,270,100.691,188,920.03−12.57
Peatland1,657,120.211,317,969.07339,151.14−20.47
Table 6. Amount of forest cover in Sabah (1990 and 2018).
Type of ForestArea (ha)Forest Cover Change (1990–2018) (ha)Forest Change
(1990–2018) (%)
Year 1990Year 2018
Forest5,605,943.364,689,768.39916,174.97−16.34
Peatland162,573.80131,594.8130,978.99−19.06
Table 7. Amount of oil palm cover in Sarawak (1990 and 2018).
YearOil PalmOil Palm on
Forest
Oil Palm on PeatlandOil Palm on Other
Land Use
Agriculture Land
(ha)%(ha)%(ha)%
1990366,799.43635.600.2197,323.4754168,840.3646
20181,924,619.85276,455.9414657,273.0234990,890.8951
Oil Palm Cover Change (ha)1,557,820.42275,820.3418459,949.5530822,050.5353
Oil Palm Cover Change (%)8199.8-70-83-
Table 8. Amount of oil palm cover in Sabah (1990 and 2018).
YearOil PalmOil Palm on
Forest
Oil Palm on PeatlandOil Palm on Other
Land Use
Agriculture Land
(ha)%(ha)%(ha)%
1990695,523.84172,956.34255321.011517,246.4974
20182,012,742.22276,430.841435,626.9021,700,684.4884
Oil Palm Cover Change (ha)1,317,218.38103,474.5830,305.8921,183,437.9990
Oil Palm Cover Change (%)6537-85-70-
Table 9. Estimated peat soil oil palm plantation annual carbon-CO2 emissions in Sarawak and Sabah, Malaysia.
StatesArea (ha),
Year 2018
Flux, t CO2-C ha−1 yr−1Estimated Annual Carbon Emissions,
Gt CO2-C yr−1
Sarawak657,273.0224 *0.01577
Sabah35,626.900.00086
Total692,899.92 0.01663
* Estimated flux rate from [46].
Table 10. Estimated oil palm plantation on forest annual carbon-CO2 uptake in Sarawak and Sabah, Malaysia.
StatesArea (ha),
Year 2018
Flux, t CO2-C ha−1 yr−1Estimated Annual Carbon Uptake,
Gt CO2-C yr−1
Sarawak276,455.9482 *0.02267
Sabah276,430.840.02267
Total552,886.78 0.04533
* Estimated uptake rate from [47].
Table 11. Estimated forest annual carbon-CO2 uptake in Sarawak and Sabah, Malaysia.
StatesArea (ha),
Year 2018
Flux, t CO2-C ha−1 yr−1Estimated Annual Carbon Uptake,
Gt CO2-C yr−1
Sarawak8,270,100.6932 *0.26464
Sabah4,689,768.390.15007
Total12,959,869.08 0.41471
* Estimated uptake rate from [47].
Table 12. Oil palm planted area in 2018 in Sabah and Sarawak.
RegionTotal Planted Oil Palm (ha) (Satellite Image Interpretation)Statistics Reported from [51] Statistics Reported from [52]% Difference
Sabah2.01 million1.55 million1.57 million+22%
Sarawak1.92 million1.57 million1.55 million+18%
Publisher’s Note: MDPI stays neutral with regard to jurisdictional claims in published maps and institutional affiliations.

